

Introduction
The barrier function of the skin is mainly assured by its outermost layer, the stratum corneum (SC), which is composed of anucleated dead epidermal cells (corneocytes), embedded in a continuous multilamellar lipid matrix (Scheuplein and Blank, Reference Scheuplein and Blank1971). The extracellular SC lipids constitute the only continuous route for molecular transport through the SC, and consequently play a key role for the skin barrier function (Potts and Francoeur, Reference Potts and Francoeur1990; van Smeden et al., Reference Van Smeden2014b; Björklund et al., Reference Björklund2016; Pham et al., Reference Pham2016). The SC lipids mainly comprise ceramides (CERs), free fatty acids (FFAs), and cholesterol (CHOL) in nearly equimolar proportions (Schaefer, Reference Schaefer, Redelmeier, Schaefer and Redelmeier1996). Most of the SC lipids have fully saturated acyl chains with lengths from 16 to 24 carbons (Ponec et al., Reference Ponec2003), forming solid lamellar phases with either orthorhombic or hexagonal chain packing at ambient temperatures (Ongpipattanakul et al., Reference Ongpipattanakul, Francoeur and Potts1994; Bouwstra et al., Reference Bouwstra1995; Bouwstra and Ponec, Reference Bouwstra and Ponec2006). In addition to the solid SC lipids, studies of both intact SC and SC model lipid systems have indicated the presence of a small pool of fluid lipids (Bouwstra et al., Reference Bouwstra2001; Chen et al., Reference Chen2007; Silva et al., Reference Silva2007; Brief et al., Reference Brief2009; Janssens et al., Reference Janssens, Gooris and Bouwstra2009; Engelbrecht et al., Reference Engelbrecht2012; Björklund et al., Reference Björklund2013; Björklund et al., Reference Björklund2014; Stahlberg et al., Reference Stahlberg2015; Björklund et al., Reference Björklund2016; Pham et al., Reference Pham2016; Stahlberg et al., Reference Stahlberg2016; Eichner et al., Reference Eichner2017; Pham et al., Reference Pham, Topgaard and Sparr2017; Schroeter et al., Reference Schroeter2017), the amount of which depending on temperature and hydration, as well as the concentration of small molecules that penetrate the SC (Gay et al., Reference Gay1994; Alonso et al., Reference Alonso1996; Bouwstra et al., Reference Bouwstra2001; Chen et al., Reference Chen2007; Silva et al., Reference Silva2007; Brief et al., Reference Brief2009; Janssens et al., Reference Janssens, Gooris and Bouwstra2009; Engelbrecht et al., Reference Engelbrecht2012; Björklund et al., Reference Björklund2013; Björklund et al., Reference Björklund2014; Stahlberg et al., Reference Stahlberg2015; Björklund et al., Reference Björklund2016; Pham et al., Reference Pham2016; Stahlberg et al., Reference Stahlberg2016; Pham et al., Reference Pham, Topgaard and Sparr2017; Schroeter et al., Reference Schroeter2017). Despite their importance for the macroscopic material properties of the SC, including barrier function (Alonso et al., Reference Alonso1996; Björklund et al., Reference Björklund2010; Pham et al., Reference Pham2016), a detailed molecular characterization of the fluid SC lipids is still lacking. Scattering, diffraction and electron microscopy techniques give a wealth of information about the solid crystalline lipids (Wertz et al., Reference Wertz1987; Ongpipattanakul et al., Reference Ongpipattanakul, Francoeur and Potts1994; Bouwstra et al., Reference Bouwstra1995; Bouwstra and Ponec, Reference Bouwstra and Ponec2006; Iwai et al., Reference Iwai2012), but are less useful for investigating the minor amount of fluid and disordered components within the crystalline matrix. We have previously performed polarization transfer solid-state nuclear magnetic resonance (PT ssNMR) (Nowacka et al., Reference Nowacka2010) experiments on intact SC, confirming the co-existence of fluid and solid lipids (Björklund et al., Reference Björklund2013). Remarkably, rather than forming anisotropic structures resembling the liquid crystalline bilayer phases found in many other biological membranes, the fluid SC lipids appear to undergo isotropic reorientation (Chen et al., Reference Chen2007; Silva et al., Reference Silva2007; Brief et al., Reference Brief2009; Engelbrecht et al., Reference Engelbrecht2012; Björklund et al., Reference Björklund2013; Björklund et al., Reference Björklund2014; Stahlberg et al., Reference Stahlberg2015; Björklund et al., Reference Björklund2016; Pham et al., Reference Pham2016; Stahlberg et al., Reference Stahlberg2016; Eichner et al., Reference Eichner2017; Paz Ramos et al., Reference Paz Ramos2017; Pham et al., Reference Pham, Topgaard and Sparr2017; Schroeter et al., Reference Schroeter2017). These observations open up for new unresolved questions regarding the molecular properties of the isotropic fluid SC lipids in terms of structure, chemical composition, and molecular dynamics, and these questions form the goal of the present paper.
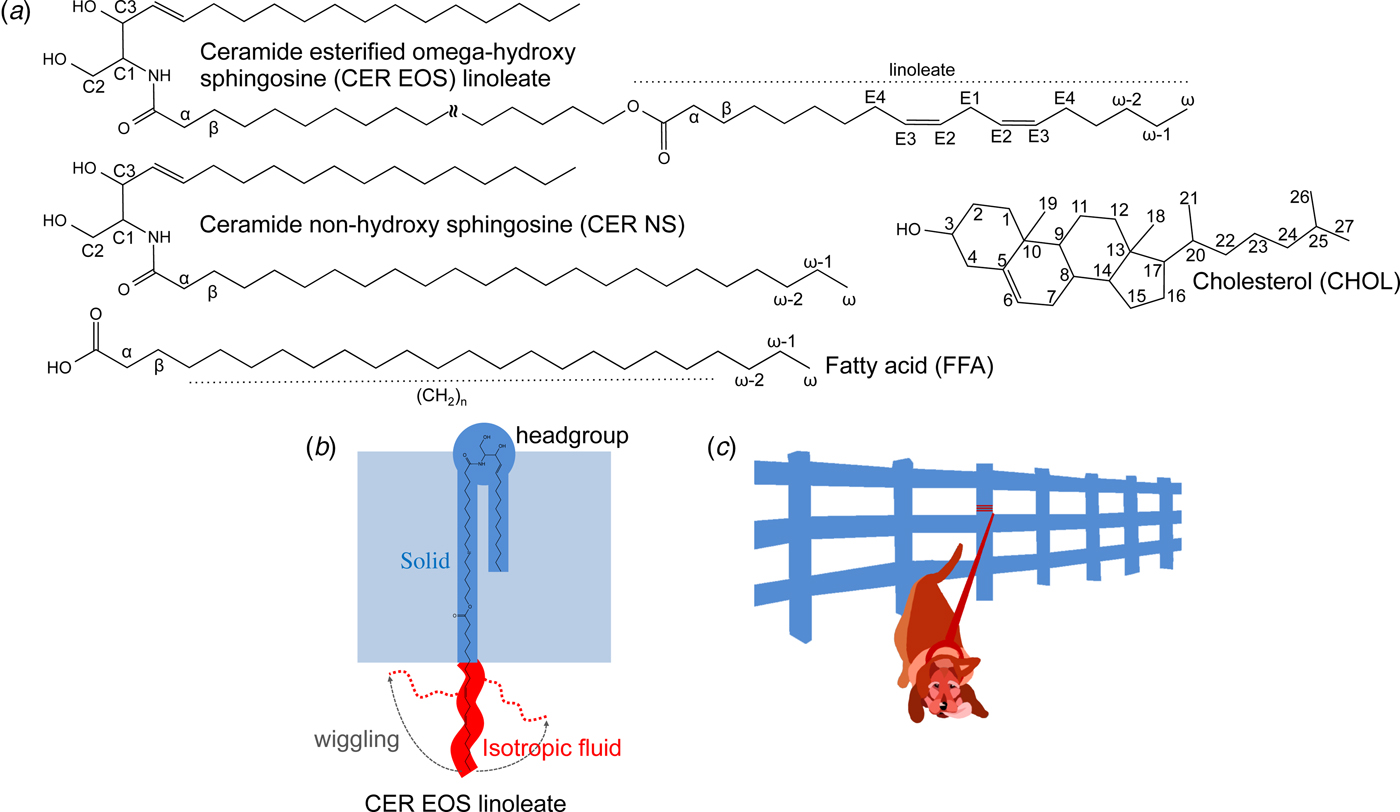
We employ a combination of solid-state and diffusion NMR techniques to characterize the composition and molecular dynamics of the fluid lipid fraction in SC model lipid systems at the physiologically relevant temperature 32 °C and relative humidity (RH) 99.5% D2O. As summarized in Table 1, we use lipid samples with an equimolar mixture of CERs, CHOL, and FFAs to study the effects of partially replacing CER non-hydroxy sphingosine (NS) with CER EOS (esterified omega-hydroxy acyl chain linked to sphingosine) linoleate (Fig. 1a). Previous scattering studies have demonstrated that the SC lipids are arranged in two lamellar structures with repeat distances of ca 13 and 6 nm (Bouwstra et al., Reference Bouwstra1991; Bouwstra et al., Reference Bouwstra1995; Moore et al., Reference Moore, Rerek and Mendelsohn1997), often referred to as the long and short periodicity phases (LPP and SPP). The present model system was chosen as it forms a single LPP phase, which is promoted by the CER EOS class of molecules (Bouwstra et al., Reference Bouwstra2001; Bouwstra et al., Reference Bouwstra2002; de Sousa Neto et al., Reference De Sousa Neto, Gooris and Bouwstra2011). The CER EOS lipids have also shown strong influences on the SC barrier function (de Jager et al., Reference De Jager2006), and they occur at reduced levels in several skin pathologies such as psoriasis, atopic eczema, and Netherthon syndrome (Motta et al., Reference Motta1993; Motta et al., Reference Motta1995; Janssens et al., Reference Janssens2012; van Smeden et al., Reference Van Smeden2014a). The FFAs comprise a distribution of acyl chain lengths mimicking the composition of the SC. The CER component of the reference (REF) sample consists of pure CER NS, while the EOS sample contains a mixture of 40 mol% CER EOS linoleate and 60 mol% CER NS. It should be noted that the only difference between the two samples is the presence (EOS) or absence (REF) of the linoleate moiety. The small-angle X-ray diffraction (SAXD) data in Fig. S1 confirms the formation of an LPP and a co-existing fraction of crystalline cholesterol for the EOS sample (Bouwstra et al., Reference Bouwstra2001; Bouwstra et al., Reference Bouwstra2002; de Sousa Neto et al., Reference De Sousa Neto, Gooris and Bouwstra2011). We use wideline static 1H NMR to detect fluid lipids within the mainly solid samples, and a combination of PT ssNMR, 1H-13C Heteronuclear Correlation (HETCOR), and 1H magic angle spinning (MAS) NMR to estimate the chemical composition of the fluid lipid fraction. More detailed information about the rotational and translational diffusion of the fluid fraction is obtained from PT ssNMR and Pulsed Field Gradient Stimulated Echo (PFG STE) (Tanner, Reference Tanner1970) experiments, respectively. We characterize molecular dynamics with atomic resolution of unlabelled lipids in SC LPP, providing direct evidence on the co-existence of solid and isotropic mobile segments within the very same CER EOS linoleate molecule in the LPP (Fig. 1b). In addition, we measure an extraordinarily slow self-diffusion of the anchored linoleate. From the combined findings, we can demonstrate a remarkable self-assembly structure with solid-fluid coexistence within the very same molecules within the LPP. The formation of such intriguing structure is likely associated with important biological SC functions.
(a) Chemical structures with numbered segments of the investigated SC lipids, i.e., ceramide (illustrated here with ceramide esterified omega-hydroxy sphingosine (CER EOS) linoleate and ceramide non-hydroxy sphingosine (CER NS)), fatty acid (FFA) and cholesterol (CHOL). (b) Schematic illustration of molecular dynamics and anisotropy of CER EOS linoleate in a lamellar structure, as well as the position of the CER EOS in the solid lamellar structure with the headgroup in the interfacial layer. Solid and isotropic fluid segments are shown in blue and red, respectively. (c) Cartoon of a leashed dog tethered to a fence to illustrate the dynamics in the CER EOS linoleate moiety. The leash and the dog represent the isotropic fluid segment while the fence illustrates the remaining solid part of the molecule anchored in the solid LPP phase.
Composition of lipid mixtures (ceramide esterified omega-hydroxy sphingosine (CER EOS) linoleate, ceramide non-hydroxy sphingosine (CER NS), cholesterol (CHOL) and fatty acid (FFA)) in mol % in reference (REF) and EOS samples

Results
EOS induces a fraction of isotropic fluid acyl chains in SC model lipid mixture at ambient temperature
The wideline 1H NMR spectra in Fig. 2 features a superposition of broad and sharp peaks, which are often described as ‘rigid’ and ‘mobile’ components in the solid-state NMR literature (Schmidt-Rohr et al., Reference Schmidt-Rohr, Clauss and Spiess1992). In the absence of molecular motion, the widths of the 1H resonance lines are approximately 50 kHz, corresponding to the static dipolar interactions between neighboring 1H nuclei in an organic solid (Levitt, Reference Levitt2001). The linewidths are reduced by molecular motion on time-scales shorter than the inverse of the static dipolar couplings, i.e., on the order of tens of μs for 1H pairs in CH2 segments. The relative areas of the broad and sharp peaks show that the EOS sample has a larger fraction of mobile components. The two sharp peaks observed for the REF sample are located at chemical shifts corresponding to water and methylene groups in a hydrocarbon chain (Fig. 2, inset). The HDO peak at ca 4.8 ppm originates from residual protons in the D2O and labile protons in the hydroxyl and carboxyl functional groups of the lipids, and its area cannot be easily related to the amount of water in the samples. The HDO peak is not resolved for the EOS sample because of the larger number of mobile components at varying chemical shifts. The spectra of both samples are too broad to resolve individual peaks from different mobile parts of the lipids.
Wideline 1H NMR spectra acquired at 200 MHz 1H frequency and non-spinning conditions for the EOS and REF samples equilibrated at 32 °C and 99.5% RH D2O. The spectral intensities are scaled to the same spectral area. Inset: spectral region of the mobile peaks with spectral intensities scaled to the same maximum. The HDO peak originates from residual protons in the D2O and exchanged protons from the lipids.

More detailed assignment of the rigid and mobile components is obtained by PT ssNMR (Nowacka et al., Reference Nowacka2013) (Fig. 3), wherein high-resolution 13C spectra acquired under MAS and 1H decoupling give chemical specificity and the signal intensities obtained with the direct polarization (DP), cross polarization (CP) (Pines et al., Reference Pines, Gibby and Waugh1972), and insensitive nuclei enhanced by polarization transfer (INEPT) (Morris and Freeman, Reference Morris and Freeman1979) schemes yield information about the rate and anisotropy of C-H bond reorientation as quantified by the correlation time τ c and order parameter |S CH| (Nowacka et al., Reference Nowacka2013; Schmidt et al., Reference Schmidt2014) (Fig. S2). |S CH| ranges from 1 for ordered and rigid segments to 0 for segments with isotropic reorientation. It is noted that due to the nonlinear response in INEPT and CP signals to changes in molecular dynamics and anisotropy (Fig. S2), these signals are not quantitative. The PT ssNMR data for the REF sample in Fig. 3a and Fig. S3a show intense and sharp CP resonance lines and negligible INEPT signals, consistent with a solid crystalline phase (Nowacka et al., Reference Nowacka2010) where all C-H bond reorientation is slow and/or highly anisotropic (approximate limits τ c > 100 ns and/or |S CH| > 0.3 according to Fig. S4a). An all-trans conformation of the methylene segments in the middle of the hydrocarbon chains can be inferred from the 33 ppm shift of the acyl chain CP peak (Earl and VanderHart, Reference Earl and Vanderhart1979). As shown in Fig. 3b and S3b, the PT ssNMR data for the EOS sample lack several of the sharp CP peaks, implying conformational or packing disorder of the solid phase. The acyl chain segments E1, E2, E3, E4, (CH2)n, (ω-2)CH2, (ω-1)CH2, and ωCH3, are detected in the INEPT spectrum, indicating fast (τ c < 10 ns) C-H bond reorientation for all of these segments. The (CH2)n INEPT peak occurs at a chemical shift of 30 ppm (left inset in Fig. 3b), showing that the acyl chains have a distribution of trans- and gauche conformations similar to that observed for liquid hydrocarbons (Earl and VanderHart, Reference Earl and Vanderhart1979). In conventional lipid membranes, most acyl chain segments undergo reorientation that is both fast and moderately anisotropic (0.05 < |S CH| < 0.2) (Ferreira et al., Reference Ferreira2013; Pham et al., Reference Pham, Topgaard and Sparr2015), which gives rise to a characteristic signature in the PT ssNMR data with INEPT and CP peaks having identical chemical shifts and lineshapes (Nowacka et al., Reference Nowacka2013). The absence of CP peaks with the same characteristics as the INEPT ones in Fig. 3b shows that the reorientation of these segments is not only fast but also nearly isotropic. The signal-to-noise ratios of the INEPT peaks in Fig. 3b are converted to upper bounds on the |S CH|-values as described in Fig. S4b and summarized in Table 2. Although anisotropy up to approximately |S CH| = 0.05 is beyond detection at the signal-to-noise ratios of the INEPT spectrum in Fig. 3b, the |S CH|-values in Table 2 are far below the ones expected for conventional lipid membranes and we will for brevity describe these segments as ‘isotropic fluid’. It should be noted that this term infers τ c < 30 ns, which is about three orders of magnitude faster than the <10 µs time-scale required for observing mobile components in wideline 1H NMR. The spectra in Fig. 3b confirm the presence of a small but readily detectable fraction of isotropic fluid lipid segments in the EOS sample, which is in clear contrast to the REF sample in Fig. 3a. Still, the main part of the EOS sample is a solid lipid structure with lamellar symmetry according to the literature (Bouwstra et al., Reference Bouwstra2001; Bouwstra et al., Reference Bouwstra2002; de Sousa Neto et al., Reference De Sousa Neto, Gooris and Bouwstra2011) and the SAXD data in Fig. S1.
13C MAS NMR spectra (DP: grey, CP: blue, INEPT: red) acquired at 125 MHz 13C frequency, 5 kHz MAS, and 68 kHz TPPM 1H decoupling for the REF (a) and the EOS (b) samples equilibrated at 32 °C and 99.5% RH D2O. The insets show magnified spectra (left) and the spectral region of C = C segments (right) with the same magnification for both samples. Peak assignments refer to the carbon labeling in Fig. 1a. ‘TG’ denotes a liquid-like distribution of trans- and gauche acyl chain conformers. The green dotted lines indicate the chemical shifts of INEPT peaks, which are only detected in the EOS sample.

INEPT signal-to-noise ratios (SNR) and upper bounds on the C-H bond orientational order parameters |SCH| of the EOS segments resolved in Fig. 3b. The estimation of |SCH| from SNR is described in Fig. S4b

The composition of the isotropic fluid lipid fraction in the EOS sample is further characterized with 1H-13C HETCOR using INEPT as a polarization transfer step. This experiment gives two-dimensional correlations between the chemical shifts of covalently bonded 1H and 13C nuclei in fluid segments. The HETCOR experiments were not performed for the REF sample as it does not give rise to any INEPT signal (Fig. 3a). The data in Fig. 4a show peaks from the segments in the middle and the terminal of the acyl chains, i.e. (CH2)n, (ω-2)CH2, (ω-1)CH2, and ωCH3, as well as the conjugated C = C double bonds of CER EOS linoleate (E1−E4). We note that this experiment cannot distinguish chemically identical segments in linoleate and other acyl chains, but the mobility of the E1–E4 segments, which are unique for the linoleate, unambiguously show that the double bonds in the middle part of the linoleate chains are isotropic fluid. Consequently, the (CH2)n, (ω-2)CH2, (ω-1)CH2, and ωCH3 peaks most likely also originate from linoleate rather than other hydrocarbon chains. The EOS sample used for the HETCOR was fully hydrated to ensure high mobility and highest possible signal-to-noise ratio. The assignment of the composition of the isotropic fluid lipid fraction is still valid for the EOS sample equilibrated at 99.5% RH D2O since the 13C and 1H signals observed in the PT ssNMR spectra (Fig. 3b) and 1H MAS NMR spectrum (Fig. 4b) of this sample are also detected in the HETCOR spectrum. While the terminal segments are readily detected, there are no signals from the segments closest to the lipid headgroups and the carboxyl groups (αCH2 and βCH2) in the HETCOR and INEPT spectra, implying that these parts of the linoleate chains undergo slower reorientation. From the HETCOR and 1H MAS spectra in Fig. 4, we can assign the unresolved mobile components of the wideline 1H spectrum of the EOS sample (inset in Fig. 2) to the E2 and E3 segments of linoleate (ca 5.3 ppm in the 1H MAS spectrum), methyl and methylene groups in hydrocarbon chains, as well as HDO.
HETCOR data for the fully hydrated EOS sample at 32 °C and diffusion data for the EOS and REF samples equilibrated at 32 °C and 99.5% RH D2O. (a) Two-dimensional 1H-13C INEPT HETCOR spectrum of the EOS sample acquired 125 MHz 13C frequency, 5 kHz MAS, and 68 kHz TPPM 1H decoupling. Black traces show the projections of the two-dimensional spectrum onto the 1H and 13C axes. The one-dimensional 13C INEPT spectrum (red) from Fig. 3b is included for comparison. (b) 1H NMR spectra of the REF (blue) and EOS (red) samples recorded with different experiments: under MAS and static conditions after a 90° pulse and from PFG STE diffusion experiments at different b-values (b 1 = 2.9·106, b 2 = 8.5·1010 and b 3 = 1.1·1013 sm−2). (c) Normalized 1H peak area versus diffusion weighting b in the PFG STE diffusion experiment for the REF (blue circles) and EOS (red crosses) samples. The peak areas are normalized against the maximum measured area for each sample and data points below the noise level are removed. The red line represents a biexponential fit of Eq. (1) to the EOS data, giving diffusivities of (1.0 ± 0.4)·10−9 and (4 ± 1)·10−14 m2 s−1. The arrows labeled b 1, b 2, and b 3 indicate the b-values for the PFG STE spectra in (b).

The double bonds of CER EOS linoleate diffuse very slowly
Information about the micrometer scale structure of the isotropic fluid phase is obtained from diffusion NMR experiments monitoring translational motion on the 100 ms time scale and 1–10 µm length scale. The self-diffusion coefficient D of different segments is measured by following the decay of their 1H signals as a function of the diffusion weighting variable b defined in Eq. (2) in the Materials and Methods section below (Price, Reference Price2009; Callaghan, Reference Callaghan2011). The clearly bimodal signal decay for the EOS sample (Fig. 4c) shows the existence of at least two distinct components with different values of D. Although the resonances of the HDO and the linoleate unsaturated segments (E2, E3) in the EOS sample cannot be resolved in the broad 1H spectra (Fig. 4b), the 1H chemical shifts at different b-values indicate that the ‘fast’ and ‘slow’ components originate from HDO and linoleate, respectively. The diffusivities of these components are analyzed by fitting a biexponential function to the signal decay. The HDO diffusivity (1.0 ± 0.4)·10−9 m2 s−1 is comparable with other lamellar phases (Volke et al., Reference Volke1994) while the linoleate diffusivity (4 ± 1)·10−14 m2 s−1 is several orders of magnitude lower than for fluid lipid bilayer systems (Lindblom and Wennerström, Reference Lindblom and Wennerström1977) and neat hydrocarbons (Holz et al., Reference Holz, Heil and Sacco2000), and is even too slow to be accurately quantified within the experimentally accessible range of b-values. The REF sample yields only one fraction (Fig. 4b and c) with chemical shift and diffusivity corresponding to HDO. Although detailed analysis of the HDO diffusion data is beyond the scope of this study, we note that it is not truly monoexponential, but rather given by a distribution of effective diffusivities resulting from the diffusion anisotropy within a lamellar domain and the distribution of lamellae orientations in the studied sample (Lindblom et al., Reference Lindblom, Wennerstrom and Arvidson1977; Topgaard, Reference Topgaard and Valiullin2017).
Discussion
From the combined SAXD and NMR observations that the EOS sample is a mainly solid LPP structure where the middle and terminal segments of the linoleate chains undergo fast isotropic reorientation and exhibit translational diffusion that is orders of magnitude slower than for fluid lipid bilayers, we arrive at the model illustrated in Fig. 1b and c, showing a single CER EOS linoleate molecule with both solid and isotropic fluid hydrocarbon chains. The linoleate chains constitute the isotropic fluid component whose micrometer-scale translational diffusion is prevented by being covalently attached to the remaining solid part of the molecule, which in turn is anchored at the lamellar interface of the mostly solid LPP. A less dense packing at the end of CER EOS linoleate or in the middle of the lipid layer would allow an isotropic reorientation. This model is consistent with previous infrared spectroscopy and neutron diffraction data (Janssens et al., Reference Janssens, Gooris and Bouwstra2009; Mojumdar et al., Reference Mojumdar2016), indicating that the end of the linoleate chain is conformationally disordered and can fold back towards the hydrophilic headgroup region of the lamellar structure. It should be noted that the structure suggested here is very different from other systems with coexisting solid and fluid lipids phases, for instance the macroscopic lipid droplets formed by partially melting or adding hydrophobic chemicals to the SC (Ongpipattanakul et al., Reference Ongpipattanakul1991; Naik et al., Reference Naik1995; Tanojo et al., Reference Tanojo1997; Pilgram et al., Reference Pilgram2001; Chen et al., Reference Chen2007), or biomembranes with lateral phase separation into anisotropic fluid and solid domains (Simons and Ikonen, Reference Simons and Ikonen1997; Bagatolli, Reference Bagatolli2006; Ferreira et al., Reference Ferreira2013; Pham et al., Reference Pham, Topgaard and Sparr2015).
Combining previous results that the unsaturated chains of CER EOS are necessary for the formation of the LPP (Bouwstra et al., Reference Bouwstra2001; Bouwstra et al., Reference Bouwstra2002; de Sousa Neto et al., Reference De Sousa Neto, Gooris and Bouwstra2011) with our new data showing that these chains are fluid, we conclude that the isotropic fluid chains are an integral and essential part of the LPP structure. Further characterization of this well-defined SC model lipid mixture could provide even deeper molecular insight into SC structures and physiology. While the linoleate chains are fluid already at physiological conditions, heating (Björklund et al., Reference Björklund2013; Paz Ramos et al., Reference Paz Ramos2017) or adding certain chemicals, e.g. humectants or penetration enhancers in skin formulations (Björklund et al., Reference Björklund2014; Pham et al., Reference Pham2016; Eichner et al., Reference Eichner2017; Pham et al., Reference Pham, Topgaard and Sparr2017), will further fluidize the SC lipids and influence the barrier properties of the skin (Carruthers and Melchior, Reference Carruthers and Melchior1983). The long acyl chains of CER EOS would lead to strong van der Waals interactions between the chains, favoring lipid layers with low permeability and high rigidity. On the other hand, the presence of a fluid region in the CER EOS-containing LPP structure will lead to lower effective permeability compared with completely solid structures (Alonso et al., Reference Alonso1996). The presence of fluid segments may also influence mechanical properties and SC elasticity. The delicate and balancing effects of CER EOS linoleate on the self-assembly and organization of the SC lipids are relevant not only for understanding the properties of healthy skin, but also for rationalizing the impaired barrier function in skin diseases where the level of CER EOS is drastically reduced (Motta et al., Reference Motta1993; Motta et al., Reference Motta1995; Janssens et al., Reference Janssens2012; van Smeden et al., Reference Van Smeden2014a; Reference Van Smeden2014b).
Isotropic fluid lipids have previously been demonstrated also for intact SC, both in the absence and presence of other molecules like penetration enhancers, solvents, and humectants (Björklund et al., Reference Björklund2013; Björklund et al., Reference Björklund2014; Björklund et al., Reference Björklund2016; Pham et al., Reference Pham2016; Pham et al., Reference Pham, Topgaard and Sparr2017). However, it is difficult to localize these fluid lipids in the complex system of intact SC, thus motivating the use of simplified model systems mimicking closely the lipid organization in the complex system. We have characterized a single LPP phase and resolved solid and fluid segments in the linoleate chain of CER EOS linoleate, which is an essential lipid in the human SC (Bouwstra et al., Reference Bouwstra2001; Bouwstra et al., Reference Bouwstra2002; de Sousa Neto et al., Reference De Sousa Neto, Gooris and Bouwstra2011). The isotropic fluid segments are located in the middle and terminal parts of the linoleate chains while the segments closest the carboxyl groups are solid. The results of isotropic reorientation in the CER EOS chain are consistent with recent findings for the LPP phase with CER EOS oleate (Paz Ramos et al., Reference Paz Ramos2017), although there is a major difference in that when exchanging linoleate to oleate the whole oleate chain becomes fluid. In addition, the information about the remaining unlabelled part of CER EOS oleate was not obtained. Others studies have shown the presence of isotropic lipids in SC SPP model lipid mixtures (Chen et al., Reference Chen2007; Brief et al., Reference Brief2009; Stahlberg et al., Reference Stahlberg2015; Stahlberg et al., Reference Stahlberg2016; Schroeter et al., Reference Schroeter2017) or in a SC LPP lipid mixture containing isopropyl myristate (Eichner et al., Reference Eichner2017) which induces and changes the composition of the fluid lipid phase. However, in these studies, the isotropic phase has been interpreted as a segregated phase. The aforementioned studies showing isotropic lipids in SC model lipid mixtures have employed 2H NMR to determine order parameters S CD of deuterated segments, without being able to assign the information on molecular dynamics to specific molecular sites. An advantage of our 1H-13C approach compared with 2H NMR is that it is possible to resolve the molecular dynamics at an atomic level for the whole molecule without the need of selective labeling.
Conclusions
Through a combination of NMR methods, we have characterized the small amount of isotropic fluid lipids in the SC model lipid system containing CER EOS linoleate. From SAXD measurements, we conclude that the lipids are assembled in the LPP phase, and the NMR experiments demonstrate solid and isotropic fluid hydrocarbon chains within the same CER EOS molecule. The CER EOS headgroup region is rigid and anchored in the lamellar interface of the mostly solid LPP structure, and the isotropic fluid middle and terminal segments of the linoleate chains in the same CER EOS molecule show extraordinarily slow translational diffusion. This unusual self-assembly in SC lipids can have a strong impact on the macroscopic properties of SC including barrier function.
Materials and methods
Materials
The following synthetic CERs were used in our studies: the ester-linked omega-hydroxy acyl chain (abbreviation EO, 30 carbons in the acyl chain denoted by C30) with a sphingosine chain (abbreviation S, C18) referred to as CER EOS, a non-hydroxy acyl chain (abbreviation N, C24) linked to a sphingosine base (C18) referred to as CER NS. The number between parentheses indicates the number of carbon atoms present in the acyl chain of the CERs. The CERs were kindly provided by Evonik (Essen, Germany). CHOL and the various FFAs including palmitic acid (C16:0), stearic acid (C18:0), arachidic acid (C20:0), behenic acid (C22:0) and lignoceric acid (C24:0) are obtained from Sigma-Aldrich Chemie GmbH (Schnelldorf, Germany). All solvents were of analytical grade and supplied by Labscan (Dublin, Ireland). Deuterated water (99.8 atom % D) was purchased from Armar Chemicals.
Sample preparation
The model lipid membranes were prepared from synthetic CERs, CHOL and FFAs in an equimolar ratio. The FFA mixture (FFAmix) was composed of fatty acids with chain lengths of C16:0, C18:0, C20:0, C22:0 and C24:0 in a molar ratio of 1.8:4.0:7.6:47.8:38.9 respectively, mimicking the composition in SC. Two different model systems with an equimolar mixture of CERs, CHOL, and FFAs referred to as REF and EOS samples were investigated. The only difference between the two samples is the composition of the CERs. The CER component of the REF sample consists of pure CER NS, while the EOS sample contains a mixture of 40 mol% CER EOS linoleate and 60 mol% CER NS (Table 1). The lipids were dissolved in chloroform/methanol (2:1, v/v) and sprayed on top of glass slides. After spraying, the samples were equilibrated under a stream of dry nitrogen for about 10 min at around 80 °C close to the melting temperature of the mixture. The samples were gradually cooled to room temperature. Subsequently, the thin layers of the lipid mixtures were fully hydrated from water vapor in a desiccator containing deuterated water at 32 °C for 2 days. The hydrated samples were then loaded into rotor inserts to be fitted into standard Bruker 4 mm rotors and used for HETCOR experiment. These samples were later dried under vacuum for 2 days and rehydrated again at 32 °C in a chamber of 99.5% RH regulated by an aqueous solution with dissolved NaCl at 0.16 mol/kg in D2O for 2 days (Colin et al., Reference Colin, Clarke and Glew1985). This rehydration reduces excess amount of water due to e.g. condensation and facilitates observation of other lipid segments in 1H spectra. Wideline static 1H NMR, 1H MAS NMR, PT ssNMR and PFG STE experiments were performed using these samples. For static NMR experiments, the rotors were put into 5 mm NMR tubes.
Nuclear magnetic resonance
Solid-state NMR experiments were performed on a Bruker Avance II – 500 MHz NMR spectrometer equipped with a Bruker E-free 4 mm MAS probe or on a Bruker Avance III – 500 MHz NMR spectrometer equipped with a 4 mm CP/MAS HX probe, and were carried out at a spinning frequency of 5 kHz. The CP (Pines et al., Reference Pines, Gibby and Waugh1972) and INEPT (Morris and Freeman, Reference Morris and Freeman1979) schemes for 1H-13C polarization transfer are commonly used to enhance the 13C signal in solid and fluid state NMR, respectively. DP signal is used as a reference. In PT ssNMR experiments, the following set-up were used: spectral width of 248.5 ppm, the acquisition time of 0.05 s, 2048 scans per experiment, recycle delay of 5 s, and 1H and 13C hard pulse at a nutation frequency of 80.6 kHz. The 1H nutation frequency was ramped up from 72 to 88 kHz during the contact time of 1 ms in CP experiment. The INEPT experiments were performed with the delay times τ of 1.8 ms and τ′ of 1.2 ms. All experiments were recorded under 68 kHz two-pulse phase modulation (TPPM) 1H decoupling (Bennett et al., Reference Bennett1995). A conventional HETCOR experiment, using an INEPT polarization transfer, was used to obtain the 1H–13C correlations with a similar setup as in the 13C INEPT experiment. A total of 128 increments with a dwell time of 30 µs and 64 scans were recorded. The 13C spectra were externally referenced to the methylene signal of solid α-glycine at 43.7 ppm (Hayashi and Hayamizu, Reference Hayashi and Hayamizu1991). The temperature was calibrated by methanol (Vangeet, Reference Vangeet1970). The data were processed with a line broadening of 20 Hz, zero-filling from 1024 to 8192 time-domain points, Fourier transform, phase and baseline correction by in-house Matlab code partially from matNMR (van Beek, Reference Van Beek2007).
Self-diffusion 1H NMR and wideline 1H NMR measurements were performed on a Bruker Avance II – 200 MHz NMR spectrometer equipped with a Bruker DIF-25 gradient probe capable of delivering gradients of strength G 9.6 T/m in the z-direction. Free induction decays (FIDs) of wideline 1H NMR measurements were recorded after a 6 µs 90° pulse using a spectral width of 815 ppm, an acquisition time of 0.05 s, 8 scans per experiment, a recycle delay of 5 s, and a receiver dead time of 4.5 µs. The FIDs were Fourier transformed with a line broadening of 100 Hz to obtain frequency domain NMR spectra. All diffusion experiments were performed with a PFG STE sequence (Tanner, Reference Tanner1970). For each experiment the gradient strength G was logarithmically incremented from 0.05–100% of the maximum value in 32 steps and the length of the gradient pulse δ was 4 ms. A diffusion time Δ of 100 ms and 1024 scans were used. The decay of 1H peak area integrated from 4.1 to 7 ppm as a function of the diffusion weighting variable b was fitted to a biexponential decay function
 $$I(b) = I_0 [\,f\,{\rm e}^{ - D_{\rm A} b} + (1 - f){\rm e}^{ - D_{\rm B} b} ]$$
to yield diffusion coefficients D and the fractions f and 1-f of the two species A and B, respectively. In Eq. (1), b is defined as
 $$b = (gG\delta )^{\rm 2} (\Delta - \delta /{\rm 3})$$
where γ is the gyromagnetic ratio. The uncertainty of the fit parameters was estimated with Monte Carlo error analysis (Alper and Gelb, Reference Alper and Gelb1990).
Small-angle X-ray diffraction (SAXD)
SAXD was used to determine the lipid lamellar organization in the EOS sample. The scattering intensity I was measured as a function of the scattering vector q. The latter is defined as q = (4π sin θ)/λ, in which θ is the scattering angle and λ is the wavelength. From the positions of a series of equidistant peaks (q n), the periodicity (d) of a lamellar phase was calculated using the equation d = 2nπ/q n, with n being the order number of the diffraction peak. One-dimensional intensity profiles were obtained by transformation of the 2D SAXD detector pattern from Cartesian (x,y) to polar (ρ,∂) coordinates and subsequently integrating over ∂. All measurements were performed at the European Synchrotron Radiation Facility (ESRF, Grenoble) using station BM26B. The X-ray wavelength and the sample-to-detector distances were 0.1033 nm and 2.1 m, respectively. Diffraction data were collected on a PILATUS 1 M detector with 1043 × 981 pixels of 172 µm spatial resolution. The spatial calibration of this detector was performed using silver behenate AgBeh (d AgBeh = 5.838 nm). The EOS sample (prepared on the polycarbonate filter disk) was mounted parallel to the primary beam in a sample holder with mica windows. The diffraction data were collected for 5 min at 32 °C. Radiation damage was checked by measuring during 10 min exposure after each minute of exposure. After 1 and 10 min there were no detectable differences between the spectra obtained, indicating no detectable radiation damage under the present experimental conditions.
Supplementary material
The supplementary material for this article can be found at https://doi.org/10.1017/S0033583518000069
Acknowledgements
We thank the company Evonik (Essen, Germany) for their generous provision of CERs. We also thank the personnel at the DUBBLE beam line 26B at the ESRF located in Grenoble, France for their assistance during the X-ray diffraction measurements. This study made use of the “NMR for Life” infrastructure, which is supported by the Knut and Alice Wallenberg foundation, the University of Gothenburg and Umeå University. We thank Göran Carlström, Tobias Sparrman and Gerhard Gröbner for help with the HETCOR and HR MAS diffusion measurements, and Maja Stenstam for her contribution to the graphic.
Financial support
The Swedish Research Council (E.S., D.T.), the Crafoord Foundation (E.S.), and the Royal Physiographic Society of Lund (Q.D.P.) are acknowledged for financial support.
Conflict of interest
None.


 Open access

