


Introduction
The United States Department of Agriculture’s (USDA) Biopreferred Certification Program (aka Biopreferred Program) was established in the Farm Security and Rural Investment Act (2002, Section 9002). It was created to incentivize the production of biobased products by giving preference to those products that meet a Minimum Biobased Content (MBC) for federal purchasing and contracts. It also formalized the requirements for biobased testing labs including ISO/IEC 17025:2015 accreditation and testing methods following the ASTM D6866 biobased testing standard (2024). Currently only two labs in the world meet these requirements. Here, we provide a few historical examples of biobased testing research at CAIS and results from recent biobased testing at CAIS for products submitted under the USDA’s Biopreferred program.
Biobased Research at CAIS
Determination of radiocarbon content following the ASTM D6866 Standard is at the core of modern biobased testing metrics. As one of the only two USDA-authorized biobased testing labs, the Center for Applied Isotope Studies (CAIS) at the University of Georgia (UGA) has long been involved in the research and development of the ASTM D6866 Standard and radiocarbon testing in general. For example, a comparison of 3 distinct radiocarbon testing methods at CAIS revealed that sample graphitization with analysis by Accelerator Mass Spectrometry (AMS) yielded the best precision of less than 1 percent Modern Carbon (pMC), whereas the benzene synthesis with analysis by Liquid Scintillation Counting (LSC) yielded precision of about 2 pMC and the Carbosorb E with LSC analysis yielded precision of almost 9pMC (Noakes et al. Reference Noakes, Norton, Culp, Nigam and Dvoracek2005). One of the confounding issues associated with accurate quantification of biobased carbon content is inorganic carbon ingredients. Most available inorganic carbon, such as calcium carbonate, originates from very old geological material that is entirely depleted of radiocarbon and if measured with a biobased product, has the effect of significantly reducing the apparent biobased carbon content. Culp and Noakes (Reference Culp, Noakes, Eikenberg, Jaggi, Beer and Baehrle2009) examined various methods of pretreatment for inorganic carbon removal from biobased samples. Their study confirmed that the use of 1N HCl or lower is optimal for inorganic carbon removal while maintaining the isotopic integrity of the organic carbon in a sample (Culp and Noakes Reference Culp, Noakes, Eikenberg, Jaggi, Beer and Baehrle2009). In another analytical comparison, Culp et al. (Reference Culp, Cherkinsky and Prasad2014) used various radiocarbon techniques for assessment of biobased fuels, once again demonstrating that sample graphitization with analysis by AMS was the most precise while LSC was the least precise for biobased fuel testing.
Methods
While some biobased products tested during this study at CAIS were easy to sample such as powders and concentrated liquids, complex products such as geotextiles, coolers, undergarments, shoes and gloves required special handling before isotopic analysis can be carried out. We created a preparation and testing decision tree to help guide in handling the diversity of potential biobased products (Figure 1). Some heterogeneous biobased products needed to be dismantled first using scissors, seam rippers, box-cutters, coring tools and sometimes brute force. One very useful tool for products constructed of multiple glued parts was a heat gun. With a little heating and physical prying, binding agents were effectively softened enough to more easily separate distinct components before subsampling each biobased part into representative proportions using a microbalance.
Biobased Sample Preparation and Testing Decision Tree. On the left are the most common decision points associated with liquid samples (1), including the amount of water content (2), whether it contains surfactants or volatile organics (3), whether it needs freeze drying (4), and whether it contains inorganic carbon (5) that would require acidification (6) before being loaded (7) for testing. The right side represents the common decision points for solid samples (8), including whether a sample is heterogeneous (left path; 9), and requires weighing (10), disassembly (11), and proportional subsampling (12) or the sample is homogenous (right path; 13) and can be directly subsampled or ground into smaller particles (14). This is then followed by whether the sample contains inorganic carbon (15) that would require acidification (16) before being loaded (17). The middle path illustrates the processes that all biobased samples then undertake, including combustion (18), cryogenic gas separation (19), graphitization (20), and mass spectrometric analyses (21). See the Methods section for additional details.

From this point we followed the current version of ASTM D6866 Biobased Testing Method (2024) for sample combustion, analysis and calculations. In brief, products containing inorganic carbon or high-water content required acidification with 10% HCl or freeze-drying to remove the inorganic carbon or facilitate off-line combustion, respectively. Most sources of inorganic carbon are derived from very old geologic material and would decrease the measured biobased carbon content if left unacidified. Small amounts (10 to 20 mg total) of homogenized sample or proportionally combined parts of heterogeneous samples were loaded into quartz ampoules under vacuum with copper oxide. Loaded ampoules were combusted at 900°C for 2 to 4 hr. Combusted gases were cryogenically separated on a vacuum line using a dry ice/propanol slurry to trap water vapor and liquid nitrogen to trap sample CO2.
Sample CO2 was graphitized using hydrogen-conditioned iron powder as a catalyst at 600°C (Manning and Reid Reference Manning and Reid1977). Graphitized samples were analyzed for radiocarbon by AMS using a 250KV NEC Single Stage AMS and sample CO2 gas for stable carbon isotopes (δ13C) by IRMS using a Thermo MAT 253 or 252 at CAIS. AMS standards included anthracite of greater than 50,000 year age (aka “background”), NIST-4990C Oxalic Acid (Stuiver Reference Stuiver1983) and IAEA-CH6 ANU Sucrose (Gröning Reference Gröning and de Groot2004). The following ASTM calculations were then applied to the raw pMC and δ13C resulting in %biobased carbon. Correction of 14C for fractionation using 13C/12C (δ13C) ratio was done according to the equation:
 $${\rm{pMCcorr}} = {\rm{pMC}}*(1 - ((2*(25 + [{\delta ^{13}}{\rm{C}}]))/1000))$$
And adjustment of corrected 14C for nuclear testing bomb curve using the equation:
 $$\% {\rm{ biobased\ carbon}} = \left[ {100\ {\rm{ }}\left( {{\rm{pMCcorr}}} \right)/100\ \left( {{\rm{REF}}} \right)} \right] \times 100$$
REF for 2024 was 99.7pMC according to ASTM D6866–24 (2024).
This calculated biobased carbon content was interpreted as follows: 0% biobase = No 14C in product, not modern, i.e., made entirely of petroleum C; 100% biobase = Entirely modern C source, with no petroleum/fossil sources; 50% biobase = Equal mixture of both modern and fossil carbon. Radiocarbon values >100pMC are also adjusted downward to compensate for starting material made of decades old carbon (e.g. wood pulp). This is intended to encourage the use of the most quickly renewable sources of carbon over long-growing forest products. Similar compensation factors are also provided in the ASTM standard (2024) for materials of marine and aquatic origins.
Results and discussion
Between 2021 and 2023, the Center for Applied Isotope Studies tested over 500 samples for biobased carbon content under the USDA’s Biopreferred Program. Expanded measurement uncertainty for radiocarbon using our accelerators is 0.36 pMC (calculated as the SD of the ANU reference standard multiplied by our lab-specific coverage factor of 1.40) and the background (14C-free) standard typically ranged from 0.2 to 0.4 pMC.
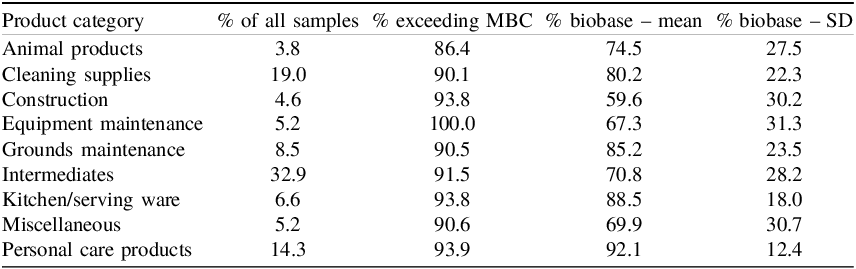
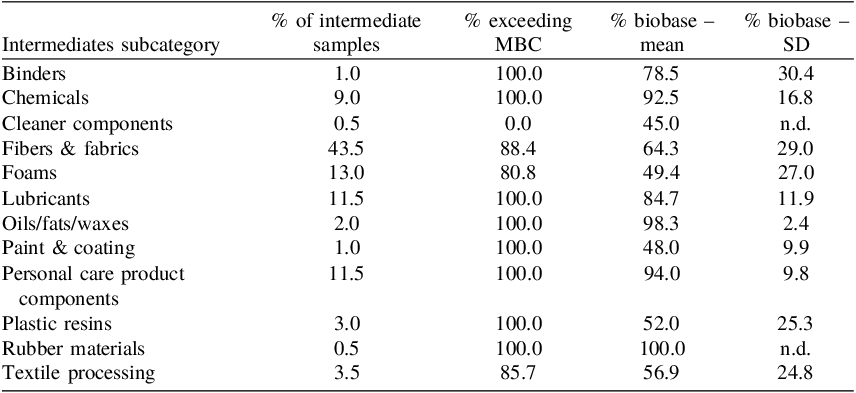
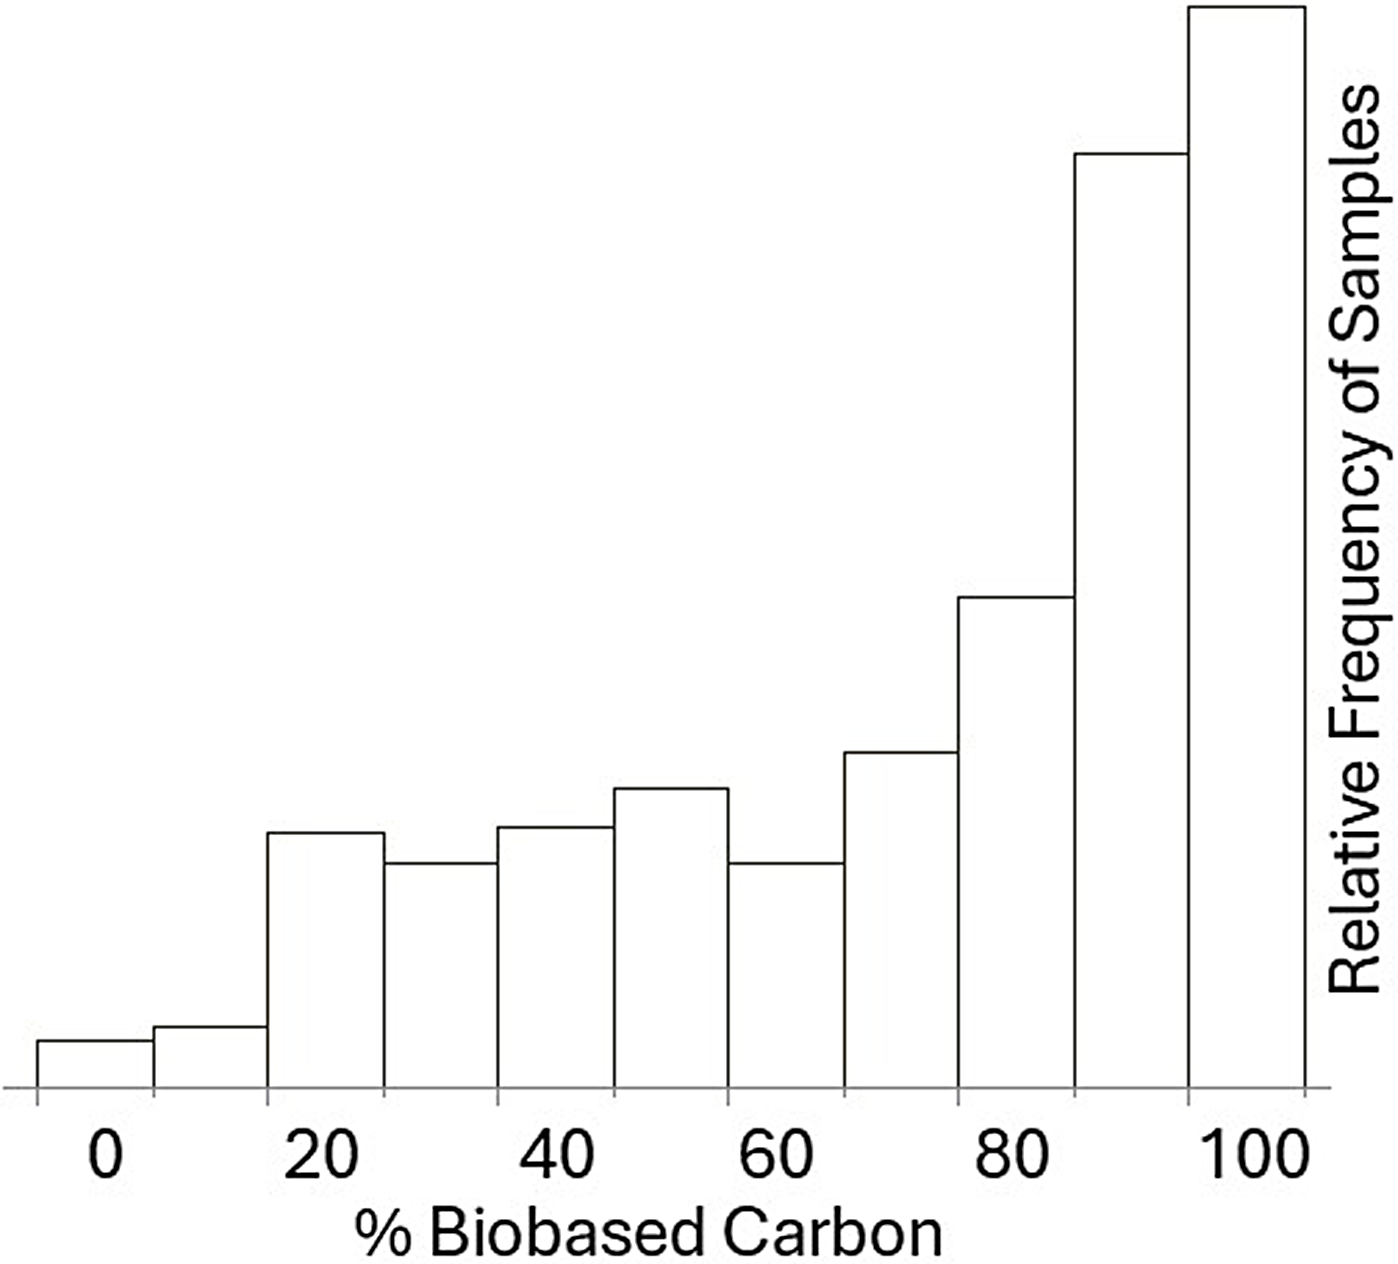
For biobased samples, 14C measurement error ranged from 0.02 to 0.74 pMC, with both extremes in the Intermediates product category which also included one of the broadest ranges of raw radiocarbon values from 0.43 to over 110 pMC. Over 33% of products we tested were in the USDA’s Intermediates product category that have numerous biobased manufacturing uses, of which 92% exceeded the USDA MBC (Table 1). Of those intermediates about 44% were fibers and fabrics, of which 88% met the USDA MBC (Table 2). The next most common biobased samples were cleaning supplies (19%) and personal care products (14%), of which 90% and 94% met the USDA MBC, respectively (Table 1). During this study period, average biobased carbon content for all samples was 76% Biobased and 93% of products met the USDA MBC (Figure 2).
Percents of Biopreferred samples (n=559) in each major product category, including those exceeding the USDA’s Minimum Biobased Content (MBC), and the means and standard deviations (SD) of biobased carbon content. The SD is the amount of variation around the mean % Biobase of each of the 9 main product categories

Percents of Biopreferred samples within the Intermediates subcategory in Table 1 (n=199), including those exceeding the USDA’s Minimum Biobased Content (MBC), and the means and standard deviations (SD) of biobased carbon content. n.d. = no data due to low sample number. The SD is the amount of variation around the mean % Biobase of each of the intermediate subcategories

Frequency distribution of all biobased carbon content for samples tested at CAIS under the USDA Biopreferred Program between 2021 and 2023.

This summary of biobased testing results has helped reveal some potential avenues for manufacturers to develop new biobased products. A common strategy among biobased manufacturers appears to be aiming for USDA’s MBC when developing new products, possibly due to relative availability or lower cost of traditional petroleum ingredients. The growing use and availability of bioplastics using various bio-engineering techniques (Al-Khairy et al Reference Al-Khairy, Fu, Alzahmi, Twizere, Amin, Salehi-Ashtiani and Mystikou2022) could help facilitate the development of completely petroleum-free biobased products.
Conclusions
Radiocarbon testing of biobased products under the USDA’s Biopreferred Certification Program can help reveal greenwashing (i.e. conveying false impression of environmental benefits), provides consumers with evidence of environmental benefit and reduce the overall use of fossil fuels in product manufacturing.
The left-skewed frequency distribution of biobased content of products we tested from 2021 through 2023 (Figure 2) is testament to the effectiveness of the USDA’s Biopreferred Program in incentivizing the creation of more sustainable products. In addition, after the initial certification of the biobased carbon content in a product, the USDA can conduct spot testing/audits of any product under the Biopreferred program, effectively discouraging the fraudulent activity of attempting to pass-off another product under the certified label.
The use of the ASTM D6866 biobased testing standard and development of simple quick-reference tools like our preparation and testing decision tree (Figure 1) may help encourage more AMS labs to seek the qualifications necessary to test biobased samples under the USDA Biopreferred Program.
Although the science of biobased analysis is well-established in the ASTM standard, the art of sampling the diversity of biobased products for testing frequently requires experience, some familiarity with how things are made and a little creativity.
Acknowledgments
The authors thank Katie Cooper, Lauren Gagnon, Tiandra Manns, David Smith and Flordaliza Smith of UGA’s Center for Applied Isotope Studies for their help preparing and analyzing biobased samples during this study period.


 Open access