
In recent years there has been a great deal of concern about declining levels of turnout at elections in Britain.Footnote 1 Much of this research has concentrated on the decline in turnout among young people in particular.Footnote 2 However, young people are not the only social group to have shown a dramatic fall in turnout. In this article I examine the electoral participation of the working class. Although it has been well documented that the strength of class voting has declined in Britain,Footnote 3 it is less well documented that class-based differences in turnout have increased, and that the working class are now much less likely to vote than the middle class.
In 2010 the difference in reported turnout between the working class and salariat was 19 percentage points, compared to less than just 5 percentage points in 1964. Put into context, the difference in reported turnout between the under-30s and the over-60s in 2010 was 21 percentage points.Footnote 4 Whereas this ‘age gap’ has received an enormous amount of academic and policy attention, with numerous mobilization initiatives launched to try and get young people more involved in politics, the ‘class gap’, of a very similar magnitude, has received almost no attention at all. And whereas young people tend to grow into older people, and turnout tends to increase with the transition to adulthood,Footnote 5 working-class people tend to stay working-class, as do their children. In the context of rising inequality and stalled social mobility the ‘class gap’ in turnout warrants closer attention.
In this article I examine the sources of working-class abstention. I do so with reference to some of the key theories of class voting and turnout. Traditionally, two distinctive approaches have dominated studies on class voting. The first approach holds that political cleavages are shaped by ‘bottom-up’ factors to do with changes in the social structure of the electorate.Footnote 6 According to this ‘class heterogeneity’ perspective, rising living standards, the spread of affluence and educational expansion have weakened the distinctiveness of social classes and blurred class boundaries, leading to a decline in class voting.Footnote 7 Although this interpretation has been challenged on a number of grounds;Footnote 8 with respect to turnout specifically the blurring of class boundaries would appear ill-equipped to explain in a straightforward way why classes have become more distinctive in terms of their turnout patterns, since if anything educational expansion should increase turnout as citizens now possess the political resources and skills that might help them to deal with the complexities of politics without reliance on party cues.Footnote 9
In recent years there has been a ‘fundamental shift’ in the study of political participation to acknowledge the critical role of political elites, both in terms of stimulating (or at times, depressing) voter turnout,Footnote 10 and mobilizing (or demobilizing) class divisions.Footnote 11 As Przeworski puts it, ‘individual voting behaviour is an effect of the activities of political parties’.Footnote 12 And as Evans and Tilley conclude: strategic moves by political actors are capable of generating pronounced changes in the social bases of party support over relatively short periods of time.Footnote 13 According to this ‘top-down’ perspective voters do not behave blindly, but respond to the structure of the political choice between the parties they face. The agent of change in this approach is clearly political, rather than social structural – even if political strategy is often shaped, at least in part, by social conditions.Footnote 14
Drawing on this political choice literature I investigate three key hypotheses that may help to shed light on class-based inequalities in turnout. Existing research has shown that contextual factors such as electoral competitiveness,Footnote 15 and policy distinctiveness affect turnout.Footnote 16 Voters are constrained by the electoral choices they are offered, and as Leighley and Nagler observe, from a self-interest perspective it would be more foolish to sit out an election where the choices differ than to sit out one in which the choices are not choices, but echoes of each other.Footnote 17 Previous research has tended to examine the structure of this choice in policy terms, most commonly understood in relation to parties’ positions on left–right issues. When there are clear ideological differences between the parties there is greater incentive to vote than when there are only minor differences, in which case it does not matter so much which party wins. In the British context Heath shows that voters’ perceptions of how much difference there is between the parties influence much of the temporal variation in turnout over time.Footnote 18
Ideological distinctiveness also has clear resonance for class voting and the political participation of the working class. The rationale for this dates back to Lipset et al.’s early assertion that the working class tend to prefer redistributive policies, and so they vote for parties on the left, whereas the middle class try to resist these claims and so vote for parties on the right.Footnote 19 Similarly, Przeworski and Sprague state that when parties of the left pursue ‘supraclass strategies’, some workers will respond by abstaining.Footnote 20 Weakliem and Heath suggest that, in the United States, as the Democrats moved to the centre of the political spectrum, class differences in turnout increased.Footnote 21 Accordingly, if parties differ in their policy outlook on left–right issues the incentives to vote (and vote along class lines) are stronger than if the parties stand for much the same policy outlook.
Recent research has shown that the strength of the class–party association in Britain is associated with policy difference between the two major parties. According to Evans and Tilley, ‘when there is ideological convergence the strength of the signals from parties to voters is weakened and the motivation for choosing parties on interest/ideological grounds derived from class position is reduced, and vice versa’.Footnote 22 Although there is some evidence that ideological convergence between the Labour and Conservative parties has reduced the incentives to vote along class lines since the 1970s, it is less clear why ideological convergence should have a greater impact on turnout among the working class than it does among the middle class, and so create unequal turnout patterns.
A useful way for thinking about how parties’ policy positions may influence turnout is put forward by Zipp, who conceptualized individuals’ distance from candidates in each presidential election as resulting in alienation (the distance between an individual’s preferred policy position and the closest candidate’s policy position) and indifference (the difference in distance between the respondent’s preferred policy position and the policy position of each of the candidates).Footnote 23 According to this perspective individuals will be more likely to vote when offered policy choices that match their preferences more closely, and when parties take more distinctive policy positions. When parties’ policy positions are not close to those of individuals, then the resulting alienation of the individuals results in lower probability of voting; and when candidates’ policy positions are equally appealing or unappealing to an individual, the resulting indifference results in a lower probability of voting.Footnote 24
In the United States’ context Plane and Gershtenson find that individuals are less likely to vote when they feel indifferent to or alienated from candidates’ ideological positions.Footnote 25 Using data from the 1988–92 Senate elections, they report that alienation has a greater potential effect on citizens’ turnout decisions than indifference.Footnote 26 More recently, Leighley and Nagler show that poorer people in the United States tend to see less difference between the policy platforms of candidates than wealthier people, and are least likely to see candidates as offering meaningful choices on issues.Footnote 27 They argue that the poor cannot respond to policy differences that they do not see, and that turnout among the poor will not increase unless one or both of the major parties offers them a distinctive and compelling choice.
Building on these arguments I examine the extent to which policy representation influences class-based inequalities in turnout in Britain. Thus, in class terms, when the Labour party puts forward a left-wing policy position the working class may be more likely to vote, and when Labour adopts a more right-wing policy agenda the working class may become ‘alienated’ and so abstain. Early work in the British context has suggested such a possibility. Writing after the 1997 election, Heath and Taylor speculated that Labour’s move to the centre may have alienated some working-class voters, and that the working class were less likely to say that the Labour party represented working-class interests after 1997 than they had done previously.Footnote 28 Denver and Hands report that turnout was particularly low in safe Labour seats,Footnote 29 and more recently, Evans and Tilley show that abstention among groups disadvantaged in several ways – with low education, low income and high unemployment – has increased since 2001, perhaps as a consequence of the perception that Labour is less responsive to the concerns of the working class and the poor.Footnote 30
The idea of indifference and alienation also has clear social implications. A voter’s sense of indifference or alienation towards political parties may also be shaped by the extent to which parties represent them socially, as well as politically. In exploring this possibility I draw a distinction between the structure of political choices based on policy or ‘substantive’ representation and political choices based on social or ‘descriptive’ representation.Footnote 31 Whereas the political representation of women and ethnic minorities in parliament has been on the increase in Britain over the last few years, the representation of other social groups, particularly the working classes, has been declining.Footnote 32 The number of working-class MPs within the Labour party has shrunk, and the candidates that they put forward for elections are increasingly drawn from a narrow range of middle-class occupations. These changes have had a substantial impact on the relative popularity of the party among working- class voters, even controlling for a host of other factors commonly associated with class voting.Footnote 33 Building on this idea in this article I examine whether social representation also matters for turnout. As Labour has become more ‘middle class’ has the working class become more alienated from the political process, resulting in higher levels of abstention?
THE SOCIAL REPRESENTATION OF WORKING CLASS MPs
Politicians often talk about their class backgrounds and many campaigns prominently highlight stories about how candidates were raised in poor or working-class families.Footnote 34 The social class of politicians is featured in political advertising, stump speeches and election leaflets, as well as being fodder for political pundits.Footnote 35 Indeed, political reporting in the media is often highly personalized – making references to politicians’ upbringing and family background,Footnote 36 though it is a matter of some debate whether it has become more personalized over time.Footnote 37 As a result, knowledge about candidate characteristics is probably more evenly distributed than the notoriously skewed distribution of policy information.Footnote 38 And whether they realize it or not, people frequently use social class stereotypes to make judgements about others based on class markers like clothing, occupation, accent and behaviour.Footnote 39
In recent years a growing body of work has shown, at least as far as voters are concerned, descriptive – or social representation matters, and all else being equal, people with a given social characteristic prefer candidates or leaders who share that characteristic.Footnote 40 As Johnston et al. argue ‘the more an agent resembles oneself the more he or she might be expected reflexively to understand and act on one’s own interests’.Footnote 41 Indeed, in the American context Carnes presents striking evidence that in the House of Representatives, legislators’ class backgrounds have an independent effect on how they vote on economic policies, especially on the issues seen as most important to the material welfare of working-class Americans.Footnote 42 More generally, sociodemographic dissimilarity with a political figure tends to decrease a voter’s expected utility from the election of that person.Footnote 43 Gathering information on candidates’ and parties’ policy positions and coming up with an opinion of one’s own is a more costly activity than observing the social characteristics of candidates and party leaders.Footnote 44 The social background of politicians thus offers a ‘low-information short-cut to estimating a candidate’s policy preferences . . . because the voter observes the relationship between these traits and real-life behavior as part of his daily experience’.Footnote 45
Evidence in the British context suggests that the class background of candidates sends particularly strong social signals to voters. For example, Campbell and Cowley ran a series of survey experiments designed to investigate the British public’s reactions to wealthy (or not so wealthy) candidates.Footnote 46 They conclude that everyone seemed put off by wealthy candidates, but that the working class are put off more, and the effects are strongest when it comes to the candidate’s perceived approachability. In addition, Cowley reports that working-class respondents gave more support to the idea of increasing the number of working-class MPs in parliament than women did to increasing the number of women MPs.Footnote 47
It has long been recognized that citizens’ images of the social group character of parties affects partisanship.Footnote 48 The mere awareness of an out-group is sufficient to stimulate in-group favouritism, and the possibility of social comparison generates ‘spontaneous’ intergroup competition.Footnote 49 Social cues can thus be an incredibly powerful source of identification. In a series of classic experiments on group identity, Tafjet and Tuner present evidence that as long as minimal conditions existed for in-group identification, subjects were prepared to give relatively less to themselves when the award (either in points or money) was to be divided between self and an anonymous member of the in-group, as compared with dividing with an anonymous member of the out-group.Footnote 50 The implications of this is that social identification can over-ride material self-interest. Indeed, the idea that social similarity effects judgements and behaviour has a long history in the social psychology literature. As far back as 1958 Heider argued that interpersonal similarity promotes a sense of ‘belongingness’, or closeness.Footnote 51 Accordingly, interpersonal attraction, understanding and trust tends to be greater within than between groups. Subsequent research has found that people tend to like similar others more than dissimilar ones,Footnote 52 and are typically more emotionally invested in close than distant others.Footnote 53
In the 1960s Labour politicians from working-class backgrounds occupied prominent positions within the party and even middle-class politicians, such as Harold Wilson, projected themselves as ‘a man of the people’ and affected a ‘studied working-class accent.’ Writing in the Guardian John Mullan reports that ‘Wilson’s Huddersfield accent was disappearing during the 1940s and 1950s, but mysteriously returned after he became Labour leader in 1963 – a useful contrast to Alec Douglas Home’s strangled toff’s drawl.’Footnote 54 Data from the BES in 1964 shows that 54 per cent of respondents described Labour as ‘very’ working class and 28 per cent as ‘fairly’ working-class, compared to less than 1per cent who described Labour as ‘very’ middle-class. The social identity of the party was thus very strong, and the fact that there were so many working-class politicians within the party helped to cement this identity. Labour was not just a party for the working class but was also a party of the working class.
In response to changing social conditions, and the contraction of the traditional working- class sector, the Labour party sought to rebrand its party image in the 1980s and make itself more attractive to the growing middle class: it recruited candidates from middle-class occupations;Footnote 55 and these candidates tended to be parachuted into safe seats, gain promotion quickly,Footnote 56 and occupy visible positions during campaigns. As the number of working-class MPs within the Labour party ranks declined the strength of the working-class social signal that they send voters has weakened. The main parties have thus become far less socially distinctive – and in the eyes of many voters now resemble rival middle-class ‘management teams’.Footnote 57 As a result, Ford and Goodwin argue that voters have become fed up with the political class as a whole, and the working class in particular have become more alienated from the political system than ever before.Footnote 58
The rise of the so-called ‘career politician’ – which has received a great deal of attention in the national media – has led to the widespread view that politicians have become increasingly detached from the lives of ordinary voters. Indeed, in recent years (well-off) MPs have frequently displayed an astonishing lack of awareness about what life is like for low-income families and people living on benefits, from claiming that it is impossible to raise a family on an MP’s salary of £67,000 per year, to saying that they would never send their children to a state school. In an outspoken attack Lord O’Donnell, the former head of the Civil Service said there were still ‘too many people in politics who just don’t get it’ and that parliament needed to become more diverse by recruiting ‘people who’ve got more experience of the world, not just being in politics all their lives.’Footnote 59 These concerns have also been openly expressed within the Labour party; Hazel Blears, the former Labour cabinet minister, said MPs are out of touch with voters because they have little experience of life outside the ‘political bubble’ in Westminster,Footnote 60 and Simon Danczuk, one of the few remaining working-class Labour MPs, claimed the party had been hijacked by a metropolitan elite.Footnote 61 Indeed, in 2012 Labour launched an explicit search for more working-class candidates, to be headed by Jon Trickett, the Shadow Cabinet Office Minister, and its National Executive Committee changed party rules so that selection panels had to take social class into account, as they already do race and sex.Footnote 62
The lack of working-class representation in parliament may have serious implications for how people perceive political parties and participate in the political process. Working-class voters may feel more socially distant from middle-class politicians and consequently more socially alienated from the parties that the MPs represent. If voters attach greater utility to having someone ‘like them’ in office and feel closer to elected representatives who share their social background, then they may also be more willing to vote and turnout at the polls when there is a party that embodies their social background. To investigate these claims I test three main hypotheses. First, drawing on the idea of ‘policy indifference’, I examine whether class inequalities in turnout are shaped by the policy distinctiveness of the two main parties. Secondly, drawing on the idea of ‘policy alienation’, I examine whether class inequalities in turnout are shaped by the policy position of the Labour party. Whereas policy convergence may breed indifference among both the working class and the middle class, the policy position of the Labour party may have a much greater effect on the turnout of the working class, with policy shifts to the right alienating their core working-class support. Thirdly, I also examine whether class inequalities in turnout are shaped by ‘social alienation’ based on the occupational background of elected representatives. Rather than responding to policy cues, individuals may respond to the social cues that parties send voters. Thus, when a party is full of middle-class politicians, working-class voters may feel more alienated – and socially disconnected from their political representatives and so be less likely to vote. And without a strong social signal voters may also be less able to tell which party best represents their interests, making the calculus of voting more complex.
DATA AND METHODS
To test these hypotheses I analyse a merged dataset, which combines information on voters, parties’ policy positions and the occupational background of MPs. The data comes from three sources. First, to examine the social characteristics and voting behaviour of individuals over time, I use pooled cross-sectional survey data from the British Election Studies, 1964 to 2010.Footnote 63 This series covers thirteen elections and consists of 35,597 interviews. Secondly, to examine policy representation and the policy platforms of the political parties over time, I use Party Manifesto Data from the Manifesto Research Group (MRG).Footnote 64 And thirdly, to examine social representation and the occupational background of MPs, I use data from the Datacube project collated by the EurElite network.Footnote 65
The dependent variable is reported turnout in the last general election. Turnout is measured by whether respondents reported having voted in the election, or not. The base is all those on the electoral register. Although survey estimates of turnout tend to over-report official turnout,Footnote 66 the BES survey estimates of non-voting closely follow the official data.Footnote 67 The key independent variable is social class. To measure social class, I use a simplified version of the Erikson–Goldthorpe seven-class schema, which categorizes people according to their occupation.Footnote 68 Because of concerns over sample size and concerns over how well the skilled and semi-skilled categories are actually distinguished, the higher and lower professional categories and the two working-class categories are collapsed. However, the categories that are collapsed are not strongly distinguishable with respect to their pattern of party choice or level of turnout. Respondents are, therefore, classified into four class categories: Salariat (professional and managerial workers), Petty bourgeois (self-employed, small businessmen and farmers), Routine non-manual, and Manual workers (including supervisors/foremen and skilled and unskilled workers).
Following previous research, policy positions are estimated using party manifesto data.Footnote 69 These data provide a useful indication of party positions since they represent the choices that the electorate faces before each election. Moreover, as the content of party manifestos is often the result of intense intraparty debate, the (MRG) estimates should be reliable and accurate statements about parties’ positions at the time of elections. These measures are generally consistent with those from other party positioning studies, such as those based on expert placements, citizen perceptions of parties’ positions, and parliamentary voting analyses, which provides additional confidence in the validity and reliability of these estimates.Footnote 70 The MRG measures are based on content analyses of the programmes of the main political parties at every post-war election. The policy statements in each (‘quasi-’) sentence are classified into fifty-six policy categories over seven policy domains. Following the traditional Laver/Budge methodology, the left–right scores of the various parties can be computed by summing up the percentages of all the sentences in the left category, and subtracting their total from the sum of the percentages of the sentences in the right category. The policy position of the Labour party is simply the sum of these scores. The policy difference between the parties is the difference between these two scores.
To measure the social representation of the working class I use data from the Datacube project collected by the EurElite network. The Datacube is a major study of political representatives in Europe and contains information on the demographic background of elected representatives since 1850.Footnote 71 The data comes from a variety of sources, with the more recent data on Britain between 1964 and 2010 used in this article drawn from the Nuffield Election Series.Footnote 72 The occupational backgrounds of MPs are classified into eleven distinct categories. The working-class composition of the main political parties is calculated as the proportion of MPs in each party from a working-class background (including supervisors/foremen and skilled and unskilled workers). The social difference between the parties is simply the difference between these two scores from the previous election.
Changing Pattern of Working-Class Turnout in Britain
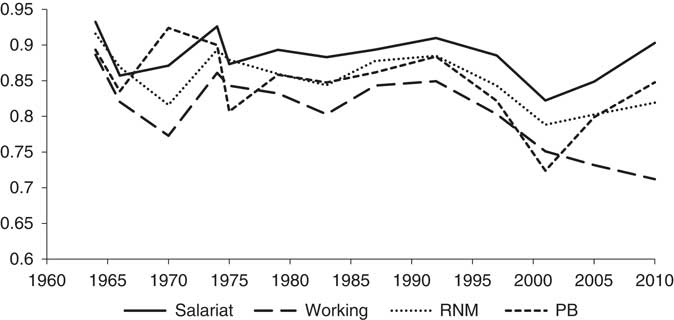
The first task is simply to examine the association between class and turnout in Britain over time. Figure 1 displays for each social class the probability of its voting in general elections since the 1960s. The working class have always been somewhat less likely to vote than the salariat, and from 1964 to 2001 the difference between the two classes was fairly modest. Turnout bumped along, up and down, but the relative difference in turnout between the working class and the salariat did not change much, and turnout among both groups tended to increase and decrease in tandem. However, since 2001 the turnout between the two classes has sharply diverged, and whereas turnout has been on the increase among the middle classes since the low water mark of 2001, turnout among the working class has continued to fall. In 2010 the difference in reported turnout between the working class and salariat voting was 19 percentage points, compared to less than just 5 percentage points in 1964.
Reported turnout by class, 1964–2010 Source: BES 1964–2010.
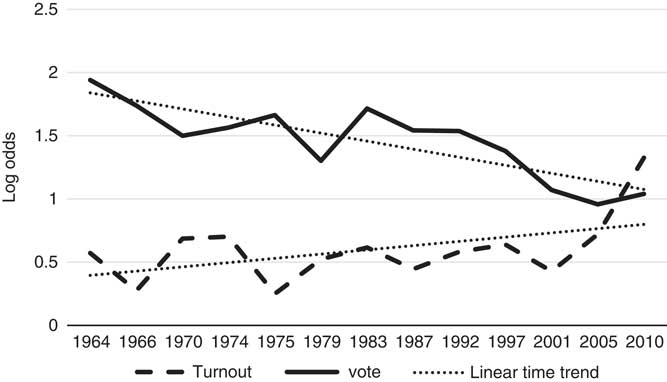
Another way to look at these trends is to consider the relative impact of class on turnout. Figure 2 presents the log odds ratios for the association between class and turnout over time, and for the association between class and vote choice over time (Labour v. Conservative). Although it has been well documented that there has been a decline in the strength of class voting since the 1960s, it has received less attention that there has also been an increase in the effect of class on turnout.Footnote 73 Although the sharpest increase in class inequalities in turnout has taken place since 2001, there has been a pronounced upward trend since 1974, a period which Evans and Tilley also identify as being critical for the start of the weakening impact of class on vote choice.Footnote 74 Moreover, by 2010 the logs odds of class on turnout were of a greater magnitude than they were for the association between class and vote choice. For the first time class is more important as a participatory cleavage than it is as an electoral cleavage.
Impact of class on vote choice and turnout (log odds), 1964–2010 Notes: Log odds are based on a comparison of working class and salariat. Vote choice is based on a comparison of Labour and Conservative.
This represents an important milestone in British political history. Traditionally Britain was regarded as the model of a class society, where class was pre-eminent among the factors used to explain party allegiance.Footnote 75 In comparative terms, the impact of class on vote in Britain was unusually high – and this stood in stark contrast to the United States, where the impact of class on vote choice was unusually small, but the impact of class on turnout was unusually large.Footnote 76 Whereas discussion of class inequality and politics in the United States has long been concerned about the issue of participatory equality,Footnote 77 this issue has not tended to receive much attention in Britain.
One other noteworthy feature of Figure 2 is that there is a very strong relationship between the growth of class as participatory cleavage and the decline of class as an electoral cleavage. Moreover, there appears to be a slight lag to this relationship. The association between class voting and class turnout is not particularly strong when both indicators are measured contemporaneously (R 2=0.24); but the association is very strong between the lag of class voting from t−1 and class turnout (R 2=0.52). This indicates a process where the decline of class voting is temporally prior to the increase in class inequalities in turnout, and suggests that the two processes may be somehow linked, with a decline in the former leading to an increase in the latter. This provides a further justification to investigate how the factors associated with the decline in class voting have also shaped working-class abstention.
Changing Party Positions on Left–Right Ideology
One potential reason why the working class may have become disillusioned with voting is, as already discussed, to do with the structure of policy offerings between the two main parties. Figure 3 shows how the main parties in Britain have shifted their left–right policy positions over the last half a century. During the post-war consensus of the 1950s and 1960s there was little ideological difference between the Conservative and Labour positions, though from the mid-1950s both parties moved right towards the centre ground. During the 1970s the Labour party moved substantially to the left and stayed there for the best part of twenty years, opening up a clear ideological divide between the two main parties. Since 1992, and in particular since 1994 when Tony Blair took over the leadership of the party there has been a process of policy convergence, with the Labour party moving towards the centre ground, and the Conservatives moving somewhat to the left.
Left–right positions of parties, 1950–2010 Source: Manifesto Research Group (MRG).
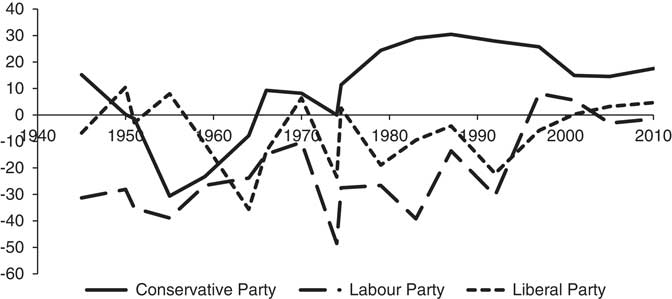
Given that Labour has been moving steadily to the right since the 1992 election, and that turnout among the working class has been steadily declining since then, there is some prima facie evidence to support the idea that Labour’s move to the centre ground may have alienated working-class voters and that policy convergence with the Conservatives may also have made the working class indifferent about voting. This combination of indifference and alienation, therefore, could potentially help to account for the increase in turnout inequality. However, this interpretation requires a somewhat selective reading of the data. During the 1960s the Labour and Conservative parties were also ideologically close to each other and the Labour party also moved towards the right, albeit from a fairly left-wing position, yet working-class abstention was not particularly high. Moreover, during the 1980s, when Labour was clearly on the left and there was also a substantial ideological divide from the Conservatives, working-class abstention was not particularly low. Thus, although policy indifference and policy alienation may help to account for recent changes in the level of working-class abstention, they appear less well equipped to account for the earlier patterns that we observe.
Changing Party Representation of Working-Class MPs
The next task then is to consider social representation, and examine how the social representation of the working class within the two main parties has changed over time. If the proportion of working-class MPs within the Labour party has declined over time, then the social signals that the party sends voters about what group the party represents will also have become weaker, leading to a hypothesized decline in working-class turnout.
Figure 4 depicts the changes that have taken place in the social background of Labour and Conservative MPs over the last fifty years. The number of MPs with a background in manual work has fallen dramatically.Footnote 78 In 1964 over 37 per cent of Labour MPs came from manual occupational backgrounds. By 2010 this fell to just under 10 per cent. These changes can be traced to institutional changes that were implemented by Kinnock in a bid to modernize the Labour party during the 1980s. As part of an effort to rebrand the party in order to appeal to middle-class voters and distance the party from the working-class radicalism that it had come to be associated with, more and more middle-class candidates were put forward. For example, in 1992 58 per cent of incumbent Labour candidates thought of themselves as working-class, compared to just 45 per cent of newly selected candidates.Footnote 79
Working-class MPs in Britain, 1964–2010 Source: Datacube
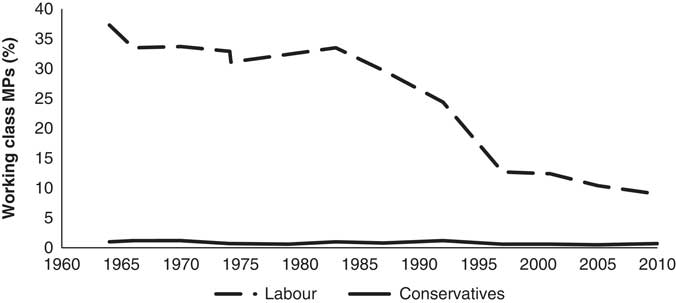
The result of these changes has been a parliament with many fewer voices able to speak from working-class experience, particularly on the Labour side of the House. Such changes in MPs’ occupational background have made parliament much less representative of the broader British population, and the Labour party much less representative of the working class, whose interests it was traditionally supposed to represent. As the party has become more socially distant from its core supporters and adopted a more middle-class party image it may be that the working class have become ‘socially alienated’, and as a result withdrawn from the electoral process.
Turnout and Working-Class Abstention
To test the hypotheses I link data on policy representation and social representation to pooled cross-sectional survey data, creating a hierarchical dataset in which individuals are nested within elections. I specify a multilevel logit model to estimate how the class–party association varies according to the structure of political choice. At level 1 is the individual survey respondent, and at level 2 is the election. The general model is specified as follows:
 $$\eqalignno{ & TURNOUT\,{\equals}\,f(\beta _{0} {\plus}\beta _{1} Class_{{ij}} {\plus}\beta _{2} POLDIF_{j} {\plus}\beta _{3} Class_{{ij}} {\asterisk}POLDIF_{j} {\plus}\beta _{4} SOCDIF_{j} , \cr & \quad \quad \quad \quad \quad \,{\plus}\beta _{5} Class_{{ij}} {\asterisk}SOCDIF_{j} ) $$
where TURNOUT is (1=voted; 0=did not vote) at election t, β 0 is the constant, Class is the occupational background of the voter, POLDIF is the policy difference between the two main parties; Class*POLDIF is a cross-level interaction between class and policy difference, SOCDIF is the social difference between the two main parties from the previous election; and Class*SOCDIF is a cross-level interaction between class and social difference. I also examine the policy position of the Labour party and include controls for basic demographics, such as age, gender, housing tenure and trade-union membership, which previous research suggests is important for turnout.Footnote 80 Finally, I also control for the expected closeness of the contest, based on the average difference between the top two parties across all published opinion polls in the final month of the campaign.Footnote 81
In order to model the extent to which social classes differ in their voting behaviour I do not control for any attitudinal variables that may be endogenous to class at the individual level or policy difference and social difference at the party level, such as leadership evaluations, economic evaluations or party identification. For example, social differences at the party level may influence party identification at the individual level, and so party identification may be a consequence of social differences (though see robustness checks for Models 6 and 7 in Table 3 below).
Five different models are specified. Model 1 is simply a baseline model of turnout which does not include any class-wise interactions; Model 2 specifies class-wise interactions to test the impact of policy difference on class turnout; Model 3 tests the impact of Labour policy on class turnout; and Model 4 tests the impact of social difference on class turnout. Model 5 tests the impact of social difference and labour policy simultaneously. The relevant parameter estimates from these models are reported in Tables 1 and 2.
Multilevel Logistic Regression Models Predicting Reported Turnout
Notes: Reference category is salariat. All models contain 12 surveys and 29,483 individuals. * p<0.05; ** p<0.01; ***p<0.005.
Multilevel Logistic Regression Models Predicting Reported Turnout
Notes: Reference category is salariat. All models contain 12 surveys and 29,483 individuals. * p<0.05; ** p<0.01; *** p<0.005.
The first model does not contain any class-wise interactions and simply presents a baseline model of turnout. The individual-level variables and election-related variables are all in the expected direction. The policy difference term is significant and in the expected direction – individuals are more likely to say they have voted when the two main parties adopt distinctive policy positions, and the political competition term is significant and in the expected direction – individuals are more likely to vote when the opinion polls suggest that the result will be close.
However, of more interest from a theoretical point of view, is whether any of the election and party-related variables interact with class in ways which might help to shed light on the increase in working-class abstention. In order to test the policy indifference hypothesis, Model 2 examines the impact that policy difference has on working-class abstention by specifying an interaction term between policy difference and social class. With respect to the working class, the interaction is positive and in the expected direction, but it is imprecisely estimated and does not reach conventional levels of significance (although the p value of 0.075 may charitably be regarded as significant at the 10 per cent level). The findings are, therefore, at best suggestive. Working-class people may be slightly more likely to abstain than the salariat when there is little policy difference between the parties, but in any case the magnitude of the effect is small. We can illustrate this by computing the predicted probabilities of voting at different levels of policy difference. For example, Model 2 predicts that working-class abstention is about 5 percentage points greater than in the salariat when the main parties adopt a distinctive policy platform (based on an MRG difference of 70, compared to the 1983 value of 68). By contrast, the model predicts that working-class abstention is about 9 percentage points greater than the salariat when the parties adopt a similar policy platform (based on an MRG difference of 10, compared to the 2001 value of 9). There is thus some evidence, albeit weak, that the size of the ‘class gap’ in turnout is conditioned by the policy offerings of the two main parties, and that ‘policy indifference’ may have had a slightly greater impact on working-class abstention than it has had on middle-class abstention.
In order to test the policy alienation hypothesis, Model 3 examines the policy position of the Labour party and specifies an interaction term with class, while controlling for the level of policy difference between the two parties. The interaction with class is in the expected direction but is once again imprecisely estimated (p=0.084). Nonetheless, there is some indication that working-class people are slightly more likely to abstain than the salariat when the Labour party adopts a more right-wing policy agenda. For example, Model 3 predicts that the difference between someone from the salariat voting and someone from the working class voting is about 3 percentage points if Labour adopts a very left-wing policy position (based on a CMP score of −40, compared to the 1983 ‘longest suicide note in history’ value of −39). By contrast working-class abstention is about 9 percentage points greater than the salariat if Labour adopts a right of centre policy position (based on a MRG score of 10, compared to the 2001 value of 6). These findings suggest that the working class in particular are slightly less likely to vote than the salariat when there is little policy difference between the parties or the Labour party adopts a right of centre policy stance. However, the magnitude of the effect is relatively weak, and the findings are not particularly robust.Footnote 82 Therefore, we should treat the results with caution.
In Table 2 we turn to the social alienation hypothesis. Model 4 tests the impact of lagged social difference on turnout.Footnote 83 The interaction term between social difference and the working class is highly significant (p=0.001) and in the expected direction. Working-class people are significantly less likely than middle-class people to vote when there is little social difference between the two parties. The interaction terms between the other class categories and social difference is also in the same direction, perhaps indicating that voters in those classes see working-class MPs as representing ‘ordinary people’. However the magnitude of these coefficients is somewhat smaller and less precisely estimated than the coefficient for the working class. Model 4 predicts that working-class abstention is 16 points higher than middle-class abstention if there is no social difference between the parties (based on a difference of 0, compared to the 2010 value of 8). But that working-class abstention is just 3 points higher than middle-class abstention when there are pronounced social differences between the parties (based on a difference of 40, compared to the 1964 value of 36). Class inequalities in turnout appear to respond to the social signals that parties send voters by having MPs from different social backgrounds. As Labour has become more middle-class, the working class in particular have withdrawn from the political process.
These results are robust to the inclusion of the main alternative hypotheses. Model 5 tests policy alienation and social alienation hypotheses simultaneously.Footnote 84 The main results still stand up. Footnote 85 The magnitude of the coefficient for the interaction term between lagged social difference and working-class is stable across models. These findings show that once we take social representation into account the strength of the class–turnout association does not vary by policy alienation (or policy indifference).
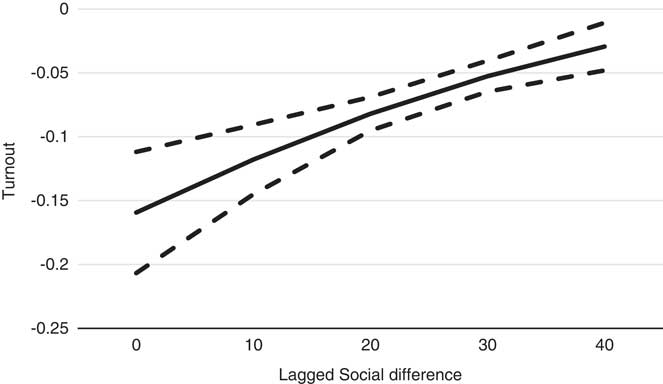
We can get a clearer sense of the substantive impact of these findings by plotting the average marginal effects from the interaction between lagged social difference and class. Figure 5 plots the difference that we would predict between a working-class person and a middle-class person voting in a general election at different levels of lagged social difference between the two main parties. When parties are socially similar, Model 5 predicts that the class gap in turnout is close to 16 percentage points. However, when parties are socially distinct and there are many working-class MPs within the Labour party this class gap shrinks to just under 3 percentage points.
The class gap in turnout: predicted difference in turnout between the working class and middle class by level of social difference between the parties Notes: These are predicted probabilities from Model 5 of Table 2, and refer to the difference in turnout between working-class and middle-class people.
As a robustness check Models 6 and 7 introduce a number of additional controls that might influence both turnout and class voting (Table 3). Model 6 controls for education. Data on education are not available for some of the early years, so missing values are imputed.Footnote 86 The expansion of university education has increased the ‘cognitive sophistication’ of the electorate – and as a consequence may have made voters less reliant on either partisan or social cues.Footnote 87 Model 7 also controls for the strength of party identification. It has been well documented that the strength of party identification has declined over time in Britain. Without strong partisan cues and habitual party loyalties those who lack the ‘cognitive skills’ to deal with politics may be less inclined to vote.Footnote 88 Although the gentrification of the Labour party may have contributed – at least in part – to the decline of party identification, Model 7 examines whether social cues still exert an influence on working-class abstention even when we control for partisan cues.
Robustness Checks: Multilevel Logistic Regression Models Predicting Reported Turnout
Notes: Reference category is salariat. Models contain 13 surveys and 30,818 individuals. Missing values are imputed. Number of imputations=10. * p<0.05; ** p<0.01; ***p<0.005.
As expected, controlling for education reduces the magnitude of the main effect for class, since the two variables are strongly related (people from working-class backgrounds tend to be less likely to go to university; and people who go to university tend to be less likely to end up in working-class occupations). However, the results of the analysis show that even with these added controls for education and party identification the main findings still hold; and that the magnitude of the class gap in turnout is conditioned by the social distinctiveness of the two main parties. The magnitude of the coefficient is still substantively large and estimated with a high degree of precision (p=0.018).
CONCLUSION
There is a widespread belief that class has become less important in British politics, and so does not merit as much attention as it once did. This belief is false. While it is certainly true that class divisions are not as evident as they once were in terms of structuring vote choice, this is because class has been pushed outside the political system. Whereas previously the middle class and working class were divided on who to vote for, now they are divided on whether to bother voting at all. This finding is hard to reconcile with the old idea that a decline in class voting signified ‘the successful resolution by political systems of deep-seated conflicts of social interests’.Footnote 89 The working class have not become incorporated within the political system – they have become more marginalized from it.Footnote 90
Recent studies on the dynamics of class voting have emphasized the political strategies of parties in shaping class divisions. In short, without party strategy that emphasizes or embodies class differences, class position is less likely to be strongly associated with party choice. But this does not mean that class simply disappears. Rather the factors that have contributed to the decline of class as an electoral cleavage have also contributed to the emergence of class as a participatory cleavage. The two processes are inexorably linked. As the Labour party in particular has turned its back on the working class in a bid to appeal to middle-class voters by recruiting more and more candidates from the professional classes, large swathes of the working class have simply stopped voting. Although this strategy has not hurt the Labour party electorally – and may even have paid off in terms of making them more electable in the eyes of middle-class voters – it has done so at the cost of participatory equality.
The results presented in this article indicate that there is a strong over-time relationship between social representation and class inequalities in turnout. This could be because changes in the social background of Labour MPs have made working-class people feel alienated from the party or indifferent about which party wins (or a combination of both). Without a strong social signal voters may also find it harder to decide which party best represents their interests, and so are confronted with an increasingly daunting set of evaluations. The over-time data is unable to shed much light on these different mechanisms, and we would need a different type of study to investigate them. However, there is now a growing body of experimental evidence to support the idea that the class background of candidates influences political attitudes, and that the working class in particular are most ‘put-off’ by wealthy (middle-class) candidates.Footnote 91 There is also evidence to show that the working class have indeed become increasingly ‘alienated’ from the political system.Footnote 92 One avenue for further research, therefore, would be to explore whether class and income profiles of candidates also influence more general feelings of political efficacy, which would help to support the link between social alienation and turnout, and whether this link also operates at the constituency level.
As the political choice perspective also makes clear, social divisions in politics are not fixed. And there is no reason why this trend of working-class political exclusion cannot be reversed. There is now a much greater pool of working-class voters who are electorally available and other parties may seek to court their vote. More generally these excluded voters represent fertile territory for populist parties. In Britain there is evidence that the United Kingdom Independence Party (UKIP) has found a way to connect with the disenfranchised working classFootnote 93 and, if these attempts prove successful over time, there is no reason why working-class turnout should not increase again.


