


A voter's reaction to an electoral outcome is crucial for the functioning, stability and very existence of electoral democracy. In fact, democratic systems depend on the premise that voters accept an election's outcome and recognize the legitimacy of the electoral process and the political system – independent of whether they won or lost. In this respect, electoral losers who are unsatisfied with the result demonstrate a normal democratic reaction, but losers who lose faith in the system and start questioning its evenhandedness can pose a real threat to the system.
We already know that winners and losers of the electoral competition differ significantly in terms of important political legitimacy beliefs, such as their level of satisfaction with democracy (Anderson et al., Reference Anderson, Blais, Bowler, Donovan and Listhaug2005; Blais & Gélineau, Reference Blais and Gélineau2007; Singh et al., Reference Singh, Karakoç and Blais2012), trust in institutions (Hooghe & Stiers, Reference Hooghe and Stiers2016; Moehler, Reference Moehler2009) and political trust more generally (Anderson & LoTempio, Reference Anderson and LoTempio2002). Extensions of this work have also investigated the effects of repeatedly losing on levels of satisfaction with democracy and trust in government (Anderson & LoTempio, Reference Anderson and LoTempio2002; Anderson et al., Reference Anderson, Blais, Bowler, Donovan and Listhaug2005; Chang et al., Reference Chang, Chu, Wu and Thomassen2014).
However, two caveats are common to all of this work. First, previous research only considered one of the indicators of legitimacy beliefs but never several in comparison. It means that we do not know whether different indicators of legitimacy beliefs are similarly affected by a repeated electoral defeat. Second, and more fundamentally, almost all existing work on repeatedly losing has been confined to cross‐sectional data (but see Hansen et al., Reference Hansen, Klemmensen and Serritzlew2019), requiring strong assumptions such as stability in voting decisions or correct memory recall over several years. As a result, we do not know whether repeatedly losing has any causally identifiable effect on people's legitimacy beliefs.
In this article, we build on and extend existing works by addressing both caveats. Lijphart (Reference Lijphart1999, p. 33) famously argued that being ‘continually denied access to power’ gradually erodes citizens’ general support of the entire political system. Building on these insights, we argue that repeatedly losing resembles a form of long‐term exclusion from the benefits of political power, because repeated losers do not see their preferred party in power over several electoral cycles. We therefore expect that repeatedly losing – compared to losing once – has additional negative effects on legitimacy beliefs because people lose faith in the system and start questioning its evenhandedness on a fundamental level.
We subject this expectation to a thorough test using unique multi‐wave panel data from a consensus democracy. We rely on a set of high‐quality data from the Dutch LISS (Longitudinal Internet Studies for the Social Sciences) panel that cover three consecutive national elections over a period of 6 years (2007–2012). The article thus differs from existing studies in two central aspects: First, we test and compare the effects of repeatedly losing on levels of satisfaction with democracy and political trust as two important indicators of legitimacy beliefs. Second, we employ multi‐wave panel data that allow analyzing inter‐individual changes in legitimacy beliefs over time.
We test our hypothesis on the effects of losing a total of 16 times within the same context, using different time periods, different operationalizations of repeatedly losing, different operationalizations of legitimacy beliefs and different operationalizations of one‐time losers. Across all of these different tests, the results show that – compared to losing once – repeatedly losing has never had a negative effect on levels of satisfaction with democracy, but it does change levels of political trust. Specifically, we estimate that repeatedly losing decreases political trust by between 2.1 and 7.1 per cent as compared to those who only lost the first out of two elections. This drop is not caused by a single political institution but, indeed, by losing faith in all representative institutions. However, the results also indicate that repeated losers are not necessarily less trusting than those who only lost the most recent election. Taken together, our results suggest that the timing of an electoral defeat/victory matters for voters’ political trust, at least in the short term.
Our findings mean that even in systems that are characterized by strong consensual features, such as the Netherlands, repeatedly losing can have substantial effects on citizens’ legitimacy beliefs. These results have important implications for research on electoral system design, electoral outcomes and the underpinning of stable democracies. They also inform us about the potential meaning of two important survey measures of citizens’ legitimacy beliefs.
In the following section, we first lay out our theoretical expectations before describing our data, measures and methods. In the third section, we present our results and compare the legitimacy beliefs of repeated losers with those of two types of one‐time losers. A fourth section scrutinizes the results and provides a series of robustness tests. Finally, we summarize our findings, propose a possible explanation for the differences in results between our two outcome variables and discuss the implications and potential avenues for future research.
The effect of repeatedly versus occasionally losing on legitimacy beliefs
Focusing on democratic losers rather than winners is important because of the central role of losers’ consent for the peaceful transition of power, their subsequent acceptance of decision making and the connected longevity of democratic systems. As Nadeau and Blais (Reference Nadeau and Blais1993) note, accepting the outcome of an election and perceiving the system as legitimate does not seem problematic for those who won the electoral competition, as they are presumably very satisfied with the process that led to the victory of ‘their’ party or candidate. Losers’ support, however, is less evident.
Losers’ support requires that they recognize the legitimacy of a system and a procedure that has led to an unfavourable outcome. Nevertheless, it is this consent that is vital for electoral democracy. If losers deny the system's legitimacy, they might not voluntarily turn over power or adhere to decisions and laws of the new government. Obtaining losers’ consent is therefore ‘one of the central, if not the central, requirement of the democratic bargain’ (Anderson et al., Reference Anderson, Blais, Bowler, Donovan and Listhaug2005, p. 2; emphasis in original). It means that the study of electoral losers’ political attitudes following one or more electoral defeats is important for our understanding of what keeps democratic systems healthy and alive.
A larger body of literature has already made great headway in explaining individual‐level change in legitimacy beliefs through electoral outcomes. While elections generally increase various types of legitimacy beliefs (Adam, Reference Adam2014; Berinsky, Reference Berinsky2002; Blais & Gélineau, Reference Blais and Gélineau2007; Bowler & Donovan, Reference Bowler and Donovan2002; Daniller, Reference Daniller2016; Hooghe & Stiers, Reference Hooghe and Stiers2016), a gap between winners and losers of the electoral competition has been extensively documented in the existing literature (see for example Anderson et al., Reference Anderson, Blais, Bowler, Donovan and Listhaug2005; Anderson & Guillory, Reference Anderson and Guillory1997; Craig et al., Reference Craig, Martinez, Gainous and Kane2006; Curini et al., Reference Curini, Jou and Memoli2012; Dahlberg & Linde, Reference Dahlberg and Linde2017; Martini & Quaranta, Reference Martini and Quaranta2019; Singh et al., Reference Singh, Karakoç and Blais2012; Stiers et al., Reference Stiers, Daoust and André2018; van der Meer & Steenvorden, Reference Meer and Steenvoorden2018).
So far, the literature has identified three possible causal mechanisms for the winner—loser gap. First, building on an instrumental perspective on voting and assuming that citizens vote for the party that is ideologically closest to them, the (expected) utility from the system is lower for losers and higher for winners (Esaiasson, Reference Esaiasson2011). Second, political legitimacy beliefs may also change because of the emotions voters have invested in the electoral game (Esaiasson, Reference Esaiasson2011; Holmberg, Reference Holmberg and Norris1999; Pierce et al., Reference Pierce, Rogers and Snyder2016): losing hurts emotionally and winning makes people happy. Third, it could be that losers in particular adjust their level of legitimacy beliefs in reaction to the electoral defeat for reasons of cognitive consistency (Anderson et al., Reference Anderson, Blais, Bowler, Donovan and Listhaug2005; Daniller, Reference Daniller2016; Esaiasson, Reference Esaiasson2011). According to these mechanisms, the winner–loser gap can originate either from losers losing, winners winning, or from a combination of the two.
Existing empirical findings appear to be more in line with the second scenario. Several studies (Blais & Gélineau, Reference Blais and Gélineau2007; Esaiasson, Reference Esaiasson2011; van der Meer & Steenvoorden, Reference Meer and Steenvoorden2018) show that legitimacy beliefs increase more among the winners of the electoral process and less among the losers. According to van der Meer and Steenvoorden (Reference Meer and Steenvoorden2018) ‘elections are a rising tide that raises all boats – especially electoral winners but even electoral losers’ (p. 17).
While this reasoning has proven valid for winning/losing in a single election, theory suggests that the findings from a single election might not apply for two consecutive elections (Guinier, Reference Guinier1995; Lijphart, Reference Lijphart1999). The reasons behind that are fairly intuitive: If certain groups within society feel that they are continuously and systematically excluded, this lack of power‐sharing arrangements gradually erodes their political legitimacy beliefs (Lijphart, Reference Lijphart1968). A situation in which majorities are fixed is precarious for democratic stability, because as Guinier (Reference Guinier1995) points out: ‘When the minority experiences the alienation of complete and consistent defeat, they lack incentives to respect laws passed by the majority over their position’ (p. 9). In line with this reasoning, we argue that repeatedly and consecutively losing in elections resembles – or might at least be experienced as – a form of exclusion, because these voters and their opinions are not immediately represented by governmental action even though they cast a vote. This objective or subjective exclusion from political power over several electoral cycles could be expected to depress the legitimacy beliefs of uninterrupted losers.
Some studies provide first evidence for this claim. They show that repeatedly losing is different from occasionally losing as demonstrated by levels of satisfaction with democracy. According to Anderson et al. (Reference Anderson, Blais, Bowler, Donovan and Listhaug2005), it is the second consecutive electoral loss that ignites further disappointment: ‘repeatedly losing frustrates voters to an ever greater degree’ (p. 63). This suggests that the repeated character of elections matters and that repeatedly losing decreases citizens’ levels of satisfaction with democracy. The same appears to be true with respect to trust: it decreases but only ‘subsequent to the second, rather than the first, electoral loss’ (Anderson et al., Reference Anderson, Blais, Bowler, Donovan and Listhaug2005, p. 65f; see also Chang et al., Reference Chang, Chu, Wu and Thomassen2014).
Leaning on these previous findings as well as on Lijphart (Reference Lijphart1968, Reference Lijphart1999) and Guinier (Reference Guinier1995), we expect that losing a second time in a row further dampens citizens’ legitimacy beliefs because of increasing scepticism towards the system's performance and a loss of faith in the system's prospective delivery of favourable outcomes. Repeated losers will start questioning the ‘even‐handedness, factuality, and the lack of bias or favouritism (neutrality)’ (Tyler, Reference Tyler, Jost and Major2001, p. 422) of political institutions that are crucial for considering them legitimate. Following this line of reasoning, repeatedly losing is no longer about a streak of bad luck in a competition but it signifies something more fundamental, something that corrodes the fundamental beliefs in the political system. Hence, since repeated losers are excluded from power over a longer period of time, they can be expected to express even lower levels of legitimacy beliefs than occasional losers. This leads to our hypothesis:
H: Compared to one‐time losers, repeated losers have lower levels of legitimacy beliefs.
Data, measurements, design and method
One of the central methodological limitations of existing studies exploring the effects of repeatedly losing is data availability. To our knowledge, all previous work on repeatedly losing is based on cross‐sectional data (see Anderson et al., Reference Anderson, Blais, Bowler, Donovan and Listhaug2005; Chang et al., Reference Chang, Chu, Wu and Thomassen2014; Curini et al., Reference Curini, Jou and Memoli2012; but see Dahlberg & Linde, Reference Dahlberg and Linde2017), and is thus heavily constrained in analyzing the necessary temporal aspects.
To overcome the constraint, these studies need to make strong assumptions about voters and their behaviour. Anderson et al. (Reference Anderson, Blais, Bowler, Donovan and Listhaug2005), for example, need to assume stable voting behaviour in order to test the effects of party‐voters’ satisfaction with democracy over several decades. However, assuming that people are loyal voters is a strong supposition, especially in today's rapidly changing political landscape with high electoral volatility (Dassonneville & Hooghe, Reference Dassonneville and Hooghe2017). While other work on the effects of repeatedly winning or losing also needs to rely on cross‐sectional Comparative Study of Electoral Systems (CSES) data, they additionally draw on a question of re‐called voting behaviour from the election before the last (Curini et al., Reference Curini, Jou and Memoli2012; Chang et al., Reference Chang, Chu, Wu and Thomassen2014). The authors have to assume that respondents correctly recall their voting behaviour from as long as up to 6 years ago. These design and data limitations of previous studies on repeatedly losing are not ideal for testing theories of individual‐level change over time.
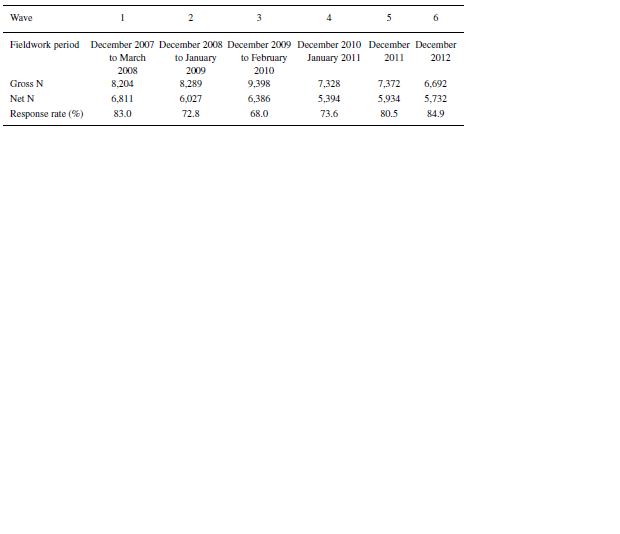
To overcome these limitations, we use multi‐wave panel data (similar to Blais & Gélineau, Reference Blais and Gélineau2007; Dahlberg & Linde, Reference Dahlberg and Linde2017), which allows us to study individual‐level change over the course of 6 years and twice for two consecutive national elections. Unlike previous studies using panel data, we are able to test the effects of repeatedly losing.Footnote 1 Our data stem from the Dutch LISS (Longitudinal Internet Studies for Social Sciences) panel, 2007–2021, which is administered by CentERdata (Tilburg University, The Netherlands). It is a web‐based panel survey derived from a probability sample of households drawn from the population register by Statistics Netherlands. Within households, all persons aged 16 or above are invited to participate in the study.Footnote 2 In this article, we analyze panel data from the annual Politics & Values module between 2007 and 2012, with net sample sizes of between 5,394 and 6,811.Footnote 3 Table 1 summarizes the characteristics of the data across the six waves in our analysis.
Panel wave characteristics

Besides the availability of unique panel data, there is another good reason to study repeatedly losing in the Netherlands: It is likely that the Dutch case represents the “most difficult scenario” or “least likely case” for finding differences in legitimacy beliefs between repeated losers and occasional losers (Gerring, Reference Gerring, Boix and Stokes2007). Several studies show that the size of the winner–loser gap in levels of satisfaction with democracy is moderated by political institutions (Anderson & Guillory, Reference Anderson and Guillory1997; Bernauer & Vatter, Reference Bernauer and Vatter2012; Farrer & Zinger, Reference Farrer and Zingher2019; Martini & Quaranta, Reference Martini and Quaranta2019). The winner–loser gap tends to be smaller in consensual systems. In these systems, even electoral losers are provided with substantial rights to participate in decision making, as these systems are characterized by strong power‐sharing institutions (such as balanced bicameralism, federalism, proportional representation, etc.).
Following Lijphart (Reference Lijphart1999), the Netherlands represents a classic example of a consensus democracy with one of the world's lowest electoral thresholds, high probabilities of multiparty coalition governments and strong features of a power‐sharing executive. To be sure, the governing parties still have a larger impact on political decisions than those in opposition. But based on previous findings, we speculate that the power‐sharing setup of consensus democratic institutions does not only reduce the differences between winners and losers, but also those between occasional and repeated losers. While repeated losers are presumably fully excluded in majoritarian systems, their chances of being represented in some way should be higher in consensus democracies such as the Netherlands. Hence, the Dutch case is arguably biased against the detection of significant differences in legitimacy beliefs of different types of losers. This means that if we still find an effect of losing repeatedly on legitimacy beliefs, similar effects are likely to be found also in systems that are more majoritarian in nature.Footnote 4
Measurements
To distinguish between different kinds of losers, we first require an operationalization of electoral defeat/victory. Stiers et al. (Reference Stiers, Daoust and André2018) show that there are different reasons why a voter perceives that the party he/she voted for won or lost the election, and hence there are different conceptualizations of electoral defeat/victory. Traditionally, the literature conceptualizes winning as being in power and operationalizes it by coding winners as voters who voted for a party that formed the government and losers as voters who voted for a party that went in the opposition after the election.
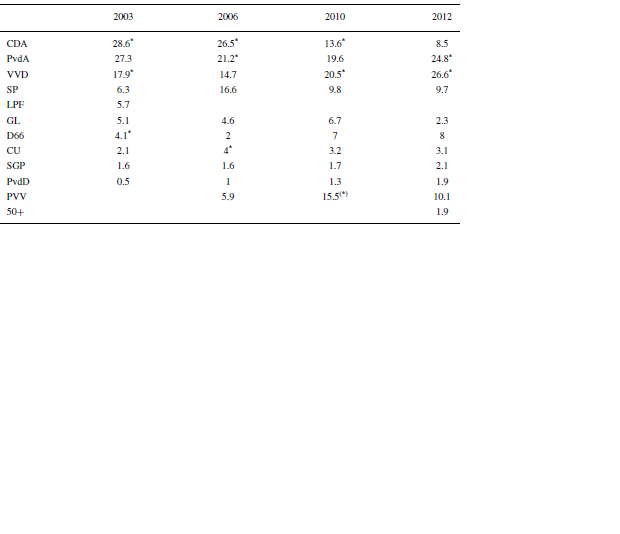
Applied to our case, this means that we code voters of several parties as electoral winners because all governments in our period of study were coalition governments. National elections were held in November 2006, June 2010 and September 2012. In all panel waves respondents were asked to recall their voting behaviour in the same year (wave 1, 4 and 6; see Table 1).Footnote 5 Recalled voting behaviour is remarkably accurate in the LISS panel, a testimony of the high quality of the data: across the three elections the average absolute deviation ranges between 0.63 (2010) and 0.83 (2006) percentage points. Table 2 summarizes government participation and vote shares per party for the period 2003–2012. Based on Table 2 and the survey measures, we code respondents who voted for a party that went into government as electoral winners. Electoral losers are defined as those who voted for a party that went into opposition.
Electoral outcomes Dutch general elections 2003–2012

Note: Electoral results marked with an ‘*’ indicate the governing parties following the election; ‘(*)’ indicates a support party. CDA = Christen Democratisch Appèl (Christian Democrats); PvdA = Partij van de Arbeid (Labour Party); VVD = Volkspartij voor Vrijheid en Democratie (Liberals); SP = Socialistische Partij (Socialist Party); LPF = Lijst Pim Fortuyn (Fortuyn List); GL = GroenLinks (GreenLeft); D66 = Democraten 66 (Democrats 66); CU = ChristenUnie (ChristianUnion); SGP = Staatkundig Gereformeerde Parij (Political Reformed Party); PvdD = Partij voor de Dieren (Party for the Animals); PVV = Partij voor de Vrijheid (Party for Freedom); 50+ = 50PLUS (50PLUS).
However, equating winning with access to government may not fully do justice to the complexity of consensus democracies, which are characterized by proportional representation and multiparty coalitions. A voter who voted for one of the eventual governing parties may not be entirely happy with the electoral outcome because of the coalition deal his/her preferred party had to strike (see Campbell, Reference Campbell2015). Another complication arises from the existence of small or anti‐establishment parties, such as the Dutch Party for the Animals or Party for Freedom, respectively. Voters who vote for such parties know that it is unlikely for their preferred party to enter government. But Stiers et al. (Reference Stiers, Daoust and André2018) find that they also feel they won, simply because their preferred party gained in parliamentary strength. Similarly, Plescia (Reference Plescia2019) shows that the larger the vote share of the supported party, the more likely party supporters feel that they have won the elections, indicating a significant link between vote share and voters’ perceptions of victory. Van der Meer and Steenvoorden (Reference Meer and Steenvoorden2018) support this finding specifically for the Dutch case as they show that, regardless of the eventual government composition, the electoral outcomes themselves already affect the winner/loser gap. Hence, while winning and losing in majoritarian systems highly depends on access to government power, in consensus democracies, winning and losing is (also) about being represented in parliament and obtaining a voice in the political discourse (van der Meer & Kern, Reference Meer and Kern2019).
We therefore create a second version of our winning–losing variable, based on a conceptualization of winning and losing through gains and losses in vote shares, which better fits a consensus democracy such as the Netherlands.Footnote 6 For this alternative variable of electoral defeat voters are coded as losers whose party lost in vote share and, conversely, voters are coded as winners whose party gained in vote share.Footnote 7 Since our aim is the establishment of an effect rather than testing a precise causal mechanism, we can only speculate that a victory or defeat in relative vote share might trigger more of an emotional response leading to higher or lower legitimacy beliefs, whereas instrumental considerations might prevail in the case of governmental access or not.
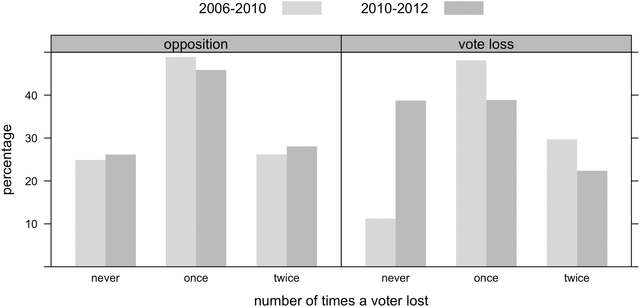
In sum, we employ two different conceptions of electoral defeat, and we translate them into three binary variables, one for each of the three elections, which means that our analyses do not cover abstainers. Figure 1 shows the combination of these variables and the distribution of the different types of losers in our sample. As shown, there is substantial variation in our measures and the two operationalizations of electoral defeat entail different distributions.
Distribution of types of losers in the data across operationalizations (parliamentary status and vote share) and election periods (2006–2010 and 2010–2012)

For the dependent variables, we rely, first, on citizens’ satisfaction with democracy, which is operationalized through a single survey item. In all six waves, respondents were asked to state on an 11‐point scale: ‘How satisfied are you with the way in which the following institutions operate in the Netherlands?’ where ‘democracy’ was one of the institutions to be evaluated.Footnote 8 The variable shows an approximately normal distribution in each of the waves. Second, our measurement of trust in political institutions builds on a battery of items that measures trust in different national political institutions: the Dutch government, the Dutch parliament, the legal system, the police, politicians and political parties. All are measured on a scale from 0 to 10. Wave‐specific exploratory factor analyses of these items show that they form each time a strong and one‐dimensional scale (for example, in Wave 1 Cronbach's alpha = 0.924). In line with previous research (Marien, Reference Marien, Zmerli and Hooghe2011), we rely on this measurement as one latent construct that captures political trust and use the factor loadings as our second dependent variable in the analysis. The variable has a mean of 0 and a standard deviation of 1 in each of the waves.
We include two time‐varying control variables. First, we control for respondents’ perceptions of economic performance, as this variable is known to affect legitimacy beliefs (Anderson & Guillory, Reference Anderson and Guillory1997, Anderson & LoTempio, Reference Anderson and LoTempio2002, Blais & Gélineau, Reference Blais and Gélineau2007, Singh et al., Reference Singh, Karakoç and Blais2012) as well as vote choice (see, e.g., Sanders, Reference Sanders2000, Sanders et al., Reference Sanders, Clarke, Stewart and Whiteley2011) and hence winning/losing. The measure is based on the question ‘How satisfied are you with the way in which the following institutions operate in the Netherlands?’ where ‘the economy’ was one of the institutions to be evaluated and respondents could answer on an 11‐point scale. Second, we account for potential changes in respondents’ ideological position because people who place themselves more on the fringes of the ideological scale are likely to be different in their voting behaviour as well as legitimacy beliefs. We measure ideology as respondents’ absolute distance from the mid‐point (= 5) on the left–right scale. The measure ranges from 0 to 5. Table A.1 in the Supporting Information Appendix summarizes all variables.
Design and method
Testing our hypothesis with a longitudinal dataset means that we follow electoral losers over time. Throughout, our main interest lies in those voters who lost twice in a row, and we compare this group's legitimacy beliefs to two other groups of voters, depending on the order in which they have won or lost an election. We follow previous work and use ‘LL’ to refer to the group of repeated losers, ‘WL’ for those who have first won and then lost and ‘LW’ for those who have first lost and then won (Curini et al., Reference Curini, Jou and Memoli2012; Chang et al., Reference Chang, Chu, Wu and Thomassen2014). While previous studies concur that LL shows the lowest levels of satisfaction with democracy, they disagree on the rank order of the other groups’ levels of legitimacy beliefs. Curini et al. (Reference Curini, Jou and Memoli2012) argue for the primacy of winning the last election and Chang et al. (Reference Chang, Chu, Wu and Thomassen2014) find that WL and LW are indistinguishable from each other. Given these differences in results, based on cross‐sectional data, we use our panel data to make both comparisons: first, LL versus WL and then LL versus LW.
These different comparisons provide answers to slightly different questions. The comparison LL–WL answers the question ‘Does having a history of losing affect voters’ legitimacy beliefs?’, where the difference in beliefs between the groups is the influence of the historical loss on present losers’ legitimacy beliefs. The comparison LL–LW, on the other hand, answers the question ‘Does an additional electoral loss affect voters’ legitimacy beliefs?’, where the difference in beliefs between the groups is the influence of the additional electoral loss on voters’ legitimacy beliefs. Leveraging our panel data, we can answer both questions for two time periods (2006–2010 and 2010–2012). Since survey responses were always collected in December of each year, yet national elections were held throughout the year, we have a pre‐ and post‐measure of legitimacy beliefs for every election.
In a first step, we estimate first difference models where the dependent variable is the change in legitimacy beliefs between elections, which accounts for omitted variables on the respondent‐level. We add the lagged indicators of legitimacy beliefs (political trust or satisfaction with democracy [SWD], respectively) as an additional control and include clustered standard errors by respondent to account for potential autocorrelation and heteroscedasticity. This estimation procedure is the same for both of our comparisons (LL–WL and LL–LW). In a second step, by meeting a number of important assumptions we can even estimate precise causal effects for the comparison LL–LW. We do so by estimating difference‐in‐differences regressions with respondent‐level fixed effects and period‐level fixed effects. The precise identification strategy is explained in greater detail in the Supporting Information Appendix.
One possible threat to the validity of any of our group comparisons is that voters are influenced by the polls and vote for the eventual winner, as the famous bandwagon effect suggests. In other words, one may object that voters have a reasonable guess about which party is likely to win or lose before casting their vote. Voters might be informed by the latest polls and thus might be influenced in their voting behaviour. While this is, of course, a possibility, there are several factors pointing towards this being less of a concern in our particular case.
First, it is important to note that voter volatility was high during the three elections our study covers, with values on Pedersen's index of 19.2, 22.5 and 15.2, respectively. This makes these Dutch elections some of the most volatile in Western Europe during this period of time (see van der Meer et al., Reference Meer, Lubbe, Elsas, Elff and Brug2012).
Second and connected to the first point, survey results from the 2010 Dutch National Election Study (van der Kolk et al., Reference Kolk, Aarts and Tillie2012) give testimony to the difficulty of predicting any of the electoral results. In the pre‐election wave, respondents were asked how many seats they expect from the five major parties (CDA, VVD, PvdA, PVV, and D66) to obtain in the election.Footnote 9 For the CDA, VVD, and PvdA respondents all estimated the same number of seats on average (between 26.1 and 26.9), even though the parties obtained quite different results in the end, namely 21, 31 and 30 seats, respectively. In a parliament of 150 seats, 10 political parties and basically no electoral threshold, already three seats, can make a real difference. Also, the predictions for the seat share of the PVV and D66 were far from correct. While respondents predicted on average 16.5 seats for the PVV and 14.5 seats for the D66, the final result returned around eight seats more for the PVV (= 24) and four seats less for the D66. Evidently, even just right before the election, it was difficult for citizens to foresee the electoral result, possibly as a result of the high electoral volatility.
Third, survey results from the post‐election surveys of the 2010 and 2012 Dutch NES also show that the vast majority of voters (2010: 78.9 per cent; 2012: 79.3 per cent) said that their vote choice was ‘not at all’ influenced by the polls.Footnote 10 Van Holsteyn provides further evidence for the unpredictability of the results in his election reports. He states that ‘no one would have predicted the results of 9 June [2010]’ (Reference Holsteyn2011, p. 416) and concludes for the 2012 electoral outcome that ‘the final results for no fewer than three of the parties were outside the confidence intervals employed by the opinion polls and the poll of polls that was based on the major polls.’ (Reference Holsteyn2014, p. 324) All of this suggests that neither the 2010 nor the 2012 electoral results were predictable in a climate of high voter volatility. This makes it very unlikely that people cast their vote, based on election polls, in order to be the winner/loser of the election.
Results
We subject our hypothesis to a very thorough test and evaluate it in total 16 times, that is, across two time periods (2006‐2010 and 2010–2012), two operationalizations of electoral defeat (oppositional status and vote share loss), two operationalizations of legitimacy beliefs (satisfaction with democracy and political trust) and two operationalizations of one‐time losers (WL and LW). We structure our presentation of results by different conceptions of one‐time losers and begin with the comparison between LL and WL.
Does having a history of losing affect voters’ legitimacy beliefs?
Table 3 shows the effects on satisfaction with democracy and political trust with control variables. We first turn to the results using the traditional operationalization of electoral defeat (columns 1–4), that is, voters of parties in government as winners versus voters of parties in opposition as losers.
The effect of LL versus WL; both operationalizations of losing and both time periods – First differences

Note: Standard errors in parentheses; ‘SWD’ denotes satisfaction with democracy.
The entries show the results of the first differences regressions where the dependent variable is the change in legitimacy beliefs between elections. The coefficients for the first time period demonstrate that LL compared to WL is associated with a decrease in satisfaction with democracy (column 1) and a decrease in political trust (column 2), but neither of these effects are statistically significant. Moving to the second time period (2010–2012), the results for satisfaction with democracy replicate, as the change in satisfaction with democracy is not statistically significant (column 3). However, the results for trust in political institutions differ (column 4) because LL is associated with a positive change in political trust that is also statistically significant (p < 0.05). Respondents who lost a second time in 2012 (compared to those who only lost in the 2010 election) experienced, on average, an increase in political trust by 0.171 between 2011 and 2012.
We obtain highly similar results when we operationalize losing through decreased vote share (columns 5–8). Losing twice (compared to WL) is not associated with a decrease in satisfaction with democracy, neither in the first (column 5) nor in the second (column 7) period of observation. In addition, political trust is not affected in any statistically significant way by losing twice in the first period (column 6). However, just as with the other operationalization and against our expectations, LL is again associated with an increase in political trust in the second time period (2010–2012). The effect is also statistically significant (p < 0.05).
In sum, these results on our first comparison of different losers (LL‐WL) show no support for our hypothesis because we find no dampening effect, neither for political trust nor for satisfaction with democracy. In fact, we even found evidence that repeated losers in the 2012 election are characterized by more political trust as compared to the group of WL. What emerges from our analyses is that having a history of losing does not negatively affect people's satisfaction with democracy. However, it changes political trust in – what seems to be – little systematic ways. We found twice no effects and twice positive effects.
Does an additional electoral loss affect voters’ legitimacy beliefs?
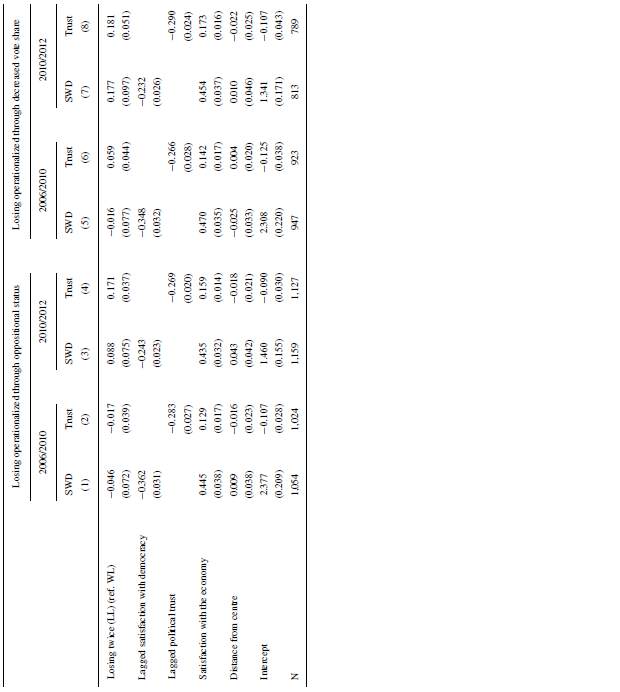
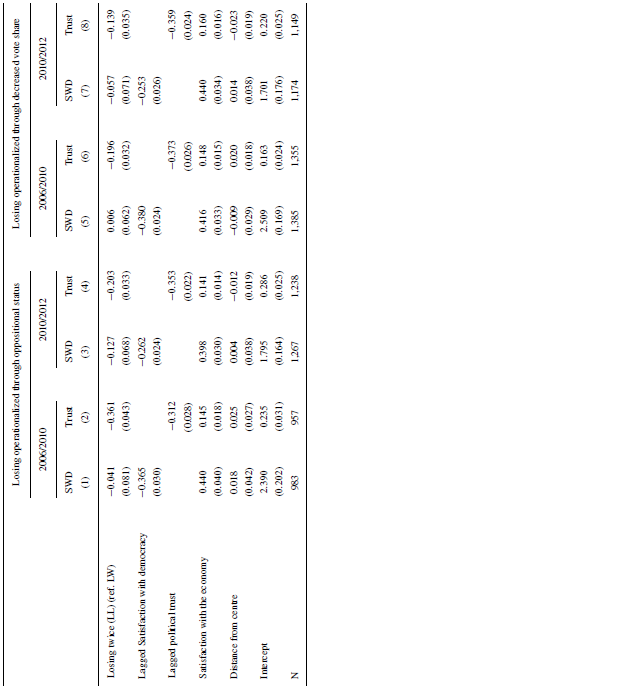
Turning to our second comparison, Table 4 documents the results of the first differences regressions for the comparison of repeated losers (LL) with those who only lost the first election (LW).
The effect of LL versus LW; both operationalizations of losing and both time periods – First differences

Note: Standard errors in parentheses; ‘SWD’ denotes satisfaction with democracy.
The coefficients again show consistently that repeated losers are not less satisfied with democracy than one‐time losers. Repeatedly losing has no statistically significant effect on satisfaction with democracy, in none of the two time periods and for none of the two operationalizations of losing (columns 1, 3, 5, and 7). Turning to trust in political institutions, however, we find that in line with our hypothesis, losing repeatedly does have an additional negative effect. Losing twice in a row decreases political trust and the effect is statistically significant at conventional levels. In addition, this result is very consistent as it holds for both operationalizations of losing and for both time periods (columns 2, 4, 6, and 8). Effect sizes are also substantial compared to the other coefficients, ranging between −0.139 and −0.361.
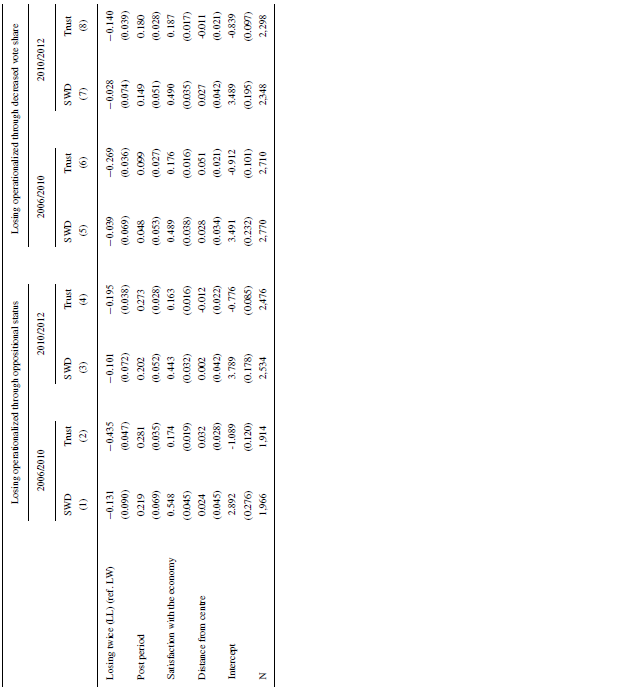
We can also causally identify the effects of an additional loss, compared to the LW group, using difference‐in‐differences regressions and the causal identification strategy described in the Supporting Information Appendix. The results in Table 5 confirm our findings from the first‐difference models. It shows the difference‐in‐differences estimates for losing repeatedly as measured by the change in satisfaction with democracy and political trust from before to after each of the elections in 2010 and 2012.
The effect of LL versus LW; both operationalizations of losing and both time periods – Fixed‐effects

Note: Standard errors in parentheses; ‘SWD’ denotes satisfaction with democracy.
As the first coefficient on repeatedly losing shows (column 1), changes in satisfaction with democracy amongst repeated losers do not differ from those who only lost the 2006 election. LL thus does not seem to have additional negative effects on satisfaction with democracy. This finding is confirmed when we move to the 2010 and 2012 elections (column 3) and replicates also when we operationalize losing through decreased vote shares (columns 5 and 7).
However, the effects on political trust are very different. In line with the hypothesis, losing access to government a second time in a row (i.e., in the 2006 and 2010 elections) has an additional negative and statistically significant effect on political trust, compared to losing in the 2006 election only. More precisely, we find that repeatedly losing decreases political trust by an estimated 0.435 (column 2) on average. Compared to the total range of the change in political trust of 6.1, this decrease corresponds to 7.1 per cent. We find a similar result when focusing on political trust after the 2012 election (column 4). Also, here, losing repeatedly decreases political trust even though the effect is smaller in size with an estimated 0.195 (p < 0.05), corresponding to a decrease of 2.9 per cent. The results are highly similar also for the alternative operationalization of electoral defeat. LL dampens political trust by 4.5 per cent in the first (column 6) and by 2.1 per cent in the second time period (column 8).
In sum, these results on our second comparison (LL–LW) show again only partial support for our hypothesis that repeatedly losing negatively affects legitimacy beliefs, but they do so in a very consistent manner. Whereas LL does have an additional, statistically significant, and causal effect on political trust, there is no additional effect on satisfaction with democracy.
What emerges from all these 16 tests is that, repeatedly losing is never associated with a decrease in satisfaction with democracy. The effects on trust in political institutions differ, however. While a history of losing, comparing LL and WL, has mixed effects (twice no effect and twice positive effects) on political trust, an additional electoral loss (comparing LL and LW) is consistently associated with a decrease in political trust. These results suggest that the effects on trust depend on the comparison group and hence on the timing of losing (i.e., WL as compared to LW).
Robustness tests
To assess the robustness of our statistically significant results, we provide a series of additional analyses that explore the party‐voter composition of one‐time losers, test assumptions for causal identification, add additional control variables, and decompose the trust index.
First, we delve into the robustness of the – unexpected – positive effects of repeatedly losing on political trust in the period of 2010/2012 and inspect which party‐voters belong to the different groups of losers in our analysis. While the compositions are heterogeneous (see Figure 1 and Table 2), what they have in common is that voters of the populist radical right party, PVV, are always in the WL group. However, as Rooduijn (Reference Rooduijn2018) and Akkerman et al. (Reference Akkerman, Zaslove and Spruyt2017) show, voters of the PVV are characterized by particularly low levels of political trust as compared to voters of other parties. Also in our sample, PVV voters (M = −0.61, SD = 1.07) demonstrate significantly lower levels of political trust already before the elections in 2011 (t(3809) = 13.00, p = 0.00) compared to voters of the other political parties (M = 0.12, SD = 0.89). This could explain our counterintuitive finding of a positive effect of repeatedly losing. Once we remove PVV voters from our analyses, the results indeed show that the positive effect of losing repeatedly is not robust (see Table A.2 in the Supporting Information Appendix). Without PVV voters, repeated losers (in terms of oppositional status) do not differ in their level of political trust from one‐time losers (i.e., WL). In addition, repeated losers (in terms of vote share) display now statistically significantly lower levels of political trust than one‐time losers (column 2). Note that this is also in line with our hypothesis.
We also probe the robustness of the negative effect of repeatedly losing on political trust when comparing repeated losers (LL) to those losers who recently won (LW). One of the core assumptions of difference‐in‐differences as a causal identification strategy is that of parallel trends. For the analysis above, for example, we assumed for the first time period that E[Y0i,2010 – Y0i,2009 |Di = 1] = E[Y0i,2010 – Y0i,2009 |Di = 0] (see also Supporting Information Appendix). It means that in the absence of repeatedly losing the average level of legitimacy beliefs amongst voters who lost twice, it would have followed a similar trend as the average level of legitimacy beliefs amongst voters who only lost the first time. In order to test this assumption and to lend credibility to our identification strategy, we estimated our difference‐in‐differences models for the period immediately before the additional election, that is, 2008–2009, 2010–2011 (see also Bechtel & Hainmueller, Reference Bechtel and Hainmueller2011).
The results in Table A.3 in the Supporting Information Appendix show that the groups’ trends are indistinguishable for seven out of eight models (two time periods × two operationalizations of legitimacy beliefs × two operationalizations of electoral defeat). Figures A.1 and A.2 in the Supporting Information Appendix also graphically document that the trends are parallel before the second election. Only in one out of these eight cases, namely political trust in the first time period (2006/2010) when losing is operationalized through oppositional status (Figure A.1 panel B), is the difference between the groups’ trends statistically significant already before the second election. We hence cannot interpret the dampening effect of losing repeatedly on political trust in 2010 (Table 5, column 2) as a causal effect. At the same time, the coefficient is just about statistically significant.
Across all other test cases, however, the estimates for the variables measuring the trends of different types of losers (i.e., LL vs. LW) are not statistically significant. Hence, in these cases levels of satisfaction with democracy and political trust follow almost identical trends in the period before the election, which supports the validity of our assumptions. These placebo tests are very important and substantially increase our confidence in the causal effects of repeatedly losing on legitimacy beliefs. They suggest that in the absence of an additional electoral defeat, both groups would have followed a similar trend.
Next, we included a measure of party sympathy with one of the losing parties in our models comparing LL and LW.Footnote 11 The variable distinguishes between respondents who do not express a high level of sympathy with any political party (reference category), those who sympathize with and voted for a party that won, and those who sympathize with and voted for a party that lost the elections. The LISS Panel asks respondents to express their sympathy for each of the parties on an 11‐point scale. We code respondents that expressed either a 9 or a 10 for a party as a party sympathizer, and subsequently distinguished between those who expressed sympathy and voted for a winning party and those who sympathize with and voted for a losing party. The inclusion of this variable replicates again our main findings (see Tables A.4 and A.5 in the Supporting Information Appendix).
Finally, we decompose the trust index and rerun our difference‐in‐differences analysis for the comparison of LL and LW on the different trust items separately (see Tables A.6 and A.7 for oppositional status and Tables A.8 and A.9 for vote share loss in the Supporting Information Appendix). Across all specifications, the results show that the second electoral defeat has a statistically significant negative effect on various components of our trust index. In fact, it lowers trust in the Dutch government, trust in the Dutch parliament, trust in politicians as well as trust in political parties, that is, the representative institutions. This shows that the negative effect of the second loss is not driven by a decline in trust in one specific institution, but rather stems from a more general loss of faith in all representative institutions.
Discussion
In this article, we argued that losing repeatedly depresses legitimacy beliefs more than losing occasionally, as losers are continually excluded from political power. Across 16 different tests involving different operationalizations of the main variables and different time periods from the same context, we only found support for our hypothesis when comparing changes in political trust between the groups of LL and LW voters. Two‐time losers (LL) were less trusting in political institutions than one‐time losers who won recently (LW) with effect sizes corresponding to decreases of between 2.1 and 7.1 per cent. In additional analyses, we also showed that most of these effects are indeed causal and that they result from decreases in trust in all representative institutions. On the other hand, we found no consistent evidence that a history of an electoral loss (comparing LL with WL) has negative effects on political trust. These findings suggest, in line with Curini et al. (Reference Curini, Jou and Memoli2012), that the timing of the loss plays an important role and that there is a recency effect, that is, individuals discount more distant negative experiences, and that trust can also be restored. However, one surprising but very consistent result across all of our 16 tests is that repeatedly losing is never associated with lower levels of satisfaction with democracy.
Our findings reveal a differential effect of repeated losing on trust in political institutions and on satisfaction with democracy. We propose that one possible explanation might be found in the differences in meaning and time horizon of these two concepts: satisfaction with democracy might be more strongly based on a retrospective evaluation and trust might have a more prospective component.
Although there is a large literature discussing the ambiguity and true meaning of satisfaction with democracy (see Canache et al., Reference Canache, Mondak and Seligson2001; Linde & Ekman, Reference Linde and Ekman2003; Norris, Reference Norris2011; van Ham et al., Reference Ham, Thomassen, Aarts and Andeweg2017), it is widely considered to measure citizens’ evaluations of the performance of democracy or ‘the actual workings of democratic regimes’ (Norris, Reference Norris2011, p. 77; Linde & Ekman, Reference Linde and Ekman2003). Researchers contend that the accompanying survey item ‘invites reflections on current affairs’ (Hooghe, Reference Hooghe and Uslander2018, p. 628) and that it is a broad indicator of accountability for recent democratic performance (Keman, Reference Keman2014; Linde & Ekman, Reference Linde and Ekman2003). The word ‘satisfaction’ or ‘satisfied’ arguably invites people to evaluate what has happened in the past.
While trust in political institutions also includes performance evaluations (Miller & Listhaug, Reference Miller and Listhaug O1990; van der Meer & Hakhverdian, Reference Meer and Hakhverdian2017), the word ‘trust’ also incorporates an element of belief about future behaviour. Hardin (Reference Hardin and Warren2000, p. 26) famously conceptualized trust as a relationship in which ‘A trusts B to do x,’ illustrating that ‘trust relationships are defined by the subject's degree of uncertainty and/or vulnerability about the future behaviour of the object’ (van der Meer Reference Meer2017, p. 5). Researchers have therefore used it as a broad indicator of citizens’ belief in the prospective performance of democracies and aspects thereof (see Keman, Reference Keman2014; Moehler, Reference Moehler2009; van Ham et al., Reference Ham, Thomassen, Aarts and Andeweg2017).
Interpreted in this light, our findings indicate that being repeatedly excluded from the benefits of electoral victory dampens citizens’ belief in the righteousness of political institutions and the prospective delivery of favourable outcomes – at least in the short term. It appears as if a repeated defeat spurs scepticism about the regime's institutions and their setup rather than the system's performance.
Surprisingly, we found first evidence of the importance of repeatedly losing in a country that essentially represents the prototype of a consensus democracy. Future research should replicate our findings in a more majoritarian system in order to strengthen our conclusions.
Our design improves on previous work by focusing on individual‐level change. Moreover, we conduct a thorough test on a least likely case, involving different operationalizations and also a plausible causal identification strategy. Nonetheless, our study still has some limitations which future studies can improve on. First, the LISS data are still recall data because the interview always took place in December and hence not immediately after the elections. To make sure respondents recall their choice correctly, it would, therefore, be desirable to replicate our study using multi‐wave panel data in which data collection takes place right after electoral results are known.
Second, future research could also delve into the precise causal mechanisms behind the effects of repeatedly losing. Our findings suggest that the mechanisms might not be uniform across elections or operationalization of electoral defeat (see for example Figures A.1 and A.2 in the Supporting Information Appendix). An experimental setup might be fruitful here for investigating under which circumstances repeated losers’ levels of trust remain stable, deteriorate, or even rise.
Third, since our treatment is binary, it necessarily does not consider by how much people won or lost. While our identification strategy allowed us to substantially improve on causal inference, future research could also consider whether the margin of a victory/loss (vote share or ministerial portfolios) matters for legitimacy beliefs.
Fourth, with more high‐quality panel data becoming available, another natural line for future research is to extend the study (a) to other political systems (also outside of Europe) to exclude the possibility of idiosyncratic factors and (b) to include even more electoral defeats because grave states of frustration may take longer to fully unfold. Studying even more electoral defeats, could also shed light on the existence of floor effects. It seems unrealistic that the decline of legitimacy beliefs due to repeated losses and the potential rise in those beliefs due to repeated wins follows a linear pattern, declining and rising endlessly.
Finally, our conceptual discussion also suggests that more research is needed into the differences between the two operationalizations of electoral victory/defeat, especially in terms of causal mechanisms. One very interesting line of research could, for example, investigate to what extent losers in multiparty systems experience an electoral defeat twice, once right when the electoral results are announced and a second time when the government is formed. Ultimately, we hope our study only marks the start for such endeavours.
Acknowledgement
We are grateful for valuable suggestions on previous versions of this article after presentations in 2017 at EPOP in Nottingham, at the Annual Meeting of the Dutch and Flemish Political Science Association in Leiden, and at the Midwest Political Science Meeting in Chicago. We would like to thank in particular Kathrin Ackermann, Andrew Daniller, Ruth Dassonneville, Göran Duus‐Otterström, Peter Esaiasson, Rob Johns, Kim Mannemar Sønderskov, Tom van der Meer, Lala Muradova, Dieter Stiers, Kim Twist, Pierre Wahl, Hannah Werner, and Christopher Wlezien for their advice and comments.
Funding
Kern acknowledges funding from the Research Foundation – Flanders (Belgium) (FWO, file n° 40370). Kölln acknowledges funding from Aarhus University Research Foundation (ref. AUFF‐E2017‐7‐13) and from Riksbankens Jubileumsfond (ref. RIK18‐1267:2).
Online Appendix
Additional supporting information may be found in the Online Appendix section at the end of the article:
Supplementary material
Table A.1. Descriptives.
Table A.2 The effect of LL versus WL in 2010/2012 on political trust; both operationalizations of losing, without PVV voters– First differences.
Table A.3. The effect of losing twice (2006 and 2010; 2010 and 2012) – Assumption tests (fixed‐effects).
Table A.4. The effect of losing twice (2006 and 2010; 2010 and 2012); losing twice operationalized through oppositional status; party sympathy as control – Fixed‐effects.
Table A.5. The effect of losing twice (2006 and 2010; 2010 and 2012); losing twice operationalized through decreased vote share; party sympathy as control – Fixed‐effects.
Table A.6. The effect of losing twice (2006 and 2010) on trust in different national political institutions separately; losing twice operationalized through oppositional status; – Fixed‐effects.
Table A.7. The effect of losing twice in terms of government access (2010 and 2012) on trust in different national political institutions separately – Fixed‐effects.
Table A.8. The effect of losing twice (2006 and 2010) on trust in different national political institutions separately; losing twice operationalized through decreased vote share; – Fixed‐effects.
Table A.9. The effect of losing twice (2006 and 2010) on trust in different national political institutions separately; losing twice operationalized through decreased vote share; – Fixed‐effects.
Table A.10. The effect of losing twice (2006 and 2010; 2010 and 2012); losing twice operationalized through decreased vote share, without SP and CU voters – Fixed‐effects.
Figure A.1. Trends for different legitimacy beliefs: comparing LL with LW the period 2006‐2010.
Figure A.2. Trends for different legitimacy beliefs: comparing LL with LW for the period 2010‐2012.
Supplementary information


 Open access