

Key messages
Chapter 2.4 gives an overview of user charges. User charges are out-of-pocket (OOP) payments made at the point of use for health services. Nearly all countries have some user charges, most commonly for medicines. They are intended to raise revenue and also to reduce the use of unnecessary health services and products. Key learning includes that:
User charges can generate revenues but have many unintended negative consequences – creating barriers to access, contributing to inequities and increasing the risk of financial hardship for households.
Health systems can reduce unnecessary or wasteful use of care without user charges by:
○ strengthening prescribing and referral systems to make sure care is appropriate;
○ offering information to steer patients and providers towards more cost-effective care.
Supply-side mechanisms that guide providers’ behaviour are more equitable and effective than demand-side mechanisms, such as user charges, and have fewer negative impacts on patients – especially those with chronic or severe conditions or the economically disadvantaged.
User charges are a suboptimal policy but – if they are to be used – health systems can mitigate the harm they cause and protect health care users through mechanisms such as exemptions, reduced co-payments, income-related co-payment caps and, to a lesser extent, price control and regulation.
Introduction
All health systems face the combined challenge of constrained financial resources and steady growth in health expenditures due to increasing demands for health care and expensive technological advances. In response, most health policy-makers have chosen – among a range of options, many of which are discussed in this volume – to put the onus for rationalizing health care use on patients themselves, by introducing user charges. In this chapter, we consider user charges (also referred to as user fees, cost-sharing or co-payments) as OOP payments at the point of use for covered services. They are intended to cover some portion of the cost of services, but not the full cost; for our purposes, this means that user charges do not include direct payments for non-covered services, nor informal payments. Likewise, some people may choose to obtain care privately, paying the full cost OOP due to perceptions about public sector quality or waiting times. Our focus in the chapter, however, remains firmly on OOP payments formally required for health services provided within the public system.
Ensuring that patients have “skin in the game” is thought by some to cause patients to carefully consider their care needs and only pursue expensive care which is necessary and high-value in terms of their health, thus reducing unnecessary utilization, enhancing efficiency and slowing expenditure growth. At the same time, user charges may be seen as required to generate additional revenue for the health system, further reducing budgetary pressures.
While these arguments capture the broad rationale for implementing user charges, the key question for policy-makers is whether the available evidence demonstrates that user charges work this way in practice. And, if that is the case, is there an “optimal” way to set the charges which improves a health system’s financial position without jeopardizing health outcomes and other health system objectives? What are the consequences if user charges are imposed on the wrong people, wrong services, at the wrong level or just generally in the wrong way?
The chapter falls into three main sections. The first looks at what user charges are and the forms that they take in different systems. The second section examines the policy’s effects both on households and health systems; we outline the rationale for introducing user charges in order to examine whether they achieve the objectives desired, as well as reviewing the evidence on the charges’ unintended consequences. The third section suggests ways forward for health systems implementing user charges: mechanisms to protect people from the adverse consequences, examples of successes and failures in practice, and policy lessons that can be drawn.
How are user charges used?
Fixed co-payments and percentage-based co-payments
There are two main ways that user charges are implemented: fixed co-payments and percentage-based co-payments. In a fixed co-payment system, some fixed amount of payment is required for a health care good or service, irrespective of the underlying cost of that item. This has an advantage in that it gives financial certainty to patients since they know how much they will pay in advance; it also may be more equitable since people will not face different prices just because they require different treatments (Thomson, Cylus & Evetovits, 2019). For example, in England, anyone required to pay for prescriptions paid a fixed fee of £9.35 per item in 2020/21 regardless of what the item was, although the price paid by the National Health Service for the 10 most commonly dispensed items actually ranged in cost from £1.12 for bisoprolol fumarate to £5.20 for metformin hydrochloride, with a mean cost per item of £2.09Footnote 1 (Wilson, Reference Wilson2021). Nevertheless, many less commonly prescribed items greatly exceed the fixed co-payment.
Alternatively, percentage-based co-payments mean that the amount paid OOP varies depending on the underlying price of an item. For example, a payer may require a 10% co-payment for a service, meaning that 10% of the cost is to be paid at the point of use by the patient; this may create some financial uncertainty for patients. While for very low-cost goods and services a health care user will end up paying a fairly small amount OOP using percentage-based co-payments, for big ticket items, the patient will have much greater financial exposure to cost. Ultimately, people with different conditions or those requiring different treatments may pay very different prices, exacerbating inequities. Sometimes, third-party payers decide to remove co-payments or apply lower percentage rates to items where they want to encourage uptake, and higher percentage rates to items that they perceive to have lower value, in an effort to dissuade use; this is referred to as value-based co-payments, value-based cost-sharing or value-based insurance (Chernew et al., Reference Chernew2008).
Reference pricing
Percentage-based co-payments can also be implied, rather than explicit. For example, the cheapest active substance may be covered in full by a third-party payer, or a third-party payer may set some maximum price that they are willing to reimburse through an alternative mechanism, with the patient paying the remainder if they choose a more expensive medicine or if a more expensive medicine is all that is available (Thomson, Schang & Chernew, Reference Thomson, Schang and Chernew2013). In practice, this functions similarly to an explicit percentage-based co-payment. This is the case in Lithuania where, often in addition to percentage-based co-payments, people pay the difference between the actual retail price and the reference price OOP; this system is known as internal reference pricing (Murauskienė & Thomson, Reference Murauskienė and Thomson2018). Internal reference pricing is often used to control costs but can have adverse effects on financial protection (WHO Regional Office for Europe, 2025a).
Mixing co-payments
Sometimes both fixed and percentage-based co-payments are used in tandem. One example is where percentage-based co-payments are used, but there is a fixed dispensing fee in addition. Such was the case in Greece, where a fixed co-payment was charged for outpatient services (€5) or admission to a state hospital (€25). In addition, percentage-based co-payments were in place for inpatient stays, medical devices and diagnostic or laboratory tests (Economou et al., Reference Economou2017). These percentage-based charges currently remain in place without the fixed co-payments, which were removed in 2015, but Greece has maintained this combination of fixed and percentage-based co-payments for prescription drugs. Users pay €1 per prescription along with a percentage-based co-payment, which is reduced for specific populations (Vogler et al., Reference Vogler2018).
User charges for prescriptions
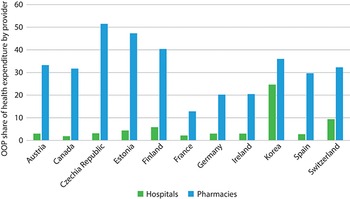
Any health service can have user charges, although they are most widely used for medicines and least commonly used for inpatient care. The outcome of this tendency can be seen in Fig. 2.4.1, where OOP spending disproportionately finances pharmacies as compared to hospitals. One possible explanation is that prescription drugs do not have the same natural supply constraints as other health services, which are typically labour-intensive and limited by the number of providers, facilities or technology available. Medicines, on the other hand, may be thought to require some other constraint to prevent inexorable increases in use and ultimately in expenditures.
However, evidence suggests that user charges do not temper demand for prescription drugs very much. For example, some research indicates that the demand for prescription drugs is largely price inelastic (less than proportionate); a 10% increase in price results in between a 0.2–5.6% decrease in use. Thus, implementing user fees shifts the burden of paying for medicines to patients rather than substantially decreasing total demand for prescriptions (Gemmill, Thomson & Mossialos, Reference Gemmill, Thomson and Mossialos2008). Other studies find that patients decrease adherence to treatment when faced with even a small co-payment, skipping doses or cutting pills in half (Gemmill, Thomson & Mossialos, Reference Gemmill, Thomson and Mossialos2008; Poirier et al., Reference Poirier1997; Hernández-Izquierdo et al., Reference Hernández-Izquierdo2019). These behaviours occur even among patients who are at a high risk of an adverse health event, such as a heart attack or stroke (Chandra, Flack & Obermeyer, Reference Chandra, Flack and Obermeyer2021). As a result, user charges may contribute to poorer health outcomes.
The unintended consequences outlined here are specific to prescription charges. In the section that follows we look at the consequences relating to user charges overall.
OOP spending disproportionately finances pharmacies as compared to hospitals

Figure 2.4.1 Long description
The y-axis notes the Share of providers from 0 to 60, while the x-axis lists the countries. Each country has two associated bars: Hospitals and Pharmacies. The approximate values are as follows. Austria: 3; 33. Canada: 2; 32. Czechia: 4; 51. Estonia: 4; 48. Finland: 6; 40. France: 2; 13. Germany: 3; 20. Ireland: 3; 20. Korea: 25; 37. Spain: 2; 30. Switzerland: 10; 32.
Intended and unintended effects
As mentioned at the outset of this chapter, there are two primary reasons why health systems apply user charges: to reduce unnecessary health care use and to raise revenues for the health system. Here, we first discuss the evidence on the extent to which these intended effects occur in practice. We then turn to two key unintended consequences of user charges: financial hardship and unmet need for health care.
Intended effect 1: to reduce the use of unnecessary health care
One of the main arguments used to justify user charges is that they are required to reduce unnecessary demand for health care, which they do by steering patient behaviour; this argument is underpinned by a concept called moral hazard. In technical terms, moral hazard refers to the idea that an individual will increase their exposure to risk if they do not bear the full cost of risk. In the context of health care, the concept implies that an individual will use more health care than needed if they do not have to pay for it themselves. There is a huge amount of literature on moral hazard in health care dating all the way back to Kenneth Arrow in 1963 (Einav & Finkelstein, Reference Einav and Finkelstein2018; Gagnon, Reference Gagnon2017; Arrow, Reference Arrow1963). Some also consider that moral hazard means people will not invest fully in their health (i.e. they will engage in poor health behaviours) if they do not face the costs of health care, which may in turn contribute to additional health spending, although this form of moral hazard has received less academic attention.
The seminal work from the RAND health insurance experiment of the 1970s in the USA is often touted as presenting some of the strongest evidence of the effects of user charges. Households were randomly assigned to different health plans that varied according to their degree of cost-sharing: one plan had zero cost-sharing, and all had an OOP cap above which full insurance kicked in (Aron-Dine, Einav & Finkelstein, Reference Aron-Dine, Einav and Finkelstein2013). The results from the RAND experiment were initially interpreted as showing that health spending does change with user charges, since patients with higher cost-sharing had significantly less overall health spending. Researchers have revisited the data, however, and argue that this difference is small, especially for inpatient care, but also for demand for prescription medicines (Aron-Dine, Einav & Finkelstein, Reference Aron-Dine, Einav and Finkelstein2013). Moreover, the experiment did not include people aged over 62 years old or people too disabled to work, limiting its relevance among groups most likely to use health services. Indeed, the RAND experiment’s results may not provide as strong a basis to claim that implementing user charges will create lower health care expenditure as some have previously argued.
Another criticism of the argument that user charges reduce unnecessary care is that patients are not consistently able to distinguish between efficient and inefficient uses of health care (Gemmill, Thomson & Mossialos, Reference Gemmill, Thomson and Mossialos2008). In the RAND experiment, participants reduced their use of both effective and ineffective care to nearly the same degree (Lohr et al., Reference Lohr1986). User charges can discourage patients from seeking preventive care or cause them to dismiss health concerns because of the cost associated with a medical consultation (Greenfield et al., Reference Greenfield2019; Swartz, Reference Swartz2010). While this may decrease health expenditures for a short period, it can cause a “squeezed balloon effect” and result in the increased use of other services which are free to use but costly to provide, such as inpatient hospital care or emergency care (Chandra, Gruber & McKnight, Reference Chandra, Gruber and McKnight2010; Thomson, Foubister & Mossialos, Reference Thomson, Foubister and Mossialos2010). Studies focused on patients with chronic conditions find a correlation between higher user charges for prescription drugs and a greater use of inpatient and emergency services due to reduced adherence (Tamblyn et al., Reference Tamblyn2001; Goldman, Joyce & Zheng, Reference Goldman, Joyce and Zheng2007; Swartz, Reference Swartz2010). Thus, broad user charges may not actually encourage patients to be selective about care but, rather, discourage them from seeking care altogether.
Intended effect 2: to raise revenues
The second key reason cited for policy-makers opting to use user charges is to raise revenues. However, compared to prepayment mechanisms, user charges are an inefficient and inequitable means to raise revenues since they are based on people’s health care needs as opposed to their ability to pay. Administrative costs associated with collecting user charges can also outweigh the revenue gains, especially when exemptions are introduced, which require additional oversight (Dupas, Reference Dupas and Culyer2014).
Despite their limited potential, user charges are perceived as an important source of funding in some countries, particularly at the facility level. For example, public hospitals in Kenya rely heavily on user charges due to low public funding (Kairu et al., Reference Kairu2021). Although user charges may only comprise a small amount of total revenues for a facility, they may be a more flexible source of revenues than other sources of funding if public financial management systems are quite rigid. User charges may be the only funds that facilities have complete control over, causing facilities to depend heavily on user charges to cover variable costs. In these settings it is possible to reduce or remove user charges, but this should be done in tandem with more flexible financial management and with additional funding to offset any losses.
One example of a country which has tried to remove user charges as a revenue-raising method is China. Prior to 2009, China allowed public hospitals to raise revenues from prescription medicines by imposing a 15% profit margin, but has since spent considerable effort attempting to do away with this (Li & Yu, Reference Li and Yu2021). The government created several policies to remove prescription drug mark-ups, including a pilot programme in 2015 and a full elimination of mark-ups from urban hospitals by September 2017. To compensate hospitals for this change, revenue structures were altered to receive larger government subsidies and increase the prices of medical services, although data are inconclusive on whether these measures have been sufficient to compensate facilities for the lost revenue (Cheng et al., Reference Cheng2021).
While the above highlighted the intended effects of a user charging policy, below we turn to two key unintended effects.
Unintended effect 1: financial hardship
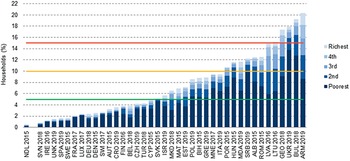
Unfortunately, there are a number of unintended adverse consequences commonly associated with user charges. One of the most commonly discussed consequences is financial hardship for those who utilize health services. For some households, OOP spending can either be so large in relation to a household’s ability to pay that it is considered to be catastrophic and, for others, OOP spending can push a household into poverty (Cylus, Thomson & Evetovits, Reference Cylus, Thomson and Evetovits2018). As shown in Fig. 2.4.2, in European countries, households in the poorest quintile have the highest level of catastrophic spending due to OOP payments, which includes user charges (WHO Regional Office for Europe (2023a); WHO Regional Office for Europe (2023b).
Households in the poorest quintile have the highest level of catastrophic spending due to OOP payments
ALB: Albania; ARM: Armenia; AST: Austria; AUT: Austria; BEL: Belgium; BIH: Bosnia and Herzegovina; BUL: Bulgaria; CRO: Croatia; CYP: Cyprus; CZH: Czechia; DEU: Germany; DEN: Denmark; FIN: Finland; FRA: France; GEO: Georgia; GRE: Greece; HUN: Hungary; IRE: Ireland; ISR: Israel; ITA: Italy; LTU: Lithuania; LUX: Luxembourg; LVA: Latvia; MAT: Malta; MDA: Moldova; MKD: North Macedonia; MNE: Montenegro; NDL: Netherlands; OECD: Organisation for Economic Co-operation and Development; OOP: out-of-pocket; POL: Poland; POR: Portugal; ROM: Romania; SRB: Serbia; SPA: Spain; SVK: Slovakia; SVN: Slovenia; SWE: Sweden; SWI: Switzerland; TUR: Türkiye; UKR: Ukraine; UNK: United Kingdom.
Note: Consumption quintiles are based on per person consumption using OECD equivalence scales. The Netherlands cannot be compared to other countries because the data used do not include the annual deductible amount households pay OOP for covered health care; our simulations suggest that catastrophic health spending is underestimated by up to 1.8 percentage points in the Netherlands in 2015. The lines represent a spectrum from lower to higher levels of financial hardship set at 5% (green line), 10% (yellow line) and 15% (red line). Source: WHO Regional Office for Europe (2023b).

Figure 2.4.2 Long description
The y-axis represents the households (percent) from 0 to 22, while the x-axis represents the L H S. Each bar is divided into 5 stacks representing the poverty quintiles. Three horizontal lines have been drawn a y equals 5, 10, and 15, respectively. Below 5 percent: Netherlands 2015, Slovenia 2018, Ireland 2016, U K 2019, Spain 2019, Sweden 2015, France 2017, Luxembourg 2017, Germany 2018, Denmark 2015, Switzerland 2017, Austria 2015, Croatia 2019, Finland 2016, Belgium 2018, Czechia 2019, Türkiye 2018, Cyprus 2015, and Slovakia 2015. Between 5 and 10 percent: Israel 2019, North Macedonia 2018, Malta 2015, Estonia 2019, Poland 2019, Bosnia and Herzegovina 2015, Greece 2019, Montenegro 2017, and Italy 2019. Between 10 and 15 percent: Portugal 2015, Hungary 2015, Moldova 2019, Serbia 2019, Albania 2015, Romania 2015, Latvia 2016, and Lithuania 2016. Above 15 percent: Georgia 2018, Ukraine 2019, Bulgaria 2018, and Armenia 2019.
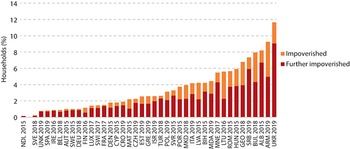
Impoverishing spending is another measure used to track financial protection. It captures the percentage of households (or the population) who, after making OOP payments, are pushed below a poverty line. Different methods use different poverty lines; the World Health Organization Regional Office for Europe defines the poverty line as the cost of meeting basic food and housing needs. Some analysts also consider households already below the poverty line who still spend OOP on health care as a part of this metric (sometimes referred to as the further impoverished). Fig. 2.4.3 shows recent data on the percentage of households in European countries with impoverishing spending (WHO Regional Office for Europe 2023a; WHO Regional Office for Europe 2023b).
OOP spending can push households below or further below the poverty line
ALB: Albania; ARM: Armenia; AUT: Austria; BEL: Belgium; BIH: Bosnia and Herzegovina; BUL: Bulgaria; CRO: Croatia; CYP: Cyprus; CZH: Czechia; DEU: Germany; DEN: Denmark; EST: Estonia; FIN: Finland; FRA: France; GEO: Georgia; GRE: Greece; HUN: Hungary; IRE: Ireland; ISR: Israel; ITA: Italy; LTU: Lithuania; LUB: Luxembourg; LUX: Luxembourg; LVA: Latvia; MAT: Malta; MDA: Moldova; MKD: North Macedonia; MNE: Montenegro; NDL: Netherlands; OOP: out-of-pocket; POL: Poland; POR: Portugal; ROM: Romania; SRB: Serbia; SPA: Spain; SVK: Slovakia; SVN: Slovenia; SWE: Sweden; SWI: Switzerland; TUR: Türkiye; UKR: Ukraine; UNK: United Kingdom.
Note: A household is impoverished if its total spending (consumption) is below the basic needs line after OOP payments (i.e. it can no longer afford to meet its basic needs) and further impoverished if its total spending is below the basic needs line (i.e. it is already unable to meet its basic needs) and it incurs OOP payments. The Netherlands cannot be compared to other countries because the data used do not include the annual deductible amount households pay OOP for covered health care; our simulations suggest that catastrophic health spending is underestimated by up to 1.8 percentage points in the Netherlands in 2015. Source: WHO Regional Office for Europe (2023b).

Figure 2.4.3 Long description
The y-axis represents the households (percent) from 0 to 14, while the x-axis represents the L H S. Each bar has two stacks: Impoverished and Further impoverished. From lowest to highest impoverished spending, the countries are: N D L 2015 (nearly 0), S V E 2018, S P A 2019, U N K 2019, I R E 2016, B E L 2018, A U T 2015, S W E 2015, D E U 2018, F I N 2016, L U X 2017, S W I 2017, F R A 2017, D E N 2015, C Y P 2015, C R O 2019, M A T 2015, C Z H 2019, E S T 2019, G R E 2019, I S R 2019, T U R 2018, P O L 2019, S V R 2015, P O R 2015, M K D 2018, I T A 2019, L V A 2015, B I H 2015, M D A 2019, M N E 2017, L T U 2016, R O M 2015, H U N 2015, G E O 2018, S R B 2019, B U L 2018, A L B 2015, A R M 2019, and U K R 2019 (nearly 12).
It should be noted that in most countries, financial protection metrics cannot distinguish between user charges for statutory benefits versus other OOP expenditures (i.e. direct payments), though there are some exceptions, for example, Japan (Hashimoto & Tokunaga, Reference Hashimoto and Tokunaga2021).
Unintended effect 2: unmet need for health care
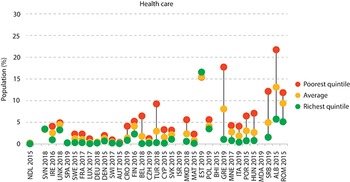
While some households experience financial hardship due to user charges, some simply are unable to use services altogether or use fewer services than needed because they cannot afford to pay user charges. These households are considered to have experienced unmet health care needs due to the cost of care. It should be noted there are other nonfinancial causes of unmet need, including a lack of available services and waiting times, among others (Fiorillo, Reference Fiorillo2020). However, financial reasons are often cited when people do not use health services. Fig. 2.4.4 shows unmet need due to cost, distance or waiting time for a selection of European countries. Low-income individuals are particularly vulnerable to experiencing unmet needs, especially when compared to the wealthiest residents of the same country.
Low-income individuals are particularly vulnerable to experiencing unmet needs for health care due to cost
ALB: Albania; AUT: Austria; BEL: Belgium; BIH: Bosnia and Herzegovina; CRO: Croatia; CYP: Cyprus; CZH: Czechia; DEU: Germany; DEN: Denmark; FIN: Finland; EST: Estonia; FRA: France; GRE: Greece; HUN: Hungary; IRE: Ireland; ISR: Israel; ITA: Italy; LUX: Luxembourg; MAT: Malta; MDA: Moldova; MKD: North Macedonia; MNE: Montenegro; NDL: Netherlands; OOP: out-of-pocket; POL: Poland; POR: Portugal; ROM: Romania; SRB: Serbia; SPA: Spain; SVK: Slovakia; SVN: Slovenia; SWE: Sweden; SWI: Switzerland; TUR: Türkiye; UNK: United Kingdom.
Notes: Countries are ranked from low to high by the incidence of catastrophic health spending. For catastrophic health spending, the Netherlands cannot be compared to other countries because the data used do not include the annual deductible amount households pay OOP for covered health care; our simulations suggest that catastrophic health spending is underestimated by up to 1.8 percentage points in the Netherlands in 2015. Health care refers to “medical examination or treatment”. Data on unmet need are for the same year as data on catastrophic health spending, except for Albania (2017) and the United Kingdom (2018). Unmet need quintiles are based on income.

Figure 2.4.4 Long description
The y-axis represents the population (percent) from 0 to 30, while the x-axis represents the L H S. Each country has three dots: Poorest quintile, Average, and Richest quintile. The richest quintile consistently stays at or below 5 percent for all countries (except Estonia 2019), while the poorest quintile is consistently placed higher than the other two (except Estonia 2019). Some countries like Greece, Serbia, Albania, and Romania, show particularly large gaps, with the poorest reporting percentages well above 10 percent.
Unmet needs naturally have consequences for health outcomes, though it can be challenging to draw direct links between the use of health services and health outcomes (Lagarde & Palmer, Reference Lagarde and Palmer2008). Self-assessed unmet need is correlated with worse future health outcomes (Gibson et al., Reference Gibson2019). Low-income populations are at a greater risk of poor health outcomes due to cost, showing the greatest reductions in health service utilization from implemented user charges (Swartz, Reference Swartz2010). A study of patients with chronic conditions found that, among those whose medication co-payments were raised, patients living in high-income areas were more likely to continue taking their medications than those living in low-income areas, exposing nonadherent patients to the risk and associated expenses of future medical complications (Swartz, Reference Swartz2010).
Policy relevance and conclusions
Protective mechanisms
There are a variety of approaches that can be used to protect people from the adverse consequences of user charges outlined above. Many of these can be considered under the broad umbrella of coverage policies. We identify and discuss four of these briefly below: exemptions and reduced co-payments; co-payment caps; price control and regulation; and voluntary health insurance (VHI).
Exemptions and reduced co-payments
The most straightforward approach to limit the risk of financial hardship caused by user charges is to create exemptions. Exemptions can be applied in a variety of ways. In some countries, people at a particularly high risk of financial hardship or frequent users of health care services are exempt from all user charges. In others, people are eligible for exemptions based on their age or occupation. Still, people may be exempt only for particular goods or services. For example, it is very common that someone with a particular disease may be exempt solely from user charges for all services related to treating that condition.
There are also instances where people are eligible to pay reduced co-payments, though they still must pay some nominal amount. In Ireland, low-income people and other groups based on age and health status are eligible to pay a low fixed co-payment for prescription medicines, rather than a percentage-based co-payment which may be more expensive (Thomson, Cylus & Evetovits, Reference Thomson, Cylus and Evetovits2019).
One challenge is that it can be difficult to identify people who are most at risk of experiencing financial hardship due to data issues. To identify who experiences financial hardship and who would benefit from exemptions, one needs up-to-date information on things like a household’s income or employment status, which, if available at all, may only be so with a delay. For example, someone’s employment status may not be available at a health facility level. Making such data available for these purposes can be costly. Additionally, in many cases, there are administrative hurdles to becoming recognized as exempt. This may result in people who are eligible for exemptions not receiving them, leaving them vulnerable to the burden of OOP payments.
Co-payment caps
Another commonly used mechanism is a co-payment cap or, alternatively, a co-payment maximum. In this case, individuals must pay user charges up until reaching a certain amount of spending, after which user charges are no longer required. This maximum can be an absolute amount (e.g. no more than €χ per individual spent) or a relative amount (e.g. no more than a certain percentage of gross annual income spent OOP). For example, in Austria, there is an income-related cap set at no more than 2% of the net annual income of the person in the household who pays for contributions to the social insurance system (WHO Regional Office for Europe 2023a, 2025b).
In Belgium, there is an OOP maximum, referred to as maximum billing, but the level varies across households. The maximum billing system places a ceiling on the amount spent in co-payments by a household per year. All households are eligible for the maximum billing system, with the ceiling dependent upon household income. Low-income households, children and those with a chronic illness are eligible for lower maximum billing ceilings as a form of financial protection (Bouckaert, Maertens de Noordhout & Van de Voorde, Reference Bouckaert, Maertens de Noordhout and Van de Voorde2023).
A cap might be applied to all spending on public health services, but there are often examples where the cap is applied to some services and not others. For instance, Cyprus has previously had an income-related cap which is determined by household income and number of children. However, this cap only applies to services provided in public facilities and excludes outpatient prescription medicines (Thomson, Cylus & Evetovits, Reference Thomson, Cylus and Evetovits2019; Kontemeniotis & Theodorou, Reference Kontemeniotis and Theodorou2021).
Some might consider deductibles to be a form of OOP caps. Deductibles are user fees where patients are responsible for paying for covered care up to a certain fixed amount, after which their insurance will kick in. Insurance may provide full coverage (covering 100% of costs, in which case it is the same as an OOP cap) or partial coverage after reaching the deductible. In Switzerland, there is a compulsory annual deductible, after which users still pay a 10% co-payment on any future health care charges (de Pietro et al., Reference de Pietro2015). With some health insurance providers, users can also opt to have a higher deductible and pay lower premiums. Total user charges (deductibles and subsequent co-payments) are eventually capped at a certain level depending on the size of the deductible. Given that most of the time deductibles do not offer a hard cap, they may be better thought of as simply a type of user charge (i.e. paying the full price up to some amount) rather than a protective mechanism.
Price control and regulation
In settings where health care users pay percentage-based co-payments, the price of a service has an effect on the risk of financial hardship. For example, 10% co-payments for a €5 medicine versus a €500 medicine will invariably mean very different levels of spending for an individual. There are mechanisms to control price growth, such as the use of health technology assessment (HTA) which are one tool that can enable purchasers to put some downwards pressure on medicines and medical technology prices, which go beyond the scope of this chapter (but see Chapter 2.2). Nevertheless, consumer prices need not reflect purchaser prices. It is important to highlight that variations in consumer list prices mean that individuals can face different risks of financial hardship depending on whether their condition is priced high or not.
VHI
Though it is not widely used, complementary VHI can be used to reimburse households for the cost of user charges (see Chapter 1.3). The risk of relying on VHI to protect households from the consequences of user charges is that, in many settings, only people who can afford to take up complementary VHI do so unless governments subsidize (or otherwise cover) VHI premiums. Slovenia has historically been an exception. In Slovenia up until 2024, the vast majority of residents voluntarily enrolled in a complementary VHI scheme to pay their co-payments. This meant that in practice, there was virtually no exposure to otherwise high co-payments (Albreht et al., 2021). While this system was advantageous from the perspective of ensuring financial protection, it raised questions about the purpose of having user charges in the first place. As of January 2024, Slovenia abolished co-payments and replaced them with a pre-paid levy to raise additional public funds. By doing this, Slovenia managed to eliminate VHI without substantial increases in out-of-pocket spending or catastrophic spending levels (Šarec E, Jošar D, 2025).
Evidence in practice: successes and failures in user charges implementation
Countries have implemented a number of user charge policies in recent years with varying success.
For example, Latvia introduced user charge exemptions in 2009 for its poorest households and further extended them in 2010 to include poor households. During this period, the country experienced a drop in catastrophic health care spending among the poorest quintile (Taube, Vaskis & Nesterenko, Reference Taube, Vaskis and Nesterenko2018). This change was successful in protecting poor users from experiencing additional financial hardship due to health care costs. However, in 2012, Latvia rolled back on these exemptions due to budgetary constraints, leading to a rise in catastrophic health care spending among the same quintile in 2013.
Several countries have tried to add small, fixed user charges to discourage unnecessary care and slow the rate of expenditure growth, but this strategy can also have unintended consequences. In 2004, Germany implemented a €10 user charge for a patient’s first outpatient visit of every fiscal quarter. At the same time, Germany replaced exemptions for low-income users with annual spending caps based on income. The total rise in OOP spending coming from these changes led to an increase in catastrophic spending on health care in the nation (Siegel & Busse, Reference Siegel and Busse2018). Additionally, there was an increase in the number of patients who avoided or delayed seeing a doctor because of the charge, especially among young adults and low-income patients (Rückert, Böcken & Mielck, Reference Rückert, Böcken and Mielck2008). The user charge was abolished in 2012, and catastrophic spending subsequently fell, but still remained elevated due to the concomitant abolition of exemptions.
User charges are used in nearly all countries but they are particularly common in LMICs that struggle to generate sufficient funding for health from domestic government resources. However, evidence has shown in these contexts that reducing user charges in LMICs is associated with better health outcomes, lower mortality, and improved chronic disease management (Qin et al., Reference Qin2019). Several studies attribute these improved outcomes to increased access to care due to lower user charges (McKinnon et al., Reference McKinnon2015; Sood et al., Reference Sood2014; Lamichhane, Sharma & Mahal, Reference Lamichhane, Sharma and Mahal2017). Although making progress towards universal health coverage may be more difficult in LMICs due to a lack of fiscal space, prioritizing it can prove beneficial for population health.
Policy lessons
User charges are a common, though as we have discussed in this chapter, also undesirable feature of health financing systems. While user charges are intended to steer health care consumption and raise revenue, alternative mechanisms may prove more effective at achieving these goals with fewer drawbacks. Implementing user charges can contribute to inequities in health care access, creating a financial barrier to care and contributing to unmet health care needs and financial hardship. Individuals with chronic health conditions or other severe conditions can be disproportionately impacted by user charges, both in terms of their health and finances (Swartz, Reference Swartz2010). It is important to consider the objectives of user charges, and whether user charges actually achieve these goals, in conjunction with their possible unintended effects, especially among vulnerable populations.
Alternative mechanisms can prove better at accomplishing the same goals as user charges without the detrimental effects. For example, referral systems (also referred to as gatekeeping) can be an effective way to steer patients to high-value care and minimize waste while also ensuring that patients are seeking appropriate care for their health concerns (McIntyre & Meheus, Reference McIntyre and Meheus2013). Another strategy is to target providers, rather than patients, with information and incentives to steer patients towards more cost-effective care (Chernew et al., Reference Chernew2021).
If user charges are deemed necessary for a health system, perhaps for political reasons, there are ways to implement them while still being mindful of equity and financial protection. Indeed, even looking across Europe, one can see countries with comparable reliance overall on OOP spending to finance the health system but vastly different rates of catastrophic spending. For example, in both Spain and Romania just over 20% of health spending is paid for OOP, but catastrophic spending in Spain is under 2% and in Romania it is over 12%. These differences can largely be explained by these countries’ different approaches to co-payment policy (WHO Regional Office for Europe, 2023a).
Exempting users who are most likely to experience financial hardship can prevent those who are on low income or have chronic conditions from facing high amounts of user charges. Additionally, when applied to all services, caps can be an effective method of limiting OOP costs. To prevent high spending on costlier services or medicines, fixed co-payments are a better alternative to percentage-based co-payments.
User charges can act as barriers to care, preventing vulnerable groups from seeking health care due to costs. While it is one of the most common strategies to attempt to steer health care and keep expenditures low, the wide use of user charges does not necessarily mean that it is the best or most effective policy to achieve these goals. Equitable reform or alternative policies may prove better at decreasing unmet health care needs and improving health outcomes.Footnote 2

 Open access