

1. Introduction
An ice stream with spatially variable basal drag might behave in fundamentally different ways from one with uniform drag. Recent data from the Siple Coast ice streams of West Antarctica (Table 1) are consistent with, although not proof of, the existence of localized sticky spots supporting high basal shear stress and surrounded by a generally well-lubricated, low shear-stress bed. Here, I use simple theory and available data to explore the possible behavior of variations in basal drag. My goals are to recommend field experiments to study such variations and to provide an interim assessment of their likely importance to ice-stream dynamics, pending the outcome of field work.
Evidence suggesting spatially variable drag under Siple Coast ice streams

Modern ice-flow models typically resolve variations in basal drag on length scales > O(10h) and perhaps > O(h), where h is the ice thickness (e.g. Reference Whillans and JohnsenWhillans and Johnsen, 1983; Reference Balise and RaymondBalise and Raymond, 1985), but rely on parameterizations for sub-grid-scale basal processes. However, the parameterizations (e.g. Reference WeertmanWeertman, 1964) typically are based on physics of processes at length scales < O (10 m), which are assumed to apply homogeneously to the intermediate length scale of O(10 m) to O(h to 10h). Inhomogeneity of basal drag at this intermediate scale would produce sub-grid-scale sticky spots, which are my concern here.
Reference LliboutryLliboutry (1987) stressed the possibility that freezing of inland ice to high spots of bedrock roughness from the decametric (101 m) to the kilometric (103 m) scale may produce sticky spots in regions of widespread basal melting. This may contribute significantly to restraint of ice flow in central regions of East Antarctica and West Antarctica, where ice velocities are low despite apparently high basal water pressure. Lliboutry noted that freezing of fast-moving ice to basal highs is unlikely, because the rapid motion would dissipate enough heat to melt the ice. I concentrate on fast-moving ice streams, and therefore do not consider thermal sticky spots further here.
2 Simple Models
In the following sections, I define four sticky-spot models, discuss their geometry (Fig. 1a–d) and evaluate the likelihood of their existence under an ice stream. I pay special attention to how “sticky” each might be; i.e. to the maximum shear stress that could be supported on each.
Cartoons of sticky spots and their effects on steady subglacial hydraulic potentials. The potential is Φ = Φ + 104 Δzs + 103 Δzb – K
nΔτb, where Φ reflects the large-scale average relative to an arbitrary datum, and Δzs, Δzb, and τb, are perturbations in the surface and bed elevation and shear stress, respectively, from regional trends, a. Sticky spot caused by discontinuity of soft till, without perturbation of upper or lower surfaces of ice. If the shear stress rises too rapidly away from the rock outcrop, water will flow towards the outcrop from all sides and accumulate there. This will lubricate the sticky spot and limit its shear stress, b. Sticky spot caused by a long flute of the same material as the rest of the bed, without perturbation of upper ice surface. Water will drain away from the flute, reducing the lubrication and increasing the shear stress on the flute above that for a horizontal bed. From Equation (6), this geometric effect of the flute is ![]() , where the one-dimensional solution now is transverse to the long flute and the regional potential gradient in that direction is zero. c. Surface high over an unperturbed bed. The geometric perturbation raises the hydraulic potential locally and allows an increased shear stress, which in turn lowers the hydraulic potential to reach a balance. From Equation (6), the increase in shear stress under the surface high is
, where the one-dimensional solution now is transverse to the long flute and the regional potential gradient in that direction is zero. c. Surface high over an unperturbed bed. The geometric perturbation raises the hydraulic potential locally and allows an increased shear stress, which in turn lowers the hydraulic potential to reach a balance. From Equation (6), the increase in shear stress under the surface high is ![]() d. Sticky spot caused by a bedrock knob, with or without a lubricating layer of till on top. Ice flows around such a feature by enhanced creep, with little effect from lubrication tangential to the surface. A water-filled cavity may form in the lee of such a feature but may be largely isolated from the general subglacial water flow; hence, no cartoon of potential is shown.
d. Sticky spot caused by a bedrock knob, with or without a lubricating layer of till on top. Ice flows around such a feature by enhanced creep, with little effect from lubrication tangential to the surface. A water-filled cavity may form in the lee of such a feature but may be largely isolated from the general subglacial water flow; hence, no cartoon of potential is shown.

2.1. Interconnected water
Suppose that a bed of an ice stream is thawed everywhere, such that a soft deformable till prevents high basal shear stress in most areas, but that discontinuity of the till allows sticky spots (Fig. 1a). High basal water pressure is needed to make till soft. Sticky spots then will have high basal water pressure; otherwise, water would flow into them from the surrounding till and accumulate until their water pressure was raised. Mountain glaciers move with ice-stream velocities if basal water pressures are high and shear stresses approach 100 kPa (e.g. Reference KambKamb and others, 1985; Reference Iken and BindschadlerIken and Bindschadler, 1986). Thus, if their velocity-dependence on water pressure and shear stress is similar to those of mountain glaciers, ice-stream sticky spots of the type shown in Figure 1a should not support basal shear stresses much over 100 kPa.
A postulate by Reference WeertmanWeertman (1972), if true, places a more restrictive upper limit on the shear stress supported by sticky spots of this type. Reference WeertmanWeertman (1972) suggested that the potential function that drives subglacial water flow is
where g is the gravitational acceleration, ρ i is the density of ice, ρw is the density of water, z s is the ice-surface elevation, zb is the elevation of the glacier bed, τ b is the basal shear stress and K n is a non-dimensional constant of 0(1). The first two terms on the righthand side of Equation (1) account for the ice-overburden pressure and the potential due to the elevation of the subglacial water.
(Reference WeertmanWeertman 1972; also Reference Robin and WeertmanRobin and Weertman, 1973) based the third term on the righthand side of Equation(1) on the following assumptions:
-
(a) The basal shear stress is supported by the form drag of bumps on the glacier bed rather than by any adhesion of ice to the bed.
-
(b) Ice flow over these bumps creates high-pressure and low-pressure regions.
-
(c) Basal water is squeezed out of the high-pressure regions and accumulates in the low-pressure regions.
-
(d) The low-pressure regions are interconnected and allow water drainage.
-
(e) The variability of ice–bed contact pressure increases with increasing shear stress, causing the water pressure to decrease with increasing shear stress.
Points (a)–(d) are supported by observations that the water pressure beneath Upstream Β camp (UpB) on Ice Stream B, West Antarctica, is slightly less than the ice-overburden pressure (Reference Blankenship, Bentley, Rooney and AlleyBlankenship and others, 1987b; Reference Engelhardt, Humphrey, Kamb and FahnestockEngelhardt and others, 1990). Point (e) has not been tested, so Equation (1) must be considered an hypothesis.
In support of Equation (1), however, a decrease in water potential with increasing shear stress is a common feature of many steady-state basal models, including both cavity and film types (e.g. Reference WalderWalder, 1986; Reference KambKamb, 1987; Reference LliboutryLliboutry, 1987; Reference AlleyAlley, 1989a). The close approach of subglacial water pressure (Pw) to ice-overburden pressure (P i) beneath inland ice at Byrd Station (P i – P w ≈ 140 kPa; Reference Alley, Blankenship, Bentley and RooneyAlley and others, 1987a) and beneath UpB (Ρ i – P w ≈ 50 kPa; Reference Blankenship, Bentley, Rooney and AlleyBlankenship and others, 1987b), with both water potentials far above the boundary condition of flotation at the grounding line (by about 14 MPa for Byrd Station and 2.5 MPa for UpB), suggests that a “local” equation such as Equation (1) with no dependence on the grounding-line potential is appropriate in West Antarctica. Also, West Antarctica lacks the large non-steady forcings through moulins and lowpressure channels that might complicate application of Equation (1) to a temperate mountain glacier. Thus, I will adopt Equation (1) for further calculations.
The third term on the righthand side of Equation (1) is properly ignored in models at the ice-sheet scale, although it must be considered for sticky spots. To see its insignificance at the ice-sheet scale, compare it to the first two terms in Equation (1):

For simplicity, set zb
= 0, with z
s – z
b = h. At the ice-stream or ice-sheet scale, ![]() where L is the characteristic flow-line length and h/L is the surface slope. Then
where L is the characteristic flow-line length and h/L is the surface slope. Then ![]() With Kn
∼ 1 and h/L ∼ 10−3, λ ∼ 10−3, which is insignificant.
With Kn
∼ 1 and h/L ∼ 10−3, λ ∼ 10−3, which is insignificant.
The third term in Equation (1) is important at the sticky-spot scale, because of its effect on water flow and bed lubrication. Water flows in the negative direction of the potential gradient ![]() Simplifying Equation (1) to one dimension for convenience and calculating Ψ
1-d with K
n assumed independent of position yields
Simplifying Equation (1) to one dimension for convenience and calculating Ψ
1-d with K
n assumed independent of position yields


where dimensions are in the MKS system. Steady-state water drainage requires Ψ
1-d < 0, which places constraints on ![]() and thus on how sticky a sticky spot of given size can be.
and thus on how sticky a sticky spot of given size can be.
We can write Ψ 1-d as

where primes indicate perturbations from the regional trends and Ψ
1-d is the regional potential gradient averaged over distances that are long compared to the 10 ice-thickness upper limit on sticky-spot size. As shown in Equation (2), Ψ
1-d depends on the regional surface and bed slopes but not on gradients in basal shear stress. If we approximate a sticky spot as having maximum perturbations of ![]() and
and 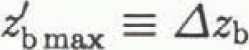 over length xs, and require Ψ
1-d < 0 to allow steady-state drainage, then the perturbation of the shear stress, Δτb, must be
over length xs, and require Ψ
1-d < 0 to allow steady-state drainage, then the perturbation of the shear stress, Δτb, must be

If the sticky spot is xs < 10h in length, then Δτb has a maximum value, Δτb max, given by

Equation (6) shows that if the ice-surface and bed slopes are not perturbed from their regional averages, the shear stress on a sticky spot can exceed that in surrounding, well-lubricated regions by no more than ![]() This can be increased if the bed is raised (e.g. over a drumlin or flute; Fig. lb) or the surface is raised (e.g. beneath an ice raft; Fig. 1c), with perturbations in surface elevation potentially ten times more effective than perturbations in bed elevation.
This can be increased if the bed is raised (e.g. over a drumlin or flute; Fig. lb) or the surface is raised (e.g. beneath an ice raft; Fig. 1c), with perturbations in surface elevation potentially ten times more effective than perturbations in bed elevation.
2.2. Isolated bumps
Equation (1) is based on Reference WeertmanWeertman’s (1972) interpretation of the basal-sliding models of Reference NyeNye (1969) and Reference KambKamb (1970). Those models assumed Fourier beds with small slopes and continuous roughness spectra (usually calculated for white roughness), and Reference WeertmanWeertman (1972) assumed an interconnected water system responding to that roughness. These assumptions need not be valid — a drumlin field may have little roughness between the clast size and the drumlin size, for example. It is common in models to separate the drag of the larger bumps (> O(0.1–1 m)) and their interaction with the basal-water system from the effects of smaller obstacles (e.g. Reference WeertmanWeertman, 1986).
Ice moves over large bumps primarily by enhanced creep. For a white-roughness bed, most of the restraint on ice flow is provided by relatively small bumps (O(10−3-10−2m amplitude)), and restraint decreases with increasing bump size. However, a deforming till may allow the smaller obstacles to move with the ice, causing large obstacles fixed in the bedrock to provide the major restraint to ice flow (Fig. 1d).
The force, D, needed to move ice at velocity u over a large, equant obstacle of typical dimension a is approximately

where u is the pre-factor and n = 3 is the exponent for power-law creep (e.g. Reference WeertmanWeertman, 1964). This result is controlled primarily by the form drag of the bump (the geometric requirement that ice moves around the obstacle) rather than dynamic drag (the tangential friction between the ice and the obstacle (Reference WeertmanWeertman, 1964)). The drag for a free-slip boundary between ice and bump is two-thirds of that for a no-slip boundary in linear-viscous ice (n = 1; Reference HalletHallet, 1979; Reference WattsWatts, 1974), and ![]() = 0.87 of that for a no-slip boundary with n = 3. Details of behavior at the boundary between ice and a large bump thus can be ignored to good approximation.
= 0.87 of that for a no-slip boundary with n = 3. Details of behavior at the boundary between ice and a large bump thus can be ignored to good approximation.
Sliding models usually assume that the number of obstacles per unit area of the bed, N ∼ a−2. For large obstacles (a > O (0.1–1 m)), the contribution of obstacles of size a to the basal shear stress, τa = ND, then varies as

Equation (8) contains the usual result that the importance of large obstacles in restraining basal sliding decreases with increasing size. However, as noted above, smaller obstacles in a deforming till may move past larger obstacles fixed in bedrock, so that u = u(a). If u increases more rapidly than a, then large obstacles will be more important in restraining ice flow than small ones and may act as sticky spots, regardless of whether the deforming layer passes over or around the larger obstacles.
3. In Search of Siple Coast Sticky Spots
The new observations suggesting sticky-spot existence (Table 1) have been made on the Siple Coast ice streams of West Antarctica, and ongoing field programs offer the possibility of identifying and characterizing sticky spots there. The most comprehensive data set has been collected on Ice Stream B, especially near the UpB camp. In the next sections, I apply the general relations derived above to conditions on Ice Stream Β to learn what sticky spots are likely there and how they might be detected.
3.1. General considerations
Characteristics of branch B2 of Ice Stream Β between the 520 and 320 m surface-elevation contours are listed in Table 2 (Reference Shabtaie and BentleyShabtaie and Bentley, 1988). The long-profile of the ice stream is concave-up and the ice thins down-glacier, so the driving stress and the magnitude of the potential gradient for water flow could be increased or decreased, respectively, by moving the interval under consideration up-glacier or down-glacier.
Ice-stream charactertics. Data estimated from maps of Reference WalderShabtaie and Bentley (1988) for branch B2 of Ice Stream B, between the 520 and 320 m surface-elevation contours

The basal shear stress is not known. We (Reference Alley, Blankenship, Bentley and RooneyAlley and others, 1987b) estimated a local value of τb 20 kPa near the Upstream Β camp, based on assumed small side-shear stress and a measured (Reference Shabtaie and BentleyShabtaie and Bendey, 1987) local driving stress of about 25 kPa, which is somewhat larger than the regional average of about 14 kPa (Table 2). In contrast, Reference Whillans and van der VeenWhillans and Van der Veen (1993) calculated very low — locally negative — basal shear stresses in parts of Ice Stream Β just up-glacier from that section we studied, where the driving stress is locally much smaller than the regional average.
Over long distances, gradients in longitudinal and bridging stresses should have little effect on the ice flow (Reference PatersonPaterson, 1981, p. 101), leaving the sides and bed of the ice stream to support the driving stress. A side-shear stress of l00 kPa would support about half of the average driving force from a typical ice-stream width of 33 km across branch B2, leaving a basal shear stress of 7 ± 3 kPa. A side shear approaching 200 kPa would support essentially the entire driving stress. Fabric development and strain heating in the shear margins might cause them to support less than l00 kPa (Reference HughesHughes, 1977), leaving a relatively large basal shear stress in excess of 10 kPa. I suggest an average basal shear stress of 10 kPa. The basal shear stress almost certainly lies between the driving stress and the unconfined strength of subglacial till in a shear box, which is around 2 kPa (Reference KambKamb, 1991).
3.2. Water-pressure measurements and discontinuous till
If soft till limits the basal shear stress on an ice stream, then localized regions of thin or no till such as imaged by Reference Rooney, Blankenship, Alley and BentleyRooney and others (1987) should act as sticky spots, even though the upper and lower surfaces of the ice are not perturbed. Then provided Equation (1) proves to be valid, the water pressure over these thin-till regions should be lower than in surrounding regions. Thus, water-pressure measurements might be used to identify sticky spots.
The constant K n in Equation (1) might be as small as Kn ≈ 2 for a rough bed, or as large as K n ≈ 9 for a smooth bed (Reference KambKamb, 1970). A till bed is likely to be rough, based on theory and observation (see section on sliding in Reference AlleyAlley (1989b)), so I choose K n = 3 here with a likely range of 2 ≤ K n ≤ 5.
For h = 1100 m, K
n = 3 and ![]() , Equation (6) yields
, Equation (6) yields
where Δ zs and Δ zb are perturbations in meters of surface and bed elevation, respectively, from the regional trends.
If sticky spots occupy fractional area s and support shear stress τbs, and lubricated regions occupy fractional area 1 – s and support τbl then force balance requires
where ![]() is the average basal shear stress. In the limit s → 0 (few sticky spots),
is the average basal shear stress. In the limit s → 0 (few sticky spots), ![]() , and a sticky spot with Δ
zs
Δ
zb = 0 (no topographic expression) might support a shear stress
, and a sticky spot with Δ
zs
Δ
zb = 0 (no topographic expression) might support a shear stress ![]() The length scale used in Equation (6) may be too large by a factor of 2 (the shear stress must rise and then fall in the 10h length allotted to the sticky spot), so τ
bs might instead be 10 + 22 ≈ 32 kPa.
The length scale used in Equation (6) may be too large by a factor of 2 (the shear stress must rise and then fall in the 10h length allotted to the sticky spot), so τ
bs might instead be 10 + 22 ≈ 32 kPa.
The error range introduced here is important. Errors in estimating subglacial water pressures seismically or in boreholes are likely to be a few tens of kPa or more, even under favorable conditions (Reference Alley, Blankenship, Bentley and RooneyAlley and others, 1987a; Reference Blankenship, Bentley, Rooney and AlleyBlankenship and others, 1987b; Reference Engelhardt, Humphrey, Kamb and FahnestockEngelhardt and others, 1990). With K
n = 3, ![]() might produce a detectable change in basal-water pressure, whereas the water-pressure effect of
might produce a detectable change in basal-water pressure, whereas the water-pressure effect of ![]() would be close to, or less than, the measurement error. Thus, we cannot tell whether a sticky spot without topographic expression would be detectable by its effect on water pressures measured with modern techniques, but such an experiment would not have a high probability of success.
would be close to, or less than, the measurement error. Thus, we cannot tell whether a sticky spot without topographic expression would be detectable by its effect on water pressures measured with modern techniques, but such an experiment would not have a high probability of success.
A raised bed could increase the maximum possible water-pressure effect of a sticky spot, but this effect probably will not be important on Ice Stream B. From Equation (9), a feature 100 m high would be required to increase the maximum shear stress by 30 kPa, only marginally detectable in water-pressure measurements; however, seismic surveys near UpB by Reference Rooney, Blankenship, Alley and BentleyRooney and others (1987) revealed no local roughness elements as large as 10 m.
The data from near UpB allow rather restrictive limits to be estimated for the importance of sticky spots there. Reference Rooney, Blankenship, Alley and BentleyRooney and others (1987) and Reference RooneyRooney (1988) conducted seismic studies just up-glacier of UpB in a region about 10h by 10h, where h ≈ 1000 m. They found that low-velocity, presumably soft till covers > 97–98% of the bed, with till thinner than the seismic resolution of 2 m on 2– 3% of the bed. The ice surface and the bed were nearly smooth, so ![]() and
and ![]() in Equation (9) and
in Equation (9) and ![]() Then, in Equation (10), τ
bs < τ
bl +44 KPa and s < 0.03. Estimating
Then, in Equation (10), τ
bs < τ
bl +44 KPa and s < 0.03. Estimating ![]() from Table 2 (possibly the largest source of error, but a reasonable guess given the relatively high driving stress in the survey region), the lubricated regions support a shear stress of τ
bl > 8.7 kPa. Thus, the lubricated regions support more than 87% of the basal shear force, leaving < 13% of the basal-shear force supported on sticky spots and suggesting that sticky spots do not dominate the force balance in this region of Ice Stream B.
from Table 2 (possibly the largest source of error, but a reasonable guess given the relatively high driving stress in the survey region), the lubricated regions support a shear stress of τ
bl > 8.7 kPa. Thus, the lubricated regions support more than 87% of the basal shear force, leaving < 13% of the basal-shear force supported on sticky spots and suggesting that sticky spots do not dominate the force balance in this region of Ice Stream B.
3.3. Strain grids and ice raft “a”
Surface topography is about ten times more effective than bed topography in affecting subglacial water flow and the “stickiness” of the bed. Suppose a local high with lateral dimensions similar to or larger than the ice thickness were placed on the ice surface over a homogeneous, unperturbed bed. This would raise the potential of underlying water, and would cause water from up-glacier to flow around the high. But, without a supply of lubricating water, the bed beneath the high should become stickier and support a higher shear stress. That, in turn, would lower the water potential beneath it, reducing the diversion of water. From Equation (9), the shear stress could not be increased by more than about 3Δ zs kPa, if Δ a is in meters. A 10 m surface perturbation could produce a shear stress as much as 30 kPa above the regional value.
Ice raft “a” (formerly ice rise “a”), near the mouth of Ice Stream B, is an elliptical feature about 10 km by 5 km with its long axis parallel to the ice flow, and stands a few meters above the surrounding ice (Reference Bindschadler, MacAyeal and ShabtaieBindschadler and others, 1987; Reference Shabtaie and BentleyShabtaie and Bentley, 1987). Flow lines appear to pass around it, and its radar signature is different from its surroundings but similar to the signature of an ice rise in an ice shelf. It therefore appears to be a discrete mass of ice with ice-stream flow passing by, and is an obvious candidate for a sticky spot caused by surface topography. However, measurements indicate that its speed is similar to that of the surrounding ice or only slighdy slower, by perhaps 10–20 m a−1.
Assuming a height of ![]() , Equation (9) predicts that the peak shear stress beneath the ice raft should exceed the regional value by no more than 15 kPa. Approximating the ice raft as a circular cylinder of radius a = 5 km, and assuming linear variation of basal shear stress from the regional value at the margin to the maximum value at the center, the bed could support an excess shear force as large as D ≈ 1011 N.
, Equation (9) predicts that the peak shear stress beneath the ice raft should exceed the regional value by no more than 15 kPa. Approximating the ice raft as a circular cylinder of radius a = 5 km, and assuming linear variation of basal shear stress from the regional value at the margin to the maximum value at the center, the bed could support an excess shear force as large as D ≈ 1011 N.
For linear fluid of viscosity μ flowing at right-angles to the axis of an infinite circular cylinder, the drag per unit length, D/l, is approximated by

where μ is the velocity of the fluid far from the cylinder relative to the cylinder, ρ is the fluid density and α is the cylinder radius (Reference BatchelorBatchelor, 1967, p. 243–44). For ice raft “a”, ρ = ρ i ≈ 900 kg m−3, α ≈ 5000 m, the total length, l, is the ice thickness of about 750 m and the drag force D ≤ 1011 Ν. It is therefore possible to estimate an upper limit on the relative velocity of the ice past the ice raft if the viscosity can be estimated.
A force of < 1011 Ν distributed evenly over the surface of a cylinder 750 m high with a 5 km radius yields an average stress of < 4 × 10³ Pa. Using the longitudinal stresses calculated by Reference Bindschadler, MacAyeal and ShabtaieBindschadler and others (1987) from a strain grid near ice raft “a”, the regional effective stress τ2 ≈ (4 × 10⁴ Pa)2. Including the local stress around the ice raft would not increase this greatly, so I assume that the regional effective stress applies near the ice raft. The effective viscosity can then be calculated as ![]() Taking
Taking ![]() appropriate for a temperature of-15°C (Reference PatersonPaterson, 1981, p. 39), yields μ ≈ 2 × 10¹⁵ Pa s. Then, solving Equation (11) for u gives u < ≈ 12 m a−1, which falls within the error limits of the observations.
appropriate for a temperature of-15°C (Reference PatersonPaterson, 1981, p. 39), yields μ ≈ 2 × 10¹⁵ Pa s. Then, solving Equation (11) for u gives u < ≈ 12 m a−1, which falls within the error limits of the observations.
In the vicinity of ice raft “a”, the driving stress for ice flow varies from 20 to 2kPa or less (Reference Bindschadler, MacAyeal and ShabtaieBindschadler and others, 1987). A sticky spot spanning kilometers with a shear stress a few kPa higher than its surroundings may be a significant feature in the force balance there, even though there is no large velocity difference between it and its surroundings. A strain grid across its margins or very accurate velocity measurements would be needed to learn whether ice raft “a” is moving slower than its surroundings and acting as a sticky spot.
A careful calculation would allow for the elliptical shape of the ice raft and for some other factors, but it does not seem warranted given the lack of a strain grid or detailed measurements of surface topography across the ice raft. In general, for a sticky spot of given area, an elliptical form elongated parallel to ice flow would give a larger velocity differential for a given drag than for a circular feature, making it easier to detect an elliptical sticky spot through measurement of differential velocity.
3.4. Bedrock roughness: the form drag of knobs
The seismic surveys of Ice Stream Β by Reference Rooney, Blankenship, Alley and BentleyRooney and others (1987) showed that roughness elements > O(1 m) are largely or completely absent. However, analyses of images of Ice Stream D by Reference Bindschadler and ScambosBindschadler and Scambos (1991) indicate that bedrock roughness at the length scale of O(h) may be important there.
For an ice velocity of 450 m a−1, appropriate for Ice Stream Β or the other Siple Coast ice streams, Equation (7) shows that the drag force from bedrock bumps can be large. Results of calculations are shown in Figure 2. Covering < 1% of the glacier bed with 1 m radius, fixed hemispherical bumps, or < 2% of the bed with 10 m radius bumps, would support the entire basal shear stress if it were 10 kPa.
Form drag of large, hemispherical bedrock bumps for Ice Stream B, as a function of bump radius a. The drag, D, on a bump, from the power-law generalization of the solution of Reference WattsWatts (1974; quoted in Reference HalletHallet, 1979), is taken to be ![]() with ω taken as the average of the values 4 and 6 for free-slip and no-slip boundaries, respectively, and A = 5 Ñ 10−24 Pa−3 s−1 for temperate ice (Reference PatersonPaterson, 1981, p. 39). a. Force on a single bump. b. Stress from form drag of a bump on its basal area πα2, c. Fraction of bed that must be covered by bumps of one size to support the entire driving stress for ice flow at the ice-stream velocity.
with ω taken as the average of the values 4 and 6 for free-slip and no-slip boundaries, respectively, and A = 5 Ñ 10−24 Pa−3 s−1 for temperate ice (Reference PatersonPaterson, 1981, p. 39). a. Force on a single bump. b. Stress from form drag of a bump on its basal area πα2, c. Fraction of bed that must be covered by bumps of one size to support the entire driving stress for ice flow at the ice-stream velocity.

Features > O(1–10 m) might be detected by direct imaging using closely spaced radar or seismic lines. Smaller-scale features (O(0.1–1 m)) could be detected by statistical analysis of fading patterns from radar experiments (e.g. Reference Walford, Kennett and HolmlundWalford and others, 1986; Reference Bentley and NovickBentley and Novick, 1990). The theory of form drag by bumps is relatively well developed (e.g. Reference WeertmanWeertman, 1964; Reference LliboutryLliboutry, 1987), so good data on local bed configuration could be used to calculate stickiness. Such experiments, if located in regions where imagery shows disturbance of the surface, probably offer the best change of identifying sticky spots.
4 Conclusions
Field data suggest that the basal drag on Siple Coast ice streams is spatially variable, and that localized “sticky spots” may exist within well-lubricated regions. Sticky spots might range from O(1-10 m) to O(10h), where h is the ice thickness. Smaller features are included in local sliding laws and larger features are detected by modern geophysical surveys and are resolved by modern ice-flow models.
Sticky spots might be caused by (near-)discontinuity of a deformable subglacial till if such a till limits the basal-shear stress beneath much of an ice stream. However, lubrication by till requires high basal-water pressures, which also would occur over a sticky spot surrounded by till and which are known to promote basal sliding as well as bed deformation. Mountain glaciers with shear stresses approaching 100 kPa and with basal-water pressures typical of Ice Stream Β exhibit sliding velocities similar to the velocity of Ice Stream B, suggesting that mere discontinuity of till cannot lead to exceptionally high shear stresses on sticky spots.
Reference WeertmanWeertman (1972) and Reference Robin and WeertmanRobin and Weertman (1973) suggested that subglacial water pressure in a distributed system decreases with increasing shear stress, and that sliding velocity increases with water supply and shear stress. If a sticky spot were sufficiently sticky, then water would flow into it from all sides until it became sufficiently lubricated to lower its shear stress enough to allow steady water drainage. For likely values of constants, this places a more restrictive limit on the shear stress on a sticky spot beneath Ice Stream B. If there is no topographic expression of the sticky spot, then the shear stress on it can be only a few tens of kPa above the lubricated, regional value. A basal high will increase the stickiness a little and a surface high is about ten times more effective than a basal high at increasing shear stress. Ice raft “a” in Ice Stream Β may be such a surface-high sticky spot; a strain grid across the margin of this feature would clarify this point.
If the Reference WeertmanWeertman (1972) postulate is correct and sticky spots have a lower water pressure than adjacent, well-lubricated areas, then water-pressure measurements might detect or confirm the existence of sticky spots.
However, the water-pressure drop over sticky spots is calculated to be similar to the measurement error using modern techniques and so may not be detectable.
Regardless of its effect on water flow, a bedrock knob restrains ice flow through its form drag, which is large at ice-stream velocities. This effect is nearly independent of lubrication tangential to the knob surface — a bedrock knob that sticks into an ice stream lubricated over most of its bed by deforming till restrains the ice whether the deforming till goes over or around the knob. Such knobs can be identified by direct imaging (radar or seismic) or by their effects on radar or seismic fading patterns and their effects can be calculated.
For the region of Ice Stream Β studied by Reference Rooney, Blankenship, Alley and BentleyRooney and others (1987) and Reference RooneyRooney (1988), it is unlikely that sticky spots support a large fraction of the driving stress for ice flow. If the basal shear stress is a significant fraction of the driving stress, then the strength or viscosity of the subglacial sediments, which cover a large fraciton of the bed, must be important.
Acknowledgements
I thank K.M. Cuffey, C.F. Raymond, R.C.A. Hind-marsh, S. Anandakrishnan and the Chief Editor of the Journal for helpful suggestions. This research was supported in part by funds from the U.S. National Science Foundation Division of Polar Programs, and by funds from the David and Lucile Packard Foundation.
The accuracy of references in the text and in this list is the responsibility of the author, to whom queries should be addressed.


