

Introduction
Landscape setting
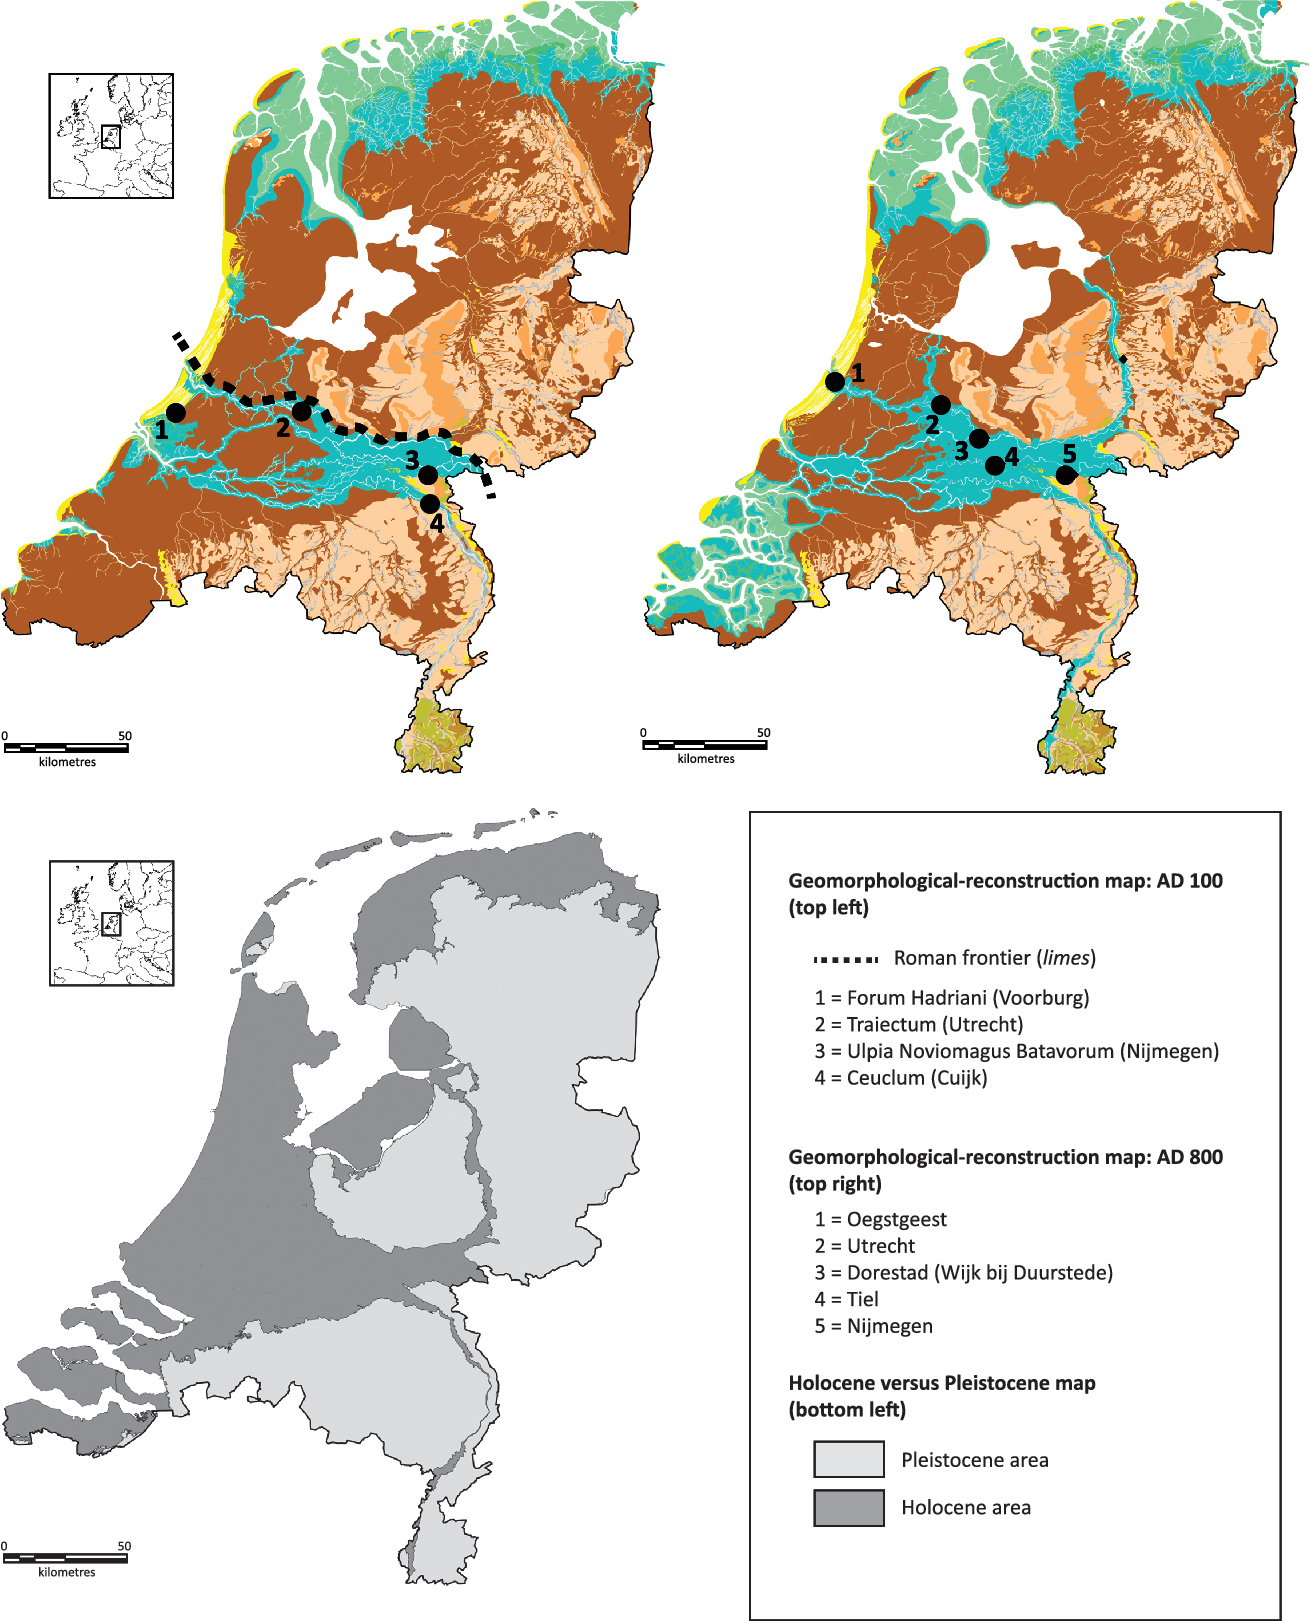
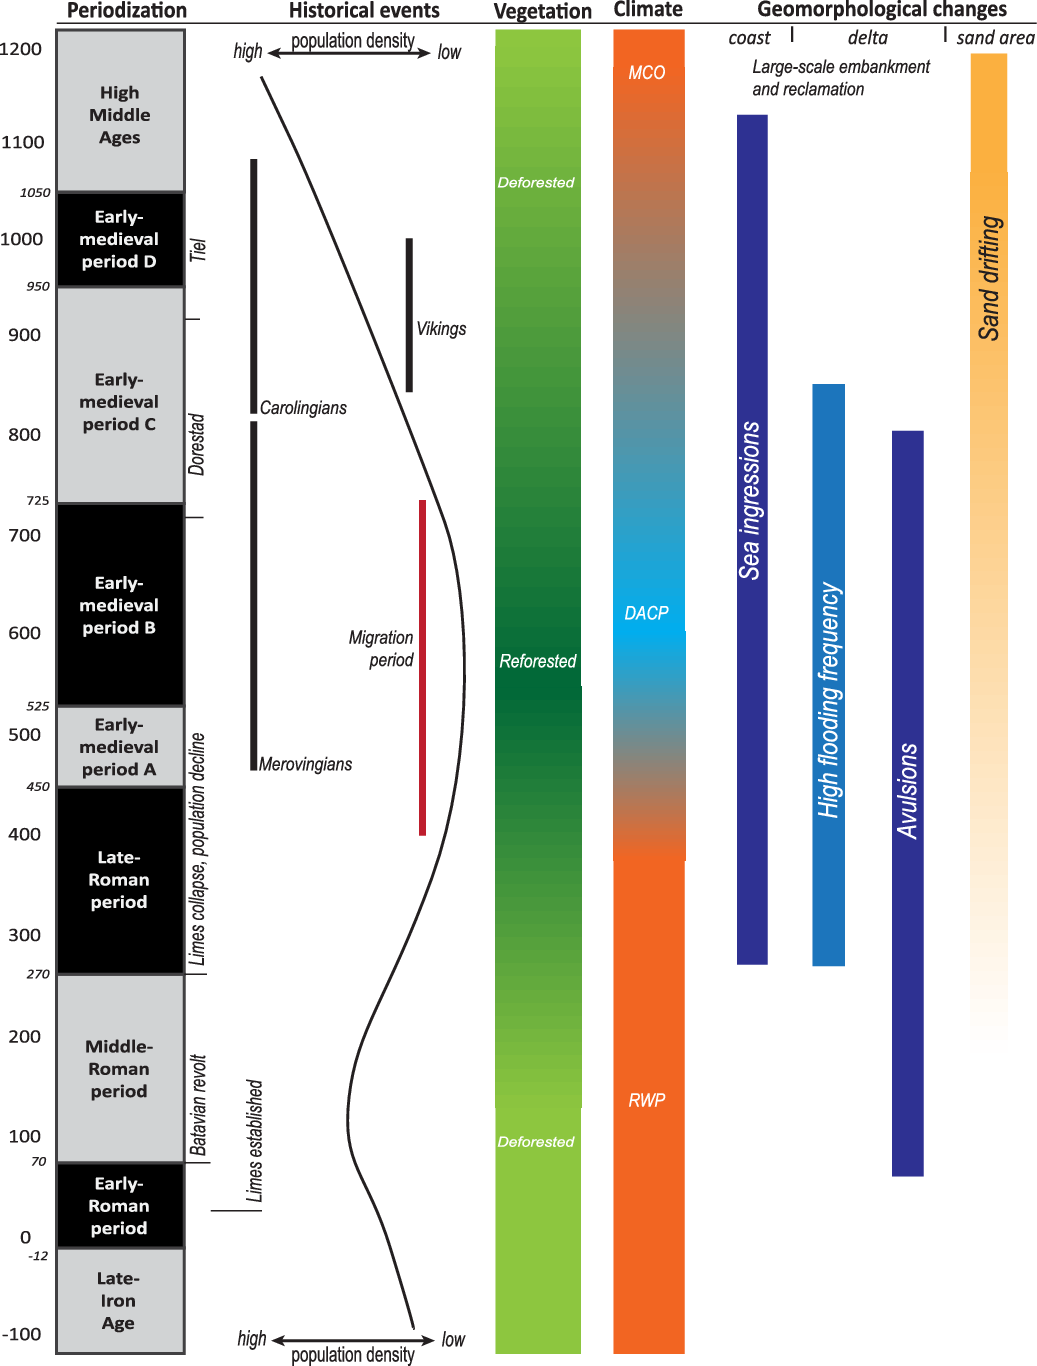
Located in northwest Europe, the Netherlands is a geomorphologically dynamic region that throughout the Holocene has been influenced to a high degree by fluvial and marine (geomorphological) processes (e.g. Stouthamer & Berendsen, Reference Stouthamer and Berendsen2000, Reference Stouthamer and Berendsen2007; Vos & De Vries, Reference Vos and De Vries2013; Vos, Reference Vos2015; Fig. 1). The country can roughly be subdivided into two types of landscape: (1) the relatively low-lying and dynamic Holocene parts; and (2) the more stable and higher Pleistocene uplands, which represent the westernmost part of the northwest European sand belt (e.g. Zeeberg, Reference Zeeberg1998; Fig. 1). In the past, local habitation conditions in the Netherlands were continuously influenced by processes of drowning in the lower parts and soil degradation (‘desertification’) occurring mainly in the higher parts (e.g. Groenewoudt, Reference Groenewoudt2012). Since most of the Netherlands is low-lying, even small changes in groundwater levels could result in significantly wetter conditions (e.g. Petzelberger et al., Reference Petzelberger, Behre and Geyh1999). Initial forcings behind these processes of drowning were natural, consisting of increased precipitation, poor drainage and rising seawater levels. From the Iron Age (800–12 BC) onwards, human interaction with the landscape, such as deforestation and agricultural drainage, had an increasing impact on landscape conditions (e.g. Vos & Van Heeringen, Reference Vos and Van Heeringen1997; Bork et al., Reference Bork, Bork and Dalchow1998, Reference Bork, Schmiedtchen and Dotterweich2003; Erkens, Reference Erkens2009; Lascaris & De Kraker, Reference Lascaris and De Kraker2013; Fig. 2). Throughout the 1st millennium, large parts of the Netherlands were extremely wet and covered by extensive mires. Large-scale reclamation of these marshy lands started in the 10th–12th centuries (Henderikx, Reference Henderikx1986; Borger, Reference Borger1992; Gerding, Reference Gerding1995; Borger et al., Reference Borger, Horsten, Engel, Rutte, Diesfeldt, Pané and De Waaijer2011). In the midst of these Holocene and Pleistocene soils, the rivers Rhine and Meuse strongly influenced (pre)historical natural and cultural developments. Besides providing fertile substrates for agricultural land use, already since the Bronze Age (2000–800 BC; Arnoldussen, Reference Arnoldussen2008) these rivers facilitated long-distance transport on the European mainland (Cunliffe, Reference Cunliffe2004). During the 1st millennium these rivers served as crucial and intensely used transport routes (e.g. Van Es & Verwers, Reference Van Es and Verwers2010; Dijkstra, Reference Dijkstra2011; Hodges, Reference Hodges2012).
Upper part: geomorphological reconstructions of the present-day Netherlands during the Roman period (left) and the Early Middle Ages (right). For both periods the most important towns and the main landscape features are plotted. Lower part: general overview of Holocene and Pleistocene soils (left). Geomorphological reconstructions were adapted from Vos & De Vries (Reference Vos and De Vries2013; also see this reference for more information about the listed legend units and their descriptions). Adapted from Van Lanen (Reference Van Lanen2017).
Timeline of general cultural and natural events and trends in the study area during the 1st millennium AD based on the studies presented in this paper. Depopulation occurred synchronously with geomorphological changes. Population density and vegetation openness: after Louwe Kooijmans (Reference Louwe Kooijmans1995); climate: after Büntgen et al. (Reference Büntgen, Myglan, Ljungqvist, McCormick, Di Cosmo and Sigl2016); RWP = Roman Warm Period; DACP = Dark Ages Cold Period (cf. Ljungqvist, Reference Ljungqvist2010; Büntgen et al., Reference Büntgen, Tegel, Nicolussi, McCormick, Frank, Trouet, Kaplan, Herzig, Heussner, Wanner, Luterbacher and Esper2011). For more detailed background information on this figure see Pierik (Reference Pierik2017) and Van Lanen (Reference Van Lanen2017). Adapted from Van Lanen (Reference Van Lanen2017).
Cultural and natural dynamics during the 1st millennium AD
During the first century AD the central and southern parts of the study area became an integral part of the Roman Empire (Figs 1 and 2; e.g. Van Es, Reference Van Es1981; Willems, Reference Willems1986). Roman influence drastically changed the prehistoric landscape south of the Roman frontier (limes), and altered other parts of the country in a more indirect manner. This influence led, among other things, to the foundation of cities such as Noviomagus and Forum Hadrianus, planned landscape organisation, centralised governance, extensive transport networks, the introduction of coinage and large-scale surplus production (e.g. Van Es, Reference Van Es1981; Willems, Reference Willems1986). Furthermore, Roman influence led to the first systematic (small-scale) reclamation activities through the construction of canals, culverts, dams and ditches (e.g. Ter Brugge, Reference Ter Brugge, Carmiggelt, Guiran and Van Trierum2002; Van Londen, Reference Van Londen and Leveque2006; Vos, Reference Vos2009; Lascaris & De Kraker, Reference Lascaris and De Kraker2013). In general, the Roman period in the study region was characterised by economic prosperity and strong demographic growth, most notably during the 1st and 2nd centuries AD (the early- and middle-Roman periods (ERP and MRP; 12 BC–AD 270) respectively; e.g. Bloemers, Reference Bloemers1978; Willems, Reference Willems1986; Dijkstra, Reference Dijkstra2011; Table 1). During these centuries the number and size of settlements increased drastically. This rapidly changed towards the late-Roman period (LRP; AD 270–450), when the Roman limes at the Oude Rijn collapsed, the number of settlements strongly decreased and a general depopulation occurred (Louwe Kooijmans, Reference Louwe Kooijmans1995; Heeren, Reference Heeren2015). Although this demographic and economic decline occurred in the whole of the Netherlands, there appear to have been temporal and regional differences (e.g. on the sandy soils in the southern Netherlands (the present-day province of North-Brabant), depopulation started as early as the mid-3rd century, whereas in areas north of the Roman limes it followed only decennia later; Willems, Reference Willems1986; B. Van Munster, unpublished report, 2012; Heeren, Reference Heeren2015; Groenewoudt & Van Lanen, Reference Groenewoudt and Van Lanen2018). The decline of Roman control over this area after the collapse of the Roman Rhine-based frontier coincided with the migration of several groups of people into the Netherlands, most notably the Franks who greatly influenced the development of later early-medieval Europe (e.g. Wickham, Reference Wickham2005, Reference Wickham2010; Hallsal, Reference Hallsal2007). During the remainder of the LRP, Roman rule in the present Netherlands never regained the level of influence it had attained during the ERP and MRP.
Overview of Roman and (early-)medieval periodisation based on the Dutch Archaeological Basic Register (ABR). For each of the archaeologically defined periods, ABR coding and start and end dates are given.

Recently obtained physical-geographical data point towards synchronous changes of the natural landscape. In many parts of western Europe, dramatic land-use changes took place after the collapse of the Western Roman Empire in the 4th and 5th centuries AD (e.g. Cheyette, Reference Cheyette2008). During this period, vegetation and land use in the former Roman areas changed dramatically and widespread reforestation occurred (e.g. Teunissen, Reference Teunissen1990; Louwe Kooijmans, Reference Louwe Kooijmans1995; Roymans & Gerritsen, Reference Roymans and Gerritsen2002; Groenewoudt et al., Reference Groenewoudt, Van Haaster, Van Beek and Brinkkemper2007; Kaplan et al., Reference Kaplan, Krumhardt and Zimmermann2009; Fig. 2). Agricultural crop size and type also changed, most notably regarding rye which, as a species that is eminently competitive under unfavourable conditions, became increasingly widespread throughout northwestern Europe (Sadori & Susanna, Reference Sadori and Susanna2005). Additionally, during the LRP the Netherlands was subjected to a major flood around AD 260–82 and, after this event, to increased flooding frequencies (50- to 100-yr recurrence time; Toonen et al., Reference Toonen, Donders, Van der Meulen, Cohen and Prins2013; Cohen et al., Reference Cohen, Toonen and Weerts2016). Contemporaneously, the rivers Hollandse IJssel and Lek were reactivated somewhere between AD 100 and 300, exerting a strong influence on local habitation and Roman (military) infrastructure (Cohen et al., Reference Cohen, Stouthamer, Pierik and Geurts2012).
After the final collapse of the Roman frontier in the Netherlands during the first half of the 5th century, the demographic and economic low that had started in the 3rd century continued. Migrations led to Franks inhabiting the former Roman territories in the south, the Saxons residing in parts of the eastern Netherlands and the Frisians populating the north and west (Van Es & Hessing, Reference Van Es and Hessing1994; Van Beek, Reference Van Beek2009; Gerrets, Reference Gerrets2010; Dijkstra, Reference Dijkstra2011; Van der Velde, Reference Van der Velde2011). Little is known about the 5th century in the study region, but during the 6th century the first signs of post-Roman revival throughout Europe occurred in, amongst others, this area, with settlement numbers and trade increasing again (Van Es & Verwers, Reference Van Es and Verwers2010; Dijkstra, Reference Dijkstra2011). This revival continued over the next centuries, and already during the 7th century the transport-geographical importance of the major rivers in the study region had been fully restored. This development, amongst others, is expressed by the 8th-century rise of Dorestad as a key player in a flourishing North Sea trade network encompassing trade settlements (emporia) such as Birka (Sweden), Haithabu (Denmark), Kaupang (Norway), Quentovic (France) and York (UK) (e.g. Willemsen & Kik, Reference Willemsen and Kik2010). The early onset of post-Roman revival makes the Netherlands a key region for understanding the development and history of (medieval) Europe (e.g. McCormick, Reference McCormick2007; Van Bavel, Reference Van Bavel2010). During the remainder of the Early Middle Ages (AD 450–1050; Table 1), the 8th to 10th centuries, the northern Netherlands became part of the Frankish empire, bringing in Christianity and slowly heralding the High Middle Ages in this part of the study area (Van der Velde, Reference Van der Velde2011; Groenewoudt et al., Reference Groenewoudt, Van Beek and Groothedde2014; Ó Carragáin & Turner Reference Ó Carragáin and Turner2016).
The natural landscape became increasingly dynamic during the Early Middle Ages, especially in the river area where the river Oude Rijn slowly abandoned its course, the river Waal formed as the new major Rhine branch and the river Gelderse IJssel from the 8th century onwards provided a new eastern connection to the Zuiderzee (Makaske et al., Reference Makaske, Maas and Van Smeerdijk2008; Cohen et al., Reference Cohen, Stouthamer, Hoek, Berendsen and Kempen2009; Pierik et al., Reference Pierik, Stouthamer and Cohen2017; Van Dinter et al., Reference Van Dinter, Cohen, Hoek, Stouthamer, Jansma and Middelkoop2017; Pierik, Reference Pierik2020). The increased number of avulsions that occurred during the 1st millennium AD strongly influenced the discharge regime of the Rhine system, with numerous cultural consequences (e.g. changing transport networks, settlement abandonment and relocation; Groothedde, Reference Groothedde2013; Kosián et al., Reference Kosian, Van Lanen and Weerts2016; Van Dinter et al., Reference Van Dinter, Cohen, Hoek, Stouthamer, Jansma and Middelkoop2017). Additionally, this period witnessed a further increase in flooding frequency and two major floods (c. AD 685 and 785, respectively; Toonen et al., Reference Toonen, Donders, Van der Meulen, Cohen and Prins2013; Cohen et al., Reference Cohen, Toonen and Weerts2016).
The 1st millennium AD therefore can be classified as a very dynamic period in the natural and cultural history of the Netherlands. Modelling cultural-landscape changes in this area thus requires integrated research approaches designed to unravel the complex interplay between natural and cultural factors. This paper analyses three key concepts typically characterising the cultural landscape: connectivity, habitation and persistence. Connectivity is the level at which locations (e.g. settlements) are interconnected within networks (e.g. routes). The concept of persistence is defined in line with Schlanger’s (Reference Schlanger, Rossignol and Wandsnider1992) work on persistence places, i.e. the long-term (re)use of specific areas. Habitation in this study is defined as the spatial manifestation of human settlement and land use. These concepts are addressed by presenting the combined results of several recently developed landscape-archaeological models studying five manifestations that spatially reflect human–landscape interactions: route networks, long-distance transport, settlement patterns, palaeodemographics and land-use systems. The aim of this paper is twofold: (1) to present an overview of the modelled boundary conditions and spatio-temporal frameworks for cultural-landscape changes (or persistence) derived from the presented models, and (2) to reflect on the methodological implications and meaning of these findings for the concepts of connectivity, persistence and habitation and the general applicability of modelling for unravelling the past.
Studying the dark age of the Lowlands in an interdisciplinary light
Numerous studies have been carried out focusing on the Roman and early-medieval periods in the Dutch Delta (e.g. Willems, Reference Willems1986; Heidinga & Offenberg, Reference Heidinga and Offenberg1992; Van Es & Hessing, Reference Van Es and Hessing1994; Van Es & Verwers, Reference Van Es and Verwers2010; Willemsen & Kik, Reference Willemsen and Kik2010, Reference Willemsen and Kik2015); however, only a few integrate cultural and geoscientific data on relatively large scales (e.g. Kooistra et al., Reference Kooistra, Van Dinter, Dütting, Van Rijn and Cavallo2013; Van Dinter, Reference Van Dinter2013; Van Dinter et al., Reference Van Dinter, Kooistra, Dütting, Van Rijn and Cavallo2014, Reference Van Dinter, Cohen, Hoek, Stouthamer, Jansma and Middelkoop2017; Jansma & Van Lanen, Reference Jansma, Van Lanen, Willemsen and Kik2016; Kosián et al., Reference Kosian, Van Lanen and Weerts2016). Fuelled by Malta-driven archaeology following the Valetta Treaty (Council of Europe, 1992; revised treaty no. 143), the amount of archaeological and geoscientific data has increased rapidly over the last few decades (Eerden et al., Reference Eerden, Groenewoudt, De Groot, Theunissen and Feiken2017; Groenewoudt et al., Reference Groenewoudt, Eerden, De Groot and Theunissen2017). Additionally, regional overview studies provide us with increasingly detailed data on past environmental conditions (e.g. Vos & Van Heeringen, Reference Vos and Van Heeringen1997; Vos & De Vries, Reference Vos and De Vries2013; Vos, Reference Vos2015; Van den Biggelaar, Reference Van den Biggelaar2017; Van Dinter et al., Reference Van Dinter, Cohen, Hoek, Stouthamer, Jansma and Middelkoop2017; Van Zijverden, Reference Van Zijverden2017). Most of these studies mainly focus on the high-resolution reconstruction of landscape changes in relatively small areas. However, cultural processes, such as settlement dynamics and the development of transport networks, take place on multiple spatial scales, including larger ones. The same holds true for geomorphological processes, e.g. floods. In order to assess the relative importance, impact and interrelationships between cultural and natural phenomena, large-scale integrated research approaches are required that are aimed at interregional comparison. Recent improvements of digital techniques and research infrastructures in the humanities and geosciences in the Netherlands now for the first time allow large-scale, transdisciplinary study of these processes from an interregional and transdisciplinary perspective. Davis & McCormick (Reference Davis and McCormick2008) already rightly stated that increased collaboration within and across disciplines such as archaeology, biology, geoscience and computer science is the way forward for researching the Early Middle Ages. The increased accumulation of data requires, but equally has opened up, new research potential. This was already put forward by Kristiansen (Reference Kristiansen2014), who advocated the important role of Big Data for the future development of archaeological method and theory.
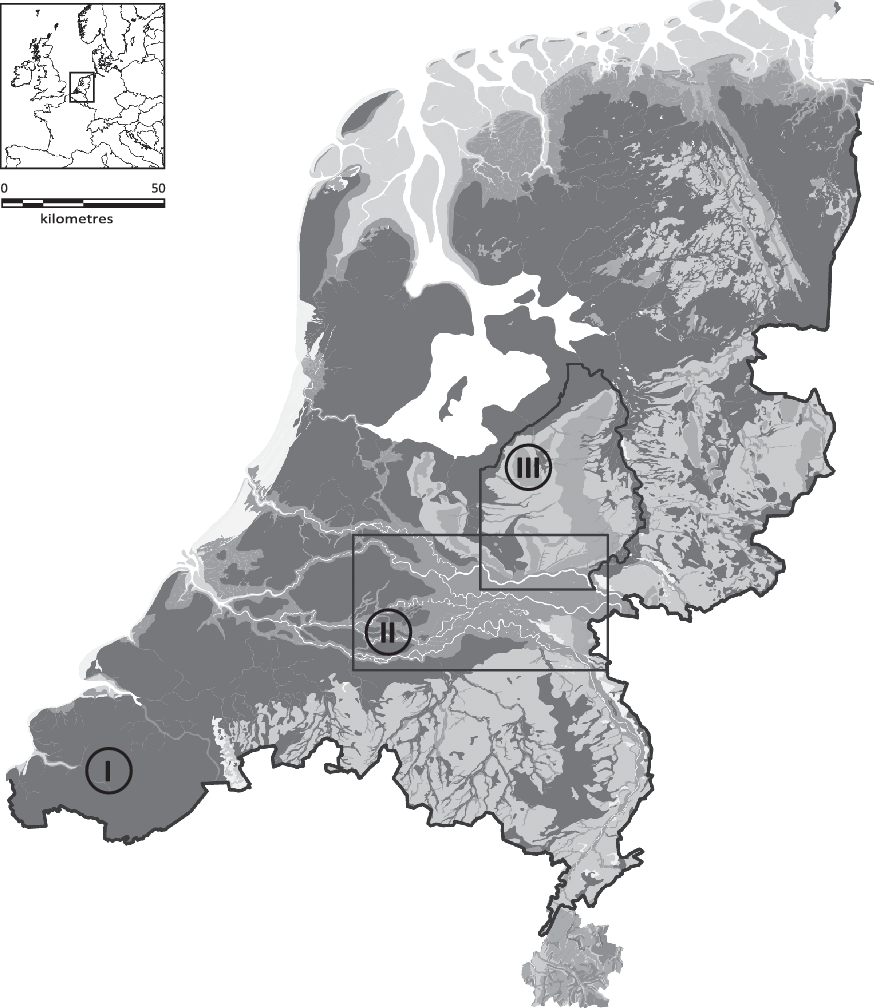
In his comprehensive book on framing the Early Middle Ages, Wickham (Reference Wickham2010) emphasised the strong regional differences within Europe during the transformation from the Roman to early-medieval world, underlining the need for more detailed regional studies. However, research so far has been mainly focused either on reconstructing cultural developments on a supraregional-transcending scale, such as the whole of Europe, or on highly detailed local studies. The first type of research generally lacks the level of detail necessary to understand human–landscape interactions, whereas the latter generally lacks the necessary overview to envelop the full scope of natural-landscape dynamics. Against this background, this paper presents results from models bridging these varying scale levels within the cultural landscape (Fig. 3).
Overview of the study areas discussed in this paper: (I) supraregional route networks and long-distance transport: the present-day Netherlands excluding the southern loss zone; (II) regional route networks, settlement patterns, palaeodemography and land-use systems: the fluvial-dominated part of the Rhine–Meuse delta; and (III) regional route networks and methodological testing of the network-friction method: the Veluwe region. The study areas are overlaid on an AD 100 geomorphological-reconstruction map from Vos & De Vries (Reference Vos and De Vries2013).
In order to accurately study cultural-landscape changes, the concept of ‘cultural landscape’ should be clearly defined. The first academic usage of the term cultural landscape, in 1908, is ascribed to the German geographer Schlüter (e.g. James & Martin, Reference James and Martin1981). Schlüter identified two types of landscape: the Urlandschaft, representing the original, natural landscape without human-induced changes, and the Kulturlandschaft, representing the cultural landscape created by (interactions with) human culture. It was Sauer (Reference Sauer1925) who further developed the concept and who stressed the importance of culture as an agency acting within the natural setting and thus eventually forming the cultural landscape. In this study the concept of cultural landscape is defined in line with the definition provided by the World Heritage Committee (WHC) in 2012, which regards these landscapes as cultural properties representing the combined work of nature and man. According to the WHC (UNESCO, 2012: 14), they are illustrative of the evolution of society and settlement over time, under the influence of the physical constraints and/or opportunities presented by their natural environment and of successive social, economic and cultural forces, both external and internal. This integrated view of cultural landscape as the expression of both natural and cultural processes is especially valid for the Netherlands, since many of its parts are low-lying and have been subjected to intensive human influence from the Bronze Age onwards (cf. ‘Landscape setting’ in previous section). The implication is that in dynamic lowlands such as the Netherlands the study of cultural-landscape changes requires an integrated research approach combining cultural and geoscientific data.
Five manifestations of the cultural landscape
Since the cultural landscape is the result of numerous cultural and natural forces, manifestations that are an integral part of this landscape can be studied as an indicator of change. In this section, five of these key manifestations and their research background are described: settlement dynamics, palaeodemographics, land-use systems, route networks and long-distance transport (Fig. 3).
(It is beyond the scope of the current paper to present complete overviews or reviews of scientific literature dealing with the presented research topics. For a more detailed overview of references I refer to the individual papers mentioned in this and the next section.)
First-millennium settlement patterns
Existing reconstructions of Roman and early-medieval settlement patterns in the study area are the result of archaeological field studies and broader research syntheses performed with different objectives and from a variety of practical and theoretical perspectives. Settlement studies, among others, have been characterised by differences in interpretative frameworks such as processual and post-processual paradigms (e.g. Bloemers & Van Dorp, Reference Bloemers and Van Dorp1991; Lange et al., Reference Lange, Theunissen, Deeben, Van Doesburg, Bouwmeester and De Groot2014), and are focused on highly variable scale levels ranging from local (e.g. house-plan development) to more interregional comparisons (e.g. local: Waterbolk & Harsema, Reference Waterbolk and Harsema1979; regional: Vos, Reference Vos2009; Dijkstra, Reference Dijkstra2011; Lange et al., Reference Lange, Theunissen, Deeben, Van Doesburg, Bouwmeester and De Groot2014). Although different aspects of settlement patterns, such as layout, location and size, have been studied on both local and regional scales, there has been limited focus on the link between changing settlement locations and synchronously occurring natural-landscape dynamics (e.g. floods; Toonen, Reference Toonen2013; Cohen et al., Reference Cohen, Toonen and Weerts2016). Since changes of the physical landscape generally, although not always, manifest themselves on a larger scale than that of individual settlements, at least an integrated regional comparison between settlement patterns and natural-landscape dynamics is needed (Fig. 3; cf. ‘Palaeodemography and land use’ in next section).
Palaeodemography
Closely linked to settlement patterns are demographic changes, which doubtless had a notable impact on society and the landscape during the whole of the 1st millennium. However, up to now palaeodemographic research on this period in the Netherlands has mainly focused on the ERP and MRP (12 BC – AD 270; Table 1; Bloemers, Reference Bloemers1978; Willems, Reference Willems1986; Vossen, Reference Vossen2003; Vos, Reference Vos2009; Verhagen et al., Reference Verhagen, Joyce and Groenhuijzen2016a). Collected overviews for each of the defined Roman and early-medieval Dutch Archaeological Basic Register (ABR) periods and/or showing multi-period population fluctuations during the Roman and early-medieval periods are rare (e.g. Louwe Kooijmans, Reference Louwe Kooijmans1995; Louwe Kooijmans et al., Reference Louwe Kooijmans, Van den Broeke, Fokkens and Van Gijn2005). It is therefore crucial that larger-scale quantitative palaeodemographic models based on an evidence-based approach to settlement numbers be developed and applied. Here the term ‘evidence-based’ is used to indicate scientific research based on factual evidence derived from large amounts of data. The Rhine–Meuse delta (Fig. 3) is particularly well suited to this type of study, because: (1) high-quality settlement data are available; (2) the vast majority of Roman and early-medieval inhabitants lived in rural settlements; (3) this region was mostly densely populated during the 1st millennium AD; and (4) these models allow calculation of the relative contribution of low-level urbanisation to the general population size (cf. ‘Settlement patterns’ in next section).
Land-use systems
Dynamics in land-use systems may also reflect cultural-landscape change. Until now reconstructions of land-use systems in the Rhine–Meuse delta have mainly focused on the possibilities and limitations of farming during the Roman period or Early Middle Ages (e.g. Kooistra, Reference Kooistra1996; Kooistra et al., Reference Kooistra, Van Dinter, Dütting, Van Rijn and Cavallo2013; Van Dinter et al., Reference Van Dinter, Kooistra, Dütting, Van Rijn and Cavallo2014). However, fluctuations in population sizes also directly impact land-use systems. Spatial-simulation modelling allows us to analyse not only the possibilities of farming but also the impact of population sizes on changing land use. Since as early as the 1970s, the complex interplay between palaeodemographics and land-use changes has been the subject of computer-based modelling in archaeology. Recently, simulation modelling has been frequently used for this purpose (e.g. Lake, Reference Lake2014; Joyce & Verhagen, Reference Joyce and Verhagen2016). However, it is commonly recognised that the main weakness of these simulation models is the underrepresentation of natural-landscape dynamics and social complexity (e.g. Van der Leeuw & McGlade, Reference Van der Leeuw and McGlade1997; Goodchild & Witcher, Reference Goodchild, Witcher, Carlsen and Lo Cascio2010; Whitley et al., Reference Whitley, Moore, Goel and Jackson2010; Lake, Reference Lake2014). This is less of a problem in the Rhine–Meuse delta (Fig. 3) where abundant data (also on settlement patterns and palaeodemographics; ‘1st-millennium settlement patterns’ and ‘Palaeodemography’ above) are available and the area is archaeologically and geoscientifically relatively well studied. By applying and further developing a modelling framework by De Kleijn et al. (Reference De Kleijn, Beijaard, Koomen and Van Lanen2018), a first attempt to combine population fluctuations with land-use systems was possible (cf. ‘Settlement patterns’ in next section).
Roman and early-medieval route networks
During the Roman period and Early Middle Ages extensive networks of land and water routes developed on the European mainland, connecting settlements in many parts of Europe including the present-day Netherlands. These routes connected on a multitude of scales, varying from local to regional and supraregional levels (e.g. Horsten, Reference Horsten2005; Van der Heijden, Reference Van der Heijden2016; Fig. 3). Past route networks are relevant for reconstructing past cultural landscapes because: (1) they reflect spatial relations between past settlements; (2) especially in lowland areas their orientation was strongly influenced by landscape conditions; and (3) they in part were the result of developments in less-known and less-studied, off-site activity areas. Since most, if not all, 1st-millennium roads and routes in the study area were essentially unpaved (e.g. Horsten, Reference Horsten2005; Van der Heijden, Reference Van der Heijden2016), the majority of these structures have vanished over time or have become difficult to locate (e.g. as the result of later reuse or because they have become covered by layers of sediment). Therefore a bottom-up archaeological approach on multiple scales, using local studies as a starting point, is less suited to study of these phenomena, implying that a more large-scale, evidence-based approach integrating both cultural and geoscientific data is required (cf. ‘Route networks’ in next section).
Long-distance transport routes
Over the last decade, several reconstructions have been made of Roman and early-medieval long-distance transport routes and trade networks in the Netherlands, using existing, digitally available, archaeological and/or dendrochronological data (e.g. Van Es & Verwers, Reference Van Es and Verwers2010; Theuws, Reference Theuws2012; Domínguez-Delmás et al., Reference Domínguez-Delmás, Driessen, Garcia-Gonzalez, Van Helmond, Visser and Jansma2014; Jansma et al., Reference Jansma, Gouw-Bouman, Van Lanen, Pierik, Cohen, Groenewoudt, Hoek, Stouthamer and Middelkoop2014; Jansma & Van Lanen, Reference Jansma, Van Lanen, Willemsen and Kik2016). However, these studies mostly focus on a small selection of archaeological sites, and their chronological scope is limited to a few centuries at best. Other research has been mainly focused on either developing explanatory theoretical models regarding exchange and trade networks (e.g. Theuws, Reference Theuws2004, Reference Theuws2012; Loveluck & Tys, Reference Loveluck and Tys2006), or on the spatial analysis of the distribution of luxury goods and specific non-luxury commodities such as pottery and rotary querns (e.g. Kars, Reference Kars1980, Reference Kars1981, Reference Kars1983a,b; Verhoeven, Reference Verhoeven, Besteman, Bos and Heidinga1990, Reference Verhoeven1992). In order to reconstruct larger-scale spatio-temporal changes of Roman and early-medieval long-distance transport routes and trade networks, a quantitative and integrated method using geoscientific data as well as archaeologically established distributions of daily-life commodities is required (cf. ‘Long-distance transport’ below).
Results: modelling five manifestations
The presented manifestations all required new research approaches to be developed (previous section). In this section, new modelling methods and their results are presented per manifestation.
Settlement patterns
The influence of natural setting and forcing on settlement dynamics was studied on a regional level in the Rhine–Meuse delta by Pierik & Van Lanen (Reference Pierik and Van Lanen2019). Based on newly developed, high-resolution archaeological, geomorphological and palaeo-elevation data, they developed a quantitative model showing that settlements in the delta were strongly influenced by natural settings and forcings. Settlements were mainly located on dry alluvial ridges, and appear to have been mainly influenced by environmental forcings such as floods. Their calculated trends show that settlements progressively shifted towards higher areas between AD 250 and 750, which corresponds to an increase in flooding frequency and rising groundwater levels (Toonen et al., Reference Toonen, Donders, Van der Meulen, Cohen and Prins2013). Although results point to an especially strong influence of floods on settlement distribution, these impacts do not seem to have led to long-term abandonment of major parts of the delta, with persistent habitation mainly on the higher locations in the delta landscape (Pierik & Van Lanen, Reference Pierik and Van Lanen2019; Pierik, Reference Pierik2020). This pattern is further underlined by the remarkable long-term persistence of routes in the same area (Van Lanen & Pierik, Reference Van Lanen and Pierik2019; Fig. 4).
Persistence overview for settlement patterns (upper part) and route networks (lower part) in the Rhine–Meuse delta. Upper part: (A) delta-wide average of settlement elevation in the study area (for an overview of the number of settlements included in the study compare Fig. 5A); (B) delta-wide elevation differences between persistent (i.e. settlements located within <100 m of predating counterparts) and abandoned settlements show a clear correlation (p-values describing the significance of the results of the t-test, with values statistically significant at p ≤ 0.05 accentuated) between geomorphological dynamics (mainly floods) and higher-located habitation which shows a higher level of persistence (cf. Pierik & Van Lanen, Reference Pierik and Van Lanen2019). Lower part: (C) calculated persistent-route sections (in black) projected on the AD 500 and AD 900 route networks (in red). Persistence was calculated between (C) AD 100–500 and (D) AD 500–900. For both periods a high level of persistence is visible.

Palaeodemography and land use
The impact of fluctuating population sizes and land-use system dynamics on the cultural landscape should not be underestimated. By integrating high-resolution archaeological and geoscientific data, 1st-millennium population numbers and corresponding impact on land use were calculated for the Rhine–Meuse delta by Van Lanen et al. (Reference Van Lanen, De Kleijn, Gouw-Bouman and Pierik2018). This model, for the first time, not only looked at the geoscientific (im)possibilities for e.g. farming, but integrated new models of palaeodemography (Van Lanen & Groenewoudt, Reference Van Lanen, Groenewoudt, Brady and Theune2019) and simulation modelling (De Kleijn et al., Reference De Kleijn, Beijaard, Koomen and Van Lanen2018). The model calculated two periods of major population growth: the 1st–3rd and 8th–10th centuries (Fig. 5). The largest demographic decline transpired during the 3rd–6th centuries. Through simulation modelling, the impact of these demographic fluctuations on arable farming, meadows, and pastures was determined for three time slices: AD 100, 500 and 900. The findings by Van Lanen et al. (Reference Van Lanen, De Kleijn, Gouw-Bouman and Pierik2018) showed that the impact of demographic rise and military presence on the cultural landscape in general was low. During the whole of the 1st millennium AD, the natural landscape provided abundant options for arable farming, meadow and pasture to support the delta inhabitants. It should be noted that their modelling method would benefit from more detailed vegetation reconstructions which were not available at the time. However, the model by Van Lanen et al. (Reference Van Lanen, De Kleijn, Gouw-Bouman and Pierik2018) does illustrate the added value of simulation modelling for testing the feasibility of traditional commonly accepted archaeological hypotheses (for a more detailed description and illustrative overview of the modelling results: Van Lanen et al., Reference Van Lanen, De Kleijn, Gouw-Bouman and Pierik2018: fig. 3).
Population reconstructions and land-use simulation in the Rhine–Meuse delta. (A) For each of the predefined ABR periods (Table 1) the number of archaeologically established settlements is given (for a detailed overview of selection criteria see Pierik & Van Lanen, Reference Pierik and Van Lanen2019). (B) Reconstructed 1st-millennium palaeodemographic trends based on the model by Van Lanen et al. (Reference Van Lanen, De Kleijn, Gouw-Bouman and Pierik2018). For each of the predefined ABR periods the total population size and the number of rural people (i.e. people living outside of large (urbanised) settlements and military complexes) are given. A strong population decline is visible after the MRP until the EMPC (Table 1). (C) The results of one hypothesis tested by Van Lanen et al. (Reference Van Lanen, De Kleijn, Gouw-Bouman and Pierik2018; hypothesis 3). Here the impact of the early-medieval emporium of Dorestad on the natural landscape (through an increasing demand for food) during the EMPC was calculated for two simulated scenarios: (I) The maximum number of settlements can be expected in the study area and these were self-sufficient and provided 50% of the food demand of Dorestad. (J) The maximum number of settlements can be expected in the study area and these were self-sufficient and Dorestad was solely provided with 100% imported food. This example shows that through simulation modelling it is possible to quickly test existing archaeological hypotheses and determine tipping points within the cultural landscape. For a more detailed overview of threshold values, calculations and underlying assumptions: Van Lanen et al. (Reference Van Lanen, De Kleijn, Gouw-Bouman and Pierik2018).

Route networks
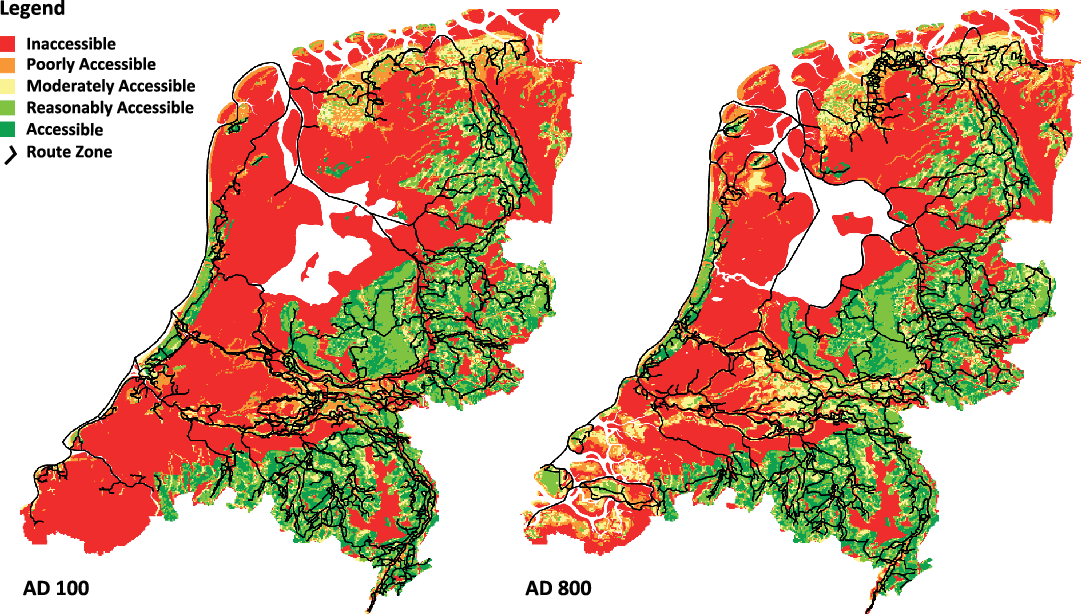
First-millennium routes in the study area were essentially made up of unpaved roads or tracks and were strongly susceptible for landscape dynamics (’Roman and early-medieval route networks’ in previous section). The dynamic nature of the 1st millennium combined with the few historical sources available has caused them to remain largely uncharted. Van Lanen et al. (Reference Van Lanen, Kosian, Groenewoudt and Jansma2015a) developed a network-friction approach which reconstructs local accessibility and locates hypothetical movement corridors based on geoscientific data (i.e. palaeogeography, geomorphology, soil, elevation and groundwater levels). Their model therefore predicts the general orientation of routes consisting of roads, tracks and paths (Fig. 6). By combining these models with archaeological data on, amongst other settlements, burial sites and shipwrecks, route networks for the Roman (c. AD 100) and early-medieval periods (c. AD 800) were calculated (Van Lanen et al., Reference Van Lanen, Kosian, Groenewoudt, Spek and Jansma2015b). Validation of their models pinpointed the strong relationship between route networks and natural-landscape setting. Although only covering a little over 10% of the surface area of the Netherlands, these routes zones contained 72–89% of all registered Roman and early-millennium infrastructural and isolated finds ever found. Further models calculating spatial dynamics between Roman and early-medieval networks showed that 68% of the routes persisted throughout the 1st millennium (Van Lanen et al., Reference Van Lanen, Groenewoudt, Spek and Jansma2016a). In their analyses Van Lanen et al. (Reference Van Lanen, Groenewoudt, Spek and Jansma2016a) also analyse long-term persistence by comparing their models with 17th-century routes. These analyses showed a drop in persistence to 25% with early-medieval counterparts. Through the applied network-friction method, this fall could be largely ascribed to cultural changes between these periods (e.g. (post-)medieval reclamation activities and an increase in urbanisation and network size; Van Lanen et al., Reference Van Lanen, Groenewoudt, Spek and Jansma2016a: fig. 7). Remarkably, almost 90% of the persistent early-modern routes were long-term persistent, i.e. in use during all analysed periods, and connected many of the present-day historical towns, the implication being that persistent movement corridors in this area during the 1st millennium functioned as a ‘pull factor’ for re-establishing route networks. Besides a supraregional applicability, the network-friction method was also successfully tested on a more detailed regional scale by Vletter & Van Lanen (Reference Vletter and Van Lanen2018) and Van Lanen & Pierik (Reference Van Lanen and Pierik2019).
Network-friction maps and calculated route networks for AD 100 and 800 in the present-day Netherlands. The network calculations by Van Lanen et al. (Reference Van Lanen, Kosian, Groenewoudt and Jansma2015a) clearly show areas that were inaccessible (in red), moderately accessible (in yellow) and accessible (in green). Based on this integrated method, geoscientific and archaeological data were used to reconstruct Roman and early-medieval land and water routes (AD 100 and 800, respectively). These networks were convincingly validated with archaeological finds not previously included in the model: infrastructural and isolated finds (cf. Van Lanen et al., Reference Van Lanen, Kosian, Groenewoudt, Spek and Jansma2015b). Adapted from Van Lanen et al. (Reference Van Lanen, Kosian, Groenewoudt and Jansma2015a).
Long-distance transport
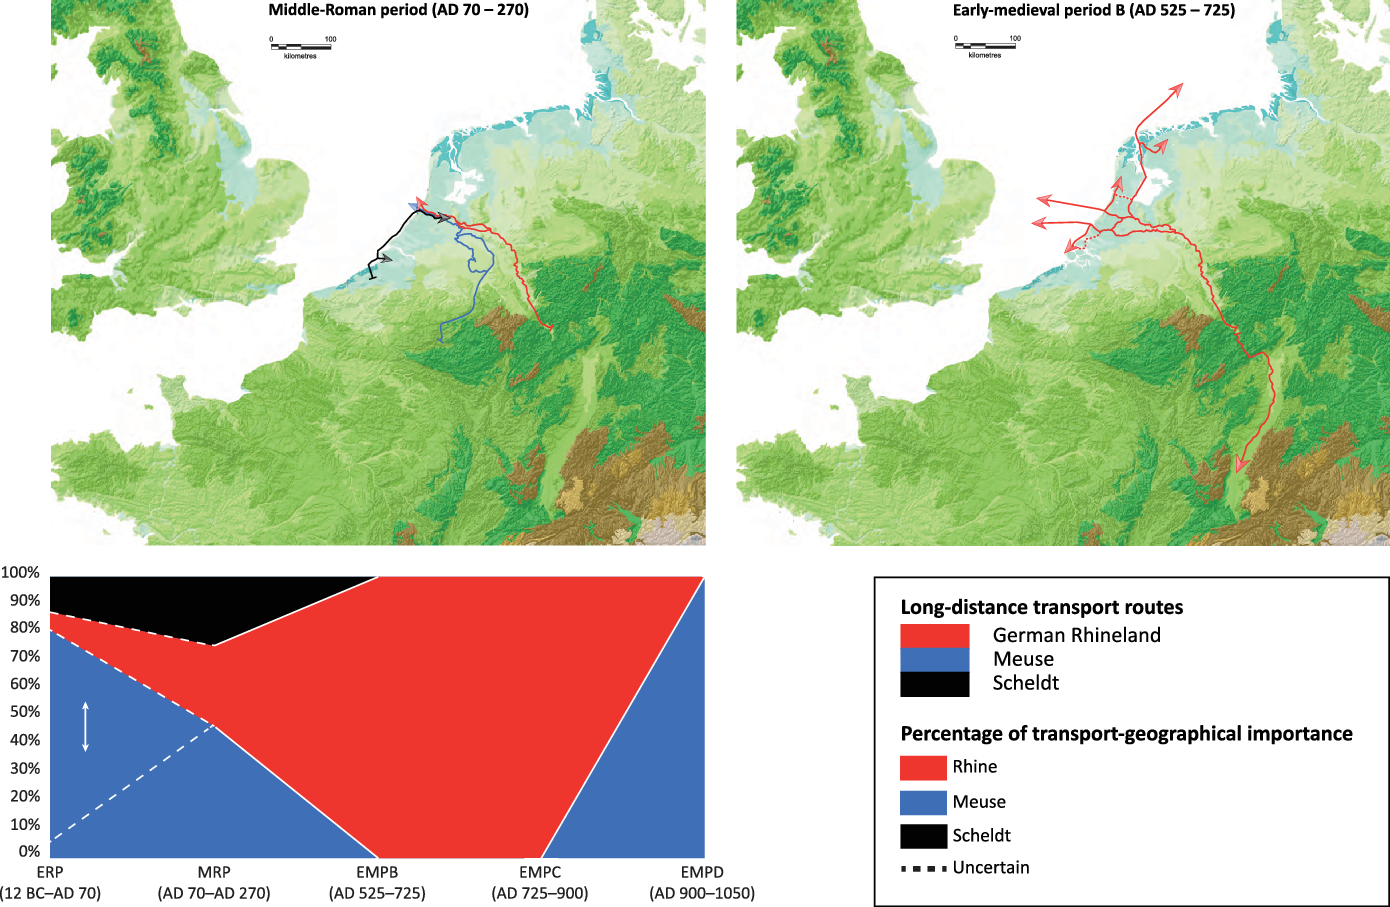
Whereas traditional archaeological models have mainly focused on either luxury goods or the nature of exchange systems (‘Long-distance transport routes’ in previous section), Van Lanen et al. (Reference Van Lanen, Jansma, Van Doesburg and Groenewoudt2016b) developed a more quantitative dendroarchaeological model in order to reconstruct 1st-millennium long-distance timber transport routes in northwest European lowlands. By combining wood provenance with models on Roman and early-medieval route networks (Van Lanen et al., Reference Van Lanen, Kosian, Groenewoudt, Spek and Jansma2015b), they reconstructed changes in transport routes, prevalent exchange networks and frequent-travel zones for each 1st-millennium subperiod (cf. Table 1). Their model points towards significant spatial shifts in transport routes during the investigated period. During the early- and middle-Roman periods, long-distance transport was connected to the German Rhineland (Rhine-based transport), the Ardennes (via the Meuse) and the Scheldt region (Fig. 7). Their results show no wood-based evidence of long distance-connections during the late-Roman period and the start of the Early Middle Ages (AD 270–525). Between AD 525 and 900 all exogenous timbers were derived from the German Rhineland. This network extended to Britain and Denmark and collapsed around AD 850. After that, timber imports without exception originated from the Ardennes and reached the Netherlands via the Meuse (Fig. 7). Validation of the model with reconstructed trends in (changing) provenances of other commodities for daily-life use, namely pottery and stone household goods, shows strong similarities in dynamics, confirming their outcomes (Van Lanen et al., Reference Van Lanen, Jansma, Van Doesburg and Groenewoudt2016b). The model further underlines the need for more quantitative, data-driven approaches in the study of long-distance transport in the past.
Long-distance transport routes of imported timbers in the present-day Netherlands. Upper part: Van Lanen et al. (Reference Van Lanen, Jansma, Van Doesburg and Groenewoudt2016b) calculated spatial patterns in the long-distance timber imports for each predefined ABR period (Table 1). Two defining periods are outlined: The Middle-Roman period (top left) shows a varying pattern of long-distance transport, with timbers being imported from the Scheldt region, the Ardennes via the Meuse and the German Rhineland (via the Rhine). This pattern of timber imports changes significantly during the middle part of the Early Middle Ages (top right), with wood only being imported out of the German Rhineland. At the end of the Early Middle Ages (EMPD) this pattern changes again, with transport routes shifting towards the Ardennes region. For a detailed overview of these spatial shifts in long-distance transport and validation of these patterns by pottery and stone household goods analyses: Van Lanen et al. (Reference Van Lanen, Jansma, Van Doesburg and Groenewoudt2016b). Bottom left: The relative contributions (in percentages) of the Rhine, Meuse and Scheldt rivers in the long-distance transport of timbers towards the present-day Netherlands. The model clearly shows the dominant character of the Rhine during the Merovigian and Carolingian periods (EMPB and EMPC, respectively).
Reflecting: connectivity, habitation and persistence
The presented outcomes in the previous section allow us to reflect on modelling results and significance for reconstructing the 1st millennium as a whole, but also on the importance of modelling for studying the past in general.
Reflections on habitation, connectivity and persistence during the 1st millennium AD
The presented models all pointed to a very strong relationship between cultural and natural dynamics. Sometimes these interdependencies are quite clear and occur simultaneously (e.g. floods and settlements; ‘Route networks’ in previous section); at other times these processes require more time and the interplay is more subtle (e.g. urbanisation versus route networks; ‘Settlement patterns’ in previous section). Habitation patterns in the study area were especially dynamic and clearly related to increased flooding and rising groundwater levels (Pierik & Van Lanen, Reference Pierik and Van Lanen2019; Pierik, Reference Pierik2020). Contrasting patterns of persistence were established for route networks and for movement corridors facilitating connectivity in the area, which were mainly limited by natural setting (Van Lanen & Pierik, Reference Van Lanen and Pierik2019). In all likelihood, the observed and synchronously occurring processes of change and persistence are characteristic for inhabited lowlands worldwide. Despite the fact that natural-landscape changes in such areas have resulted in the destruction of a substantial part of the archaeological record, the observed dynamics are invaluable for archaeological studies, since they enable the reconstruction of boundary conditions for human land use and connectivity. These boundary conditions in turn facilitate the development of detailed, landscape- and evidence-based spatio-temporal frameworks for archaeology. These frameworks not only contribute to the study of cultural manifestations such as settlement patterns, route networks and land use, but also allow the prediction of locations (formerly) containing hidden archaeological remains (cf. Van Lanen, Reference Van Lanen2017; next subsection). It is exactly the highly dynamic geomorphology of the study area that makes it possible to differentiate between Roman, early-medieval and pre-modern spatial patterns in the landscape.
In this study, persistence is construed in line with Schlanger’s (Reference Schlanger, Rossignol and Wandsnider1992) work on persistent places, and defined as the long-term (re)use of a particular location or area for specific purposes. In this context, persistence is largely defined as a spatial concept. The results presented in the previous section show that persistence for various reasons is a highly usable concept for archaeological research. In the first place, it is extremely difficult to define patterns of continuity in cultural-landscape development using traditional excavation data from a single archaeological site. This is mainly because high-resolution (preferably year-to-year) dating is impossible to obtain through the majority of archaeological finds (e.g. pottery, glass, metal pins). Persistence, however, can be determined using spatial data and the full spectrum of the archaeological record, i.e. by integrating multiple proxies. In the second place, persistent areas are important as foci of human activity, and persistence analysis allows us to identify, locate and predict these areas. In this manner, persistence analysis contributes to the identification of places eminently suitable for comparing processes of change and (potential) continuity in cultural-landscape development and, perhaps even more fundamentally, to archaeological-predictive modelling in general (cf. next subsection). This conclusion is supported by the results presented by Van Lanen et al. (Reference Van Lanen, Groenewoudt, Spek and Jansma2016a; ‘Settlement patterns’ in previous section), which show that long-term persistent routes were not randomly distributed in the present-day Netherlands, but were located in specific regions enveloping many of the oldest historical cities (e.g. Alkmaar, Arnhem, Deventer, Haarlem, Leiden, Nijmegen and Zwolle). This shows that the concept and methods of long-term persistence are highly valuable for localising multi-period archaeological sites containing key information about past processes of environmental and cultural change.
In geography, the term ‘connectivity’ refers to the level at which nodes are interconnected in specific networks, i.e. to the tangible and intangible means of communication and/or connection between sites (e.g. Malczewski, Reference Malczewski1999). However, regarding this concept, Van Lanen (Reference Van Lanen2017) distinguishes between ‘infrastructural connectivity’, which is the level of connectivity derived from a reconstructed number of route-zone connections, and the more theoretical concept of ‘connectivity patterns’. Connectivity patterns are defined as: ‘the dynamic spatial and social interrelation of, and interaction between, the following landscape-influencing factors: settlement patterns, land use, demography, route networks, long-distance transport routes, and physical landscape-formation processes’ (Van Lanen, Reference Van Lanen2017: 155). The models presented here show that during the studied period the level of infrastructural connectivity influenced, and was influenced by, developments in the other factors mentioned in this definition. For example, an increase in the number of settlements equally leads to an increase in routes, and growing population numbers equally lead to an increase in specific types of land use and an intensified use of route networks. This implies that connectivity patterns encompass more than infrastructural connectivity alone, in addition also reflecting the complex interrelationships with and between changing settlement patterns, land use, palaeodemographics and long-distance transport connections, in short: a large part of the cultural landscape as a whole (Fig. 8). The scale of interrelationships and the number of interactions within the reconstructed system are countless and highly variable, and during the studied time interval in general took place within path-dependent frameworks, i.e. in situations in which past developments influence future progress. Consequently, one could argue the long-term development of a single connectivity-pattern factor in this system cannot be understood without addressing the system as a whole. This also came to light especially during the analyses of 1st-millennium settlement patterns and route networks in the Rhine–Meuse delta (‘Settlement patterns’ and ’Route networks’ in previous section; Pierik & Van Lanen, Reference Pierik and Van Lanen2019; Van Lanen & Pierik, Reference Van Lanen and Pierik2019). The reconstruction of past human–landscape interactions therefore requires an integrated, large-scale, transdisciplinary research approach which facilitates the identification of interrelations, interactions and multiscale variability within the underlying dimensions of this system.
Schematic overview of (path-)dependent connectivity patterns (CPFs) within the past cultural landscape. The five manifestations discussed in this paper (in blue), together with the natural landscape (in green), to a large extent spatially form the cultural landscape. The model depicts interrelationships between the physical landscape, settlement patterns, long-distance transport routes, route networks, demography and land use. The size of each CPF node reflects the numbers of connections within the system, with smaller nodes representing fewer interrelationships and vice versa. With the exception of the physical landscape and demography between which, excluding catastrophic events, no direct connection exists, each CPF is connected to the other CPFs in the system. Changes within one or more CPFs influence the interrelationships within the system (and the cultural landscape as a whole) and may cause changes in other CPFs, making connectivity patterns a complex system with countless dynamic, path-dependent connections. Adapted from Van Lanen (Reference Van Lanen2017).

Methodological implications
Developing these kinds of new research approaches also has a number of methodological implications for archaeological research.
Digital techniques in archaeology
The increase of computational possibilities and the growing number of available data have led to a notable increase of digital techniques in archaeology. A technique that has played an increasingly large role in digital-archaeological research since the 1990s is Geographical Information Systems (GIS; e.g. Westcott & Brandon, Reference Westcott and Brandon1999; Wheatly & Gillings, Reference Wheatly and Gillings2002; Chapman, Reference Chapman2006; Conolly & Lake, Reference Conolly and Lake2006; Verhagen, Reference Verhagen2007). GIS were also applied in the modelling methods presented in the previous two sections. The archaeological potential of GIS and GIS-based modelling is substantial and, equally, problematic for a number of reasons: (1) Many of the available GIS techniques were developed for non-archaeological, often even non-research, purposes. This often makes manual modifications or programming in order to correctly fit archaeological analyses essential; (2) Archaeological data are a priori fragmented and interpretative and the result of the interaction between depositional and post-depositional processes, i.e. processes influencing the degradation and retrievability of archaeological materials (e.g. Schiffer, Reference Schiffer1976, Reference Schiffer1987; Fig. 9). Therefore, archaeological data can be considered as biased and incomplete. Archaeologists developing and applying models should be aware of this deviating nature, since it directly influences best research practices and thus the choice of research strategies. Recently, Brouwer Burg et al. (Reference Brouwer Burg, Peeters and Lovis2016) rightly advocated the importance of calculating statistical significance and specifically of including sensitivity analyses in archaeological modelling. However, when dealing with biased or incomplete data this refinement poses a risk, since statistical significance calculations based on such data may wrongly provide positive results and thus may suggest an erroneously high level of accuracy. Since fact-checking of such results in general is difficult, researchers should be reserved in the statistical manner in which they present GIS-modelling outcomes when dealing with archaeological data; (3) This deviating nature of, amongst other things, fragmented and biased archaeological data necessitates the development of new transparent, standardised module-based modelling approaches (Fig. 9). Such an approach not only allows the integration of multiple methods in one model, but also allows the individual validation of each modelling step, increasing scientific transparency. Additionally, it ensures a maximum incorporation of archaeological and historical data in the modelling process, because it allows for the continuous validation of each modelling step against external data which previously were not included in the model. Such an approach also maximises data-integration possibilities by allowing data from varying disciplines to be combined and fill in possible data gaps. Furthermore, a module-based approach provides separate results for each modelling step, increasing the general reconstructive potential of GIS modelling in archaeology.
Selection of methodological implications of the models presented in this paper. Based on the modelling results presented in the Results section, a number of reflections and methodological implications for archaeological research can be derived (‘Methodological implications’). (A) Schematic overview of the formation of the archaeological record. Archaeological data is a priori fragmented and, through interpretative frameworks, biased. Past human behaviour is (in part) physically expressed through archaeological remains. Composition of the archaeological record is influenced by both depositional (e.g. ritual, artisanal) and post-depositional (e.g. erosion, degradation) processes. Figure adapted from Schiffer (Reference Schiffer1987). (B) Schematic overview of a cascading GIS-modelling approach. By continuously validating and integrating archaeological, geoscientific and historical data (red arrows) into consecutive modelling steps (black arrows), a more transparent and empirical reconstruction of the past can be achieved. (C) Schematic overview of multiscale variability in cultural processes. These processes play out independently (‘individual processes’) or as part of larger developments (‘integrated processes’). Individual processes act on local, regional, supraregional or supraregional-transcending scales and as such are restricted to one specific scale level. Integrated processes with the exception of local processes can act on multiple-scale levels, e.g. supraregional-cultural processes can influence local cultural landscape.

Multi-scale variability of cultural-landscape development
Processes of change and persistence appear to have occurred simultaneously and on multiple scales in the study area. Studying their interrelationships and interactions therefore requires similarly varying research scales (cf. Pierik, Reference Pierik2017; Van Lanen, Reference Van Lanen2017; Fig. 9). Traditionally, archaeological research is mainly focused on creating detailed local or regional overviews which often cannot identify these larger processes, resulting in underestimation and incorrect assessments. It is therefore crucial to increase the ratio of large-scale, evidence-based research approaches in archaeology. Such approaches are not without challenges: (1) data quality and completeness in the available large-scale data repositories are often subpar and often rightly criticised (e.g. Verhagen et al., Reference Verhagen, Vossen, Groenhuijzen and Joyce2016b); and (2) because of the substantial amount of data, verifying and improving individual records is impossible. Despite these challenges the models presented in this paper show that through their sheer number, these data allow for reliable trend reconstructions. In other words, necessary data quality strongly depends on the formulated research questions, which also determines applied scales and methods (e.g. <500 m inaccuracies of find-location coordinates are problematic in local or regional studies, but are of much less influence when performing supraregional analyses). This is underlined by the validation of the supraregional route-network results by Van Lanen et al. (Reference Van Lanen, Kosian, Groenewoudt, Spek and Jansma2015b). It is therefore high time for an archaeological focus on creating methods to fully utilise the existing, rapidly expanding, datasets. The application of multiproxy, transdisciplinary approaches and Big Data analyses will be crucial for future developments in the overlapping realms of archaeology and geosciences, and in bordering domains such as history.
Transcending the supraregional scale
The finding that cultural-landscape formation processes express multiscale variability implies that they can also occur on scales transcending the supraregional level. The study of settlement patterns and route networks (‘Settlement patterns’ and ‘Route networks’ in previous section) underlines this and has already shown that reconstructed spatial patterns were influenced by forcings occurring on local, regional and supraregional scales (e.g. impact by large organisational structures such as the Roman and Frankish empires and supraregional flooding). Although challenging, the next required step in archaeological studies reconstructing the cultural landscape is to broaden the scope from regional to supraregional, or even supraregional-transcending (e.g. European-wide), scales. Such research will doubtless reveal new interrelationships and in this manner increase our understanding of past cultural-landscape formation processes. However, such approaches will require large amounts of digital data, transparent research methods (focusing on identifying limitations of new reconstructions) and intense collaboration between specialists from different scientific disciplines.
Moving from predictive areas to corridors in heritage management
The reconstructed networks by Van Lanen et al. (Reference Van Lanen, Kosian, Groenewoudt, Spek and Jansma2015b, Reference Van Lanen, Groenewoudt, Spek and Jansma2016a; Van Lanen & Pierik, Reference Van Lanen and Pierik2019) appear to be more than merely Roman and early-medieval route zones; in fact they should be regarded as ‘cultural-activity corridors’. These are best defined as concentrated landscape zones characterised by favourable natural-landscape conditions and consequently by a relatively high level of past human activity. Moreover, the reconstructed link between routes and past human activity is not limited to the cultural landscape in the Dutch Delta but is also visible in other parts of the world, such as the Aboriginal cultural landscapes in Canada’s Northwest Territories (Gwich’in region; Andrews et al., Reference Andrews, Kokelj, Mackay, Buysse, Kritsch, Andre and Lantz2016). Consequently, a modelling method as presented by Van Lanen et al. (Reference Van Lanen, Kosian, Groenewoudt, Spek and Jansma2015b) pinpointing such corridors has a high potential for archaeological heritage management. Since archaeological research in the Netherlands is fuelled by Malta-driven excavation strategies, it is mainly focused on the site level. Predictive models on national or regional scale are used to determine the location of probable undiscovered archaeological remains. These models are mainly based on the correlation between geomorphological setting and known archaeological sites (e.g. Deeben et al., Reference Deeben, Hallewas, Koolen, Wiemer, Willems, Kars and Hallewas1997, Reference Deeben, Hallewas and Maarlevelt2002; Deeben & Groenewoudt, Reference Deeben, Groenewoudt, Mathers, Darvill and Little2005; Deeben, Reference Deeben2008). Compared to these predictive models, cultural-activity corridors calculated the zones of past-human activity in much more detail. Van Lanen & Pierik (Reference Van Lanen and Pierik2019) hinted at the feasibility of using the network-friction method for application within heritage management, by validating their results using gain values (cf. Kvamme, Reference Kvamme, Judge and Sebastian1988). By comparing their outcomes with gain values calculated by Verhagen (Reference Verhagen2007) for the existing models for the Rhine–Meuse delta, the corridor approach produced much higher values, implying that its archaeological-modelling predictions are also much more accurate. Consequently, the corridor approach could prove to be an extremely useful addition to existing predictive-modelling methodology.
The application of multiproxy and transdisciplinary approaches in archaeology
Studying the cultural landscape in the past from a long-term perspective thus requires more large-scale, transdisciplinary and multiproxy modelling approaches. Such an approach has several advantages: (1) It allows us to compensate for the fundamental inequality and biases in archaeological and geoscientific (meta)data recording and distribution (cf. Van Lanen et al. Reference Van Lanen, Kosian, Groenewoudt and Jansma2015a,b; Van Lanen & Pierik, Reference Van Lanen and Pierik2019). The models presented in this paper show that it is possible to a large extent to compensate for fragmented, lacunary data by integrating multiple datasets and proxies from different research domains (previous two sections). Although these data shortcomings and inconsistencies definitely hamper data-driven research on the past cultural landscape, they should never prevent or restrict researchers in formulating their research questions; (2) Applying a multiproxy and transdisciplinary approach contributes to the identification of optimal research strategies (e.g. moving from areas to calculating cultural-activity corridors or analysing). Vletter & Van Lanen (Reference Vletter and Van Lanen2018) particularly demonstrated this for the network-friction approach which was highly useful for determining the optimal route-network modelling technique for the reconstruction of local or supraregional connections; and (3) The complexity associated with human connectivity patterns and the cultural landscape (‘Reflections on habitation, connectivity and persistence during the 1st millennium AD’, above) cannot be understood without a wide variety of data originating from multiple proxies enabling both the study of the system as a whole and a thorough validation of results. Especially within the field of landscape archaeology, defined by Kluiving & Guttman-Bond (Reference Kluiving and Guttman-Bond2012) as the interdisciplinary investigation of the long-term relationship between people and their environment, it is vital that at least cultural and geoscientific data are combined on local to supraregional scales in order to increase our understanding of the past cultural landscape.
Theoretical considerations
Besides methodological implications, these new research approaches also lead to some theoretical considerations. Reconstructing spatio-temporal frameworks of cultural-landscape development through modelling, using mainly archaeological and geoscientific data, implies a rather traditional processual-archaeological framing (e.g. Johnson, Reference Johnson2010). This is not necessarily true. The main criticism of processual archaeology is the lack of human agency in the models and environmental determinism, the failure to account for social factors and interpretive biases (e.g. Johnson, Reference Johnson2010). Recently, however, various authors have suggested that fundamental changes are again taking place in archaeological theoretical thinking (e.g. Bintliff & Pearce, Reference Bintliff and Pearce2011; Olsen, Reference Olsen2012; Liden & Eriksson, Reference Lidén and Eriksson2013; Kristiansen et al., Reference Kristiansen, Šmejda and Turek2015). Kristiansen (Reference Kristiansen2014: 12), for example, has pointed to an ‘ongoing data revolution’ in archaeology and stated that progress in science-based techniques, archaeological-data infrastructures and computational possibilities requires the development of new archaeological methods and theories, terming this process a possible third science revolution within archaeology. Although the concept of a ‘third revolution’ in archaeology is criticised (e.g. Chilton, Reference Chilton2014), it is undeniable that recent developments in science-based and digital techniques do indeed for the first time allow empirical approaches towards reconstructing past long-term developments. The enormous potential of digital techniques such as agent-based modelling, network analyses, simulation modelling, archaeological and geoscientific data integration and Big Data approaches already has, and certainly will continue to have, a major influence on archaeological methods and theory.
The models presented in this paper are strongly founded on science-based methods and geoscientific data. Their results thus might raise the question whether post-processual criticism of physical, ecological or environmental ‘determinism’ (i.e. the notion that the physical environment predisposes societies towards specific development trajectories) is applicable. However, it should be noted that these models were constructed against individually developed theoretical backgrounds. The models specifically were designed to calculate spatial and chronological frameworks based on empirical data, spatially framing these processes without attempting to explain the nature of the reconstructed relationships, which would be a next research step. Additionally, the results all point towards a relatively large influence of the natural landscape on spatial-cultural patterns, as is evident from reconstructed settlement patterns and route networks (‘Settlement patterns’, ‘Route networks’ and ‘Long-distance transport’ in previous section). The implication is that in dynamic low-lying areas such as the Netherlands, natural-landscape setting and forcing to a large degree influenced the development of past cultural landscapes. Although cultural agency as a factor certainly should not be underestimated, this means that when dealing with such areas archaeologically, an essentially processual approach is crucial as a first step in order to create spatio-temporal frameworks for the purpose of determining high-resolution boundary conditions. Modelling approaches, as described in this paper, are eminently suited for this since they integrate and quantify historical and other data, and partly solve archaeological biases by multi-data integration. Therefore, in landscape archaeology, from a theoretical perspective when studying dynamic low-lying regions a balanced stance between processual and post-processual approaches is required, embracing parts of both perspectives. For, especially in lowlands, landscape does matter.
Acknowledgements
The research presented here in part was derived from Van Lanen (Reference Van Lanen2017) and was carried out within the research programme ‘The Dark Age of the Lowlands in an interdisciplinary light: people, landscape and climate in the Netherlands between AD 300 and 1000’ (www.darkagesproject.com) funded by the Netherlands Organisation for Scientific Research (NWO, section Humanities; 2012–19: 360-60-110). The author would like to thank Prof. Dr E. Jansma (Cultural Heritage Agency of the Netherlands), Prof. Dr T. Spek (University of Groningen) and Dr B.J. Groenewoudt (Cultural Heritage Agency of the Netherlands) for their help as supervisors during this research project. Special thanks also go out to all the co-authors who helped me during this time, most notably: Harm Jan Pierik (Utrecht University), Marjolein Gouw-Bouman (Utrecht University), Menne Kosian (Cultural Heritage Agency of the Netherlands), Lisette Kootker (Vrije Universiteit Amsterdam), Maurice de Kleijn (Vrije Universiteit Amsterdam), Jan van Doesburg (Cultural Heritage Agency of the Netherlands) and Willem Vletter (University of Vienna). Finally, I would like to thank the two anonymous reviewers for their useful comments on the manuscript.


 Open access

