





Introduction
A person like me who has built his loyalty from the age of 14 /…/ it was almost a personal grievance to go out and criticize the system that you yourself have been involved in building. /…/
We can’t have people going around representing the party and behaving in a reprehensible way. /…/ We have to protect the party and we protect the party by making sure that things like this come to the surface so that we can deal with it.
(A former local politician of the Swedish Social Democratic Party)Misconduct in political parties presents a dilemma for politicians. On the one hand, politicians in democracies have a responsibility to act in a fair and just way, represent their constituents, and uphold the rule of law. They cannot, as the quoted politician points out, transgress and behave inappropriately. Malfeasance in political parties can at best incur electoral costs for the party and at worst spread corruption, reduce citizen trust, and undermine democratic legitimacy (Bowler and Karp Reference Bowler and Karp2004; Maier Reference Maier2011). At the same time, the quote also testifies to a sense of being deeply invested in the party. These strong feelings of duty and loyalty towards the party are prominent among politicians in most political systems; party members share an ideological affinity and identity with one another and have interests in the electoral success of their parties. The career prospects of politicians are also in many cases closely tied to their relationship with party leadership (Folke and Rickne Reference Folke and Rickne2025). When they witness or are the victim of misconduct from a party colleague, however, they are confronted with the dilemma of whether to blow the whistle or not.
The study of whistleblowing and its antecedents is nothing new in the fields of business ethics, organisational behaviour, and, more recently, psychology, but it has seldom been applied to political organisations. In a notable exception, recent work in Sweden has found that almost half of surveyed politicians had experienced misconduct in the previous two years, yet this was reported only half of the time (Niklasson, Dawson, Bågenholm et al. Reference Niklasson, Dawson, Bågenholm and De Fine Licht2025). Whistleblowing – the disclosure of information regarding misconduct or wrongdoing within an organisation (Near and Miceli Reference Near and Miceli1985) – can take many forms; it can be internal within organisations, or external to third parties such as the media. The decision of which route an individual takes is believed to largely depend on the type and severity of misconduct (Near, Rehg, Van Scotter et al. Reference Near, Rehg, Van Scotter and Miceli2004). The same is true when deciding whether to blow the whistle in the first place (Latan, Jabbour, and Jabbour Reference Latan, Jabbour and Jabbour2019). This decision is more consistently related to contextual or situational factors than individual-level characteristics of witnesses or victims (Vadera, Aguilera, and Caza Reference Vadera, Aguilera and Caza2009). Reporting intentions are greater when perceived personal costs are lower, such as when the process can be anonymised (Ayers and Kaplan Reference Ayers and Kaplan2005), when there is a degree of support within the organisation (Bergeron and Thompson Reference Bergeron and Thompson2020), or when there are more opportunities for subsequent re-employment, as in the private sector (Rothschild and Miethe Reference Rothschild and Miethe1999). One of the strongest influencers of an individual’s willingness to report wrongdoing is a strong ethical culture in the organisation (Kaptein Reference Kaptein2011; Loe, Ferrell, and Mansfield Reference Loe, Ferrell and Mansfield2000). The organisations themselves, therefore, have a considerable effect on how misconduct is perceived and treated.
It is less clear how the process should look in political parties, where ethical standards and the potential reputational costs of blowing the whistle on a party colleague are both high. Research concerning the organisation of political parties has traditionally concerned ideologies and internal structures (Duverger Reference Duverger1954; Katz and Mair Reference Katz and Mair1995). Yet very little work considers the organisational culture of parties (Barrling Reference Barrling2013; Kitschelt Reference Kitschelt1994), which in other organisations has been shown to relate to the moral decision-making of members (Kohlberg Reference Kohlberg1984; Victor and Cullen Reference Victor and Cullen1988). This paper takes inspiration from psychological research, which has contended that the willingness of an individual to blow the whistle on misconduct or wrongdoing is the product of a trade-off between two basic moral values: fairness and loyalty (Waytz, Dungan, and Young Reference Waytz, Dungan and Young2013). This paper applies this framework to politicians who should consider both values to a similar degree; as public officials, politicians should act in a fair and just way, yet electoral and career incentives dictate that they should also be loyal to their party and not ‘upset the apple cart’. Misconduct by party colleagues brings these two values into direct conflict with one another. This article suggests that political parties can and do establish organisational cultures, and these cultures directly or indirectly determine the precedence of fairness vis-à-vis loyalty in potential whistleblowing situations. Whichever of these values is more prominent for politicians – as influenced by their party culture – will determine whistleblowing intentions and methods in the face of party misconduct. However, the effect of value prominence is also likely contingent on the severity of the misconduct and will have different implications for the choice of whether to call the misconduct out, within or outside of the party.
These expectations are tested in a pre-registered experiment with a sample of 1053 Swedish politicians, a population that should have both fairness and loyalty motivations.Footnote 1 Sweden is a country where fair conduct of public officials is generally expected (Marien and Werner Reference Marien and Werner2019). At the same time, there are strong and institutionalised parties that can determine the rank order of politicians on electoral lists, meaning party leadership largely controls the career trajectory of members. This study uses a priming approach to condition the relative salience of either fairness or loyalty and subsequently asks respondents about their internal and external whistleblowing intentions regarding a series of hypothetical misconduct scenarios. The results show that priming values of fairness increases the likelihood of politicians’ intent to blow the whistle, but priming loyalty has no impact. Further, results indicate that the effect of misconduct severity to be conditional on whether the misconduct was committed by an individual or the party collectively, and that the party’s response (or lack thereof) to be an even stronger predictor of external whistleblowing intentions than fairness value priming. These findings have significant implications for democratic governance and accountability procedures in political organisations, and stress the importance of organisational culture in politics. They also contribute to our understanding of the incentives and behaviours of politicians regarding the tolerance of unethical behaviour in one of the most important democratic institutions: political parties.
Determinants of whistleblowing
Several decades of research have documented at length the concept of whistleblowing in organisations. Classically defined, whistleblowing is ‘the disclosure by organization members (former or current) of illegal, immoral, or illegitimate practices under the control of their employers, to persons or organizations that may be able to effect action’ (Near and Miceli Reference Near and Miceli1985: 4).
According to this commonly adhered-to conceptualisation, the process can take place both internally within organisations and through external third parties, such as the media or bespoke whistleblowing functions. Likewise, disclosures can be made horizontally (e.g., to colleagues at a similar management level) or vertically to a more senior individual or body. The nature of the disclosure is also unrestricted in this definition, which can be done in conjunction with revealing one’s identity or anonymously. Certain organisational and situational factors often dictate how the process looks in practice, however. For example, internal whistleblowing – or reporting misconduct – in the absence of formal whistleblowing procedures is generally not anonymous. Likewise, disclosing one’s identity is often required to give credibility to accusations made through external channels such as the media (Flynn Reference Flynn2011). While the above definition of whistleblowing is conceptually and in theory quite broad, whistleblowing in practice tends to take on specific characteristics based on organisational and situational contexts.
Research on the determinants of whistleblowing primarily originates from the fields of business ethics and organisational behaviour. In this field, one of the main lines of enquiry has been the conditions under which certain individuals are more likely to report organisational wrongdoing and how (Culiberg and Mihelič Reference Culiberg and Katja Mihelič2017). Broadly, answers to this question can be broken down into three themes: the characteristics of the misconduct, individual characteristics of the whistleblower, and contextual/organisational factors.
Typologies characterising organisational misconduct and wrongdoing range significantly from simple misdemeanours to large-scale public scandals (Bågenholm, Dawson, Niklasson et al. Reference Bågenholm, Dawson, Niklasson, Licht and Höök2026; Brown Reference Brown2008; Thompson Reference Thompson1999). Previous findings suggest that whistleblowing intentions tend to be greater when the transgressions they relate to are more severe or salient (Latan, Jabbour, and Jabbour Reference Latan, Jabbour and Jabbour2019; Near, Rehg, Van Scotter et al. Reference Near, Rehg, Van Scotter and Miceli2004). Yet there may also be a tension between the seriousness of the misconduct and the urge to report; while serious (or illegal) instances of misconduct are more important to put an end to, research has also demonstrated that one of the biggest reasons that individuals do not report misconduct is due to a fear of reprisal from the organisation (Ayers and Kaplan Reference Ayers and Kaplan2005; Cassematis and Wortley Reference Cassematis and Wortley2013; Somers and Casal Reference Somers and Casal2011). This factor has been identified more acutely among women (Rehg, Miceli, Near et al. Reference Rehg, Miceli, Near and Van Scotter2008). Whistleblowers often face serious retaliation, such as ostracism, discrediting, denial of benefits and assignments, and ultimately dismissal (Hedin and Månsson Reference Hedin and Månsson2012; Liebes and Blum-Kulka Reference Liebes and Blum-Kulka2004; Rothschild and Miethe Reference Rothschild and Miethe1999). These reprisals in turn may be more likely when the reputational costs for the organisation – such as those incurred by serious misconduct – are highest.
A second, albeit less consistent, strand of research has considered the individual characteristics of would-be whistleblowers (Vadera, Aguilera, and Caza Reference Vadera, Aguilera and Caza2009). Gender is a factor that has produced mixed results. More recent results suggest that women report a higher intention to call out misconduct (Dalton and Radtke Reference Dalton and Radtke2013), but this may also be contingent on the availability of anonymous reporting channels (Kaplan, Pany, Samuels et al. Reference Kaplan, Pany, Samuels and Zhang2009). There is more consistent evidence showing that whistleblowers tend to be middle-aged, performing well in their jobs, and in relatively senior positions in the organisation (Krambia-Kapardis Reference Krambia-Kapardis2020; Mesmer-Magnus and Viswesvaran Reference Mesmer-Magnus and Viswesvaran2005). In short, these factors indicate individuals who feel more secure in their positions and thus perceive lower costs to speaking up.
Contextual determinants of whistleblowing primarily concern the relation of the would-be whistleblower vis-à-vis the victim and the organisation. For instance, whistleblowing is more likely when there is a closer organisational or personal link to the victim (Mesmer-Magnus and Viswesvaran Reference Mesmer-Magnus and Viswesvaran2005). The degree of support anticipated within the organisation can also affect the willingness to report misconduct through internal or external channels (Bergeron and Thompson Reference Bergeron and Thompson2020). Following the #metoo movement, increased awareness of sexual misconduct has led to an increase in the likelihood of it being reported (Cheng and Hsiaw Reference Cheng and Hsiaw2022). While the type of organisation is not a focal theme of the whistleblowing literature, it has been considered as a context in studies that use survey methods to investigate the issue. Some studies focus on specific organisations or types of organisations, such as the military (Near, Rehg, Van Scotter et al. Reference Near, Rehg, Van Scotter and Miceli2004), the police (Park and Blenkinsopp Reference Park and Blenkinsopp2009), or other government agencies (Brown Reference Brown2008). Other studies have pooled survey respondents across sectors and identified those in the private sector to be more likely than their public sector counterparts to blow the whistle due to lower exit costs and a greater ability to find re-employment (Krambia-Kapardis Reference Krambia-Kapardis2020; Rothschild and Miethe Reference Rothschild and Miethe1999), though these findings may be context-dependent (Berndtsson, Johansson, and Karlsson Reference Berndtsson, Johansson and Karlsson2018).
Overall, the literature on the determinants of whistleblowing in organisations paints a picture that contextual and situational factors are far more consistent predictors of when whistleblowing will occur than individual characteristics of organisation members. Ultimately, this suggests the precedence of institutional structures and systems that facilitate the willingness and ability of individuals to step forward. Important to note, however, is that not much of the research above concerns strictly political organisations, and even less concerns political parties; organisations that operate at the heart of democracy and constitute a key link between the political elite and citizens (Katz and Müller Reference Katz and Müller1997; Ware Reference Ware1987). One exception notes that leaks relating to misconduct in parties tend to coincide with nomination periods for electoral lists, suggesting a willingness to call out misconduct strategically (Bågenholm, Dawson, Niklasson et al. Reference Bågenholm, Dawson, Niklasson, Licht and Höök2026). Overall, however, with their unique hierarchical structures and close ideological bonds – in addition to the strong interest of members at all levels (not just management) to maintain a positive external reputation – parties and politicians are a black box of whistleblowing research (Niklasson, Dawson, Bågenholm et al. Reference Niklasson, Dawson, Bågenholm and De Fine Licht2025).
Whistleblowing in parties: theoretical expectations
Waytz, Dungan, and Young (Reference Waytz, Dungan and Young2013) characterise the willingness to blow the whistle as the result of a trade-off between two of the five basic moral values of moral foundations theory (Graham, Nosek, Haidt et al. Reference Graham, Nosek, Haidt, Iyer, Koleva and Ditto2011): fairness and loyalty. Fairness-oriented values relate to justice in that all individuals should be treated in an even-handed and equal way. Loyalty, in contrast, relates to the preferential treatment or favouring of the in-group – even in cases where individuals of that group may be in the wrong (Graham, Nosek, Haidt et al. Reference Graham, Nosek, Haidt, Iyer, Koleva and Ditto2011). In the case of whistleblowing, these two values are said to come into direct conflict with one another. All else equal, if contextual factors lead an individual to prioritise fairness over loyalty to the party, then whistleblowing will be more likely, and vice versa. While their argument refers to the individual level, the contention can be extended to organisational culture, which takes a position on this same loyalty-fairness continuum when misconduct occurs within an organisation. This is a particularly challenging proposition for political parties, which are comprised of political officials who are duty-bound to act in a fair and just way on the one hand and have high incentives for loyalty to party institutions and leadership on the other.
There are several reasons why we would expect politicians to blow the whistle when experiencing misconduct. In their role as political officials, politicians are likely to feel a moral responsibility to act in the best interests of their constituents (Mozumder Reference Mozumder2022). By reporting misconduct committed, individual politicians may demonstrate that they stand up for what is right and fair and thus gain the trust and respect of their voters, something which may benefit them personally, as well as the party in future elections – a dynamic that has been shown to exist in the context of supporting anti-corruption reform, for example (Guajardo Reference Guajardo2025). Politicians may also be more forthcoming due to their (to varying extents) high profiles and typically extrovert personality-types (Bjørkelo, Einarsen, and Matthiesen Reference Bjørkelo, Einarsen and Berge Matthiesen2010). Furthermore, as the operatives of democracy, politicians work under the principles of the rule of law and justice. They are, therefore, well-placed and typically well-informed to act in a fair way and ensure that those around them do the same. Lastly, while whistleblowing is mostly said to be driven by fairness concerns, reporting party misconduct may also be an attempt to do the party a favour, e.g., by saving it from a few ‘bad apples’ who are misbehaving and who risk becoming a liability to the party. Blowing the whistle in such cases is in line with the interests of the party if this report prevents or suppresses a (potentially larger) scandal. An act of fairness may thus be intended as an act of loyalty. For these reasons, one would expect politicians to be among the most likely in society to react to misconduct that they become aware of.
At the same time, there are also several reasons why politicians might not want to blow the whistle when they witness misconduct in their party. Blowing the whistle on one’s own organisation – particularly externally – can come with severe reprisals for the whistleblower and significant reputational costs for the organisation they belong to. Arguably, political parties are unique in the high exit costs they impose on potential whistleblowers; the cost of publicly exposing organisational misconduct in a political party vis-á-vis a private sector organisation is likely far greater due to the restricted ability of the whistleblower to find an alternative position in a rival political party. Politicians may not want to reveal negative information about a party they support ideologically despite occurrences of misconduct, for fear of electoral punishment by voters. The popularity of the organisation is typically not something that would be as much of a concern for a whistleblower in the private sector, for example.
A witness of misconduct may also fear negative consequences for their own career prospects if they show disloyalty by blowing the whistle on a colleague’s behaviour. If a politician is motivated to progress in a political career, their success is often highly dependent on their standing within the party. Drawing negative public attention to the organisation is likely to undermine that ambition, and such actions may result in them being pushed down the ballot list or even kicked out of the party. While this argument applies primarily to national-level politicians, who in Sweden operate in their roles full-time and whose careers are closely linked to their standing within the party, local politicians may also face similar incentive structures. In many cases, subnational politicians have the ambition to navigate the ‘career ladder’ from local to national politics (see Folke and Rickne Reference Folke and Rickne2025), and as such, would consider their career prospects in the hands of party leadership. This does not apply as indiscriminately as it does at the national level, however, given that local politicians are typically older and work on a part-time basis.Footnote 2
The organisational culture within parties could be a key element in determining whether a politician blows the whistle or not. More specifically, ethical cultures – defined as an aspect of organisational culture that influences employees’ ethical behaviour through formal and informal structures and systems (Treviño Reference Treviño, Woodman and Passmore1990) – are one of the factors most consistently associated with the willingness to call out wrongdoing (Kaptein Reference Kaptein2011; Loe, Ferrell, and Mansfield Reference Loe, Ferrell and Mansfield2000). At the same time, organisational cultures and practices can also normalise unethical behaviour such as corruption (Ashforth and Anand Reference Ashforth and Anand2003). Victor and Cullen (Reference Victor and Cullen1988) argue that ethical climates – institutionalised normative systems – can and do vary significantly between organisations. These ethical climates are said to be determined by a combination of sociocultural environment, organisational form, and organisation-specific history. This has two important implications for the case of whistleblowing in political parties. First, the ethical climate of parties is likely distinct from that of other organisations – and as such, they may be more similar to each other than other organisations. Second, parties can and do vary in relation to one another in terms of the types of ethical climates that are shaped by these factors. This theoretical implication is empirically substantiated in the case of Sweden, where parties have been demonstrated to vary significantly in cultures of individualism or collectivism, for example (Barrling Reference Barrling2013).Footnote 3 As such, in political parties (and in some more than others), loyalty and/or fairness can become a central normative expectation within the ethical climate, shaping what is perceived as the ‘right’ course of action in processes of moral decision-making (Kohlberg Reference Kohlberg1984).
Overall, the default position for the typical politician is expected to be to try to act in both a fair and loyal way. While Swedish parties are generally strong and have discretion over the rank order of electoral lists, the general population in Sweden values fairness particularly highly relative to other European countries (Marien and Werner Reference Marien and Werner2019). Indeed, individuals who consider themselves to be more motivated by fairness and/or loyalty are perhaps more likely to enter politics than individuals who have other motivations. When these values are pitted against one another, however – as in the case of witnessing misconduct within their own party – the prominent value should determine the preferred course of action: namely, whether to blow the whistle or not. The prominence of values for politicians can be reinforced by, among other factors, formal and informal normative systems leading to an organisational culture or ethical climate established and reinforced by fellow party members and party leadership. That is, political parties have the capacity to emphasise these values and instil a culture that may prioritise one value over the other and make it a (relatively) more prominent value for a political official from that party. This results in the following baseline hypotheses:
H1a Politicians will be more likely to blow the whistle on misconduct when their democratic duty to act in a fair or just way is more prominent.
H1b Politicians will be less likely to blow the whistle on misconduct when their duty to remain loyal to their party is more prominent.
In addition, the intention to blow the whistle on misconduct – that is, the point at which fairness trumps loyalty – is likely contingent on the severity of the misconduct (Latan, Jabbour, and Jabbour Reference Latan, Jabbour and Jabbour2019). Less severe instances of wrongdoing may more easily be ignored or not deemed significant enough issues to disrupt harmony within the party, or may not be worth the high costs incurred by revealing misconduct. The effect of fairness being the prominent value on whistleblowing intention should be stronger in cases where the misconduct is more severe, and the effect of loyalty should be weaker. Likewise, in cases where misconduct is less severe, loyalty prominence will be more effective and fairness less so.
H2a Politicians will be more likely to blow the whistle when the misconduct is more severe.
H2b In more severe misconduct cases, the fairness priming effect will be stronger, and the loyalty priming effect weaker.
H2c In less severe misconduct cases, the loyalty priming effect will be stronger, and the fairness priming effect weaker.
Given the high reputational costs for the organisation in which a misconduct occurs, combined with the ideological affinity politicians have with their parties, politicians’ baseline preference for reporting should be through internal party channels. Previous research has highlighted how reporting misconduct can be dependent on the perceived level of organisational support (Bergeron and Thompson, Reference Bergeron and Thompson2020). The findings are connected with organisational cultures of fairness and loyalty, suggesting that when loyalty is prominent, reported misconduct should be addressed internally. Conversely, a higher propensity to blow the whistle externally is expected when fairness is the dominant value.
H3a Politicians will be more likely to blow the whistle internally than externally.
H3b External whistleblowing will be more likely when fairness is more prominent.
H3c Internal whistleblowing will be more likely when loyalty to the party is more prominent.
Research design
These hypotheses are tested using a pre-registered survey experiment of 1,053 Swedish politicians operating at the local, regional, or national level(s), conducted between November 2024 and January 2025.Footnote 4 The experiment was embedded in the Politikerpanel, a panel of Swedish politicians administered by the SOM (Society, Opinion, and Media) Institute, which is fielded twice annually and asks respondents about their views on Swedish society. Subjects are able to opt in to take part in a survey about political science and are invited to do so via publicly available email addresses (Naurin and Öhberg Reference Naurin and Öhberg2021). In addition to the 349 sitting members of the national parliament (Riksdag), Sweden is comprised of 21 regions and 290 municipalities, containing a total of close to 40,000 elected representatives (Statistics Sweden 2024). This survey containing the experiment was sent out to 2,900 politicians with a response rate of 36.3%.
Sweden is an appropriate case for this study because fairness and loyalty are expected to be similarly (highly) valued by politicians. Sweden has high levels of gender equality, social trust (Esaiasson, Sohlberg, Ghersetti et al. Reference Esaiasson, Sohlberg, Ghersetti and Johansson2021), perceptions of fairness among public officials (Marien and Werner Reference Marien and Werner2019), and a relatively low tolerance of corruption (Erlingsson and Kristinsson Reference Erlingsson and Helgi Kristinsson2019). Whistleblowers are legally well-protected (Bauhr and Grimes Reference Bauhr and Grimes2017), and some parties have dedicated internal whistleblowing functions.Footnote 5 All parties that are represented at the Swedish national parliament (Riksdag) have formal ethical codes and guidelines for members, though these are not always strictly enforced (Andersson and Larue Reference Andersson and Larue2025). At the same time, Swedish parties have significant control over nomination procedures as well as the order in which candidates appear on ballot lists. An individual’s career progression is, therefore, highly dependent on their relationship to the party leadership (Folke and Rickne Reference Folke and Rickne2025). The major parties in Sweden are also represented at local, regional, and national levels, meaning the impact of scandals could be felt across all levels. Both fairness and loyalty are, therefore, expected to be major motivations for the behaviour of politicians in Sweden.
Experimental set-up
As the focus of this study is the implications of a trade-off between two moral values (fairness and loyalty), a priming approach is employed to treat respondents by increasing the prominence of one of these values relative to the other. This is intended to mimic organisational (party) cultures that place greater emphasis on one of these values relative to the other. The sample is split into three groups. A first group is presented with a textual and visual treatment demonstrating the value voters place on loyalty for politicians based on previous research.Footnote 6 Subsequently, they are presented with several factors that can make loyalty to the party an important value for politicians, and asked to select which of these factors they consider most important to them.Footnote 7 The priming information therefore includes preference-based cues as relates to the electorate (what voters want or expect) and normative/utility cues (why this value is important). The question is also designed to engage the respondent with the content of the text and encourage cognitive processing to a greater degree than simply reading it. A second group is presented with a similar treatment and identical question, but the text refers to the importance of the fairness of politicians. A third pure control group does not receive any treatment information.Footnote 8
Our priming treatments are therefore explicit in that they refer directly to the concepts of interest, but they are abstracted from whistleblowing and misconduct. This serves two purposes. Firstly, explicit priming is a more internally valid approach, as there can be greater certainty that treatments will make salient the values that are intended to be primed. Secondly, explicit primes are more appropriate in this case as an aim of the study is to draw conclusions about parties as organisations that can instil certain cultures or values through explicit means (policy positions, internal memos, codes of conduct, etc.). The treatment stimuli are therefore more representative of how parties could try to influence the conduct of their members and officials.
Following the priming stage, respondents of all groups are presented with a series of four hypothetical scenarios in a randomised order and asked about their whistleblowing intention on a 1–7 scale.Footnote 9 The four scenarios detail incidences of misconduct that vary across two dimensions: severity (low vs. high) and type (personal conduct and internal party decision-making).Footnote 10 These scenarios are designed to be representative of the most common incidents of misconducts in political parties (Niklasson, Dawson, Bågenholm et al. Reference Niklasson, Dawson, Bågenholm and De Fine Licht2025). Following the scenario, respondents are asked how likely they would be in each case to report the issue to (a) a senior member in the party, (b) an authority figure outside of the party, or (c) a journalist.Footnote 11 , Footnote 12 There are two measures of external whistleblowing intention ((b) and (c)) to prevent respondents from being discouraged from reporting external whistleblowing simply because they would not do one or the other. For example, a respondent may consider reporting misconduct to an external authority figure if they perceived the transgression to be serious enough, but under no condition would they report this to the media (or vice versa). The external option is therefore bisected to avoid this potential conflict.
By asking about several instances of misconduct that vary along two dimensions (severity and type), this design mimics a conjoint design in that these scenarios can be pooled and the dimensions in which they vary can be analysed as covariates. The difference in this case is that respondents were asked about all four scenarios and, as such, all dimensions of variation. This design also removes the requirement to force a respondent to pick one option (or misconduct) over another, which can risk creating false impressions of an effect where, in reality, the respondent may not blow the whistle in either scenario.
Results
This section documents the results of a series of analyses that assess each of the study’s hypotheses. The general approach taken is to pool and average whistleblowing intention responses across scenarios and outcome questions by respondent, thereby creating an overall whistleblowing intention measure for each participant. Across the whole sample, the average likelihood of reporting misconduct is 4.25 on a scale of 1–7, meaning an aggregate rate of speaking up having witnessed misconduct of 54%. This is, at first glance, a startling figure, yet it masks significant variation between internal and external channels. Across all scenarios, the mean level of reporting misconduct internally within the party is 6.33 (89%) relative to 2.85 (31%) for external whistleblowing. This corroborates previous findings, which show a clear preference for internal disciplinary procedures for conflict resolution in political parties (Niklasson, Dawson, Bågenholm et al. Reference Niklasson, Dawson, Bågenholm and De Fine Licht2025).
The heterogeneous effects anticipated by Hypotheses sets 2 and 3 are investigated by calculating alternative whistleblowing intention measures that are based only on the more/less severe scenarios, for example. This approach means that it is possible to investigate each hypothesis with the same three-group (control, fairness, and loyalty) set-up, with the same number of respondents – and as such the same statistical power – in each test. The only aspects altered between tests are the scenarios and outcome measures considered. For each analysis, the appropriate measure of whistleblowing intention is regressed on treatment group, age, gender, education, a dummy measure of whether the politician works at the national or subnational level, and a measure of seniority within the party.Footnote 13 All models also include party fixed effects and cluster standard errors at the party level.Footnote 14
Fairness versus loyalty priming effects
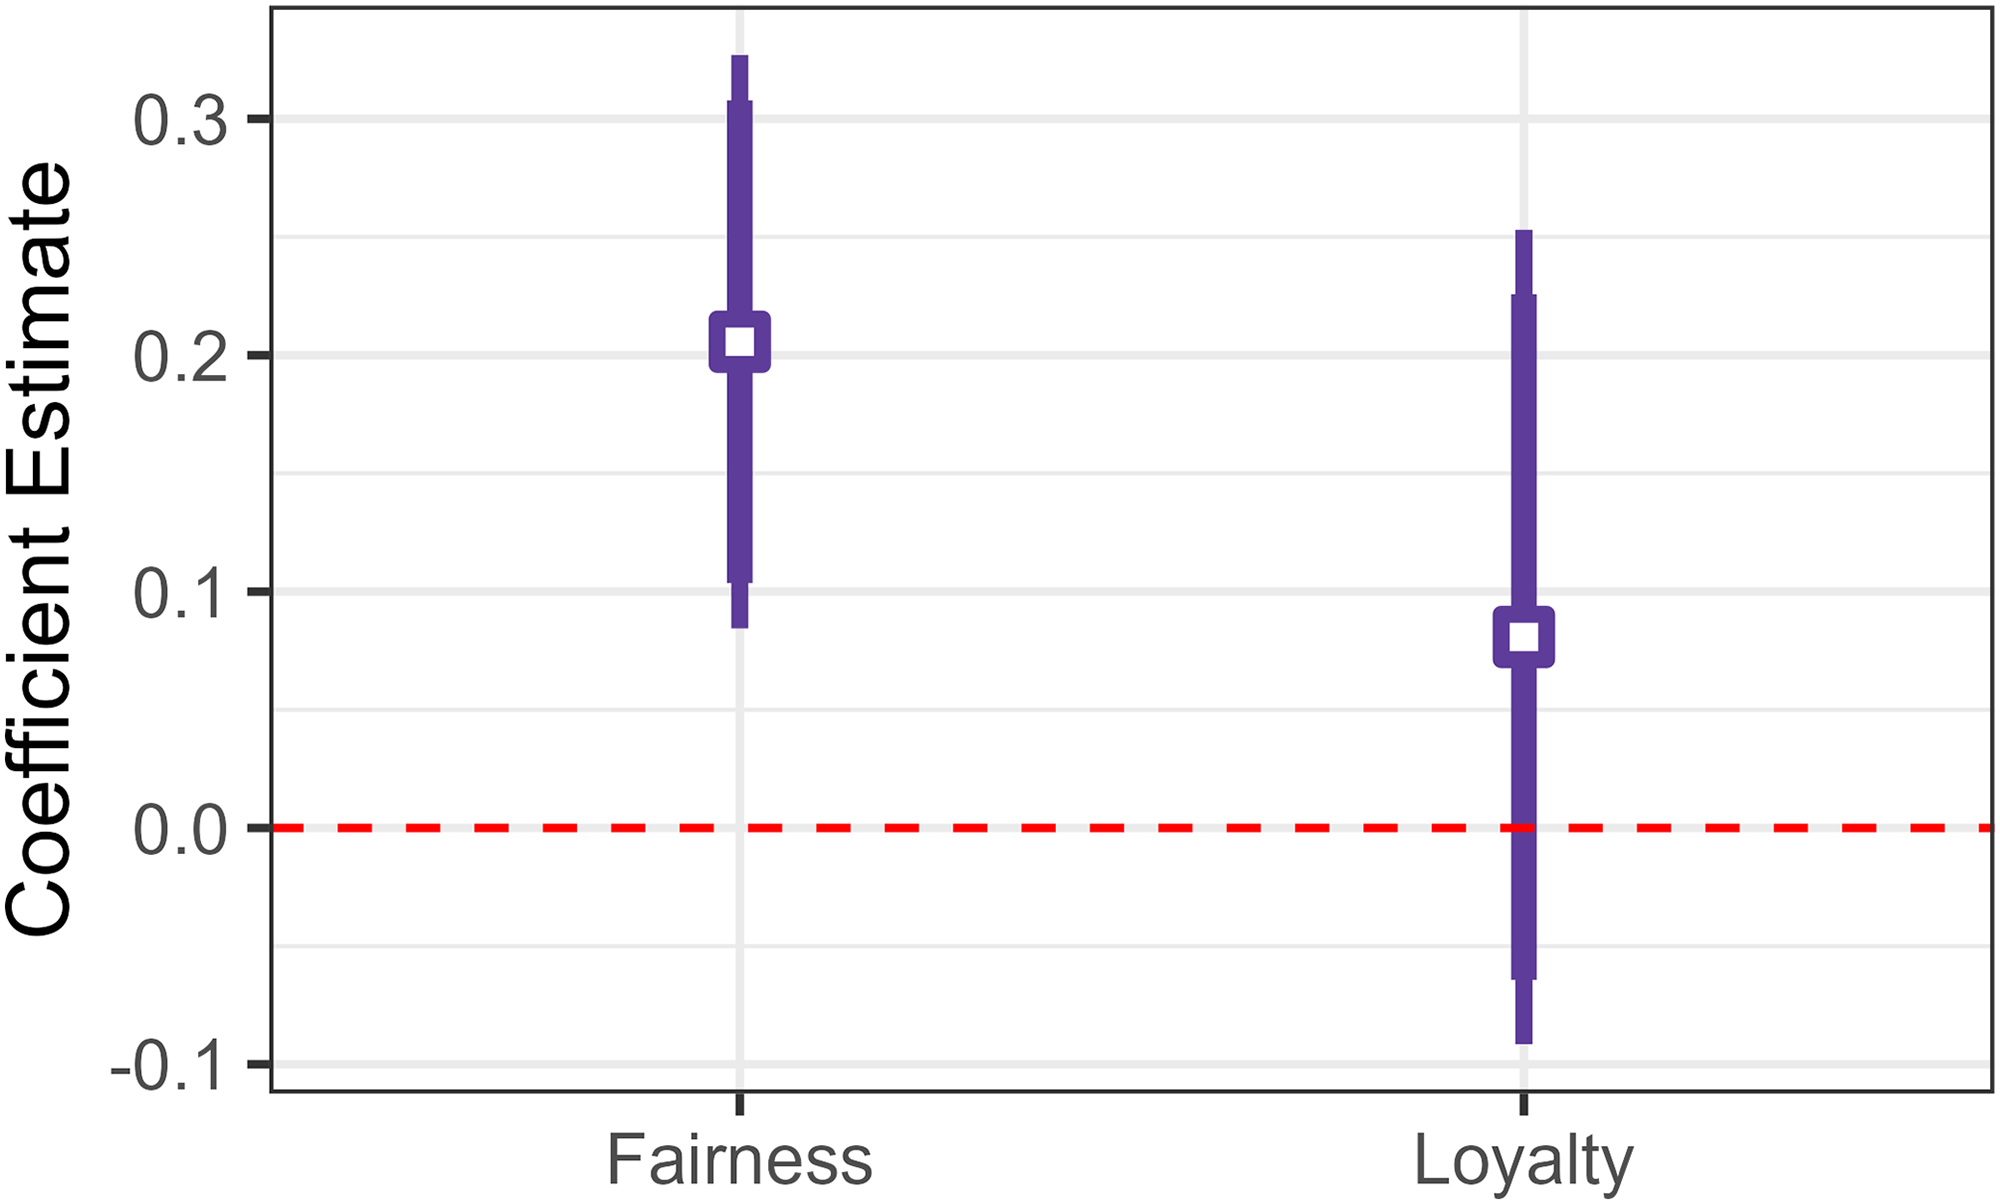
The baseline results regarding H1a and H1b are illustrated in Figure 1.Footnote 15 The mean whistleblowing intention level for the control group is 4.16 on a 1–7 scale. H1a is supported in that the coefficient plot illustrates a significant increase in the likelihood of reporting misconduct for the group primed with fairness relative to the control group (t = 3.32). The point estimate of 0.21 equates to 23% of the standard deviation of the mean whistleblowing intention variable (0.92), which is a considerable effect size. Regarding H1b, however, there is no statistical difference between those primed with loyalty to the party and the control group. H1b anticipates a decreased likelihood of reporting misconduct relative to the control group, while Figure 1 indicates a positive and statistically insignificant effect.Footnote 16
Coefficient plot of the effect of fairness and loyalty primes on whistleblowing intention. The dependent variable is the likelihood of reporting misconduct, averaged across all channels and scenarios. Confidence intervals, calculated from standard errors clustered at the party level, are represented by vertical lines at the 90% (thick) and 95% (thin) levels. The horizontal dashed red line represents the control group. Numerical results can be found in Table A8.

Nature of misconduct and reporting channel
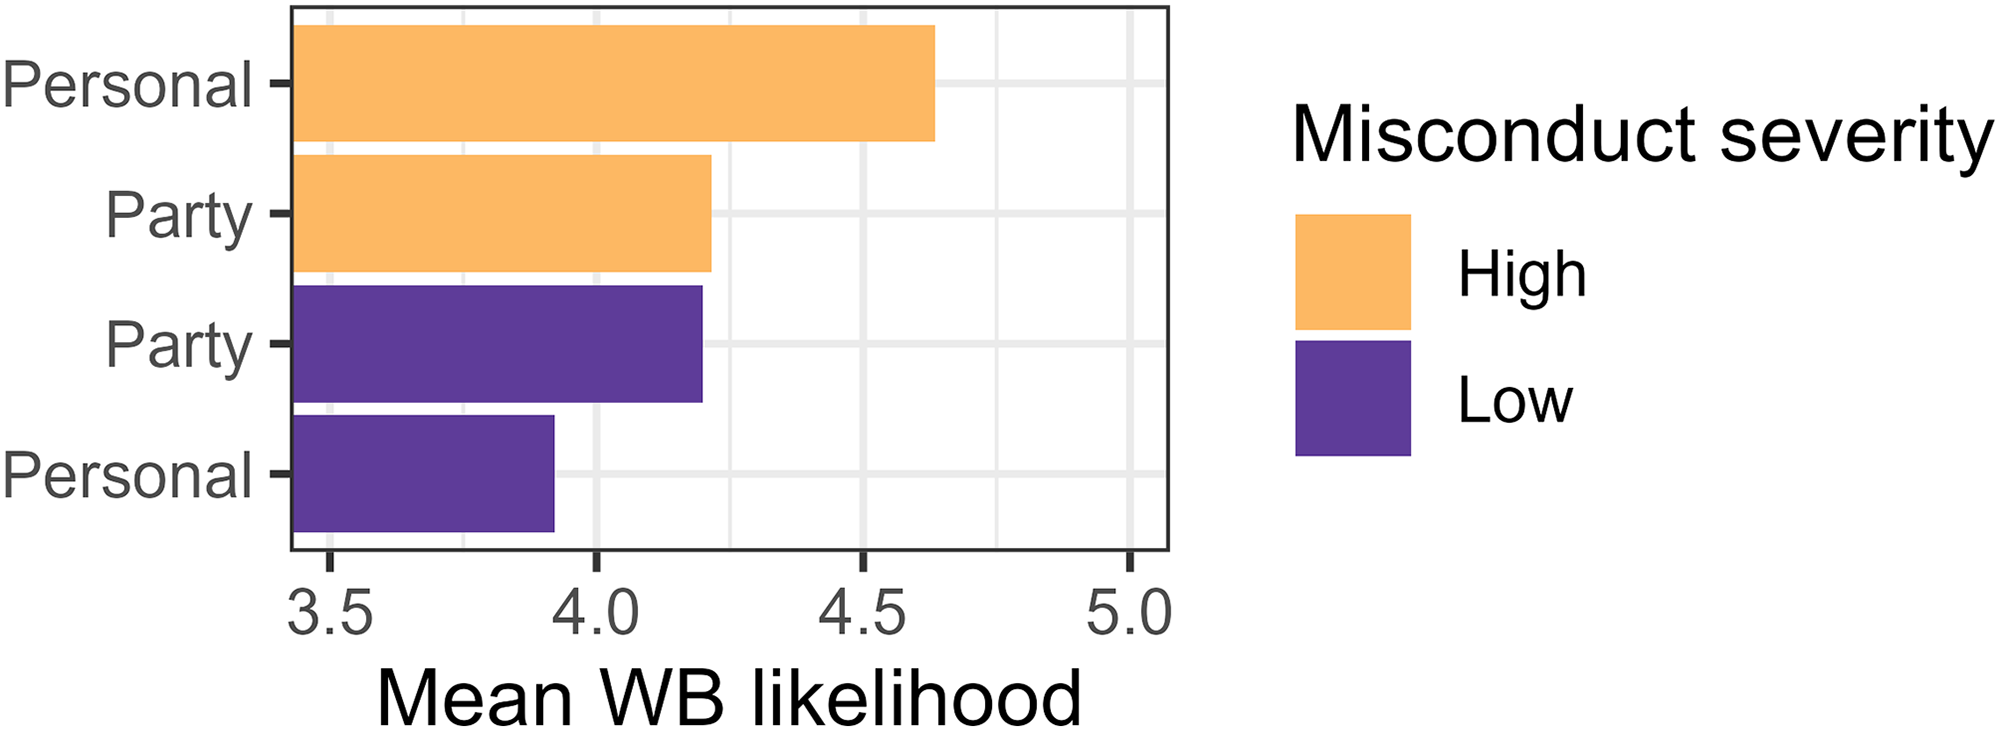
This section considers how willingness to blow the whistle may also be conditioned by the nature of the misconduct and the reporting channel. First, Figure 2 demonstrates the mean likelihood of whistleblowing based on the four scenarios presented to respondents. Willingness to report is evidently higher in more severe misconduct cases, though the contrast is much starker in the case of misconduct committed by an individual than by the party collectively. In cases of the latter, there is only a marginal difference in the willingness to blow the whistle across the two scenarios. Thus, while there is descriptive support for H2a, this appears limited to certain types of misconduct.
A bar plot illustrating the mean likelihood of whistleblowing across misconduct type (referring to an individual or the party) and severity. WB (whistleblowing) likelihood is the average value across all reporting channels. The dependent variable is on a 1–7 scale.

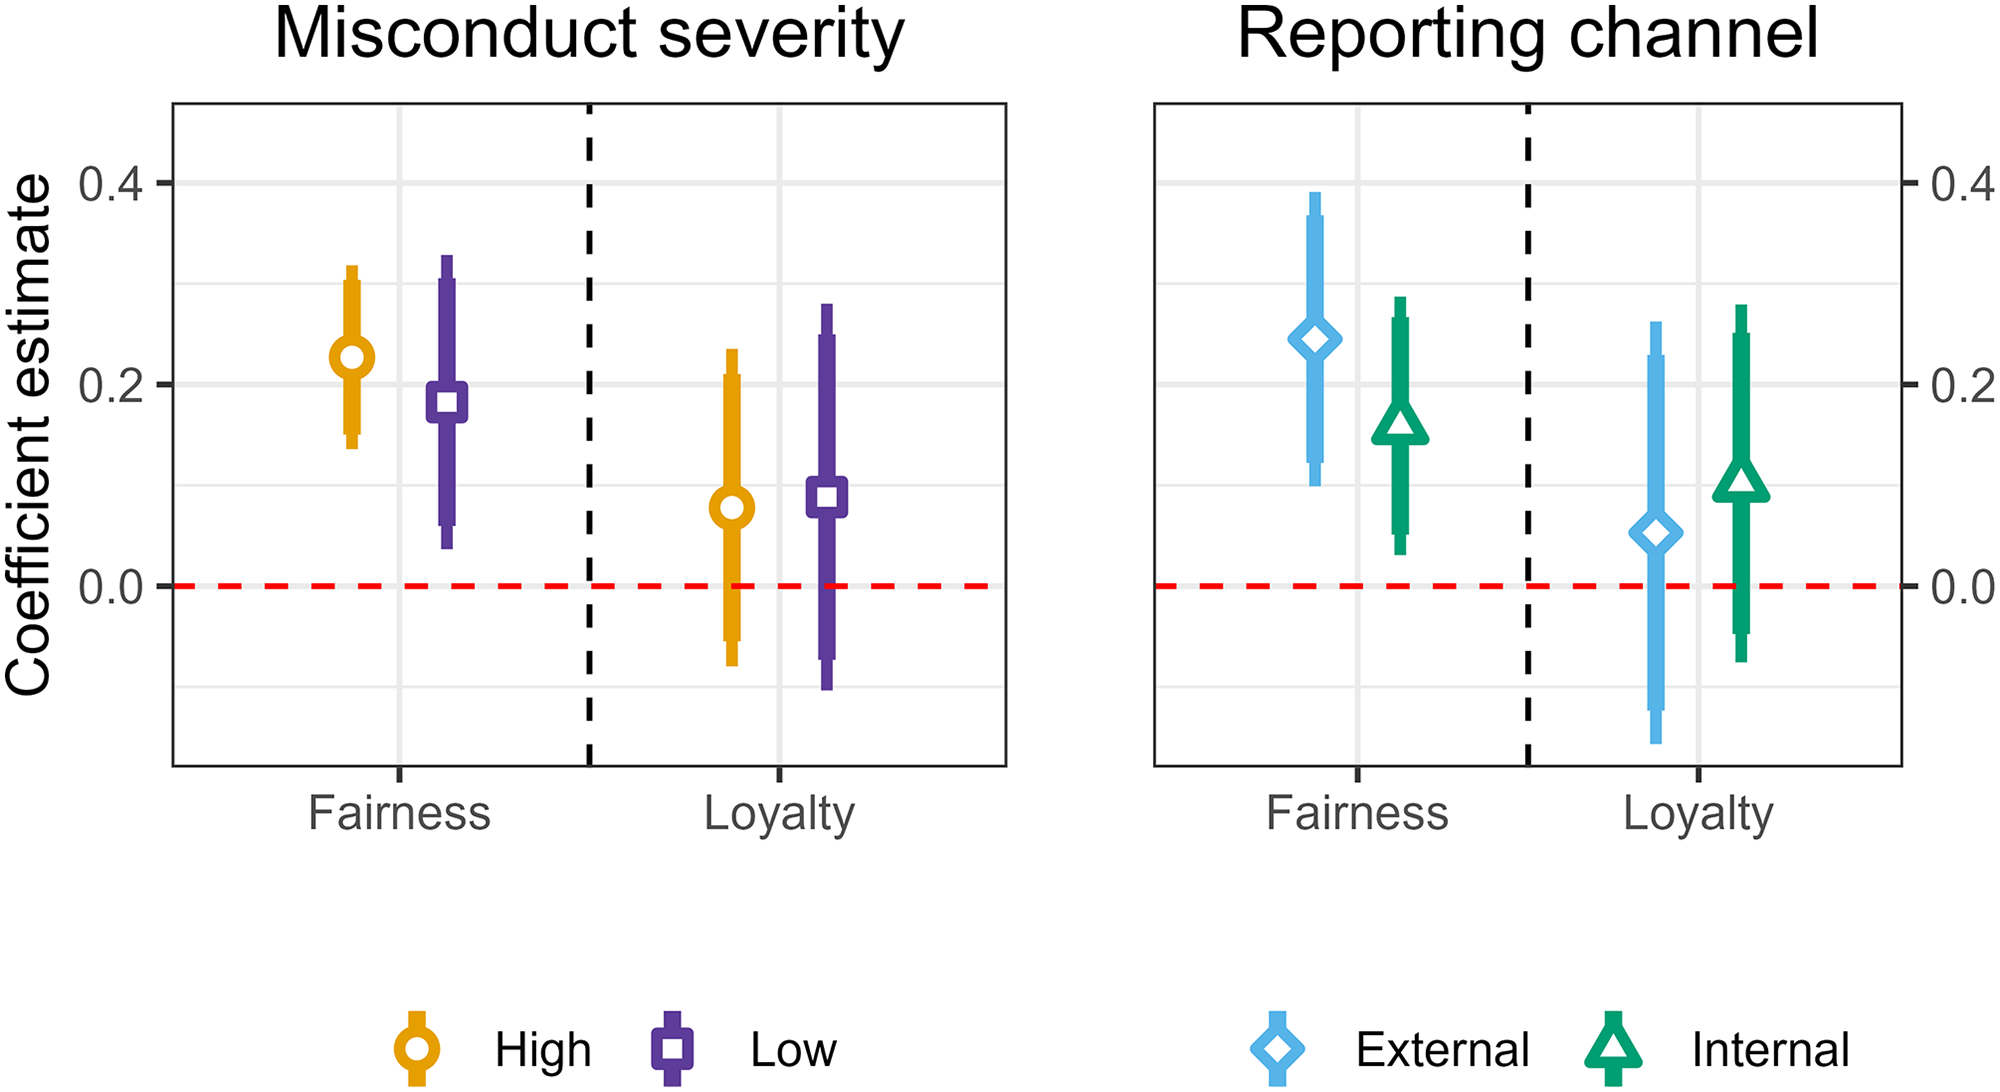
How this consideration interacts with the treatment variables is assessed in the coefficient plots presented in the left-hand panel in Figure 3. Surprisingly, and in contrast to the expectations of H2b and H2c, the severity of misconduct has little impact on the priming effects of fairness or loyalty. Thus, this result indicates that politicians in parties that reinforce a culture of fairness to a greater extent are equally more likely to report misconduct that is more or less severe.Footnote 17
Coefficient plot of the effect of fairness and loyalty primes on whistleblowing intention across levels of misconduct severity (left-hand panel) and reporting channel (right-hand panel). The dependent variable is the likelihood of reporting misconduct, averaged across relevant channels and scenarios at the respondent level (1–7). Confidence intervals, calculated from standard errors clustered at the party level, are represented by vertical lines at the 90% (thick) and 95% (thin) levels. The horizontal dashed red line represents the control group. Numerical results can be found in Table A8.

The right-hand panel in Figure 3 considers the expectations formulated in hypotheses H3b and H3c, namely that external whistleblowing should be more likely for the fairness group, and internal whistleblowing (or reporting) should be more likely in the loyalty group. While there is a higher point estimate for external vis-à-vis internal whistleblowing in the fairness group, this comparison does not yield a statistically significant result, and, as such, H3b is not confirmed. In sum, the results presented in Figure 3 do not indicate a conditional nature of the relationship between organisational culture and whistleblowing intention. In each case, the group primed with fairness is more likely to call out misconduct than the control group, and the group primed with loyalty is not.Footnote 18
Party reactions
In a final step, the analysis turns to situations in which initial attempts to report misconduct internally have been unsuccessful. This is a frequent occurrence that, in many cases, has been cited as motivation to move to external whistleblowing as an alternative to internal reporting. Following the presentation of each scenario to respondents, a question was also presented in which they were asked to imagine that they had internally reported the misconduct, and that several weeks had passed without a reaction from the party to address the situation. Respondents were subsequently asked once again about their intention to report internally and externally.
Figure 4 compares internal and external reporting intentions for initial and follow-up questions (where the party is reported to have not acted) for each treatment group. What is evident from this figure is that the likelihood of reporting externally (what is colloquially more thought of as whistleblowing) is considerably more likely in response to party inaction. A similar increase is not observed for the likelihood of reporting internally.Footnote 19 Interestingly, this finding is almost identical across treatment groups and the control group. In each of the three experimental groups, the difference in external whistleblowing intention from initial to follow-up questions is at least 0.5 (t-values ranging from 4.82 to 5.79, see Table A10). This suggests that the effect of a fairness-based organisational culture may be contingent on the anticipation of the party acting in a fair way. When acting in a fair way is not reciprocated by the party, politicians act no differently in parties with fairness-oriented or loyalty-oriented organisational cultures.
These plots show the mean internal (top row) and external (bottom row) whistleblowing likelihood for each experimental group. The two dots in each panel demonstrate the average reporting likelihood in the initial phase and follow-up phase (i.e., when the party is said not to have responded to the initial report). Vertical solid lines represent 95% confidence intervals. The dashed line between the two points illustrates the change in likelihood of reporting from one phase to the other. Numerical results can be found in Tables A9 and A10.

Discussion
Misconduct in politics – when left unchecked – can have severe consequences for democratic legitimacy and institutional trust, yet it is at the same time significantly underreported. When observing a party colleague committing misconduct, politicians are forced to choose between a fair (speaking up) and loyal (remaining quiet) course of action. This paper has argued that the organisational culture within parties can have a significant impact on the moral decision-making and behaviour of its members. To test this contention, this paper uses an elite survey experiment in Sweden to test how fairness and loyalty motivations can affect the willingness of politicians to call out misbehaving colleagues. It finds robust evidence across a range of different scenarios that when fairness motivations are activated, politicians are significantly more likely to step forward and blow the whistle on misconduct in their party. However, the converse was not found in the case of loyalty.
The null effect of priming loyalty may have several plausible explanations. First, one interpretation of this result is that members of political parties with more loyal organisational cultures (those represented by the loyalty treatment group in the experimental set-up) are no more or less likely to report misconduct than politicians in general. In other words, loyalty may not affect whistleblowing intentions. However, given that robust significant effects are found for the countervailing moral value of fairness – as well as the bidirectional effects of the fairness prime on both manipulation checks – this explanation is not wholly satisfactory.
A second interpretation is that the loyalty treatment was not valid or while it may be possible to prime loyalty, this particular manipulation failed to do so. This conclusion is supported by the numerical results of the analyses and the manipulation checks, both of which indicate the absence of a meaningful difference between loyalty and control groups. To probe whether this is due to a lack of strength in the treatment text, Appendix C (Figure A2) investigates the difference between the treatment groups and control (t-values) for post-treatment questions about how important respondents believe each value to be for politicians (manipulation checks) over the number of seconds respondents remained on the page with the priming texts (treatment exposure). The assumption is that the longer a respondent is exposed to treatment, the more likely they are to cognitively engage with the treatment text, and as such, should differ more from the control group in the manipulation checks. While expected patterns are observed for the fairness group, this does not appear to be the case for the loyalty group, where critical t-values are not observed at any length of treatment exposure. This result invites two possible interpretations: (1) the loyalty prime was not merely weak but entirely ineffective; or (2) the loyalty treatment had no observable effect because participants’ loyalty values were already activated prior to the experiment.
Finally, it may also be possible that fairness is simply easier to prime due to it being the ‘preferred’ value, as evidenced by the higher importance attributed to fairness across all groups in the manipulation checks. Indeed, the sample is predominantly made up of subnational politicians, who are on average less career-driven and, as such, may be less motivated by party loyalty (Stolz Reference Stolz2003). The mean importance attributed to fairness (6.49) in the control group is higher than that of loyalty (5.88).
However, these answers are given independently of one another. In reality and in behaviour – and as demonstrated by the scenarios of this experiment – these values are often pitted against one another. In these circumstances, it is also possible that politicians default to loyalty. This interpretation aligns with previous research indicating that demonstrable loyalty tends to be stronger, and tendencies to dissent weaker, in political parties characterised by high levels of internal discipline, such as larger and more established parties (Niklasson, Dawson, Bågenholm et al. Reference Niklasson, Dawson, Bågenholm and De Fine Licht2025). These kinds of parties constitute the majority of the sample. A possible implication of this interpretation is that loyalty primes may be more effective in contexts where political parties are less institutionalised and exhibit weaker internal cohesion. In highly institutionalised settings like Sweden, however, politicians may already be ‘pre-primed’ to behave in a loyal manner, rendering additional loyalty priming redundant.
In relation to Hypothesis set 2, this paper has also found that willingness to blow the whistle is related to the severity of misconduct when misconduct is committed by individuals rather than the party collectively. This can perhaps be explained by the fact that loyalty – as primed here and as perceived generally by politicians – may relate more to the party than their party colleagues. In this context, politicians may feel as though they are acting in an equally fair and loyal way when reporting misconduct committed by one ‘bad apple’. This adds further nuance to the discussion of whistleblowing and its relation to moral foundations theory, particularly as concerns the object of loyalty or the ‘locus of analysis’ of the ethical climate (Victor and Cullen Reference Victor and Cullen1988).
At the same time, the results suggest that fairness and loyalty cultures do not disproportionately affect the likelihood of internal vis-á-vis external whistleblowing (Hypothesis set 3). However, the parties’ response (or lack thereof) to internal reports markedly impacts the likelihood of blowing the whistle externally. This is, in fact, the strongest effect found in the study – stronger than the effect of any experimental treatment. This is suggestive of an expectation of fairness on the part of the party, which, when reneged on, dramatically increases politicians’ willingness to report outside of the party. Taking immediate and firm action against misconduct when it is reported internally is, therefore, in the self-interest of parties who do not wish to risk that reports reach the public instead. This finding has important implications for organisational disciplinary procedures and their consequences for governance: parties (and organisations more broadly) that wish to avoid negative publicity and maintain their perceived institutional fairness by members ought to address issues when they are initially reported internally.
Conclusion
When do politicians choose to upset the apple cart? This experimental study on a sample of Swedish politicians has shown that priming fairness motivations makes politicians more likely to blow the whistle on misconduct in their own party, while priming loyalty motivations has no effect on this propensity. In addition, misconduct severity matters for this decision only when the perpetrator is an individual party member rather than the party as a whole, and the party’s response ultimately predicts external whistleblowing intentions more strongly than fairness priming.
It must be noted that the study bases its measures and conclusions on whistleblowing intention rather than actual whistleblowing behaviour, which is notoriously difficult to capture in survey settings (Mesmer-Magnus and Viswesvaran Reference Mesmer-Magnus and Viswesvaran2005). However, the primary interest here has been to identify the point at which politicians as a unique population value fairness-motivated behaviour (blowing the whistle) vis-à-vis loyalty-motivated behaviour. Respondents, therefore, likely reported what they felt they ought to do rather than what they actually would have done in a given situation. The gap between these two answers (if indeed there is one) is not the focus of this study. Indeed, while it is possible that there is some degree of social desirability bias in the answers given to these questions, it is not always clear which direction the social desirability bias would go in. In the case of internal reporting, for example, the socially desirable outcome may be to please the senior members of the party and not blow the whistle externally. The baseline treatment effect of fairness applies to both internal and external reporting. The dependent variable measures are therefore considered to be valid indicators of whistleblowing intention.
A central question for the external validity of this study is the extent to which political parties can and do nurture different organisational cultures and ethical climates. This experiment has attempted to ‘prime’ certain moral values in a way that is more implicit than explicit in parties in reality. The treatment and survey here took just a few minutes. Yet in natural settings, these values are likely positively or negatively reinforced over many years through organisational norms, ethical codes of conduct, and personal experience. The identification of distinct party cultures – while not explicitly linked to fairness and loyalty values – would suggest this is the case (e.g., Barrling Reference Barrling2013). Indeed, it does not seem unreasonable to conclude that when an ethical climate is more structural than an experimental prime, the impact of the precedence of fairness or loyalty on moral decision-making could be stronger.
What can we learn from this case for other country contexts? While this paper has presented Sweden as an interesting testing ground for the fairness-loyalty trade-off in politicians due to the high value attributed to each, there are many cases in which the decision may not be so difficult. The willingness of individuals to step forward and call out wrongdoing will inevitably be linked to factors such as institutional trust (in terms of the organisational support or more broadly), legal protection, or even the institutionalisation or fragmentation of the party system. The generalisability of the findings presented here, therefore, should extend to countries with similar party systems and a legal apparatus that incentivises and protects those who wish to report misconduct.
However, that is not to say we can learn nothing from this study about the dilemma facing politicians in other political contexts. The tension between fairness and loyalty motivations likely exists wherever one draws the line between when it is and is not appropriate to speak out. Where the line is drawn is likely to vary between country contexts. The hypothetical scenarios used in this study were tailored to the Swedish case based on interviews with politicians regarding instances of misconduct they were most likely to come across. In more corrupt settings, however, these scenarios would likely need to be modified to elicit a genuine trade-off between fairness and loyalty. Similarly, cultural preferences for loyalty over fairness or vice versa could influence the receptibility of treatment and even the direction of social desirability bias as regards the frequency and method of whistleblowing in parties. Future comparative work on the issue seems highly relevant given the negative impact persistent misconduct can have on democratic institutions.
This study makes several important contributions to the literature. First, it advances research on accountability and good governance by showing how organisational cultures – particularly ethical climates – shape the willingness of political elites to report misconduct (Bovens Reference Bovens2007; Rothstein Reference Rothstein2011). Second, the study contributes to the wider literature on party organisation, which has traditionally focused on the nature and consequences of party structure (Katz and Mair Reference Katz and Mair1995). This study develops the study of political parties to consider the effects of organisational culture – and in particular ethical climates – which are demonstrated to have a significant impact on the moral decision-making of politicians. Relatedly, the study builds on previous work on misconduct in political parties by introducing the application of moral foundations theory to the study of political elites (Walter and Redlawsk Reference Walter and Redlawsk2023). Third, the study adds to the literature on political careers by showing how politicians navigate situations that can be particularly harmful/beneficial to their standing within the party. While results are inconclusive regarding those primed with loyalty motivations, there is a clear decrease in the perceived importance of loyalty for those primed with fairness motivations. Finally, the study contributes to the whistleblowing literature by providing new empirical evidence that parties’ responses to internal reports of misconduct are crucial. Perceived organisational support is a key contributor to whistleblowing intentions (Bergeron and Thompson Reference Bergeron and Thompson2020). However, when organisations (parties) fail to act in response to internal reporting, members are significantly more likely to expose wrongdoing publicly. Taken together, these findings underscore that party-organisational orientations toward fairness and loyalty are not merely abstract values but have concrete consequences for political accountability, political careers, and the integrity of democratic institutions.
Supplementary material
To view supplementary material for this article, please visit https://doi.org/10.1017/S1475676526101303.
Data availability statement
Data and replication files are available at the Harvard Dataverse: https://doi.org/10.7910/DVN/UHH2HT.
Acknowledgements
I would like to thank Birgitta Niklasson, Jenny De Fine Licht, and Andreas Bågenholm for their invaluable advice and support throughout this project, as well as participants of workshops and panels at the Quality of Government internal conference 2024, the Gothenburg-Aarhus workshop on political parties 2024, NOPSA 2024, MPSA 2025, and IPSA 2025. I would like to extend thanks to Felix Cassel and Patrik Öhberg at the SOM Institute for their assistance with data collection. I am also incredibly grateful for the constructive feedback of four anonymous reviewers.
Funding support
The paper is written as a part of the research project ‘Misconduct and Whistleblowing in Political Parties’, which is funded by the Swedish Research Council (Project number: 2021-01814).
Competing interests
There are no competing interests to declare.
Ethical standards
The experiment has been approved by the Swedish Ethical Review Authority. Application number: Dnr 2024-05116-01.


 Open access

