





Nomenclature
- HP
-
high pressure
- LCF
-
low cycle fatigue
- LMP
-
Larson-Miller parameter
- LP
-
low pressure
- RFC
-
rainflow counting
- SWT
-
Smith-Watson-Topper
Symbols
- ${A_{AnSec}}$
-
blade section annulus area (m2)
-
${A_{AvCs}}$
-
blade average cross section area (m2)
-
${A_{CS}}$
-
section cross area (m2)
-
$BM{P_{sec}}$
-
pressure bending moment
-
${h_{sec}}$
-
blade section height (m)
- C
-
material constant
- CL
-
creep life (h)
-
${d_{CG}}$
-
distance between rotating axis and section centre of gravity (m)
- D
-
damage
- E
-
Young’s modulus
- EOC
-
equivalent operating cycles (cycles)
- EOH
-
equivalent operating hours (h)
- L
-
total life (h)
- N
-
number of flight cycles (cycles)
-
${{\rm{N}}_{\rm{b}}}$
-
number of blades
- Nf
-
LCF life (cycles)
- P
-
Larson-Miller parameter
-
$\Delta {p_{AvSec}}$
-
average section static pressure difference (N)
- PCN
-
fan relative shaft rotational speed
-
$P{F_{Sec}}$
-
pressure force on each blade section (N)
- SF
-
scaling factor
- t
-
time
- T
-
temperature (K)
-
${T_C}$
-
coolant temperature (K)
- TET
-
turbine entry temperature (K)
-
${T_G}$
-
gas temperature (k)
-
${T_M}$
-
metal temperature (K)
- x
-
damage
- y
-
maximum allowed combined damage
-
$\epsilon $
-
true strain
- λ
-
cooling effectiveness
- ρ
-
blade density (kg/m3)
- σ max
-
maximum true stress
-
$\omega $
-
angular speed (rad/s)


Subscripts
- Creep
-
creep
- giv
-
given
- LCF
-
low cycle fatigue
- pre
-
predicted
- ref
-
reference operating condition
1.0 Introduction
The life of gas turbine engines is consumed during their operations, and there are many factors affecting the life consumption, such as operating hours, loading levels, number of start-stops, types of fuels, ambient conditions, environmental conditions, etc. To analyse and monitor the gas turbine life consumption, different physics-based life prediction methods have been investigated and published in the past, including creep life prediction models (i.e. the Larson-Miller parameter approach [Reference Larson and Miller1], the Manson-Haferd approach [Reference Manson and Haferd2], the minimum commitment approach [Reference Manson and Ensign3], etc.), fatigue life prediction models (i.e. crack growth approach [Reference Paris and Erdogan4], stress life approach [Reference Schijve5], strain life approach [Reference Smith, Watson and Topper6, Reference Liu, McDowell and Ellis7], etc.), thermal-mechanical life prediction models (i.e. damage summation approach [Reference Neu and Sehitoglu8], Zamrik and Renauld’s model [Reference Zamrik, Renauld, Sehitoglu and Maier9], Warren and Wei’s model [Reference Warren and Wei10], Vose et al.’s model [Reference Vöse, Becker, Fischersworring-Bunk and Hackenberg11], Sun and Yuan’s model [Reference Sun and Yuan12], etc.).
Empirical life prediction methods based on engine historical data, service experience, maintenance records and failure statistics are another type of life prediction methods and have been developed where safety factors are used to ensure conservative life predictions. Troha and Stybrylla [Reference Troha and Stabrylla13] studied the effect of different flight missions on engine component life and proposed a severity factor to describe the damage of a mission with respect to a reference condition. The severity factor later became one of the most important indicators in engine component life estimation and maintenance planning. Abdul Ghafir et al. [Reference Abdul Ghafir, Li, Singh, Huang and Feng14] introduced a creep factor to estimate the relative creep life consumption of the hot section components of a gas turbine engine. Hanumanthan et al. [Reference Hanumanthan, Stitt, Laskaridis and Singh15] further investigated the effects of different operational parameters on the severity factor under the assumption that low-cycle fatigue (LCF), creep and oxidation are the main failure mechanisms for turbine blades.
However, the severity factor may not be an instinctive indicator for engine maintenance planning as original equipment manufacturers (OEMs) and industrial gas turbine users would prefer to use the concept of remaining useful life of life-critical components [Reference Moritsuka, Fujii and Takahashi16]. Currently, two mainstream strategies are adopted by the OEMs to evaluate engine life consumption when planning the maintenance interval [Reference Eggart, Thompson, Sasser and Merine17]:
-
1. GE’s Starts and Hours criteria, where the number of starts and total operating hours are counted, and whichever reaches its limit first determines the maintenance interval.
-
2. Equivalent operating hours (EOH) method adopted by other OEMs, such as Mitsubishi and Siemens Energy, where different factors that influence the life consumption are converted into operating hours and added up to a total of equivalent operating hours. Once the EOH reaches a pre-set threshold, inspections or maintenance will be carried out.
GE’s Starts and Hours criteria may be seen as a special EOH method where the number of starts is counted independently rather than converted into operating hours.
In terms of the calculation of the EOH, the most common methods available in the literature are the Boyce method [Reference Boyce18] and the PJM method [19]. Boyce [Reference Boyce18] introduced a concept of equivalent engine hour (EEH) to assess gas turbine life consumption using Equation (1):
 \begin{align}\begin{array}{*{20}{c}}{EEH\; = Number\;of\;starts\; \times \;50.00\; + \;Total\;operating\;hours\;below}\\{peak\;load\; + \;Total\;operating\;hours\;at\;peak\;load\; \times \;1.20\; + }\\{number\;of\;full\;load\;trips\; \times \;400.00}\end{array},\end{align}
where the damages caused by the full load trips and the number of starts have much higher weights compared with other factors. PJM [19] presented a concept of equivalent service hours (ESH), presented by Equation (2):
 \begin{align}\begin{array}{*{20}{c}}{ESH\; = \left( {Cyclic\;starting\;factor\; \times \;Number\;of\;starts} \right)\; + \;Total}\\{operating\;hours\;at\;any\;load\;level\; + \;(Cyclic\;peaking\;factor\; \times }\\{Number\;of\;hours\;above\;base\;load\;temperature\;limit)}\end{array},\end{align}
In the circumstance where the OEMs do not supply cyclic starting factor and cyclic peaking factor, users may adopt a cyclic starting factor of 5.0 for aircraft type engines or 10.00 for industrial gas turbine engines. A cyclic peaking factor of 3.0 may be applied to all types of engines. Note that the base load is defined as 50% of the full power here.
It can be seen that both methods rely heavily on operating experience and data in order to obtain the converting factors. Different gas turbine engines may also require different converting factors [Reference Eggart, Thompson, Sasser and Merine17, 19]. In addition, the methods are engine specific as there is no definitive quantification method to support them. The lack of a unified quantification method also makes it difficult to compare the results for different engines. The limitations of the empirical EOH calculation methods indicate there is space for improvement in calculating the EOH.
Apart from the above methods, finite element analysis (FEA) methods provide much more detailed and accurate life predictions. However, they require detailed boundary conditions, geometry information, material data and consume long computing time to get results. Therefore, they are not suitable for life consumption monitoring during gas turbine operations where quick although less accurate solutions are desired.
This paper proposes a physics-based, relatively simple but quick method based on a damage summation method to calculate the EOH of gas turbine engines based on Creep-LCF damage interaction for the purpose of gas turbine life consumption monitoring. The method is applied to the estimation of life consumption of a typical model turbofan engine for both short-haul and long-haul flights to demonstrate its applications. Results, comparisons, analysis and conclusions are provided accordingly.
2.0 Methodology
The proposed EOH estimation method consists of performance modelling, stress and thermal models, creep life estimation, LCF life estimation, creep-LCF interaction and EOH estimation. The following sections describe each of the models and an integrated gas turbine life prediction system.
2.1 Gas turbine performance, stress and thermal models
The gas turbine performance modelling is based on the fundamental thermodynamics and empirical component maps. As the performance modelling is not the focus of this study and is only used to set up a gas turbine performance model to obtain the boundary conditions for the lifing calculations of HP turbine rotor blades for different flight missions, no details are provided and the interested readers may refer to references [Reference MacMillan20, Reference Li and Singh21] for further details.
A stress model has been set up to calculate the stresses of gas turbine HP turbine rotor blades mainly considering the effects of centrifugal force due to turbine rotation and gas bending moment caused by both the change in gas momentum and the presence of static pressure difference. Temperature variations on the blades cause extra thermal stresses particularly at transient operation processes but they are ignored as only steady-state flight conditions are considered in this study, and the thermal stresses are much smaller than the stresses caused by centrifugal force and gas bending moment. To calculate the blade stresses, a blade is divided into several sections along blade radial direction. The centrifugal stress at each blade section is calculated by Equation (3).
 \begin{align}{\sigma _{CFSec}} = \frac{{\sum \rho \times {A_{AvCs}} \times {h_{sec}} \times {\omega ^2} \times {d_{CG}}}}{{{A_{CS}}}}\end{align}
where $\rho $
is the blade density,
$\rho $
is the blade density, ${A_{AvCs}}$
is the average cross section area between the top and the bottom sections,
${A_{AvCs}}$
is the average cross section area between the top and the bottom sections, ${h_{sec}}$
is the blade section height,
${h_{sec}}$
is the blade section height, $\omega $
is the angular speed, and
$\omega $
is the angular speed, and ${d_{CG}}$
is the distance between the rotating axis and the section centre of gravity, and
${d_{CG}}$
is the distance between the rotating axis and the section centre of gravity, and ${A_{CS}}$
is the cross section area of the corresponding section.
${A_{CS}}$
is the cross section area of the corresponding section.
The pressure force on each blade section, $P{F_{Sec}}$
is calculated by Equation (4) and the pressure bending moment at each section,
$P{F_{Sec}}$
is calculated by Equation (4) and the pressure bending moment at each section, $BM{P_{sec}}$
is calculated by Equation (5),
$BM{P_{sec}}$
is calculated by Equation (5),
 \begin{align} P{F_{Sec}} = {{{A_{AnSec}} \times \Delta {p_{AvSec}}} \over {{N_b}}}\end{align}
 \begin{align} BM{P_{sec}} = \sum \left( {P{F_{Sec}} \times {d_{CGsec}}} \right)\end{align}
where ${A_{AnSec}}$
is the blade section annulus area,
${A_{AnSec}}$
is the blade section annulus area, $\Delta {p_{AvSec}}$
is the average section static pressure difference,
$\Delta {p_{AvSec}}$
is the average section static pressure difference, ${N_b}$
is the number of blades and
${N_b}$
is the number of blades and ${d_{CGsec}}$
is the distance between the section centre of gravity to the respective section.
${d_{CGsec}}$
is the distance between the section centre of gravity to the respective section.
The thermal model is used to calculate the blade metal temperature distribution along turbine blades considering the radial gas temperature distribution profile (RTDF) (assuming to be 0.1) and blade cooling. The metal temperature is calculated by Equation (6):
 \begin{align}{T_M} = {T_G} - \lambda\ {\rm{*}}\ \left( {{T_G} - {T_C}} \right)\end{align}
where ${T_G}$
is the gas temperature,
${T_G}$
is the gas temperature, ${T_C}$
is the coolant temperature and
${T_C}$
is the coolant temperature and $\lambda $
is the cooling effectiveness.
$\lambda $
is the cooling effectiveness.
For the calculation of blade metal temperature, it is assumed that part of the air flow from compressor exit is taken as the coolant for turbine cooling that flows along a single cooling channel within each of the HP turbine rotor blades and is discharged continuously along the blade span for film cooling.
As the blades are divided into several sections in span-wise direction, the average metal temperature and the maximum stress within each blade section are considered for the life calculations of the blade sections.
As the stress model and the thermal model are adopted from the work reported in [Reference Abdul Ghafir, Li, Singh, Huang and Feng14] so the interested readers may refer to the reference for further details.
2.2 Creep life estimation
The Larson-Miller parameter (LMP) method [Reference Larson and Miller1] has been used in this study for creep life estimation due to its simplicity and satisfying predictions since it was first proposed in 1952. Abdul et al. [Reference Hanumanthan, Stitt, Laskaridis and Singh15] demonstrated the use of the LMP method in estimating the creep life of HP turbine rotor blades and the same method has been adopted in this paper for creep life estimation.
Based on the LMP method [Reference Larson and Miller1], the time to failure due to creep can be calculated by Equation (7)
 \begin{align}CL = {10^{\left( {\frac{{1000P}}{{{T_M}}} - C} \right)}}\end{align}
where $CL$
is the time to failure or the creep life,
$CL$
is the time to failure or the creep life, $P$
is the Larson-Miller parameter,
$P$
is the Larson-Miller parameter, ${T_M}$
is the blade metal temperature (K) and
${T_M}$
is the blade metal temperature (K) and $C$
is a material constant which is taken as 14.07 [Reference Vöse, Becker, Fischersworring-Bunk and Hackenberg11]. The LMP master curve for CMSX-4 can be found in Ref. (Reference Bullough, Toulios, Oehl and Lukas22).
$C$
is a material constant which is taken as 14.07 [Reference Vöse, Becker, Fischersworring-Bunk and Hackenberg11]. The LMP master curve for CMSX-4 can be found in Ref. (Reference Bullough, Toulios, Oehl and Lukas22).
Since the blades have been divided into several span-wise sections and the maximum stresses are calculated respectively for all blade sections, we can expect different creep lives along the blade span. The minimum time to failure among all blade sections will be selected as the creep life of the blades.
2.3 Low-cycle fatigue life estimation
There are mainly two types of approaches for LCF life estimation [Reference Suresh23], the stress-life approach and the strain-life approach. Considering the strain-life approach can better capture the LCF properties, the Smith-Watson-Topper (SWT) parameter strain-life approach [Reference Smith, Watson and Topper6] regarded as one of the most promising LCF life prediction models in terms of prediction accuracy and computational efficiency, is used in this study for the estimation of the LCF life of HP turbine rotor blades. The SWT approach considers the mean stress effect by including the maximum stress, ${\sigma _{max}}$
in the estimation as shown in Equation (8)
${\sigma _{max}}$
in the estimation as shown in Equation (8)
 \begin{align}{\sigma _{max}}\varepsilon = {\frac{{\sigma _f'}}{E}^2}{\left( {2{N_f}} \right)^{2b}} + \sigma _f'{\varepsilon _f}'{\left( {2{N_f}} \right)^{b + c}}\end{align}
where $\varepsilon $
is the true strain of the turbine blades,
$\varepsilon $
is the true strain of the turbine blades, ${\sigma _{max}}$
is the maximum true stress among the stresses of various locations on the blades,
${\sigma _{max}}$
is the maximum true stress among the stresses of various locations on the blades, $\;{N_f}$
is the low cycle fatigue life of the blades,
$\;{N_f}$
is the low cycle fatigue life of the blades, $\sigma _f'$
,
$\sigma _f'$
, $\;E$
,
$\;E$
, $\;{\varepsilon _f}'$
,
$\;{\varepsilon _f}'$
, $b$
and
$b$
and $c$
are the material properties. According to Ref. (Reference Sun, Yang and Yuan24), the coefficients for CMSX-4 take values of
$c$
are the material properties. According to Ref. (Reference Sun, Yang and Yuan24), the coefficients for CMSX-4 take values of $\sigma _f' = 1700.7\;MPa$
,
$\sigma _f' = 1700.7\;MPa$
, ${\varepsilon _f}^{\rm{'}} = 191688.9\;MPa$
,
${\varepsilon _f}^{\rm{'}} = 191688.9\;MPa$
, $b = - 0.1892$
, and
$b = - 0.1892$
, and $c = - 3.356$
. Young’s modulus for CMSX-4 takes a value of
$c = - 3.356$
. Young’s modulus for CMSX-4 takes a value of $E = 80\;GPa$
at 1000 °C as a representative value based on Ref. (Reference Epishin, Fedelich, Finn, Kunecke, Rehner, Nolze, Leistner, Petrushin and Svetlov25). Again, the minimum number of cycles to failure
$E = 80\;GPa$
at 1000 °C as a representative value based on Ref. (Reference Epishin, Fedelich, Finn, Kunecke, Rehner, Nolze, Leistner, Petrushin and Svetlov25). Again, the minimum number of cycles to failure ${N_f}$
calculated by Equation (8) corresponding to the maximum stress
${N_f}$
calculated by Equation (8) corresponding to the maximum stress ${\sigma _{max}}$
on the blades is selected as the LCF life of the blades.
${\sigma _{max}}$
on the blades is selected as the LCF life of the blades.
2.4 Cycle counting
The gas turbine low cycle counting method used in this study is the rainflow counting (RFC) method first proposed by Endo and Matsuishi [Reference Endo and Matsuichi26] in 1968. The idea is to mirror how rain flows down a pagoda roof, hence it has the name as rainflow counting. It offers the capability of calculating the fatigue life of an object by converting its complicated cyclic loading history into a set of equivalent simple stress cycles.
Figure 1(a) shows a typical simplified flight mission profile where typical flight sections are included, including take-off and climbing, cruise, approach, loitering and final approach and landing. The rainflow counting method is applied to discretise the flight mission profile into equivalent cycles and constant flight sections in the following procedure as shown in Figs. 1(b) and (c):
-
1. Turn the original flight mission profile shown in Fig. 1(a) clockwise at 90
$^\circ $
as shown in Fig. 1(b) and let the earliest time be on the top of the graph. -
2. Imaging the load history is a series of pagoda roofs, and a water flow is coming down from the top of the profile, Fig. 1(b).
-
3. Count the number of half-cycles if the water flow either:
-
a. Reaches the end of time history; or
-
b. Merges with a flow that started at an earlier tensile peak; or
-
c. Flows down when an opposite tensile peak has a greater magnitude.
-
-
4. Repeat Step 3 for compressive valleys.
-
5. Pair up half cycles with the same magnitude until all paired cycles are collected, as shown in Fig. 1(c). There could be some half-cycles left and should be delt with separately.
-
6. All constant flight sections are collected and listed separately as shown in Fig. 1(c).

After such a conversion, a complicated flight mission profile can be dissembled into several equivalent cycles and several constant flight sections.
Schematic discretisation of mission profile using rainflow counting method (a) typical simplified flight mission; (b) water flows according to rainflow counting method; (c) equivalent discrete cycles and constant flight sections.

2.5 Creep-LCF interaction
For a certain loading pattern of a flight mission of a gas turbine engine as shown schematically in Fig. 1(a), the flight sections where the engine is kept at steady-state conditions are dominated by time-dependent creep damage and the flight sections with varying loads are dominated by low cycle fatigue damage. After dissembling the mission into creep damage sections and fatigue damage cycles as schematically shown in Fig. 1(c), the creep and the LCF lives at corresponding conditions can be calculated separately. In these calculations, the creep life is calculated by LMP method shown in Section 2.2 and the low cycle fatigue life is calculated by the SWT model described in Section 2.3.
For each creep section and fatigue cycle, the concept of life fraction [Reference Stephens, Fatemi, Stephens and Fuchs27], or the creep damage and the LCF damage are introduced and can be calculated by Equations (9) and (10), respectively:
 \begin{align}{D_{Creep}} = \mathop \sum \limits_j^m \frac{{{t_j}}}{{C{L_j}}}\end{align}
 \begin{align}{D_{LCF}} = \mathop \sum \limits_i^k \frac{{{n_i}}}{{{N_{f,i}}}}\end{align}
where ${D_{Creep}}$
is the creep damage,
${D_{Creep}}$
is the creep damage, ${D_{LCF}}$
the LCF damage,
${D_{LCF}}$
the LCF damage, $m$
the total number of steady-state operation sections,
$m$
the total number of steady-state operation sections, ${t_j}$
the operating time at the
${t_j}$
the operating time at the $j$
th section,
$j$
th section, $C{L_j}$
the creep life at the
$C{L_j}$
the creep life at the $j$
th section,
$j$
th section, $k$
the total number of cycles,
$k$
the total number of cycles, ${n_i}$
the number of the
${n_i}$
the number of the $i$
th cycle type, and
$i$
th cycle type, and ${N_{f,i}}$
the LCF life of the
${N_{f,i}}$
the LCF life of the $i$
th cycle type.
$i$
th cycle type.
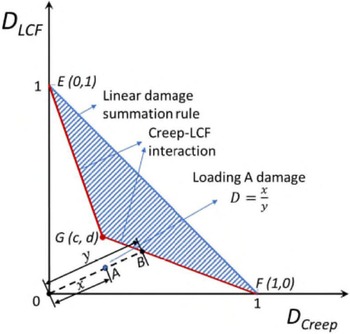
Since research [Reference Sun and Yuan12, Reference Troha and Stabrylla13, Reference Pohja, Holmström and Lee28] have shown that the linear damage summation rule may not be adequate for some materials experiencing cyclic loading under high temperature conditions and could lead to inaccurate estimation of the combined damage, the creep-LCF interaction diagram [Reference Wright, Carroll and Wright29] as shown in Fig. 2 is adopted to estimate gas turbine component life consumption. In this study, it is proposed that the combined creep-fatigue damage represented by Equation (10) determines the failure criteria.
 \begin{align} x = \sqrt {{D_{Creep}}^2 + \;{D_{LCF}}^2} \; \lt y\end{align}
where y is the maximum allowed combined creep-fatigue damage represented by the distance between the no-load Point 0 and the Point B on the failure line. In Fig. 2, the failure line E-G-F determined by the intersection point G is material dependent and its position is set to be (c, d). Due to lack of the creep-fatigue interaction diagram for CMSX-4, it is assumed in this research that c = d = 0.5 according to Ref. (Reference Wang, Zhang, Gong, Zhu, Tu and Zhang31) for Nikel-based super alloy. For more accurate failure line for CMSX-4, the point G should be determined via creep-LCF experiments for the specified material.
Creep-LCF interaction diagram [Reference Wright, Carroll and Wright29].

After calculating the creep and LCF damages of the turbine rotor blades separately for a flight mission profile in concern, the combined damage caused by the repeated loading may be represented by point A in Fig. 2. If the loading is repeated until failure, the failure point would be the intersection between the red failure line and the extended line of 0-A, denoted as point B. The total damage represented at point A caused by the repeated loading is then defined by Equation (11) as
 \begin{align}D = \frac{x}{y}\end{align}
where $D$
is the total damage caused by the creep and the LCF interaction, x the distance between point A and the original no-load point 0, and
$D$
is the total damage caused by the creep and the LCF interaction, x the distance between point A and the original no-load point 0, and $y$
the distance between failure point B and the original no-load point 0.
$y$
the distance between failure point B and the original no-load point 0.
The total damage is ranging between 0 and 1. All points located on the red failure line with a total damage of 1 indicate a complete failure, and the original no-load point with a total damage of 0 indicates no damage at all.
Reference creep operating condition and LCF cycle.

2.6 Equivalent operating hours (EOH)
2.6.1 Scaling of creep and LCF lives
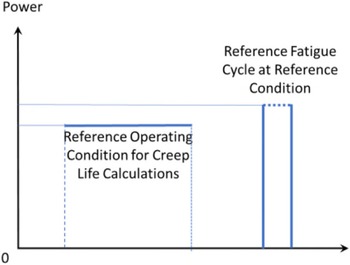
Due to many assumptions made in the predictions of creep life and low cycle fatigue life for the HP turbine rotor blades, the predicted lives may have significant errors. To make the life predictions useful and also consider the lives given by OEMs for the gas turbine engines in concern, the following scaling factors are introduced to convert the predicted life consumptions to those of the real engines in concern:
-
• Creep life scaling factor
$\boldsymbol{SF}_{\boldsymbol{creep}}$
defined as the ratio between the predicted creep life (
$C{L_{pre}}$
) at a reference operating condition (Fig. 3) and the creep life (
$C{L_{giv}}$
) given by OEM represented by Equation (12).(12)
\begin{align}S{F_{creep}} = \frac{{C{L_{pre}}}}{{C{L_{giv}}}}\end{align}
-
• LCF life scaling factor
$\boldsymbol{SF}_{\boldsymbol{LCF}}$
defined as the ratio between the predicted number of LCF life cycles (
${N_{f,pre}}$
) for a reference flight cycle (Fig. 3) and the number of LCF life cycles (
${N_{f,giv}}$
) of the real engine in concern given by OEM represented by Equation (13)(13)
\begin{align}S{F_{LCF}} = \frac{{{N_{f,pre}}}}{{{N_{f,giv}}}}\end{align}


Consequently, the creep and LCF lives of the engine in concern can then be calculated by Equations (14) and (15).
 \begin{align} CL = C{L_{pre}}/S{F_{creep}}\end{align}
 \begin{align}{N_f} = {N_{f,pre}}/S{F_{LCF}}\end{align}
It is worth mentioning that the pre-defined reference creep operating condition may not be the same as that of the peak operating condition of the pre-defined reference LCF cycle. By using the introduced life scaling factors defined by Equations (12) and (13), the engine life (CL and ${N_f}$
) at any flight conditions and flight cycles can be obtained by scaling the engine life predicted by the lifing models, which is schematically shown in Fig. 4 where the solid line represents the predicted life directly from the lifing model while the dotted line represents the scaled engine life obtained from Equations (14) and (15). Such an approach ensures that the scaled predictions of both the creep and the LCF lives represent the actual lives of the engine in concern at different operating conditions and operating cycles.
${N_f}$
) at any flight conditions and flight cycles can be obtained by scaling the engine life predicted by the lifing models, which is schematically shown in Fig. 4 where the solid line represents the predicted life directly from the lifing model while the dotted line represents the scaled engine life obtained from Equations (14) and (15). Such an approach ensures that the scaled predictions of both the creep and the LCF lives represent the actual lives of the engine in concern at different operating conditions and operating cycles.
Schematic of predicted and scaled engine life.

2.6.2 Equivalent operating hours (EOH)
EOH of a flight mission for a gas turbine engine is defined as the operating hours of the engine at a pre-defined reference operating condition denoted with a subscript “ref” to reach the same level of damage done by the engine operating at an actual flight mission. The mathematical formula for EOH definition may be represented by Equation (16).
 \begin{align}D = \frac{{\sqrt {{D_{Creep}}^2 + \;{D_{LCF}}^2} }}{y} = \frac{{EOH}}{{{L_{ref}}}} = {D_{ref}}\end{align}
where D is the total damage caused by the actual flight mission, ${L_{ref}}$
is the total engine life at the pre-defined reference operating condition given by OEM, and D
ref
is the total damage caused at the pre-defined reference operating condition. Therefore, the EOH can be expressed by Equation (17).
${L_{ref}}$
is the total engine life at the pre-defined reference operating condition given by OEM, and D
ref
is the total damage caused at the pre-defined reference operating condition. Therefore, the EOH can be expressed by Equation (17).
 \begin{align}EOH = {L_{ref}} \cdot D = {L_{ref}} \cdot \;{{\sqrt {{D_{Creep}}^2 + \;{D_{LCF}}^2} } \over y}\end{align}
The total engine life ${L_{ref}}$
at the reference condition may be set being equal to the engine creep life
${L_{ref}}$
at the reference condition may be set being equal to the engine creep life $C{L_{giv}}$
when no low cycle operations are considered. However, the low cycle operations will result in LCF damage alongside creep damage and contribute to the total life consumption as shown by Equations (10) and (11).
$C{L_{giv}}$
when no low cycle operations are considered. However, the low cycle operations will result in LCF damage alongside creep damage and contribute to the total life consumption as shown by Equations (10) and (11).
The following are discussions at two special scenarios:
-
• In a scenario where a gas turbine engine operates continuously at one or more stabled operating conditions without any stops, the start-stop cycles can be ignored and therefore the life consumption is mainly determined by creep damage (
$y = 1$
) and EOH can be calculated by Equation (18).(18)
\begin{align}EOH\; \approx \;C{L_{giv}} \cdot {D_{Creep}}\end{align}
-
• In a scenario where a gas turbine experiences frequent low cycle operations and stabled operating conditions are very short and can be ignored, the engine life consumption is mainly determined by LCF damage (
$y = 1$
) and equivelant operating cycles (EOC) can be calculated by Equation (19).(19)
\begin{align}EOC\; \approx \;{N_{f,giv}}\; \cdot {D_{LCF}}\end{align}


2.7 Integrated EOH prediction system
The individual models described above are integrated into a physics-based EOH calculation system as shown in Fig. 5.
Gas turbine engine EOH prediction system.

The reference operating condition, the reference cycle and an actual engine flight mission profile representing their loading patterns are used as input for the EOH prediction system. An engine performance model is set up using Cranfield’s performance and diagnostics software, Pythia [Reference Li and Singh21] and used to predict the thermodynamic parameters at the inlet and outlet of the HP turbine rotor blades. Consequently, the stress and temperature distributions on the HP turbine rotor blades are predicted using the stress model and the thermal model, respectively. Then, a cycle counting module based on the rainflow counting method [Reference Endo and Matsuichi26] is used to discretise the loading patterns of the flight mission into a number of sub-cycles and sub-sections of the continuous flight. Afterwards, a creep model based on the LMP method and an LCF model based on the SWT parameter approach are used to estimate the creep and LCF lives, respectively. Then, the predicted lifing results are sent to the creep-LCF interaction model to calculate creep, LCF and total damages. Finally, an EOH prediction model based on the total damage together with the creep and LCF scaling factors are applied to deliver an estimated EOH. It is suggested that the pre-set reference flight condition for the creep scaling factor calculation and the peak operating condition of the pre-set reference cycle for the LCF scaling factor calculation may be close to the take-off condition for the gas turbine engine in concern.
3.0 Demonstration of EOH application
The introduced EOH approach has been applied to a model two-spool turbofan engine whose configuration is schematically shown in Fig. 6 to demonstrate the effectiveness of the approach. The model engine has a fan and a booster both driven by a low-pressure turbine, a high-pressure compressor driven by a high-pressure turbine, a combustor and two separate nozzles, one for the bypass air flow and the other for the core air flow. The high-pressure turbine is air cooled with 8% cooling air extracted from the exit of the high-pressure compressor. The fan relative shaft rotational speed is used as the power-setting parameter (or handle parameter) in order to control the operation of the engine. An engine thermodynamic performance model was set up using Cranfield gas turbine performance and diagnostics software, Pythia [Reference Li and Singh21] based on the performance specification shown on Table 1.
Schematic of model engine.

Engine performance specification (at sea level static ISA condition)

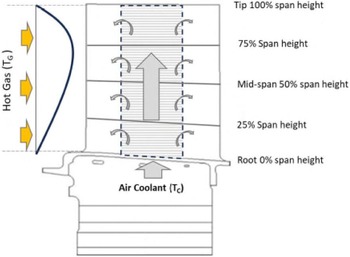
The life-critical component of the model aircraft engine is the high-pressure turbine rotor blades made of CMSX-4, a typical single crystal nickel-based superalloy for turbine rotor blades construction [Reference Bullough, Toulios, Oehl and Lukas22]. A sketch of the blade is shown in Fig. 7 where the blade has a single air-cooling channel with 8% coolant air from the high-pressure compressor exit. The RTDF (radial temperature distribution profile) at the turbine rotor blade inlet takes the value of 0.1. The blade is divided into 4 sections radially for the calculations of the blade metal temperature distribution and 100 sections radially for the calculation of blade stress distribution. The maximum stress and the average metal temperature on the blade sections are used for the calculations of blade creep and LCF lives. The blade geometry data, LMP master curve, material data, blade coolant mass fraction, cooling effectiveness, RTDF, thermal conductivity of blade TBC, etc., are used as input for the blade thermal, stress and lifing models.
Sketch of HP turbine rotor blades.

Two typical simplified long-haul and short-haul flight mission profiles for civil passenger aircraft per day are assumed for the study and shown in Fig. 8 where the variation of the engine power handle (i.e. the fan relative shaft speed), the Mach number and the flight altitude at each of the quasi steady-state flight sections, including take-off and climbing, cruise, and descending and landing are shown:
-
• The short-haul flight, such as a flight between London and Paris, shown in Fig. 8 lasts for approximately 1 h where it takes 10 mins for take-off and climbing represented by three flight sections, 40 mins for cruise represented by one flight section, and 10 mins for descending and landing represented by two flight sections. It is assumed that the aircraft takes two flights per day.
-
• The long-range flight, such as a flight between London and Montreal, also shown in Fig. 8 lasts for 7 h 20 mins where it takes 20 mins for take-off and climbing represented by five flight sections, 400 mins for cruise represented by one flight section, and 20 mins for descending and landing represented by two flight sections. In addition, the first three flight sections of the long-haul flight are identical to those of the short-haul flight during the take-off and climbing. It is assumed that the aircraft takes one flight per day.
By using the rainflow counting method described in Section 2.4, the mission profiles can be dissembled to several pure cycles for LCF calculations and several pure constant flight sections for creep life calculations. Figure 9(a) shows the dissembled short-haul flight mission profile and Fig. 9(b) shows the dissembled long-haul flight mission profile.
Typical flight mission profiles per day for short and long-haul aircraft.

Dissembled mission profiles per day.

It is assumed based on Ref. (32) that the given engine creep life is 30,000 h, the given engine LCF life is 60,000 cycles, and the given total engine life is 30,000 h for the engine in concern considering that the creep life is much shorter than the LCF life for the HP turbine rotor blades. In addition, the chosen reference flight condition for creep life scaling factor calculation and the reference flight cycle for LCF life scaling factor calculation are shown in Table 2.
It is assumed that both the long-haul and the short-haul flights are repeated for five years. Therefore, the flight clock time of the short-haul aircraft is 3,650 h, which is only 27.3% of that of the long-haul aircraft (13,385 h). The number of flight cycles of the short-haul aircraft is 3,650, which is two times that of the long-haul aircraft (1,825 cycles). The equivalent operation hours and the damages of the HP turbine rotor blades of the engine are predicted using the EOH prediction system described in Section 2.7. The corresponding prediction results, analysis and comparisons are shown in the following.
It shows in Fig. 10 that although the long-haul aircraft fly about 3.7 times longer in flight-hours than the short-haul aircraft, the creep EOH of the engine of the short-haul aircraft (15,559 h) is about 1.38 times the creep EOH of the engine of the long-haul aircraft (11,240 h). This is because the flight altitude of the engine of the long-haul aircraft at cruise (8,000 m) is 2.7 time higher than that of the short-haul aircraft (3,000 m) and the creep life consumption of the engine at high altitude is lower than that at lower altitude. In addition, the engine of the short-haul aircraft spends double the time below 3,000 m compared to the long-haul aircraft during the take-off and climbing period when the majority of the creep life of the engine are consumed as the shaft rotational speed (PCN) and turbine entry temperature (TET) during this flight section are the highest compared to those at any other flight sections. The creep life consumption at descending and landing is very low as both PCN and TET are low.
Reference flight condition and reference flight cycle

Comparison of life consumptions for 5 years.

It also shows in Fig. 10 that the number of flights of the short-haul aircraft (3,650) is 2 times that of the long-haul aircraft (1,825), which results in the LCF EOC of the engine of the short-haul aircraft (4,589 cycles) being about 2.0 times that of the engine of the long-haul aircraft (2,295 cycles). This is because the LCF damage and therefore the LCF EOC is mainly determined by the maximum cyclic stresses and strains and the number of cycles while the impact of flight altitudes and flight time is relatively small. As the combined effect of both the creep and LCF damages, the total EOH of the engine of the short-haul flight is 17,854 h that is 1.44 times that of the engine of the long-haul flight (12,387 h).
Figure 11 shows that for the short-haul flights, the creep damage (0.5186) is about 6.78 times that of the LCF damage (0.0765), while for the long-haul flights both the creep and LCF damages are smaller than those of the short-haul flights with the creep damage (0.3747) being 9.81 times more than the LCF damage (0.0382).
Comparison of damages for 5 years.

Although the long-haul aircraft spends 3.7 times more flight time than the short haul aircraft, the engine in short-haul aircraft experiences higher engine loads since it spends more time at take-off and climbing at lower flight altitude, leading to more severe creep as well as LCF damages than that of the engine of the long-haul aircraft, as shown in Fig. 11. In other words, the creep damage of the short-haul flight (0.5186) is 1.38 times that of the long-haul flight (0.3747), and the LCF damage of the short-haul flight (0.0765) is 2 times that of the long-haul flight (0.0382). Consequently, the total damage on the HP turbine rotor blades caused by the short-haul flights (0.5951) is about 1.44 times that caused by the long-haul flights (0.4129).
The difference of the above results between the short-haul flights and long-haul flights can also be explained in the results shown in Fig. 12 that shows a comparison of the maximum blade stress profiles relevant to the maximum blade stress at the reference flight condition (Table 2) and in Fig. 13 that shows a comparison of the maximum blade metal temperature profiles during the whole flight missions. It can be seen in the figures that the HP turbine rotor blades of the engine of the short-haul flights operate longer time at higher blade stresses and higher metal temperature per day than those of the blades of the engine of the long-haul flights resulting in the short-haul flight consuming total EOH 1.44 times more than that of the long-haul flight as shown in Fig. 10. It’s worth mentioning that during take-off and climbing the peak maximum stresses on the blade is about 2.3 times higher than that at the reference flight condition and the peak mid blade metal temperature is about 1114K resulting in the rapid creep damage and the creep life consumption being about 7 to 10 times more quickly than the LCF damage as well as the LCF life consumption as shown in Figs. 10 and 11.
Comparison of blade relative maximum stresses.

Comparison of blade mid-space metal temperature.

The total EOH of the engine of the short-haul aircraft (17,854 h) is about 1.44 times that of the engines of the long-haul aircraft (12,387 h) as shown in Fig. 10. This is due to the combined effect of both the creep and the LCF damages and the position of the failure line determined by the blade material, as shown in Fig. 14. Furthermore, the results shown in Fig. 11 are also shown in Fig. 14 where for the engines of both the short-haul and the long-haul aircraft the total damages are more affected by the creep damages as the LCF damages are much smaller than the creep damages. In addition, the figure shows that the engine of the short-haul aircraft experiences 2.0 times more LCF damage and 1.38 times more creep damage than the engine of the long-haul aircraft.
Creep-LCF interaction diagram showing damages of short-haul and long-haul flights for 5 years.

If the flights are repeated, the total damages of the engines of the short-haul and long-haul aircraft may show significant deviations as indicated by Fig. 15 due to the interaction between the creep and the LCF. As the number of flight days increases as shown in the figure, the total damage for the engine of the short-haul aircraft grows about 1.44 times quicker than that of the engine of the long-haul aircraft.
Comparison of total damages over flight days.

4.0 Conclusions
This paper proposes a physics-based EOH estimation method based on damage mechanism for a life-critical component, i.e. the HP turbine rotor blades of gas turbine engines. It can calculate the EOH for creep and the EOC for low cycle fatigue respectively, and also the total EOH considering creep-LCF interactions. It provides a more accurate alternative to the empirical EOH calculation methods and a much quicker but less accurate alternative to the finite element methods. It offers a better solution for gas turbine life consumption predictions in condition monitoring applications.
The introduced EOH estimation method has been applied to a typical model turbofan engine powering passenger aircraft for both short-haul and long-haul flights, where the short-haul aircraft takes two 1 h flights per day and the long-haul aircraft takes one 7 h 20 mins flight per day. The prediction results show that:
-
• Although the long-haul aircraft flies about 3.7 times longer than the short-haul aircraft, the creep EOH and also the creep damage of the engine of the short-haul aircraft is about 1.38 times that of the engine of the long-haul aircraft.
-
• The number of flights of the short-haul aircraft is 2 times that of the long-haul aircraft, resulting in the LCF EOC and also the LCF damage of the engine of the short-haul aircraft being about 2.0 times that of the engine of the long-haul aircraft.
-
• For the engines of both the short-haul and long-haul flights, the total damages are more affected by the creep damage than the LCF damage, with the creep damage being 6.78 times the LCF damage for the engine of the short-haul aircraft and 9.81 times for the engine of the long-haul aircraft.
-
• The total EOH or the total damage of the engine of the short-haul aircraft is about 1.44 times that of the engine of the long-haul aircraft.





 Open access

