





Background
Cognition refers to the mental processes underlying perception, attention, memory, reasoning, and decision-making. These processes are fundamental to adaptive functioning, enabling the integration of sensory inputs, the regulation of arousal states, and the planning of goal-directed behavior. Cognition encompasses not only the perception and processing of external information but also the interpretation and generation of adaptive responses (Diamond, Reference Diamond2013). Well-developed cognitive abilities aid effective decision-making in complex environments, foster mental well-being (Gao et al., Reference Gao, Yan and Yuan2022), and promote social integration (Ni et al., Reference Ni, Zhou, Xiong, Liu, Liu and Wang2024). Conversely, cognitive impairment or decline may lead to attention deficits (Allain et al., Reference Allain, Akwa, Lacomblez, Lieury and Bentué-Ferrer2007), learning difficulties (Zhong et al., Reference Zhong, Li, Liu, Wang and Chen2024), and emotional dysregulation (Gao et al., Reference Gao, Yan and Yuan2022). Therefore, researching and enhancing cognitive functions hold significant theoretical and practical importance for improving an individual’s quality of life and social adaptability.
Our exploration into enhancing cognitive functions has never ceased. Previous cognitive improvement methods primarily relied on traditional behavior therapy and educational interventions (Birtwistle, Chernikova, Wünsch, & Niklas, Reference Birtwistle, Chernikova, Wünsch and Niklas2025; Gobet & Sala, Reference Gobet and Sala2023; Lövdén et al., Reference Lövdén, Fratiglioni, Glymour, Lindenberger and Tucker-Drob2020), aiming to elevate an individual’s cognitive abilities through repetitive practice and memory reinforcement. However, as our understanding of brain structure and function deepens, we have discovered that cognitive functions are not solely dependent on knowledge accumulation and practice but are also profoundly influenced by neurobiological factors (Diamond & Amso, Reference Diamond and Amso2008; Morozova et al., Reference Morozova, Zorkina, Abramova, Pavlova, Pavlov, Soloveva, Volkova, Alekseeva, Andryshchenko, Kostyuk, Gurina and Chekhonin2022). This has led us to gradually expand our research perspective from external environmental factors to the neural mechanisms within the brain when exploring pathways for cognitive enhancement.
The past two decades have witnessed an increasing emphasis on neuromodulation as a strategy to address core deficits in disorders that remain refractory to conventional care (see in Krishna & Fasano, Reference Krishna and Fasano2024). Neuromodulation targets dysfunctional circuits directly via controlled electrical or magnetic stimulation, offering the prospect of more rapid, mechanistically grounded, and durable change in brain–cognition relationships (Neves, Ventura, & Madeira, Reference Neves, Ventura and Madeira2025; Qiao et al., Reference Qiao, Sedillo, Brown, Ferrentino and Pesaran2020). Among noninvasive approaches, transcranial magnetic stimulation (TMS) and transcranial direct current stimulation (tDCS) modulate neuronal activity via magnetic fields or weak electrical currents, enabling targeted, region-specific modulation that can enhance cognitive functions (Elder & Taylor, Reference Elder and Taylor2014; Qiu, He, Cao, & Zhang, Reference Qiu, He, Cao and Zhang2023). These techniques have shown potential to improve working memory, attention, and emotion regulation (Chen, Ke, Ni, & Ming, Reference Chen, Ke, Ni and Ming2024; Davidson et al., Reference Davidson, Bhattacharya, Sarica, Darmani, Raies, Chen and Lozano2024; Elder & Taylor, Reference Elder and Taylor2014; Mattioli et al., Reference Mattioli, Maglianella, D’Antonio, Trimarco and Caligiore2024; Vega et al., Reference Vega, Hernandez, Anwar, Sharafi, Islam, Shekoohi and Kaye2025). Both techniques, however, have limited capacity to engage deeper limbic structures (Camacho-Conde, Del Rosario Gonzalez-Bermudez, Carretero-Rey, & Khan, Reference Camacho-Conde, Del Rosario Gonzalez-Bermudez, Carretero-Rey and Khan2023). At the invasive end of the spectrum, deep brain stimulation (DBS) is highly effective for treatment-resistant movement disorders and is under active study for psychiatric disorders (Hardesty & Sackeim, Reference Hardesty and Sackeim2007), but it is resource-intensive and ethically challenging. Implanted vagus nerve stimulation (VNS) has demonstrated robust long-term benefits in epilepsy (Toffa et al., Reference Toffa, Touma, El Meskine, Bouthillier and Nguyen2020) and depression (Milby, Halpern, & Baltuch, Reference Milby, Halpern and Baltuch2008), highlighting the therapeutic potential of vagal pathways, yet the requirement of surgical implantation and risk of complications restricts its wider use.
Against this backdrop, neuromodulation has reframed a familiar question: what if we could modulate the neural circuits that regulate arousal, affect, and inhibitory control – directly and noninvasively? Transcutaneous auricular vagus nerve stimulation (taVNS) has emerged as an especially compelling alternative. By stimulating the auricular branch of the vagus nerve (ABVN) at the external ear, taVNS provides noninvasive access to vagal afferents while avoiding surgical risks (Badran et al., Reference Badran, Yu, Adair, Mappin, DeVries, Jenkins, George and Bikson2019; Butt, Albusoda, Farmer, & Aziz, Reference Butt, Albusoda, Farmer and Aziz2020). These afferents terminate in the nucleus tractus solitarius (NTS), which relays to the locus coeruleus, and limbic and prefrontal regions (amygdala, hippocampus, and medial prefrontal cortex) implicated in emotion regulation, autonomic balance, and executive control (Caestecker et al., Reference Caestecker, Lescrauwaet, Boon, Carrette, Raedt and Vonck2025). These projections enable taVNS to influence broad neuromodulatory systems, including noradrenergic, cholinergic, and serotonergic pathways, thereby exerting effects on arousal, attention, and affect regulation (Aranberri Ruiz, Reference Aranberri Ruiz2024) (see Figure 1).
taVNS afferent pathways and modulatory/efferent effects. Note: Afferent inputs from the auricular branch of the vagus (ABVN) project to the nucleus tractus solitarius (NTS) (± spinal trigeminal nucleus, SpV/Sp5). NTS engages brainstem modulatory nuclei–locus coeruleus (LC; norepinephrine, NE) and dorsal/median raphe (DRN/MRN; serotonin, 5-HT), and relays (via parabrachial nucleus, PBN) to cortical/limbic targets (DLPFC/PFC, ACC/Insula, and Hippocampus/Amygdala). Vagal efferents arise from the dorsal motor nucleus/nucleus ambiguus (DMV/NA) and project to viscera (acetylcholine, ACh; anti-inflammatory pathway). Line styles: solid = NE (LC); dashed = 5-HT (DRN/MRN); dotted = PBN relay; dash-dot = ACh efferents.

Figure 1. Long description
The left panel shows a profile of a human head with a stimulation arrow pointing to a yellow circle at the ear. Lines trace from this point to the N T S in the brainstem. From the N T S, neural pathways radiate upward into the brain, labeled with Prefrontal Cortex P F C for executive control, norepinephrine N E release, serotonin 5 H T release, and the limbic system for emotion and memory.
The right panel is a flowchart. At the center is a box labeled N T S and S p V forward slash S p 5.
Upward afferent pathways from the N T S include:
* A solid line to D L P F C forward slash P F C.
* A dashed line to D R N forward slash M R N 5 H T.
* A dotted line to P B N, which then connects to the Hippocampus forward slash Amygdala.
* A dashed line also connects the N T S to the A C C forward slash Insula.
* An arrow points from the N T S back toward the A B V N sensory and cervical vagus efferent via plus or minus S p 5.
Downward efferent pathways from the N T S include:
* A dash-dot line labeled A C h efferents forward slash anti-inflammatory pathway leading to a box labeled D M V forward slash N A vagal efferents, A C H.
* This box points further down to a box labeled Viscera.
A legend in the bottom right defines the line styles: solid for N E L C relay, dashed for 5 H T D R N forward slash M R N relay, dotted for P B N relay, and dash-dot for A C H efferents.
Sorting the mind: Cognitive functions in taVNS
An increasing number of studies are now focusing on the effects of taVNS across specific cognitive domains (see in Ridgewell et al., Reference Ridgewell, Heaton, Hildebrandt, Couse, Leeder and Neumeier2021). However, cognitive functions do not operate in isolation; they are subserved by distributed neural networks involving multiple brain regions and interconnected circuits. Modulation of one component may therefore produce cascading effects across the cognitive system. To systematically evaluate how taVNS influences cognition, we organized the literature according to four theoretically grounded domains (see Figure 2).
Cognitive functions and taVNS: A four-domain framework.

Figure 2. Long description
At the center is a cross-section of a human brain with labeled regions including the Amygdala, Insula, P F C, A C C, and Parietal Lobe. A vertical blue line representing the Auricular Vagus Nerve Branch ascends through the brainstem, branching out as Vagal Afferent Pathways to these regions.
Surrounding the brain are four castle icons representing cognitive domains:
* Top-Left: A red castle with a lion crest labeled Executive Functions, including Decision-Making, Planning, and Impulse Control. It is linked to the P F C.
* Top-Right: A blue castle with an eagle crest labeled Working Memory and Attention, linked to the prefrontal-parietal network.
* Bottom-Right: A green castle with a snake crest labeled Cognitive Flexibility and Learning, linked to Locus Coeruleus-Norepinephrine L C N E Modulation.
* Bottom-Left: A yellow castle with a badger crest labeled Social Cognition and Emotional Regulation, linked to the Amygdala P F C Insula Network.
Arrows indicate Modulation via Brainstem Vagal Pathways connecting the central nerve branch to these external domains.
Executive functions
Executive functions govern higher-order cognitive activities, such as decision-making, planning, problem-solving, and impulse control. They are not only important for individuals navigating complex environments but also represent a core capacity for flexible adaptation and adjustment to change, enabling individuals to demonstrate ‘resolve’ and ‘initiative’ when confronting intricate decisions (Diamond, Reference Diamond2013). Whether taVNS can enhance adaptive capacity in complex environments by stimulating the prefrontal cortex to improve impulse control and decision-making represents one of the primary foci of our current exploration (Mena-Chamorro et al., Reference Mena-Chamorro, Espinoza-Palavicino, Barramuño-Medina, Romero-Arias and Gálvez-García2025; Zhang et al., Reference Zhang, Lin, Wang, Zhou, Xu, Jiang, Pu and Ge2024).
Working memory and attention
Working memory represents the mental workspace that allows individuals to temporarily store, update, and manipulate information essential for reasoning, comprehension, and goal-directed behavior. It is not merely a passive holding system but a dynamic process that integrates incoming sensory input with existing knowledge to facilitate complex cognitive operations (Baddeley, Reference Baddeley1992). Attention, on the other hand, functions as the selective gatekeeper of cognition, allocating limited neural resources toward task-relevant stimuli while inhibiting distractions (van Moorselaar & Slagter, Reference van Moorselaar and Slagter2020). From a neurocognitive perspective, these two mechanisms are deeply interwoven. The central executive component of working memory relies heavily on attentional control systems mediated by the prefrontal cortex and parietal networks (Friedman & Robbins, Reference Friedman and Robbins2022; Funahashi, Reference Funahashi2017). This interaction enables individuals to maintain focus under conditions of high cognitive load and to flexibly shift attention when task demands change (Egner, Reference Egner2023).
Social cognition and emotional regulation
Social cognition encompasses a constellation of mental processes that enable individuals to perceive, interpret, and predict others’ emotions, intentions, and social behaviors (Arioli, Crespi, & Canessa, Reference Arioli, Crespi and Canessa2018). It forms the cognitive foundation for empathy, moral reasoning, and adaptive interpersonal functioning (Arioli, Crespi, & Canessa, Reference Arioli, Crespi and Canessa2018). Emotional regulation, by contrast, refers to the capacity to monitor, evaluate, and modify emotional reactions to maintain psychological homeostasis and achieve social harmony (McRae & Gross, Reference McRae and Gross2020). Together, these systems constitute the core of affective intelligence – an essential element of prosocial behavior and interpersonal sensitivity.
From a neurobiological perspective, both social cognition and emotional regulation are supported by overlapping neural circuits involving the prefrontal cortex, amygdala, insula, and anterior cingulate cortex (Gangopadhyay, Chawla, Dal Monte, & Chang, Reference Gangopadhyay, Chawla, Dal Monte and Chang2021). These regions mediate the intricate balance between emotional reactivity and cognitive control (Casey, Heller, Gee, & Cohen, Reference Casey, Heller, Gee and Cohen2019). taVNS, by modulating vagal afferent pathways and enhancing parasympathetic tone, may exert a dual influence: strengthening emotion recognition and improving self-regulatory capacity. Such modulation could facilitate more adaptive social responses, attenuate maladaptive emotional arousal, and enhance empathy-driven interactions.
Cognitive flexibility and learning
Cognitive flexibility reflects an individual’s ability to disengage from habitual responses and adopt novel, contextually appropriate solutions – an essential mechanism for strategic reasoning and adaptive problem-solving (Corbo, Troisi, Marselli, & Casagrande, Reference Corbo, Troisi, Marselli and Casagrande2024; Ionescu, Rabaglietti, & Miu, Reference Ionescu, Rabaglietti and Miu2024). Complementing this, learning ability represents the progressive consolidation of knowledge and experience through iterative feedback and neural plasticity, ensuring that past encounters inform future decisions (Galván, Reference Galván2010). Together, these capacities underpin adaptive behavior and the ability to modify strategies in response to environmental feedback. taVNS via the locus coeruleus–norepinephrine (LC–NE) system, may strengthen the neural substrates supporting cognitive flexibility and adaptive learning. This mechanism is hypothesized to promote heightened alertness, more efficient error monitoring, and greater behavioral plasticity.
The present study
The burgeoning interest in taVNS represents a rapidly evolving field within cognitive enhancement research. However, the existing research landscape remains fragmented, with disparate findings across domains. Previous meta-analyses of taVNS have largely examined noncognitive outcomes – insomnia (de Oliveira et al., Reference de Oliveira, Gallo Ruelas, Viana Diaz, Oliveira de Paula, Fruett da Costa and Pilitsis2025), pupil dilation (Pervaz et al., Reference Pervaz, Thurn, Vezzani, Kaluza, Kühnel and Kroemer2025), heart-rate variability (HRV) (Wolf et al., Reference Wolf, Kühnel, Teckentrup, Koenig and Kroemer2021), and overall safety (Kim et al., Reference Kim, Marduy, de Melo, Gianlorenco, Kim, Choi, Song and Fregni2022). To date, only one quantitative synthesis has evaluated cognitive effects; however, it was restricted to healthy individuals and did not examine domain-specific outcomes, reporting a small but significant pooled effect (g = 0.21) across 19 studies (Ridgewell et al., Reference Ridgewell, Heaton, Hildebrandt, Couse, Leeder and Neumeier2021). However, emerging studies conducted over the past 5 years in various populations have yielded conflicting findings. Some studies included in previous meta-analyses have been retracted due to problematic data reporting, which also calls into question the robustness of earlier findings. This highlights the need for a more updated, comprehensive meta-analytic synthesis that consolidates results across diverse studies.
Research objectives
The research objective (RO)s of this study is therefore threefold:
RO1: Assess the overall effect of taVNS on cognitive functions and systematically evaluate the impact of taVNS on various cognitive domains.
RO2: Investigate the impact of taVNS on clinical populations to assess how taVNS affects individuals with cognitive impairments related to various conditions.
RO3: Examine moderator variables and heterogeneity in effect sizes to explore the role of different moderators (e.g. stimulation parameters like frequency, intensity, and duration) on the effectiveness of taVNS.
Methodology
Protocol and registration
This systematic review and meta-analysis followed the Preferred Reporting Items for Systematic Reviews and Meta-Analyses (PRISMA) guidelines and is prospectively registered in the PROSPERO International Prospective Register of Systematic Reviews (ID: CRD 420251166774). The completed PRISMA checklist is provided in Supplementary Appendix A.
Search strategy
We developed a comprehensive search strategy with a specialist librarian to cover biomedical, psychological, and interdisciplinary literature (see Supplementary Appendix B, Supplementary Tables B1–B2). Seven databases were searched from inception to October 2025: PubMed, MEDLINE, EMBASE, PsycINFO, Web of Science Core Collection, Cochrane CENTRAL, and Scopus. To minimize publication bias, we also searched ClinicalTrials.gov and the WHO ICTRP. Hand-searching included reference lists of eligible full texts and relevant reviews/meta-analyses. Gray literature was screened via ProQuest Dissertations and Theses Global, and reports from scientific meetings and other unpublished sources were considered where methods and outcomes were adequately reported. No language or year restrictions were applied.
Study selection and data extraction
Study selection was performed independently by two reviewers. Inter-rater agreement was excellent (abstract screening: Cohen’s κ = 0.96; full-text screening: Cohen’s κ = 0.92). Inclusion/exclusion criteria and types of data collected from each article presented in this analysis can be found in Supplementary Appendix B, Supplementary Tables B3 and B4; the data extraction results can be found in Supplementary Appendix C.
Statistical analysis
All quantitative syntheses were conducted in R (v 4.3.1) using the metafor (Viechtbauer, Reference Viechtbauer2010) and brms (Bürkner, Reference Bürkner2017) packages. Standardized mean differences were expressed as Hedges’ g. Compared to Cohen’s d, Hedges’ g corrects for small-sample bias with a correction factor, making it more suitable for the small-to-medium sample studies prevalent in this field. For the primary analyses, a random-effects model was employed to estimate the pooled effect of taVNS on cognitive outcomes. Between-study variance ( τ 2) was estimated using the restricted maximum likelihood (REML) method, which provides an unbiased estimate under conditions of moderate heterogeneity. For verification, results were compared with DerSimonian–Laird (DL) estimators. Within-subject and crossover designs were retained when adequate data were available. When within-subject correlations were not reported, a conservative default correlation of r = 0.5 was assumed following established recommendations; sensitivity analyses using r values between 0.3 and 0.7 confirmed the stability of the pooled estimates (Lakens, Reference Lakens2013).
Heterogeneity was quantified by the I 2 and τ 2 statistics, and we conducted two sensitivity analyses: (i) Leave-One-Out (LOO) and (ii) Monte-Carlo subset resampling (k = 10–30), repeatedly refitting the model to random subsets to assess stability of the pooled effect. To assess small-study and publication bias, Egger’s regression intercept test, the Trim-and-Fill procedure, and the fail-safe N Test were performed, with the number of imputed studies (k₀) and adjusted pooled estimates reported. We also prespecified a robust analysis of random subsets (repeatedly sampling across different subset sizes to estimate pooled effects) and examined the sources and magnitude of heterogeneity using τ 2–I 2 relationships and effect–I 2 scatter plots.
To enhance inferential robustness, a Bayesian hierarchical random-effects model was additionally implemented using brms. Study-level true effects ( θ ᵢ) were modeled as normally distributed around a population mean μ with between-study variance τ 2. Weakly informative priors were used to regularize estimates while maintaining flexibility: μ was assigned a Normal (0, 0.5) prior, reflecting the plausible range of small-to-medium psychological effects, and τ followed a Half-Cauchy (0, 0.5) prior. Posterior inference used four chains with 4,000 iterations per chain (2,000 warmup and 2,000 post-warmup), yielding 8,000 posterior draws. Convergence was assessed via R^ and adequate bulk/tail effective sample sizes; no convergence issues were indicated. Posterior means and 95% credible intervals (CrI) were summarized for both overall and domain-specific models. All analyses were two-tailed, and statistical significance was defined as p < .05 for frequentist estimates or posterior probability P ( μ > 0) > 0.95 for Bayesian models.
Quality assessment
We evaluated quality assessment for all included studies using the Cochrane Risk of Bias 2 tool (RoB 2) (Sterne et al., Reference Sterne, Savović, Page, Elbers, Blencowe, Boutron, Cates, Cheng, Corbett, Eldridge, Emberson, Hernán, Hopewell, Hróbjartsson, Jüni, Kirkham, Lasserson, Li, McAleenan and Higgins2019). Two reviewers (FL and YL) independently completed the RoB 2 signaling questions after a calibration exercise; disagreements were resolved by discussion. Domain-level and overall judgments followed RoB 2 guidance: low risk of bias, some concerns, or high risk of bias. Overall assessment based on the most unfavorable domain: one high risk indicates overall high; all low domains indicate overall low; all others indicate some concern. The quality assessment results, and visualization are presented in Supplementary Appendix D.
Results
Literature search
We identified 539 unique records. Of these, 393 were excluded due to content or article type (animal models, n = 7; irrelevant topics, n = 356; conference abstracts without sufficient outcome data to compute effect sizes, n = 6; reviews, n = 12; opinions/corrections, n = 12). Of the remaining 146 articles, 92 were excluded for not reporting a cognitive outcome, and one was excluded due to a recent retraction. The final sample comprised 53 studies; 30 contributed data to the quantitative meta-analysis (see Figure 3).
PRISMA flowchart for studies selection and inclusion.

Figure 3. Long description
The flowchart is organized into three vertical phases labeled on the far left.
1. Identification Phase.
Top left box: Records identified from Databases n equals 530 and Registers n equals 0.
Top right box: Records identified from Citation searching n equals 9 etc.
2. Screening Phase.
Left column sequence:
- Records screened n equals 539. An arrow points right to a box for Records excluded n equals 393.
- Reports sought for retrieval n equals 146.
- Reports assessed for eligibility n equals 146. An arrow points right to a box for Reports excluded: No Cognitive Outcome n equals 92 and Recent Retraction n equals 1.
Right column sequence:
- Reports sought for retrieval n equals 9.
- Reports assessed for eligibility n equals 9.
3. Included Phase.
Bottom box: Arrows from both the left and right screening columns converge here. Studies included in review n equals 53. Studies included in meta-analysis n equals 30.
Study characteristics
All studies were published between 2015 and 2025, and sample sizes ranged from 20 to 124 participants (median ≈ 52), encompassing both healthy adults and various clinical populations. Geographically, studies were conducted across Europe (n = 29), Asia (n = 18), and North/South America (n = 6), with most experiments implemented in university or hospital laboratory settings (see Supplementary Appendix E for an overview of study locations and publication-year trends). Regarding stimulation characteristics, taVNS was typically delivered to the left cymba conchae or tragus using auricular electrodes at frequencies between 20 and 30 Hz, intensities of 0.5–1.5 mA, and pulse widths of 200–500 μs. Session durations ranged from 15 to 30 minutes. Earlobe sham stimulation was the most common control condition.
Qualitative synthesis of the evidence
Across the past decade, taVNS has rapidly evolved from a peripheral neurostimulation technique into a promising cognitive neuromodulation tool. The studies included in this review collectively chart a clear developmental trajectory. Early exploratory trials (2014–2018; e.g. Jacobs et al., Reference Jacobs, Riphagen, Razat, Wiese and Sack2015; Colzato, Sellaro, & Beste, Reference Colzato, Sellaro and Beste2017; Burger et al., Reference Burger, van Diest, van der Does, Hysaj, Thayer, Brosschot and Verkuil2018) focused on proof-of-principle demonstrations in healthy adults, examining immediate cognitive effects during or shortly after brief stimulation sessions. These studies primarily targeted executive control and conflict monitoring tasks (e.g. Simon, Flanker, and Go/No-Go), consistently reporting improved inhibitory control and post-error adjustment – effects hypothesized to arise from enhanced LC-NE-mediated arousal. Subsequent research (2019–2022) diversified into domain-specific paradigms, investigating working memory, learning, emotion regulation, and social cognition across varied populations (Borges et al., Reference Borges, Knops, Laborde, Klatt and Raab2020; Tona et al., Reference Tona2020; Oehrn et al., Reference Oehrn, Molitor, Krause, Niehaus, Schmidt, Hakel, Timmermann, Menzler, Knake and Weber2022; Verkuil & Burger, Reference Verkuil and Burger2019). This second wave began integrating neurophysiological markers (EEG theta, ERP N2/P3, fNIRS oxy-Hb, and pupil dilation) to capture mechanistic indices of vagal engagement. More recently (2023–2025), studies have shifted toward translational and clinical applications in populations such as mild cognitive impairment (Dolphin et al., Reference Dolphin, Dyer, Dukelow, Commins, Finucane and Kennelly2023; Wang et al., Reference Wang, Zhang, Guo, He, Zhang, Wang, Zhao, Li, Wang, Hou, Li, Wang, Hao, Zhao, Wu, Fang and Rong2022) and major depressive disorder (Zhao et al., Reference Zhao, Schiweck, Jamalambadi, Meyer, Brandt, Schneider, Aichholzer, Qubad, Bouzouina, Schillo, Hanssen, Sonkusare, Kingslake, Beckenstrom, Repple, Reif-Leonhard, Hahn, Reif and Edwin Thanarajah2025). Parallel work in healthy participants has begun examining stimulation parameter optimization (e.g. intensity, duty cycle, and electrode site), marking a methodological maturation of the field.
Evidence spanning studies collectively indicates that taVNS is associated with task-dependent, load-sensitive, and state-dependent effects on cognition. While behavioral effects vary in magnitude, neurophysiological alterations (e.g. ERP N2/P3 components, frontal theta, pupil response, HRV, and frontal oxygenation/connectivity) demonstrate greater consistency and frequently precede measurable behavioral improvements. Behavioral facilitation was more readily observed under high-load or resource-constrained conditions, whereas under low-load or ceiling-effect conditions, effects predominantly manifested as optimized ‘neural efficiency’ (e.g. reduced No-Go N2 or shorter N2–P3 interpeak latency), reflecting optimization tendencies in frontoparietal resource allocation and gain control.
Studies targeting conflict/inhibition consistently demonstrate enhanced neural markers of conflict adaptation, post-error deceleration, and inhibitory efficiency. taVNS was associated with enhanced post-conflict adaptation in Simon/Flanker-like tasks and reduced conflict-related N2 amplitude, suggesting upregulation of cognitive control and efficiency gains (Fischer, Ventura-Bort, Hamm, & Weymar, Reference Fischer, Ventura-Bort, Hamm and Weymar2018). In Go/No-Go and ‘go/change’ paradigms, taVNS reduces overall errors, diminishes conflict costs, and enhances medial frontal theta (a classic neural marker of executive control) during induced go/stop conflicts (Keute et al., Reference Keute, Barth, Liebrand, Heinze, Kraemer and Zaehle2020). In the everyday contextualized Executive RT-test, taVNS reduced No-Go N2 without impairing inhibitory performance, signifying ‘equivalent inhibition achieved with reduced neural cost’ (Pihlaja, Failla, Peräkylä, & Hartikainen, Reference Pihlaja, Failla, Peräkylä and Hartikainen2020). Further research observed significantly reduced inter-peak latencies of the N2–P3 complex in the frontal region during No-Go conditions among a burnout subgroup, alongside reduced errors in the non-burnout group, suggesting accelerated and more efficient executive control processes (Pihlaja & Hartikainen, Reference Pihlaja and Hartikainen2025). It should be noted that a minority of studies, despite lacking behavioral improvements, still exhibited clear neurophysiological changes, supporting a phased effect model of ‘neural changes preceding behavioral changes’ (Fischer, Ventura-Bort, Hamm, & Weymar, Reference Fischer, Ventura-Bort, Hamm and Weymar2018).
Research on working memory and attention generally demonstrates load-dependent enhancement and physiological optimization. Following 24-hour sleep deprivation, taVNS significantly improved spatial 3-back accuracy compared to active auricular control, while showing no significant effect on PVT alertness. This indicates selective support for high-load WM rather than general reaction time enhancement (Zhao et al., Reference Zhao, Chang, Cheng, Tian, Yang, Du, Cui, He, Wang, Kong, Deng, Lu, Tang, Xu, Sun and Qin2023). In event-related protocols, 3-second pulsed transcutaneous auricular vagus nerve stimulation (taVNS) phase/baseline-dependent modulation of pupillary responses and prolongation of target stimulus reaction times in auditory oddball tasks aligns with the gain control theory of LC–NA, suggesting the importance of ‘event-locked’ neuromodulation timing (Villani et al., Reference Villani, Finotti, di Lernia, Tsakiris and Azevedo2022). Consistency across such studies incorporating EEG/pupil/HRV metrics supports taVNS’s role in sustaining working memory operations by stabilizing arousal and enhancing signal-to-noise ratios under resource-constrained or declining alertness states.
Regarding emotional and social functioning, taVNS effects vary with task characteristics but consistently demonstrate enhanced prosocial tendencies and improved processing of positive information across multiple models. In a prisoner’s dilemma paradigm among epilepsy patients, taVNS increased cooperation rates within a crossover, double-blind design. Diffusion models revealed early modulation of initial biases, suggesting influence on early decision-making stages and reward/motivation circuits (Oehrn et al., Reference Oehrn, Molitor, Krause, Niehaus, Schmidt, Hakel, Timmermann, Menzler, Knake and Weber2022). In contrast, among high-anxiety individuals, taVNS failed to improve inhibitory attention (IOR) toward fearful faces, suggesting a ceiling or mismatch effect in those with high baseline anxiety/potential high LC tension. However, it enhanced IOR toward neutral faces in individuals with high HRV, further emphasizing the modulation of effects by individual baseline states (Verkuil & Burger, Reference Verkuil and Burger2019). Collectively, these findings reveal taVNS’s regulatory influence on the orbitofrontal-amygdala-insular circuit, supporting its role in facilitating emotional regulation and social responsiveness, particularly within negative or ambiguous emotional contexts.
Regarding flexibility and learning, evidence exhibits task complexity and learning type dependence. Under highly complex task switching and response cascade conditions, taVNS was associated with reduced switching costs and errors (see previous section on executive control outcomes), whereas standard-difficulty task switching more readily yields null results, which is consistent with the load-dependent interpretation of ‘greater difficulty yielding greater efficacy’ (Keute et al., Reference Keute, Barth, Liebrand, Heinze, Kraemer and Zaehle2020). In associative/language learning, taVNS accelerates novel letter-phoneme relationship acquisition while enhancing automatization and decoding, suggesting its potential to facilitate high-interference encoding and consolidation processes (Thakkar et al., Reference Thakkar, Engelhart, Khodaparast, Abadzi and Centanni2020). Reinforcement learning studies present a contrasting picture: in go/no-go reinforcement learning paradigms, taVNS reduced learning rates, particularly following punishment, suggesting it may promote exploration-over-exploitation update strategies. This does not contradict the ‘gain/arousal tuning’ model but reflects strategic trade-offs, supporting its potential mechanism of enhancing prefrontal-amygdala circuit plasticity and long-term memory reappraisal.
Quantitative synthesis of the evidence
RO1: The impact of taVNS and cognitive functions
A random-effects model combining all 30 studies showed a significant, medium-sized positive effect of taVNS on overall cognitive performance (Hedges’ g = 0.41, 95% CI: [0.30, 0.53], p < .001), with moderate to high heterogeneity (I 2 = 51.4%). The overall effect is visualized in the forest plot (see Figure 4).
Forest plot of the effects of taVNS on overall cognitive functions.

Figure 4. Long description
The forest plot lists 30 studies on the y-axis and Hedges’ g values on the x-axis ranging from negative 1 to 5.
Top entries include Camargo et al. 2024 with the largest effect of 2.15 and a 95 percent C I of 1.11 to 3.20. Subsequent studies like Mena-Chamorro et al. 2025 and Capone et al. 2021 show decreasing effect sizes of 0.93 and 0.88 respectively.
The middle section contains studies such as Wang et al. 2022 with 0.60 and Zhao et al. 2023 with 0.35. As the list descends, the effect sizes approach zero, with Pihlaja et al. 2020 and Oehm et al. 2022 both showing a slight negative effect of negative 0.03.
Each study is represented by a colored dot for the point estimate and horizontal whiskers for the confidence interval. At the bottom, a black diamond represents the Pooled Effect. The center of the diamond aligns with a Hedges’ g of 0.41, with the width representing a 95 percent C I of 0.29 to 0.53. This pooled result is statistically significant as the diamond does not cross the vertical line of null effect at zero. The total weight is 100.0 percent.
Subgroups in cognitive functions
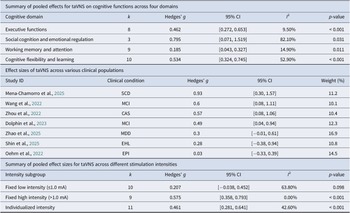
Subgroup analyses by cognitive function domains indicated broadly consistent benefits of taVNS, with magnitudes varying by construct. For executive functions, a random-effects model across eight studies showed a medium, statistically significant improvement (Hedges’ g = 0.46, 95% CI: 0.27–0.65, p < .001) and low heterogeneity (I 2 = 9.5%), suggesting fairly concordant effects. Social cognition and emotion regulation yielded a larger point estimate (k = 3; g = 0.80, 95% CI: 0.07–1.52, p = .031) but substantial between-study heterogeneity (I 2 = 82.1%). Working memory and attention showed a small yet reliable advantage (k = 9; g = 0.19, 95% CI: 0.04–0.33, p = .011) with low heterogeneity (I 2 = 14.9%), consistent with a modest but stable effect. Cognitive flexibility and learning demonstrated a medium overall effect (k = 10; g = 0.53, 95% CI: 0.32–0.75, p < .001) with moderate heterogeneity (I 2 = 52.9%), indicating meaningful variability across tasks and protocols. Taken together, taVNS was associated with positive effects across all cognitive functions’ domains (see Table 1 and Supplementary Appendix F, Supplementary Figures F1–F4).
Overview of pooled effect sizes

Table 1. Long description
The figure consists of three forest plots analyzing the effects of t a V N S. All plots use Hedges’ g as the effect size measure on the x-axis, ranging from negative 1.0 to 2.0.
Top Panel: Summary of pooled effects across four cognitive domains.
1. Executive functions: k equals 8, Hedges’ g is 0.462, 95% C I [0.272, 0.653], I-squared is 9.50%, p-value less than 0.001.
2. Social cognition and emotional regulation: k equals 3, Hedges’ g is 0.795, 95% C I [0.071, 1.519], I-squared is 82.10%, p-value is 0.031.
3. Working memory and attention: k equals 9, Hedges’ g is 0.185, 95% C I [0.043, 0.327], I-squared is 14.90%, p-value is 0.011.
4. Cognitive flexibility and learning: k equals 10, Hedges’ g is 0.534, 95% C I [0.324, 0.745], I-squared is 52.90%, p-value less than 0.001.
Middle Panel: Effect sizes across clinical populations.
1. Mena-Chamorro et al. (S C D): g is 0.93, 95% C I [0.30, 1.57], weight 11.2%.
2. Wang et al. (M C I): g is 0.6, 95% C I [0.08, 1.11], weight 10.1%.
3. Zhou et al. (C A S): g is 0.57, 95% C I [0.08, 1.06], weight 10.4%.
4. Dolphin et al. (M C I): g is 0.49, 95% C I [0.04, 0.94], weight 12.3%.
5. Zhao et al. (M D D): g is 0.3, 95% C I [-0.01, 0.61], weight 16.9%.
6. Shin et al. (E H L): g is 0.28, 95% C I [-0.38, 0.94], weight 10.8%.
7. Oehrn et al. (E P I): g is 0.03, 95% C I [-0.33, 0.39], weight 14.5%.
Bottom Panel: Summary of pooled effect sizes across stimulation intensities.
1. Fixed low intensity (less than or equal to 1.0 m A): k equals 10, g is 0.207, 95% C I [-0.038, 0.452], I-squared is 63.80%, p-value is 0.098.
2. Fixed high intensity (greater than 1.0 m A): k equals 9, g is 0.575, 95% C I [0.358, 0.793], I-squared is 0.00%, p-value less than 0.001.
3. Individualized intensity: k equals 11, g is 0.461, 95% C I [0.281, 0.641], I-squared is 42.60%, p-value less than 0.001.
Sensitivity analysis
The LOO analysis demonstrated that the removal of any single study did not significantly alter the overall pooled effect size. The pooled Hedges’ g remained stable, with values ranging from 0.39 (when removing Camargo et al., Reference Camargo, Pacheco-Barrios, Gianlorenço, Menacho, Choi, Song and Fregni2024) to 0.43 (when removing Mertens et al., Reference Mertens, Naert, Miatton, Poppa, Carrette, Gadeyne, Raedt, Boon and Vonck2020), and the overall effect remained statistically significant in all iterations (all p < .001) (see Supplementary Appendix F, Supplementary Figure F5). This confirms that the results are not unduly influenced by any single study.
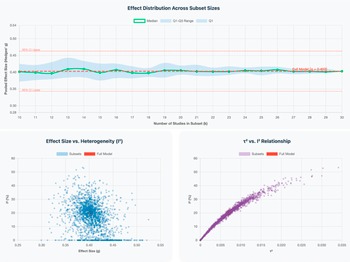
We also performed a Monte-Carlo subset resampling sensitivity analysis, repeatedly (1,000 runs) fitting the random-effects model to random subsets of size k = 10–30; median estimates remained near the full-model value (g ≈ 0.40) with narrowing IQRs as k increased. All distributions fell within the full model’s 95% CI, indicating the conclusion is not driven by a small number of studies (see the top part of Figure 5).
Subsampling sensitivity analysis and heterogeneity diagnostics for the pooled taVNS effect. Note: Top: Monte-Carlo subset resampling (k = 10–30) shows median pooled Hedges’ g tracking the full-model estimate (red dashed line; 95% CI in red dotted lines), with Q1–Q3 ribbon narrowing as k increases. Bottom-left: No systematic association between subset effect sizes and heterogeneity (I 2); the full-model point is overlaid in red. Bottom-right: I 2 increases monotonically with τ 2, indicating that observed heterogeneity primarily reflects genuine between-study variance rather than small-study bias.

Figure 5. Long description
The top panel is a line graph titled Effect Distribution Across Subset Sizes. The x-axis is Number of Studies in Subset k from 10 to 30. The y-axis is Pooled Effect Size Hedges g from 0.28 to 0.54. A green line with dots represents the median, which fluctuates around 0.40. A red dashed line marks the Full Model g equals 0.403. Red dotted lines show the 95 percent C I Upper and Lower bounds. A light blue ribbon representing the Q 1 to Q 3 range narrows as k increases.
The bottom-left panel is a scatter plot titled Effect Size versus Heterogeneity I super 2. The x-axis is Effect Size g from 0.25 to 0.55. The y-axis is I super 2 percent from 0 to 60. Blue dots represent subsets clustered around the center. A single red dot marks the Full Model at approximately g equals 0.40 and I super 2 equals 20 percent.
The bottom-right panel is a scatter plot titled tau squared versus I super 2 Relationship. The x-axis is tau squared from 0 to 0.035. The y-axis is I super 2 percent from 0 to 60. Purple dots show a monotonic logarithmic-style increase where I super 2 rises sharply at low tau squared values and then begins to plateau. A red dot represents the Full Model positioned along this curve.
Publication bias and small study effects
Visual inspection of the funnel plot revealed some asymmetry. This was statistically confirmed by Egger’s regression test (intercept = 3.91, p < .001), suggesting a potential for publication bias favoring studies with positive results. We then applied the trim-and-fill method using the L0 estimator (adjusted g = 0.338 [0.220, 0.455]) and conducted Rosenthal’s fail-safe N (Nfs = 1067), suggesting the overall conclusion is still robust to a substantial number of unpublished null studies (see Supplementary Appendix F, Supplementary Figure F6 and Supplementary Table F1 for detailed results).
We further examined the relationship between effect size and heterogeneity, along with variance decomposition. Across thousands of random subsets, no systematic correlation was observed between pooled effects and I 2; the scatter plot centered around g ≈ 0.40 and I 2 ∼ 10–30%. I 2 exhibited the expected monotonically increasing relationship with τ 2, consistent with I 2 = τ 2/( τ 2 + vˉ); indicating that the observed heterogeneity primarily reflects genuine inter-study variation rather than being attributable to effect inflation or small-sample bias (see in Figure 5 bottom and Supplementary Appendix F, Supplementary Figure F7).
RO2: Exploratory impact of taVNS on clinical populations
To specifically investigate the impact of taVNS on individuals with clinical conditions, we conducted a subgroup meta-analysis including the seven studies. The clinical populations encompassed major depressive disorder (MDD), mild cognitive impairment (MCI), and patients at risk for delayed neurocognitive recovery (EPI). Given a small k within diagnoses, we aggregated clinical cohorts to stabilize estimation. Subgrouping by individual diagnoses was statistically underpowered. Therefore, all clinical cohorts were analyzed collectively to ensure stable estimation of pooled effects. This choice maximizes precision without over-interpreting sparse strata. A random-effects model showed a significant, medium-to-large positive effect of taVNS on cognitive performance in these clinical populations (Hedges’ g = 0.55, 95% CI: [0.31, 0.79], p < .001). Heterogeneity within this subgroup was low to moderate (I2 = 29.5%, τ 2 = 0.03).
To formally compare the effect between clinical and healthy populations, a meta-regression was performed with population type as a moderator. The analysis did not show a statistically significant difference in the magnitude of the effect between clinical (k = 7) and healthy (k = 23) cohorts ( β = −0.001, p = .994). This suggests that the cognitive-enhancing effects of taVNS are comparably effective in both populations (see in Table 1).
RO3: Meta-regression analyses of heterogeneity
To explore the sources of inter-study heterogeneity, we conducted three meta-regression analyses on the stimulation intensity, stimulation mode and duration, and stimulation site (see Table 1).
Stimulation intensity. A subgroup analysis comparing different intensity strategies showed that studies using fixed high intensity (>1.0 mA) (g = 0.58, 95% CI: [0.36, 0.79]) or individualized intensity (g = 0.46, 95% CI: [0.28, 0.64]) yielded significant effects, whereas studies using fixed low intensity (≤1.0 mA) did not produce a statistically significant pooled effect (g = 0.21, 95% CI: [−0.04, 0.45], p = .098).
Stimulation mode and duration. Neither the stimulation mode (online vs. offline; β = 0.04, p = .791) nor the duration of a single stimulation session ( β = 0.003, p = .609) were found to be significant moderators of the effect size.
Stimulation site. No significant difference was found between studies stimulating the tragus versus the concha ( β = 0.03, p = .882.).
REML and DL comparison
To test method robustness, DL estimation was used for re-pooling, yielding highly consistent results with REML: the effect size differences (Δ g) across domains were small for both methods (e.g. overall Δ g = 0.024; executive function Δ g = −0.009; social cognition/emotional regulation Δ g = 0.147; working memory/attention Δ g = 0.014; cognitive flexibility/learning Δ g = 0.032). Correlation between methods reached r = .978, 95% CI: [.920, .997], r2 = .957, p < .001. Bland–Altman analysis resulted in a mean difference of 0.0416, with 95% consistency limits [−0.0778, 0.1610], indicating minimal systematic bias (see Supplementary Appendix G for detailed results).
Bayesian meta analyses for enhancing the robustness
Following completion of traditional (frequency-based) random-effects and subgroup/sensitivity analyses, we further employed Bayesian hierarchical modelling for validation due to the following reasons: First, unlike frequentist confidence intervals, Bayesian credible intervals provide direct probabilistic statements about the location of the true effect. Second, the hierarchical structure with weakly informative priors induces partial pooling (shrinkage), which stabilizes effect estimates in domains with small numbers of studies (e.g. social cognition and emotional regulation, k = 3) by borrowing strength from the overall distribution of effects; this guards against overconfident conclusions from sparse data while still allowing domain-specific inference. Third, posterior probabilities offer a natural metric for quantifying the evidence that taVNS confers benefit, which is particularly informative under conditions of moderate-to-high heterogeneity where frequentist p-values may be difficult to interpret.
Overall cognitive functions
A Bayesian random-effects meta-analysis across 30 independent comparisons indicated a positive overall effect of taVNS on cognitive functions: μ = 0.396, 95% CrI: [0.271, 0.531]. Between-study heterogeneity was moderate: τ = 0.253, 95% CrI: [0.122, 0.404]. The posterior probability that the true overall effect is positive was ~1.00, indicating a near-certain benefit on aggregated cognitive outcomes.
Subgroup analyses by cognitive functions
Prespecified domain models (fit independently) showed heterogeneous patterns across domains. For cognitive flexibility and learning (k = 10), evidence indicates a stable, moderate positive effect with low-to-moderate heterogeneity ( μ = 0.530, 95% CrI: [0.319, 0.757]; τ = 0.232, 95% CrI: [0.033, 0.489]; P ( μ > 0) = 0.9999). For executive functions (k = 8), results support a moderate, credibly positive effect with low-to-moderate heterogeneity ( μ = 0.465, 95% CrI: [0.236, 0.701]; τ = 0.167, 95% CrI: [0.007, 0.473]; P ( μ > 0) = 0.999). For working memory and attention (k = 9). The point estimate suggests a small benefit, though uncertainty includes the null ( μ = 0.133, 95% CrI: [−0.051, 0.325]; τ = 0.162, 95% CrI: [0.007, 0.440]; P ( μ > 0) = 0.931). For social cognition and emotional regulation (k = 3), despite a large point estimate, precision is limited (small k), and heterogeneity is high. μ = 0.626, 95% CrI: [−0.333, 1.521]; τ = 0.745, 95% CrI: [0.065, 2.094]; P ( μ > 0) = 0.932.
Study-level posterior estimates
Posterior means and 95% CrIs for each study’s true effect ( θ ᵢ) are provided in the forest data table (see Supplementary Appendix H, Supplementary Tables H1 and H2) and visualized in the forest plot (see Figure 6). These study-level estimates reflect shrinkage toward the pooled mean proportional to within-study variance and the inferred heterogeneity.
Posterior distribution of the overall effect size ( μ ) and forest plot of posterior means and 95% CrIs for individual studies.

Figure 6. Long description
The left panel is a histogram titled Overall effect mu on the x-axis, which ranges from 0.1 to 0.7. The y-axis represents density from 0 to 6. A green bell-shaped distribution peaks at approximately 0.4. Two vertical dashed orange lines mark the 95 percent credible interval boundaries at roughly 0.27 and 0.52.
The right panel is a forest plot with the x-axis labeled Posterior true effect theta ranging from negative 0.25 to 1.25. A vertical solid orange line represents the mean overall effect at 0.4, and a vertical dashed orange line marks the zero point. Thirty-one individual studies are listed vertically on the y-axis, starting from Camargo et al., 2024 at the top to Kaan et al., 2021 at the bottom. Each study is represented by an orange dot for the posterior mean and a horizontal orange line for the 95 percent C r I. Most studies show a positive effect, with means clustered between 0.1 and 0.7, though several lower studies have intervals that cross the zero line.
Discussion
The present systematic review and meta-analysis provide the most comprehensive quantitative synthesis to date of the cognitive effects of taVNS. In sum, taVNS was associated with statistically significant improvement in overall cognitive performance, a finding that remained robust across multiple sensitivity and Bayesian analyses. Domain-specific models further showed a consistent pattern of benefits: moderate, reliable improvements in executive functions and cognitive flexibility and learning, and small but significant gains in working memory and attention. Exploratory analyses also suggested potentially larger effects in social cognition and emotional regulation; however, these findings are based on a limited number of studies (k = 3) with substantial heterogeneity and should therefore be interpreted as preliminary pending replication. Importantly, comparable effects were observed in both healthy and clinical populations, suggesting that the potential relevance of taVNS may extend to clinical populations. Together, these results support taVNS as a promising noninvasive neuromodulation technique with the potential to influence multiple cognitive domains through vagal–brainstem–prefrontal circuitry. Extending prior small-scale findings, this synthesis provides a cohesive evidence base suggesting that taVNS may facilitate executive control, adaptive learning, and affective regulation.
To advance a more unified theoretical understanding of how taVNS modulates cognition, we propose the Vagal Neurocognitive Integration Model (VNIM) that links vagal afferent activation with domain-specific cognitive outcomes through shared neuromodulatory mechanisms. This framework conceptualizes taVNS as a bidirectional regulator of brain function, integrating ascending bottom-up vagal inputs with descending top-down cortical control to produce coherent changes across multiple cognitive domains.
At the bottom-up level of VNIM, vagal afferent activation engages the NTS–LC–raphe pathway described above, releasing norepinephrine and serotonin throughout cortical and subcortical networks. Through this mechanism, taVNS is hypothesized to increase cortical signal-to-noise ratio and optimize the brain’s readiness state for information processing, providing the neurophysiological substrate upon which higher cognitive operations depend. Such arousal-based modulation may explain the modest yet consistent enhancements observed in working memory and attention, where stimulation may improve alertness and sustained focus without expanding structural storage capacity.
At the top-down level of VNIM, the LC establishes reciprocal projections to the PFC and limbic regions (Scammell, Arrigoni, & Lipton, Reference Scammell, Arrigoni and Lipton2017). The moderate-to-large effects observed in executive functions and cognitive flexibility are consistent with strengthened LC–NE-driven prefrontal modulation of inhibitory control, conflict monitoring, and adaptive decision-making. Regarding social cognition and emotional regulation, the exploratory findings from a limited number of studies (k = 3) suggest potentially larger effects, although the substantial heterogeneity (I 2 = 82.1%) precludes firm conclusions. These preliminary observations are nonetheless consistent with the hypothesized engagement of vagal–limbic circuits: stimulation of the vagal afferents may enhance parasympathetic tone and modulate prefrontal–amygdala coupling, thereby facilitating emotion regulation and empathic processing. The considerable variability in these outcomes likely reflects a combination of methodological differences across studies and individual differences in baseline vagal tone and limbic reactivity, as predicted by the polyvagal framework (Porges, Reference Porges2009). Critically, these bottom-up and top-down processes are bidirectionally integrated, forming a closed-loop mechanism that continuously regulates arousal–control and reactivity–regulation balance (see Figure 7).
Integrated top-down and bottom-up mechanisms of the vagal neurocognitive integration model.

Figure 7. Long description
The diagram is organized into three main horizontal sections connected by a large circular arrow indicating a continuous cycle.
At the top, the Top-Down Mechanism section contains four boxes in a linear sequence from left to right. Limbic System Amygdala points to Prefrontal Cortex Amygdala, which points to Strengthen and Emotion Regulation and Executive Control, which finally points to Increased Parasympathetic Tone.
The central green box represents the integration zone. At its top is Widespread Cortical slash Subcortical Projections. Below this, two parallel vertical paths exist. On the left, L C dash Prefrontal Loop points down to Locus Coeruleus L C, Norepinephrine. On the right, L C dash Limbic Loop points down to Enhancing Arousal and Vigilance Signal dash to dash Noise Optimisation. Both paths converge at the bottom of the green box into Widespread Cortical slash Subcortical Integration.
At the bottom, the Bottom-Up Mechanism section shows an icon of an ear with a lightning bolt pointing to Auricular Vagus Nerve Branch. This points to Nucleus Tractus Solitarius N T S. To the right, Dorsal and Median Raphe Nuclei Serotonin also points toward the N T S.
Large curved arrows on the perimeter connect these sections. A blue and orange arrow curves downward from the top-right Increased Parasympathetic Tone toward the bottom-up section. A pink and orange arrow curves upward from the bottom-left Auricular Vagus Nerve Branch back toward the top-down section.
The theoretical interpretation of domain-specific effects further reinforces this integrative view of VNIM. The prominent gains in executive control and flexibility are consistent with the adaptive-gain theory of LC–NE function (Aston-Jones & Cohen, Reference Aston-Jones and Cohen2005), wherein phasic LC activation amplifies task-relevant neural representations and optimizes behavioral adaptation. By modulating this adaptive gain, taVNS may improve the balance between exploitation and exploration in cognitive control. Conversely, the modest but consistent effects in working memory and attention align with Cowan’s (Reference Cowan2001) state-regulation hypothesis: taVNS enhances the neurophysiological state that supports optimal performance rather than altering intrinsic capacity limits. As noted above, the social cognition findings remain exploratory, and individual variability in this domain may be governed by baseline parasympathetic flexibility and vagal–limbic pathway integrity, a hypothesis requiring confirmation from adequately powered studies.
In summary, the VNIM provides a unified framework for interpreting the multi-domain cognitive effects of taVNS. Within the VNIM, taVNS is proposed to act through three primary mechanisms: (i) LC-noradrenergic modulation, which enhances cortical signal-to-noise ratio and stabilizes arousal; (ii) prefrontal control enhancement, supporting inhibition, conflict monitoring, and cognitive flexibility; and (iii) affect regulation via orbitofrontal–amygdala circuitry. These mechanisms may help explain the more consistent effects observed for executive control and cognitive flexibility, while also pointing to three provisional moderators: (i) larger effects under higher task demands; (ii) stronger benefits among individuals with lower baseline arousal/vagal tone; and (iii) dose advantages for above-threshold or individually titrated intensities over fixed low-intensity protocols.
Drawing upon the aggregated evidence and its corresponding certainty ratings, several clinical recommendations can be formulated to guide the translational application of taVNS.
Because taVNS is portable and suitable for home-based administration, it offers potential for scalable translation across two domains: clinical treatment and cognitive optimization in healthy populations. In nonclinical contexts, taVNS may serve as a pre-task intervention to enhance arousal regulation and stabilize performance on cognitively demanding activities. Clinically, VNIM suggested greater responsiveness in conditions marked by control-system inefficiency (e.g. MCI, depression with cognitive slowing, and neurorehabilitation). taVNS may also be considered a promising adjunctive approach for cognitive rehabilitation in MCI, ADHD, and mood disorders presenting with executive dysfunction. Evidence further supports the use of individualized or higher-intensity stimulation protocols (>1 mA) when tolerated, as these parameters have yielded consistently larger effects than fixed low-intensity settings. Conditional recommendations extend to the integration of taVNS within multimodal treatment programs, particularly when combined with pharmacological or cognitive-behavioral therapies in cases where residual cognitive deficits persist.
Patient selection should prioritize individuals with preserved sensory tolerance, intact auricular skin integrity, and adequate motivation for structured follow-up. Stimulation frequencies between 20 and 30 Hz, pulse widths of 200–300 μs, and intensities titrated just below the pain threshold have been most associated with cognitive benefit. Typical treatment sessions last 20–30 minutes, administered three to five times per week. Continuous monitoring of attentional, executive, and affective domains every 4–6 weeks is recommended, complemented by physiological indices such as heart-rate variability to track vagal engagement.
In terms of implementation, taVNS can be delivered across a variety of settings, ranging from outpatient clinics to home-based, tele-supervised environments. Incorporating taVNS into care pathways should be pragmatic and evidence-proportionate. Clinicians may consider positioning taVNS within stepped-care algorithms for cognitive dysfunction after reversible causes are optimized. Finally, equity and access warrant attention: as consumer devices proliferate, evidence-based guidance is needed to avoid widening socioeconomic disparities in access to neuromodulatory care.
Despite the robustness of the present findings, several limitations warrant consideration. First, because relatively small clinical samples were available, conducting separate analyses for each diagnostic category would have resulted in insufficient statistical power. Accordingly, we aggregated all clinical cohorts into a unified subgroup to obtain a more stable and interpretable pooled estimate. This approach is methodologically justified, given the consistent outcomes across sensitivity analyses. However, future investigations should aim to enlarge the clinical evidence base through adequately powered, diagnosis-specific trials to clarify potential differences in taVNS responsiveness across clinical populations. Second, some key mechanistic pathways remain incompletely understood. While current neuroimaging and electrophysiological data implicate the locus coeruleus–prefrontal network, the precise causal chain linking vagal activation to specific cognitive domains remains inferential, and the moderating roles of baseline cognitive reserve and affective state require further examination. Third, the interpretation of taVNS effects must consider the methodological challenge of incomplete blinding inherent to auricular stimulation paradigms. Although most included studies employed earlobe sham stimulation, perceptible sensory differences between active and sham conditions (e.g. tingling, warmth, or pulsatile sensations at the cymba conchae or tragus versus the earlobe) may compromise participant blinding and introduce expectancy-related effects. Although several studies reported successful blinding based on post-session allocation guessing, this approach may underestimate partial unblinding or subtle expectancy influences. Future trials should systematically assess and report blinding integrity using validated instruments, incorporate active sham conditions that more closely match the sensory profile of verum stimulation (e.g. low-intensity stimulation at non-vagal auricular sites), and consider statistical adjustment for expectancy covariates where feasible.
Building upon these limitations, future research should prioritize several directions. First, mechanistic convergence should be sought through multimodal imaging techniques – such as simultaneous EEG–fMRI coupling, pupillometry, and neurometabolic tracing – to delineate the locus coeruleus–norepinephrine and cholinergic signatures that may underlie the observed cognitive effects. Second, dose–response optimization using adaptive, closed-loop stimulation paradigms is warranted to dynamically adjust parameters in real time according to individual neurophysiological feedback. Third, longitudinal and ecologically valid trials are needed to evaluate the durability, generalizability, and behavioral transfer of taVNS-induced improvements to everyday cognitive functioning. Finally, comparative efficacy studies against established interventions, including tDCS, TMS, and pharmacological cognitive enhancers, should determine relative benefit, scalability, and cost-effectiveness. Together, these avenues may help advance taVNS from an emerging research technique toward a more clinically mature, mechanism-informed approach to cognitive support and neuropsychiatric rehabilitation.
Supplementary material
The supplementary material for this article can be found at http://doi.org/10.1017/S0033291726105017.
Author contribution
F.L. conceived the study, designed the review protocol, conducted literature screening, data extraction, statistical analyses, and drafted the manuscript.Y.L. independently screened studies, extracted data, conducted risk-of-bias assessments, and contributed to interpretation of results and manuscript revision.All authors approved the final version of the manuscript.
Funding statement
This research received no specific grant from any funding agency in the public, commercial, or not-for-profit sectors.
Competing interests
The authors declare no competing interests.
Ethics standard
Ethical approval was not required for this study as it is a systematic review and meta-analysis based exclusively on previously published data.




 Open access

