





1. Introduction
As in most domains of extragalactic astronomy, redshift (z) plays a critical role in radio surveys by linking measured quantities of galaxies to their underlying physical properties and evolutionary histories. However, determining the redshift distribution n(z) of a galaxy sample selected purely on the basis of radio flux density remains a persistent challenge. In addition to flux variability, the key difficulty arises from the fact that the apparent brightness of a radio source is largely uncorrelated with its distance (Hoyle Reference Hoyle1966; Bolton Reference Bolton1966; Norris et al. Reference Norris2019). This is due to the extremely broad radio luminosity function (RLF) of galaxies, which spans more than six orders of magnitude (Mauch & Sadler Reference Mauch and Sadler2007). As a result, some of the brightest radio sources in the sky are, in fact, located at high redshifts ( $z \gt 1$
), powered by extremely luminous radio-loud (RL) active galactic nuclei (AGN). Blind radio continuum surveys, unlike many optical or infrared (IR) imaging surveys, almost never provide redshift information on their own, as reliable estimation in this regime is particularly challenging since dominant synchrotron emission produces a smooth, featureless spectrum without strong spectral markers. In most cases, redshift estimation requires the identification of a multi-wavelength counterpart (CTP) and, ideally, the acquisition of an (optical) emission line spectrum. This process can be both observationally expensive and technically difficult, particularly for the high-z RL AGN population, which, partially due to dust extinction, is often faint at optical and IR wavelengths (De Breuck et al. Reference De Breuck2002; Norris et al. Reference Norris2019). In contrast, radio selection is particularly suitable for detecting AGN with weak nuclear activity, helping to build a more complete AGN census (Delvecchio et al. Reference Delvecchio2017; Radcliffe et al. Reference Radcliffe2021; Mazzolari et al. Reference Mazzolari2026).
$z \gt 1$
), powered by extremely luminous radio-loud (RL) active galactic nuclei (AGN). Blind radio continuum surveys, unlike many optical or infrared (IR) imaging surveys, almost never provide redshift information on their own, as reliable estimation in this regime is particularly challenging since dominant synchrotron emission produces a smooth, featureless spectrum without strong spectral markers. In most cases, redshift estimation requires the identification of a multi-wavelength counterpart (CTP) and, ideally, the acquisition of an (optical) emission line spectrum. This process can be both observationally expensive and technically difficult, particularly for the high-z RL AGN population, which, partially due to dust extinction, is often faint at optical and IR wavelengths (De Breuck et al. Reference De Breuck2002; Norris et al. Reference Norris2019). In contrast, radio selection is particularly suitable for detecting AGN with weak nuclear activity, helping to build a more complete AGN census (Delvecchio et al. Reference Delvecchio2017; Radcliffe et al. Reference Radcliffe2021; Mazzolari et al. Reference Mazzolari2026).
The challenge of determining the n(z) of a flux-limited sample of radio sources can be tackled using either a modelling or an empirical approach. The modelling route (Dunlop & Peacock Reference Dunlop and Peacock1990; de Zotti et al. Reference de Zotti, Massardi, Negrello and Wall2010) relies on combining observed radio source counts with RLFs for various source classes, alongside assumptions about their redshift evolution. This framework yields a statistical prediction of the characteristic n(z) and enables the creation of ‘mock’ catalogues for survey planning and interpretation (e.g. Wilman et al. Reference Wilman2008; Bonaldi et al. Reference Bonaldi2019). A major strength of this approach lies in its flexibility, offering a broad population-level perspective that can be updated as new data become available (e.g. Lin et al. Reference Lin, Zhu, Ma, Bonaldi and Shan2024). However, it does not provide redshift estimates or physical details for individual sources. In contrast, the empirical method (Laing, Riley, & Longair Reference Laing, Riley and Longair1983; McCarthy et al. Reference McCarthy1996; Best, Röttgering, & Lehnert Reference Best, Röttgering and Lehnert1999) involves directly associating each radio detection with an optical CTP and obtaining a spectroscopic redshift (spec-z). This enables the study of individual radio sources and their host galaxies in detail. Nevertheless, the approach is resource-intensive, particularly for faint, high-z sources, such that comprehensive spectroscopic coverage is typically restricted to a relatively small subset of (bright) radio sources. Until ongoing and upcoming wide-field, multi-object spectroscopic facilities, such as the Prime Focus Spectrograph (PFS, Tamura et al. Reference Tamura, Evans, Simard and Takami2016), the 4-metre Multi-Object Spectroscopic Telescope (4MOST, de Jong et al. Reference de Jong2019; Duncan et al. Reference Duncan2023), and the Sloan Digital Sky Survey (SDSS-V, Kollmeier et al. Reference Kollmeier2026) deliver large, statistically complete samples with secure optical redshifts, progress toward characterising the full radio population must rely on alternative methods. In this context, photometric redshift (photo-z) techniques (e.g. Norris et al. Reference Norris2019; Manning et al. Reference Manning2020; Zhou et al. Reference Zhou2021; Newman & Gruen Reference Newman and Gruen2022; Hatfield et al. Reference Hatfield2022; Duncan Reference Duncan2022; Luken et al. Reference Luken2023; Merz et al. Reference Merz2025), provide a practical and scalable means of extending redshift information to $z \sim 1-2$
across larger and fainter radio samples, particularly for AGN with multi-band optical or IR CTPs (see Hardcastle et al. Reference Hardcastle2025, for a recent application). Recently, Roster et al. (Reference Roster2024) developed a new approach to photo-z estimation called PICZL, which incorporates spatial information in addition to traditional colour features. By operating directly on imaging data, the method leverages morphological properties and compactness-related radial surface-brightness profiles to help break colour–redshift degeneracies and improve overall photo-z accuracy. The paper demonstrated that, when applied to AGN in wide-area optical surveys (
$z \sim 1-2$
across larger and fainter radio samples, particularly for AGN with multi-band optical or IR CTPs (see Hardcastle et al. Reference Hardcastle2025, for a recent application). Recently, Roster et al. (Reference Roster2024) developed a new approach to photo-z estimation called PICZL, which incorporates spatial information in addition to traditional colour features. By operating directly on imaging data, the method leverages morphological properties and compactness-related radial surface-brightness profiles to help break colour–redshift degeneracies and improve overall photo-z accuracy. The paper demonstrated that, when applied to AGN in wide-area optical surveys ( $\gt$
$\gt$ $1\,000$
deg2) and using comparable photometric inputs, PICZL outperforms both similar machine-learning (ML) and template-fitting approaches. In this paper, we employ PICZL, to determine the expected n(z) of a sample of compactFootnote
a
radio sources with flux densities
$1\,000$
deg2) and using comparable photometric inputs, PICZL outperforms both similar machine-learning (ML) and template-fitting approaches. In this paper, we employ PICZL, to determine the expected n(z) of a sample of compactFootnote
a
radio sources with flux densities $S_{856\, \mathrm{MHz}} \gt$
30 mJy. The motivation for characterising this population of relatively bright radio sources arises from its role in the Australian square kilometre array pathfinder (ASKAP, Hotan et al. Reference Hotan2021) First Large Absorption Survey in H I (FLASH; Allison et al. Reference Allison2022; Yoon et al. Reference Yoon2025), which uses these sources as probes to search for redshifted H I 21-cm absorption lines over the range
$S_{856\, \mathrm{MHz}} \gt$
30 mJy. The motivation for characterising this population of relatively bright radio sources arises from its role in the Australian square kilometre array pathfinder (ASKAP, Hotan et al. Reference Hotan2021) First Large Absorption Survey in H I (FLASH; Allison et al. Reference Allison2022; Yoon et al. Reference Yoon2025), which uses these sources as probes to search for redshifted H I 21-cm absorption lines over the range $0.42 \lt z \lt 1.0$
. Depending on their redshift, sources may fall into three distinct categories: (i) foreground sources at
$0.42 \lt z \lt 1.0$
. Depending on their redshift, sources may fall into three distinct categories: (i) foreground sources at $z \lt 0.42$
, where the redshift is too low for FLASH to detect H I absorption; (ii) sources in the redshift range
$z \lt 0.42$
, where the redshift is too low for FLASH to detect H I absorption; (ii) sources in the redshift range $0.42 \lt z \lt 1.0$
, where FLASH can potentially detect either associated H I absorption features or intervening H I along the line of sight; and iii) background sources at
$0.42 \lt z \lt 1.0$
, where FLASH can potentially detect either associated H I absorption features or intervening H I along the line of sight; and iii) background sources at $z \gt 1$
, where intervening H I absorption can be detected across the full FLASH redshift range. Accurately characterising the n(z) distribution is therefore essential to estimate the redshift pathlength probed by FLASH for different kinds of H I absorption lines and interpreting the distribution of absorbers in a statistical sense (Allison Reference Allison2021). Beyond enabling reliable distance estimates, redshift information is essential to unlocking the full scientific potential of FLASH, including the identification and characterisation of AGN and star-forming galaxies (SFGs), the interpretation of radio power and radio loudness distributions, and the study of obscuration and host-galaxy properties. Combined with multiwavelength data, one can additionally explore the X-ray and infrared properties of radio-selected sources, as well as potential ties in regard to their environments. In this work, we take a first step toward demonstrating the types of population-level analyses that become possible with FLASH once appropriate redshift information is available.
$z \gt 1$
, where intervening H I absorption can be detected across the full FLASH redshift range. Accurately characterising the n(z) distribution is therefore essential to estimate the redshift pathlength probed by FLASH for different kinds of H I absorption lines and interpreting the distribution of absorbers in a statistical sense (Allison Reference Allison2021). Beyond enabling reliable distance estimates, redshift information is essential to unlocking the full scientific potential of FLASH, including the identification and characterisation of AGN and star-forming galaxies (SFGs), the interpretation of radio power and radio loudness distributions, and the study of obscuration and host-galaxy properties. Combined with multiwavelength data, one can additionally explore the X-ray and infrared properties of radio-selected sources, as well as potential ties in regard to their environments. In this work, we take a first step toward demonstrating the types of population-level analyses that become possible with FLASH once appropriate redshift information is available.
The paper is organised as follows: Section 2 describes the FLASH radio survey and the respective source sample. In Section 3, we introduce PICZL, an image-based photo-z estimation code. Section 4 presents an evaluation of PICZL’s performance on radio-selected AGN. Our selection function and identification of optical CTPs are presented in Section 5 and Appendix A, respectively. We show applications through our multiwavelength analyses in Section 6 and assess whether and how photo-zs can be used to improve the classification of H I absorption systems in Section 7. An outlook in regard of our findings is presented in Section 8 with a concluding summary in Section 9. We express magnitudes in the AB system (Oke & Gunn Reference Oke and Gunn1983) and assume cosmological parameters of $H_0=70\,$
km s
$H_0=70\,$
km s $^{-1}$
Mpc
$^{-1}$
Mpc $^{-1}$
,
$^{-1}$
, $\Omega_{{M}}=0.3$
,
$\Omega_{{M}}=0.3$
, $\Omega_{\Lambda}=0.7$
and
$\Omega_{\Lambda}=0.7$
and $\Omega_{{k}} = 0$
.
$\Omega_{{k}} = 0$
.
2. The ASKAP-FLASH radio source sample
FLASH uses the wide-field ASKAP radio telescope (Hotan et al. Reference Hotan2021) to search for redshifted H I absorption lines tracing cool, neutral gas in the frequency range 712– $1\,000$
MHz, which corresponds to redshift
$1\,000$
MHz, which corresponds to redshift $0.42 \lt z \lt 1$
. To optimise the number of absorption lines detected, the survey is designed to be relatively shallow (two hours per pointing) and cover 24 000
$0.42 \lt z \lt 1$
. To optimise the number of absorption lines detected, the survey is designed to be relatively shallow (two hours per pointing) and cover 24 000 $\deg^2$
of sky (for survey details see Allison et al. Reference Allison2022). A single FLASH observation covers
$\deg^2$
of sky (for survey details see Allison et al. Reference Allison2022). A single FLASH observation covers $\sim$
40 deg
$\sim$
40 deg $^2$
of sky at uniform sensitivity, with a typical root-mean-square (rms) noise of 90
$^2$
of sky at uniform sensitivity, with a typical root-mean-square (rms) noise of 90 $\unicode{x03BC}$
Jy/beam in the continuum images and 5.5 mJy/beam per 18.5 kHz spectral channel in the spectral-line cubes (Yoon et al. Reference Yoon2025).
$\unicode{x03BC}$
Jy/beam in the continuum images and 5.5 mJy/beam per 18.5 kHz spectral channel in the spectral-line cubes (Yoon et al. Reference Yoon2025).
2.1. The FLASH continuum source catalogues
As the survey is still in progress, this study utilises only the continuum source catalogues for the first 174 of 600 individual fields observed by FLASH up to April 2025 (see the black boxes in Figure 1). The data products from FLASH are available at CSIRO ASKAP Science Data Archive (CASDA) public archiveFootnote b and are described in detail by Yoon et al. (Reference Yoon2025). For each FLASH field, a component catalogue and a separate island catalogue are produced by the Selavy source finder (Whiting & Humphreys Reference Whiting and Humphreys2012). It is important to understand the difference between these two catalogues. Each entry in the component catalogue corresponds to a 2D-Gaussian fit to an individual radio source identified by Selavy. In contrast, the island catalogue associates one or more components that are joined at some flux level and combines them into a single composite source whose total flux density and fitted radio centroid are catalogued. Typically, this means each entry in the island catalogue corresponds to one, physically distinct source on the sky, while the corresponding entries in the component catalogue capture its morphological structure. However, it should be mentioned that an island may contain more than one physical source, or a physical source may consist of more than one island.
FLASH survey footprint in equatorial coordinates. Black boxes indicate the fields observed up to April 2025, with those included in the pilot surveys marked by star symbols. The eROSITA-DE reference of the western Galactic hemisphere and the coverage of tenth release of the Dark Energy Spectroscopic Instrument (DESI) Legacy Imaging Surveys South (DR10-South) are overplotted for context.

To search for H I absorption lines, a spectrum is extracted at the position of each catalogued component with a peak flux density $S_{856} \geq 30$
mJy. A Bayesian line finder (Allison, Sadler, & Whiting Reference Allison, Sadler and Whiting2012) is then used to search for lines, estimate the statistical significance of each line, and fit parameters for the redshift, optical depth and velocity width of each line as described by Yoon et al. (Reference Yoon2025). For a single, isolated radio source that is small compared to the 10–15 arcsec ASKAP beam (which we term a ‘compact’ source for the purpose of this paper), the component catalogue will contain a single component with the island and component positions agreeing well. Consequently, for a true point source, the peak flux density is approximately equal to the integrated flux density. In this case, for a compact radio source where we assume the emission to emerge from close to its core/galactic center, the position where H I absorption can be detected is very likely the same as the position of the expected optical CTP of the radio continuum source.
$S_{856} \geq 30$
mJy. A Bayesian line finder (Allison, Sadler, & Whiting Reference Allison, Sadler and Whiting2012) is then used to search for lines, estimate the statistical significance of each line, and fit parameters for the redshift, optical depth and velocity width of each line as described by Yoon et al. (Reference Yoon2025). For a single, isolated radio source that is small compared to the 10–15 arcsec ASKAP beam (which we term a ‘compact’ source for the purpose of this paper), the component catalogue will contain a single component with the island and component positions agreeing well. Consequently, for a true point source, the peak flux density is approximately equal to the integrated flux density. In this case, for a compact radio source where we assume the emission to emerge from close to its core/galactic center, the position where H I absorption can be detected is very likely the same as the position of the expected optical CTP of the radio continuum source.
For a multi-component island, the situation is more complex. These sources are usually extended double or triple radio sources where the individual components are separated on the sky and the optical counterpart may not lie at the position of any of the individual radio components. It is possible to detect intervening H I absorption against compact lobes, hotspots or jet knots at the $\sim$
1 kpc level of an extended radio galaxy (see Mahony et al. Reference Mahony2022, for one example), however this is a more complicated situation where individual follow-up is likely to be needed in order to identify the intervening galaxy.
$\sim$
1 kpc level of an extended radio galaxy (see Mahony et al. Reference Mahony2022, for one example), however this is a more complicated situation where individual follow-up is likely to be needed in order to identify the intervening galaxy.
2.2. The expected radio-source populations
Based on earlier studies (e.g. Best & Heckman Reference Best and Heckman2012; Heckman & Best Reference Heckman and Best2014; Ching et al. Reference Ching2017), we can expect the FLASH radio sources with $S_{856} \gt$
30 mJy to fall into three main classes:
$S_{856} \gt$
30 mJy to fall into three main classes:
-
• Low-excitation radio galaxies (LERGs) are the dominant radio AGN population out to at least $z\sim0.8$
(Ching et al. Reference Ching2017). These are massive galaxies, but lack a radiatively efficient accretion disk so their optical spectra show weak or no emission lines (Heckman & Best Reference Heckman and Best2014).
$z\sim0.8$
(Ching et al. Reference Ching2017). These are massive galaxies, but lack a radiatively efficient accretion disk so their optical spectra show weak or no emission lines (Heckman & Best Reference Heckman and Best2014). -
• High-excitation radio galaxies (HERGs) have a thin, radiatively-efficient accretion disk surrounding the central black hole. Their optical spectra show strong, narrow emission lines.
-
• Radio-loud quasars also have a radiatively-efficient accretion disk, and their optical spectra show both bright AGN continuum radiation and strong, broad emission lines. HERGs and quasars are postulated to be the same class of objects seen at different orientations, with the central AGN in HERGs largely blocked in the optical by a dusty torus (e.g. Urry & Padovani Reference Urry and Padovani1995).

Two other radio-source populations, ‘normal’ inactive galaxies (Condon Reference Condon1992) and low-luminosity or radio-quiet (RQ) AGN (Panessa et al. Reference Panessa2019), for which the origin of the radio emission is hotly debated and, at least in some cases, arises from something other than processes related to star formation (SF), start to emerge in radio surveys at flux densities below 1–10 mJy but are not expected to occur in significant numbers in the FLASH sample. The relative fractions of HERGs, LERGs, and quasars within the FLASH sample remain uncertain, as these populations have only been systematically characterised out to $z\sim0.7$
through cross-matching NRAO VLA Sky Survey (NVSS, Condon et al. Reference Condon1998) and Faint Images of the Radio Sky at Twenty Centimeters (FIRST, Becker, White, & Helfand Reference Becker, White and Helfand1995) survey with wide-area optical redshift surveys (e.g. Best et al. Reference Best2005; Sadler et al. Reference Sadler2007; Ching et al. Reference Ching2017). At higher redshifts (
$z\sim0.7$
through cross-matching NRAO VLA Sky Survey (NVSS, Condon et al. Reference Condon1998) and Faint Images of the Radio Sky at Twenty Centimeters (FIRST, Becker, White, & Helfand Reference Becker, White and Helfand1995) survey with wide-area optical redshift surveys (e.g. Best et al. Reference Best2005; Sadler et al. Reference Sadler2007; Ching et al. Reference Ching2017). At higher redshifts ( $z\gt0.7$
), their demographics are less well defined, since the host galaxies of most LERGs, become too faint for reliable optical redshifts to be measurable with 4 m-class telescopes used for existing large multi-object redshift surveys. Nevertheless, existing studies show that HERGs and LERGs exhibit distinct evolutionary trends with redshift (Pracy et al. Reference Pracy2016; Kondapally et al. Reference Kondapally2023). In addition, photo-zs for LERGs are generally reliable out to at least
$z\gt0.7$
), their demographics are less well defined, since the host galaxies of most LERGs, become too faint for reliable optical redshifts to be measurable with 4 m-class telescopes used for existing large multi-object redshift surveys. Nevertheless, existing studies show that HERGs and LERGs exhibit distinct evolutionary trends with redshift (Pracy et al. Reference Pracy2016; Kondapally et al. Reference Kondapally2023). In addition, photo-zs for LERGs are generally reliable out to at least $z\sim1$
(Ching et al. Reference Ching2017). Since the authors show that the three main radio-source populations (LERGs, HERGs, and quasars) can be distinguished through their optical fluxes as a function of redshift,Footnote
c
it may be possible to map out the redshift distribution of these three populations further, including fainter sources, using photo-zs and optical photometry alone. This could be a key aspect in investigating the rapid decline of LERGs beyond
$z\sim1$
(Ching et al. Reference Ching2017). Since the authors show that the three main radio-source populations (LERGs, HERGs, and quasars) can be distinguished through their optical fluxes as a function of redshift,Footnote
c
it may be possible to map out the redshift distribution of these three populations further, including fainter sources, using photo-zs and optical photometry alone. This could be a key aspect in investigating the rapid decline of LERGs beyond $z\sim 1$
, possibly reflecting genuine evolutionary changes in the galaxy population, incompleteness due to survey depth limits, or the lack of appropriate training sets for photo-z estimation of these objects.
$z\sim 1$
, possibly reflecting genuine evolutionary changes in the galaxy population, incompleteness due to survey depth limits, or the lack of appropriate training sets for photo-z estimation of these objects.
2.3. The expected n(z) of FLASH continuum sources
In the FLASH survey, almost all the background radio continuum sources used to search for H I absorption will be distant radio galaxies that lack an optical redshift. This is noticeably different from large optical surveys searching for Damped Lyman-alpha (DLA) absorbers, where the redshifts of the background quasars are commonly already known (Srianand et al. Reference Srianand, Petitjean, Ledoux, Ferland and Shaw2005; Ellison et al. Reference Ellison, York, Pettini and Kanekar2008; Sánchez-Ramírez et al. Reference Sánchez-Ramrez2016; Hu et al. Reference Hu2023).
Table 1 gives some guidance as to the likely redshift distribution of ASKAP FLASH radio sources with $S_{856} \gt$
30 mJy. Sources in the northern 3CR (Laing et al. Reference Laing, Riley and Longair1983) and southern MRC-5Jy (Best et al. Reference Best2005) surveys, with a flux-density limit of several Jy and thus biased towards lower redshifts, have a median redshift of
$S_{856} \gt$
30 mJy. Sources in the northern 3CR (Laing et al. Reference Laing, Riley and Longair1983) and southern MRC-5Jy (Best et al. Reference Best2005) surveys, with a flux-density limit of several Jy and thus biased towards lower redshifts, have a median redshift of $z\sim0.5$
, but this increases to medians of
$z\sim0.5$
, but this increases to medians of $z\sim0.7$
and
$z\sim0.7$
and $z\sim1.0$
for the MRC-1Jy (McCarthy et al. Reference McCarthy1996) and the much fainter CENSORS (Brookes et al. Reference Brookes, Best, Peacock, Röttgering and Dunlop2008) sample, respectively (de Zotti et al. Reference de Zotti, Massardi, Negrello and Wall2010). Together, these suggest a likely median redshift in the range
$z\sim1.0$
for the MRC-1Jy (McCarthy et al. Reference McCarthy1996) and the much fainter CENSORS (Brookes et al. Reference Brookes, Best, Peacock, Röttgering and Dunlop2008) sample, respectively (de Zotti et al. Reference de Zotti, Massardi, Negrello and Wall2010). Together, these suggest a likely median redshift in the range $z\sim0.8$
–1 for the ASKAP FLASH continuum sources above 30 mJy. That said, the median z of RL AGN from both modelling (SKADS, T-RECS, e.g. Raccanelli et al. Reference Raccanelli2015) and photo-z (e.g. Luken et al. Reference Luken2023) is expected to be
$z\sim0.8$
–1 for the ASKAP FLASH continuum sources above 30 mJy. That said, the median z of RL AGN from both modelling (SKADS, T-RECS, e.g. Raccanelli et al. Reference Raccanelli2015) and photo-z (e.g. Luken et al. Reference Luken2023) is expected to be $\gtrsim$
1. Hardcastle et al. (Reference Hardcastle2025) recently published a catalogue of photo-zs for around 600 000 radio AGN candidates brighter than 1.1 mJy in the LOFAR Two-Metre Sky Survey (LoTSS, Shimwell et al. Reference Shimwell2017). Limiting their catalogue to a subset of sources with
$\gtrsim$
1. Hardcastle et al. (Reference Hardcastle2025) recently published a catalogue of photo-zs for around 600 000 radio AGN candidates brighter than 1.1 mJy in the LOFAR Two-Metre Sky Survey (LoTSS, Shimwell et al. Reference Shimwell2017). Limiting their catalogue to a subset of sources with $S_{144 \, \mathrm{MHz}} \gt\, $
30 mJy
$S_{144 \, \mathrm{MHz}} \gt\, $
30 mJy $ \, \bigl (\frac{144}{856}\bigl )^{- \alpha}$
, assuming a radio spectral index
$ \, \bigl (\frac{144}{856}\bigl )^{- \alpha}$
, assuming a radio spectral index $\alpha = 0.7$
, and further restricting it to single-component sources (S_code = S), we find a median redshift of
$\alpha = 0.7$
, and further restricting it to single-component sources (S_code = S), we find a median redshift of $z=1.00$
, very close to the CENSORS value.
$z=1.00$
, very close to the CENSORS value.
Overview of flux-limited radio surveys with near-complete spectroscopic redshift information.

3. The PICZL code
PICZL,Footnote d developed by Roster et al. (Reference Roster2024), is a deep learning framework designed to address the challenge of reliable photo-z estimation for extragalactic sources with complex emission budgets, particularly AGN (Salvato et al. Reference Salvato2011; Brescia et al. Reference Brescia2019; Saxena et al. Reference Saxena2024). Working directly with pixel-level flux distributions (Hoyle Reference Hoyle2016; Pasquet et al. Reference Pasquet, Bertin, Treyer, Arnouts and Fouchez2019; Hayat et al. Reference Hayat, Stein, Harrington, Lukić and Mustafa2021; Newman & Gruen Reference Newman and Gruen2022), it integrates convolutional neural networks (CNNs) with broad-band optical and mid-IR imaging from the Dark Energy Spectroscopic Instrument (DESI) Legacy Imaging Surveys Data Release 10 (LS10, Dey et al. Reference Dey2019, and the DECam eROSITA Survey (DeROSITAS; PI: Zenteno)). LS10 includes data from the Dark Energy Survey (DES, Dark Energy Survey Collaboration et al. 2016), Beijing-Arizona Sky Survey (BASS, Zou et al. Reference Zou2017), Mayall z-band Legacy Survey (MzLS, Silva et al. Reference Silva2016), and bands W[1,2,3,4] from the Near-Earth Object Wide-field Infrared Survey Explorer (NEOWISE, Mainzer et al. 2011; Lang Reference Lang2014; Meisner, Lang, & Schlegel Reference Meisner, Lang and Schlegel2017). The use of spatially resolved colour information constructed through band ratios allows the model to learn meaningful morphological and spectral patterns without relying on manually engineered features, such as template or model fluxes, which often do not account for an AGN component when derived (see e.g. Collister & Lahav Reference Collister and Lahav2004; Carrasco Kind & Brunner Reference Carrasco Kind and Brunner2013; Hogan, Fairbairn, & Seeburn Reference Hogan, Fairbairn and Seeburn2015; Almosallam, Jarvis, & Roberts Reference Almosallam, Jarvis and Roberts2016; D’Isanto & Polsterer Reference D’Isanto and Polsterer2018). This includes learning the importance of redshift-dependent light profiles, through which PICZL gains a more nuanced understanding of source type and redshift, particularly where AGN contamination or morphological diversity complicate interpretation.
3.1. Generic extragalactic populations beyond AGN
The versatility of PICZL lies in its adaptability. It can be retrained or fine-tuned for different source populations, while its architecture supports scalable deployment across large imaging datasets, reducing reliance on deep spectroscopy or handcrafted spectral-energy distribution (SED) models. Consequently, while PICZL was originally developed and optimised for optically and Xray selected AGN across the interval $0 \leq z \leq 8$
, it is also effective when applied to inactive galaxies predominantly identified at lower redshifts. When trained on such a sample, PICZL achieves redshift estimation performance on par with much deeper, pencil-beam surveys that rely on extensive multiband photometry for template fitting (Götzenberger et al. in preparation). This result highlights the model’s ability to extract redshift-sensitive features from shallower, wide-field imaging data, making it well-suited for current and upcoming large-scale surveys like the Vera C. Rubin Observatory Legacy Survey of Space and Time (LSST, Ivezić et al. Reference Ivezić2019), and Euclid (Euclid Collaboration: Mellier et al. 2025).
$0 \leq z \leq 8$
, it is also effective when applied to inactive galaxies predominantly identified at lower redshifts. When trained on such a sample, PICZL achieves redshift estimation performance on par with much deeper, pencil-beam surveys that rely on extensive multiband photometry for template fitting (Götzenberger et al. in preparation). This result highlights the model’s ability to extract redshift-sensitive features from shallower, wide-field imaging data, making it well-suited for current and upcoming large-scale surveys like the Vera C. Rubin Observatory Legacy Survey of Space and Time (LSST, Ivezić et al. Reference Ivezić2019), and Euclid (Euclid Collaboration: Mellier et al. 2025).
3.2. PICZL uncertainty
To capture redshift uncertainty, PICZL includes a Gaussian mixture model (GMM) backend that transforms the network’s outputs into full probability density functions (PDFs). This probabilistic framework allows for robust treatment of multimodal distributions, indicative of ambiguous cases, and facilitates more scientifically rigorous downstream analyses. Additionally,.ensemble learning is used to combine predictions from multiple independently trained models, improving generalisation and reducing susceptibility to outliers.
4. Application of PICZL to radio-selected samples
We explore PICZL’s performance beyond its native tracer domain, by applying the model to radio-selected samples, since approximately half of the sources in modern radio surveys are known to host an AGN (Norris et al. Reference Norris2013), the vast majority of can only be detected in the X-rays when observed at very deep sensitivities (La Franca et al. Reference La Franca2012; Smolčić et al. Reference Smolčić2017a).
4.1. Covariate shift biases
Applying PICZL to source populations selected differently from those comprising its training set can introduce systematic biases rooted in both varying galaxy properties and survey characteristics (Duncan et al. Reference Duncan, Jarvis, Brown and Röttgering2018a,Reference Duncanb; Norris et al. Reference Norris2019; Treyer et al. Reference Treyer2025). For instance, AGN selected via radio or X-ray emission may exhibit markedly different SEDs even at identical redshifts, possibly leading to divergent optical appearances and subsequent colour-redshift degeneracies. The observed populations are further modulated by survey depth, where deep surveys preferentially detect fainter, more weakly emitting AGN, while shallower ones capture the brighter, more extreme population (Salvato et al. Reference Salvato2011; Hsu et al. Reference Hsu2014). As a result, these selection effects shape the n(z) of the source population, which in turn sets the statistical priors that the model implicitly learns during training. Consequently, when PICZL is applied to a previously unseen dataset of distinct underlying true n(z), these inherited priors can skew the resulting photo-z posteriors, leading to population-dependent biases in the predictions.
4.2. Performance verification
To ensure that PICZL yields reliable redshift estimates when applied to radio-selected FLASH continuum sources, we assess its performance on three independent test samples of various sources with good spectroscopic completeness that reflect the diversity of radio-emitting galaxy populations. These include: Best & Heckman (Reference Best and Heckman2012), composed of HERGs, LERGs, and SFGs identified in the Sloan Digital Sky Survey (SDSS, York et al. Reference York2000) up to $z \lesssim 0.7$
; Ching et al. (Reference Ching2017) with WiggleZ and Galaxy And Mass Assembly (GAMA) spectroscopy covering both HERG/LERG galaxies up to
$z \lesssim 0.7$
; Ching et al. (Reference Ching2017) with WiggleZ and Galaxy And Mass Assembly (GAMA) spectroscopy covering both HERG/LERG galaxies up to $z \sim 0.7$
and quasars to extend the redshift baseline beyond
$z \sim 0.7$
and quasars to extend the redshift baseline beyond $z \gt 2$
; as well as the Molonglo Reference Catalog/1 Jansky Radio Source Survey (MRC-1Jy, McCarthy et al. Reference McCarthy1996; Kapahi et al. Reference Kapahi1998a,Reference Kapahi, Athreya, van Breugel, McCarthy and Subrahmanyab; Baker et al. Reference Baker, Hunstead, Kapahi and Subrahmanya1999), representing powerful RL AGN and quasars reaching
$z \gt 2$
; as well as the Molonglo Reference Catalog/1 Jansky Radio Source Survey (MRC-1Jy, McCarthy et al. Reference McCarthy1996; Kapahi et al. Reference Kapahi1998a,Reference Kapahi, Athreya, van Breugel, McCarthy and Subrahmanyab; Baker et al. Reference Baker, Hunstead, Kapahi and Subrahmanya1999), representing powerful RL AGN and quasars reaching $z \sim 2$
. These datasets offer a controlled setting to explore the potential biases discussed above. By benchmarking PICZL against these samples, we aim to build confidence in its applicability to FLASH continuum sources, many of which are expected to be massive, passive galaxies or moderate AGN that also emit in the X-rays or mid-IR (MIR).
$z \sim 2$
. These datasets offer a controlled setting to explore the potential biases discussed above. By benchmarking PICZL against these samples, we aim to build confidence in its applicability to FLASH continuum sources, many of which are expected to be massive, passive galaxies or moderate AGN that also emit in the X-rays or mid-IR (MIR).
To assess the performance of our photo-z estimates, we adopt two widely used evaluation metrics (Ilbert et al. Reference Ilbert2006; Luken et al. Reference Luken2023). First, we quantify the overall accuracy $\sigma_{\mathrm{NMAD}}$
as a robust estimate of the scatter between photo-z and spec-z, calculated as
$\sigma_{\mathrm{NMAD}}$
as a robust estimate of the scatter between photo-z and spec-z, calculated as
 \begin{equation}\sigma_{\textrm{NMAD}} = 1.4826\, \textrm{median} \left[ \frac{|z_{\textrm{phot}} - z_{\textrm{spec}}|}{1 + z_{\textrm{spec}}} \right]\!.\end{equation}
Second, we compute the outlier fraction, $\eta$
, which captures the fraction of cases where photo-zs diverge significantly from spec-zs. An object is classified as an outlier if
$\eta$
, which captures the fraction of cases where photo-zs diverge significantly from spec-zs. An object is classified as an outlier if
 \begin{equation}\eta =\frac{|z_{\textrm{phot}} - z_{\textrm{spec}}|}{1 + z_{\textrm{spec}}} \gt 0.15.\end{equation}
Figure 2 displays photometric versus spectroscopic redshift scatter plots for six spectroscopic subclasses of radio AGN from Ching et al. (Reference Ching2017), where each panel is split into activeFootnote
e
and inactiveFootnote
f
mode predictions from PICZL. These sources are generally bright in LS10 photometry, meaning their photo-z accuracy is overall not strongly limited by photometric uncertainties. This provides a relatively clean setting to assess PICZL’s performance on a radio-selected AGN population, despite the fact that the model was not trained on radio galaxies specifically. Overall, results show robust redshift recovery, with low outlier fractions and high accuracy across all subclasses. In particular, sources classified as LERGs, typically associated with radiatively inefficient accretion and weak optical AGN features, display lower $\eta$
and
$\eta$
and $\sigma$
than HERGs or broad-line AGN (AeB), which exhibit strong nuclear continuum. Notably, sources labelled as ‘Unusual’ or unclassified (‘NA’), which often present challenges for template-based methods due to irregular or poorly understood SEDs, are nonetheless well handled by PICZL. Interestingly, the active-mode predictions consistently outperform the inactive-mode ones across all classes. This is especially evident for AeB sources, which are more likely to appear as AGN at all wavelengths. This is an intriguing result given that most radio AGN (e.g. LERGs) have been known to appear as weak emitters in both optical and X-ray. Therefore, one might have expected the inactive model to perform better. However, AeB objects are characterised by a significant AGN contribution to their optical continuum in addition to broad emission lines, such that their broadband SEDs deviate strongly from those of normal galaxies, making galaxy-based templates or models unsuitable. The distinctive horizontal banding of AeB predictions from the inactive model can be understood as a combination of training-set limitations and feature-driven degeneracies. Since the model is trained exclusively on inactive galaxies at
$\sigma$
than HERGs or broad-line AGN (AeB), which exhibit strong nuclear continuum. Notably, sources labelled as ‘Unusual’ or unclassified (‘NA’), which often present challenges for template-based methods due to irregular or poorly understood SEDs, are nonetheless well handled by PICZL. Interestingly, the active-mode predictions consistently outperform the inactive-mode ones across all classes. This is especially evident for AeB sources, which are more likely to appear as AGN at all wavelengths. This is an intriguing result given that most radio AGN (e.g. LERGs) have been known to appear as weak emitters in both optical and X-ray. Therefore, one might have expected the inactive model to perform better. However, AeB objects are characterised by a significant AGN contribution to their optical continuum in addition to broad emission lines, such that their broadband SEDs deviate strongly from those of normal galaxies, making galaxy-based templates or models unsuitable. The distinctive horizontal banding of AeB predictions from the inactive model can be understood as a combination of training-set limitations and feature-driven degeneracies. Since the model is trained exclusively on inactive galaxies at $z \lesssim $
, sources at higher redshift lie outside the training regime, causing the model to preferentially map them onto redshift ranges that are well represented in the training data. At the same time, the predictions cluster around specific redshifts (
$z \lesssim $
, sources at higher redshift lie outside the training regime, causing the model to preferentially map them onto redshift ranges that are well represented in the training data. At the same time, the predictions cluster around specific redshifts ( $z \sim 0.4$
and
$z \sim 0.4$
and $z \sim 0.8$
) where, in galaxies, strong spectral features such as the Ca II 4 000
$z \sim 0.8$
) where, in galaxies, strong spectral features such as the Ca II 4 000 $\unicode{x00C5}$
break or prominent emission lines align with the LS10 bands and provide robust constraints. When applied to the more featureless, power-law–dominated AGN spectra, the model nevertheless anchors predictions to these ‘high-confidence’ regions in colour–redshift space, leading to degeneracies and the observed horizontal stripes. The results of the remaining spectroscopic classes suggest that radio galaxies with weak optical features or a lack of detected X-ray emission in this work retain sufficient characteristic signatures in their SEDs for more accurate estimates by the AGN-trained model. These features might include subtle emission lines, mid-IR excess, or colour signatures linked to AGN activity that distinguish them from purely inactive galaxies. Consequently, the inactive mode predictions often overestimate redshifts in low-z star-forming systems, while the active mode maintains better fidelity overall. This exercise highlights the value of training ML techniques on a broad range of AGN populations, where the use of multiwavelength selection is not a drawback but a strength as each band, sensitive to different physical processes, recovers distinct subpopulations. Harnessing this complementarity will be an important aspect of future work in this field. As a consequence of the results presented in this section, we adopt PICZL in active mode with no refinements made to the previously published version of the model to compute all photo-z estimates presented in this work.
$\unicode{x00C5}$
break or prominent emission lines align with the LS10 bands and provide robust constraints. When applied to the more featureless, power-law–dominated AGN spectra, the model nevertheless anchors predictions to these ‘high-confidence’ regions in colour–redshift space, leading to degeneracies and the observed horizontal stripes. The results of the remaining spectroscopic classes suggest that radio galaxies with weak optical features or a lack of detected X-ray emission in this work retain sufficient characteristic signatures in their SEDs for more accurate estimates by the AGN-trained model. These features might include subtle emission lines, mid-IR excess, or colour signatures linked to AGN activity that distinguish them from purely inactive galaxies. Consequently, the inactive mode predictions often overestimate redshifts in low-z star-forming systems, while the active mode maintains better fidelity overall. This exercise highlights the value of training ML techniques on a broad range of AGN populations, where the use of multiwavelength selection is not a drawback but a strength as each band, sensitive to different physical processes, recovers distinct subpopulations. Harnessing this complementarity will be an important aspect of future work in this field. As a consequence of the results presented in this section, we adopt PICZL in active mode with no refinements made to the previously published version of the model to compute all photo-z estimates presented in this work.
Photo-z versus spec-z for six distinct spectroscopic subclasses of radio galaxies (HERG, LERG, AeB, SF, Unusual, and NA) following the classification scheme of Ching et al. (Reference Ching2017). Each panel displays the photo-z performance for different source types across redshift, with subpanels separated by PICZL mode (Active, Inactive). The identity line and the outlier boundary condition (dashed) are shown in grey for reference. For each subclass, the number of sources, accuracy $\sigma_{\mathrm{NMAD}}$
and fraction of outliers
$\sigma_{\mathrm{NMAD}}$
and fraction of outliers $\eta$
are reported. All scatter plots are colour-coded by their respective kernel density.
$\eta$
are reported. All scatter plots are colour-coded by their respective kernel density.

5. Compact-source sample
At the time of this analysis, approximately one-quarter of the full FLASH survey footprint has been observed and processed (refer to Figure 1). By combining the component catalogues from all available fields, we begin with a parent catalogue comprising roughly 2.3 million radio entries. Prior to being able to compute reliable photo-z, we first need to identify the optical CTPs of all FLASH continuum sources.
5.1. Sample downselection
To select a subset of FLASH-detected sources likely to provide sufficient continuum signal for H I absorption measurements, we apply a flux-density threshold of $S_{856} \gt 30\,\mathrm{mJy}$
. This reduces the sample to approximately 71 000 entries. Since individual radio sources in the FLASH island catalogue can be resolved into multiple components, we restrict our analysis to islands made up of a single component. Although approximately 90% of FLASH continuum sources are expected to be compact and unresolved in ASKAP images, this step thus reduces ambiguous associations during cross-matching with LS10 to identify the most probable multi-wavelength CTP. This procedure, including the use of a radio prior to and the validation of candidate matches, is described in detail in Appendix A. Here, we focus on the resulting catalogue of compact FLASH continuum sources with reliable associations, which forms the basis of the analysis presented in the following sections.
$S_{856} \gt 30\,\mathrm{mJy}$
. This reduces the sample to approximately 71 000 entries. Since individual radio sources in the FLASH island catalogue can be resolved into multiple components, we restrict our analysis to islands made up of a single component. Although approximately 90% of FLASH continuum sources are expected to be compact and unresolved in ASKAP images, this step thus reduces ambiguous associations during cross-matching with LS10 to identify the most probable multi-wavelength CTP. This procedure, including the use of a radio prior to and the validation of candidate matches, is described in detail in Appendix A. Here, we focus on the resulting catalogue of compact FLASH continuum sources with reliable associations, which forms the basis of the analysis presented in the following sections.
5.2. Galactic and extragalactic classification
We examine the multiwavelength characteristics of the CTP sample beginning with an assessment of the extragalactic content. Adopting the definition of Salvato et al. (Reference Salvato2022) based on optical LS10 colours, we find that 97% of the sources appear extragalactic (i.e. above the dashed line). The resulting distribution, shown in Figure 3 and colour-coded by kernel density, reveals a region of high density associated with elliptical and luminous red galaxies (LRGs). Beyond the dominant AGN population, a subset of sources occupies regions of colour–colour space commonly associated with reddened quasars, Seyfert galaxies, and SFGs. While the colour distribution alone does not allow a quantitative decomposition of the underlying source classes, independent analysis demonstrates that the contribution from SFGs is small. A detailed assessment of the AGN and SFG content of the sample is therefore deferred to Appendix B. For the remainder of this work, we restrict all figures and statistical analyses to the extragalactic sample, while retaining Galactic sources in the released catalogue.
Colour–colour diagram showing $g-r$
vs.
$g-r$
vs. $z-W1$
for sources with
$z-W1$
for sources with $S/N \geq 3$
in g, r, z, and W1. Points are colour-coded by Gaussian kernel density. Overplotted are empirical template tracks of various galaxy types, with square markers denoting specific steps in redshift (0.2, 0.4, 0.6, 1, 1.6, 2, 3) and circles marking the starting redshift. The black dashed line represents the (Salvato et al. Reference Salvato2022) Galactic/extragalactic selection boundary in colour space.
$S/N \geq 3$
in g, r, z, and W1. Points are colour-coded by Gaussian kernel density. Overplotted are empirical template tracks of various galaxy types, with square markers denoting specific steps in redshift (0.2, 0.4, 0.6, 1, 1.6, 2, 3) and circles marking the starting redshift. The black dashed line represents the (Salvato et al. Reference Salvato2022) Galactic/extragalactic selection boundary in colour space.

6. Photometric redshift estimates
Photo-zs for all identified CTPs are estimated using PICZL, based on LS10 imaging and adopting the configuration described in Section 4.2. Roughly 13% of these can successfully be matched within 1 arcsec to a compilation of public spec-zs (Kluge et al. Reference Kluge2024; Igo et al. in preparation). As displayed in Figure 4, our photo-zs perform robustly across this sample at $\eta = 12.37\%$
and
$\eta = 12.37\%$
and $\sigma = 0.055$
, showing no significant degradation even for fainter sources. The resulting redshift distribution, n(z), is shown in Figure 5. We find that approximately 13% of continuum sources lie at
$\sigma = 0.055$
, showing no significant degradation even for fainter sources. The resulting redshift distribution, n(z), is shown in Figure 5. We find that approximately 13% of continuum sources lie at $z\lt0.42$
(foreground), 35% within the detectability range of FLASH (‘in-band’), and 52% at
$z\lt0.42$
(foreground), 35% within the detectability range of FLASH (‘in-band’), and 52% at $z\gt1$
(background), indicating that more than half of the continuum sources cannot be searched for associated H I absorption. Consequently, the effective sample available for associated absorption systems is significantly reduced, increasing the relative likelihood of detecting intervening H I absorption along the line of sight. The low-redshift regime appears dominated by sources best fit by a Sérsic (Type = SER) profile, while de Vaucouleurs (Type = DEV) profiles peak around
$z\gt1$
(background), indicating that more than half of the continuum sources cannot be searched for associated H I absorption. Consequently, the effective sample available for associated absorption systems is significantly reduced, increasing the relative likelihood of detecting intervening H I absorption along the line of sight. The low-redshift regime appears dominated by sources best fit by a Sérsic (Type = SER) profile, while de Vaucouleurs (Type = DEV) profiles peak around $ z\sim 1$
, with Type = REX and Type = PSF sources prevailing at higher redshifts. In particular, the drop in sources beyond
$ z\sim 1$
, with Type = REX and Type = PSF sources prevailing at higher redshifts. In particular, the drop in sources beyond $z \gtrsim 1.5$
reflects the optical emission shift into the UV rest-frame, which can be attenuated by dust or simply intrinsically weak, where they may appear faint enough to fall below the detection threshold of LS10. Consequently, we presume much of the high-redshift excess at
$z \gtrsim 1.5$
reflects the optical emission shift into the UV rest-frame, which can be attenuated by dust or simply intrinsically weak, where they may appear faint enough to fall below the detection threshold of LS10. Consequently, we presume much of the high-redshift excess at $z \gtrsim 5$
to arise from the prior imprint of the AGN training sample (see Section 4.1). However, while the overall sample shows relatively well-constrained estimates, with a median 1
$z \gtrsim 5$
to arise from the prior imprint of the AGN training sample (see Section 4.1). However, while the overall sample shows relatively well-constrained estimates, with a median 1 $\sigma$
error of 0.67, most of these sources are associated with strongly degenerate PDFs, often featuring a secondary PDF peak at a more plausible redshift. Nevertheless, they represent a subset of potentially interesting cases for further targeted investigation. The median redshifts by morphological class, and for the total sample, are given in Table 2, including and excluding (
$\sigma$
error of 0.67, most of these sources are associated with strongly degenerate PDFs, often featuring a secondary PDF peak at a more plausible redshift. Nevertheless, they represent a subset of potentially interesting cases for further targeted investigation. The median redshifts by morphological class, and for the total sample, are given in Table 2, including and excluding ( $z \leq 3$
) considering the high-z tail. Future spectroscopic follow-up will play an important role in expanding the sample of secure redshifts, providing an opportunity to cross-check the photo-zs presented here while also enhancing the overall redshift completeness.
$z \leq 3$
) considering the high-z tail. Future spectroscopic follow-up will play an important role in expanding the sample of secure redshifts, providing an opportunity to cross-check the photo-zs presented here while also enhancing the overall redshift completeness.
Spectroscopic versus photometric redshifts for high-z CTPs in the FLASH sample. Points are colour-coded by and plotted in increasing order of their LS10-r band AB magnitude. The dashed lines indicate the $\frac{|\Delta z|}{1+z} \geq 0.15$
boundaries used to identify outliers.
$\frac{|\Delta z|}{1+z} \geq 0.15$
boundaries used to identify outliers.

Top: FLASH compact source PICZL photo-z distributions coloured by different LS10 morphological classes. Middle: Same distribution as above but coloured by the PDF degeneracy class: none – single strong peak; light – weak secondary peak(s); mild – noticeable but subdominant secondary peaks; strong – multiple peaks of comparable strength. Bottom: Same distribution as above but coloured by the S/N of all LS10 (g,r,i,z) bands.

FLASH median redshifts per LS10 morphological class.

6.1. Connecting radio, optical and X-ray
Within the region of overlapping survey footprints, we identify approximately 6 500 associations between the $\sim$ $22{\,}000$
FLASH and the deepest stacked extended Roentgen Survey with an Imaging Telescope Array (eROSITA, Merloni et al. Reference Merloni2024) all sky survey (eRASS:5) LS10 CTPs. This
$22{\,}000$
FLASH and the deepest stacked extended Roentgen Survey with an Imaging Telescope Array (eROSITA, Merloni et al. Reference Merloni2024) all sky survey (eRASS:5) LS10 CTPs. This $\sim 30\%$
detection fraction lies at the higher end of values reported in the literature, which generally range from 10 to 20% for fainter or more extended radio populations (e.g. La Franca, Melini, & Fiore Reference La Franca, Melini and Fiore2010; Del Moro et al. Reference Del Moro2013). The majority of FLASH continuum sources, however, remain undetected in eRASS:5 as many compact, bright radio galaxies are presumably either jet-dominated systems with intrinsically weak X-ray cores, or, potentially obscured AGN whose soft X-ray emission falls below the eROSITA bandpass, highlighting both the diversity of the underlying AGN population and the selection biases introduced by soft X-ray surveys. As shown in Figure 6, we observe objects from different populations: sources that are moderately bright in both X-ray and radio, and sources that are X-ray bright but comparatively radio faint. Although SF can contribute to radio and X-ray, both emission processes are ultimately linked to the accretion activity of the super-massive back hole (SMBH), with X-rays tracing the coronal emission near the black hole and radio tracing jet power (Igo et al. Reference Igo2024). Noticeably, we find that a large fraction of the AGN in our sample populate a region characterised by relatively uniform radio-to–X-ray flux ratios at faint X-ray and optical flux levels. This regime also contains the majority of AGN selected via their IR colours, suggesting a population dominated by obscured and/or intrinsically X-ray–weak accretion. At the same time, our sample is biased toward luminous, accretion-powered systems by construction, and a substantially larger scatter in radio–X-ray behaviour is expected in deeper or more diverse samples. In particular, at intermediate luminosities, the coupling between radio and X-ray emission can be disrupted by a combination of nuclear obscuration, host-galaxy SF, and variations in jet production efficiency. Toward the brightest X-ray fluxes, the source density declines sharply, leaving only a small number of objects that preferentially exhibit lower radio-to–X-ray flux ratios, corresponding to X-ray–bright but radio–faint systems.
$\sim 30\%$
detection fraction lies at the higher end of values reported in the literature, which generally range from 10 to 20% for fainter or more extended radio populations (e.g. La Franca, Melini, & Fiore Reference La Franca, Melini and Fiore2010; Del Moro et al. Reference Del Moro2013). The majority of FLASH continuum sources, however, remain undetected in eRASS:5 as many compact, bright radio galaxies are presumably either jet-dominated systems with intrinsically weak X-ray cores, or, potentially obscured AGN whose soft X-ray emission falls below the eROSITA bandpass, highlighting both the diversity of the underlying AGN population and the selection biases introduced by soft X-ray surveys. As shown in Figure 6, we observe objects from different populations: sources that are moderately bright in both X-ray and radio, and sources that are X-ray bright but comparatively radio faint. Although SF can contribute to radio and X-ray, both emission processes are ultimately linked to the accretion activity of the super-massive back hole (SMBH), with X-rays tracing the coronal emission near the black hole and radio tracing jet power (Igo et al. Reference Igo2024). Noticeably, we find that a large fraction of the AGN in our sample populate a region characterised by relatively uniform radio-to–X-ray flux ratios at faint X-ray and optical flux levels. This regime also contains the majority of AGN selected via their IR colours, suggesting a population dominated by obscured and/or intrinsically X-ray–weak accretion. At the same time, our sample is biased toward luminous, accretion-powered systems by construction, and a substantially larger scatter in radio–X-ray behaviour is expected in deeper or more diverse samples. In particular, at intermediate luminosities, the coupling between radio and X-ray emission can be disrupted by a combination of nuclear obscuration, host-galaxy SF, and variations in jet production efficiency. Toward the brightest X-ray fluxes, the source density declines sharply, leaving only a small number of objects that preferentially exhibit lower radio-to–X-ray flux ratios, corresponding to X-ray–bright but radio–faint systems.
Optical r-band magnitudes as a function of soft X-ray flux for FLASH CTPs successfully cross-matched to eRASS:5. Sources are colour-coded by their radio over X-ray (both in units of $\mathrm{erg}\,\mathrm{s}^{-1}$
) flux ratios. Additionally, we highlight AGN selection according to Equation (3) and
$\mathrm{erg}\,\mathrm{s}^{-1}$
) flux ratios. Additionally, we highlight AGN selection according to Equation (3) and $|X/O| \lt 1$
from Maccacaro et al. (Reference Maccacaro, Gioia, Wolter, Zamorani and Stocke1988).
$|X/O| \lt 1$
from Maccacaro et al. (Reference Maccacaro, Gioia, Wolter, Zamorani and Stocke1988).

6.2. Infrared properties
Next, we explore a relative measure of radio loudness (RL) of our sources as a function of their LS10 morphological classification. We define this quantity as the logarithmic ratio of radio flux density to optical flux using the available $\mathrm{LS10}\,r$
-band and 1.4 GHz measurements scaled from FLASH fluxes (see Appendix B), which differs from the definition of radio loudness in the classical sense (Kellermann et al. Reference Kellermann, Condon, Kimball, Perley and Ivezić2016). Given these definitional differences, the RL values presented here should not be interpreted in terms of the conventional RL/RQ division. Instead, they are intended to provide a homogeneous, internally consistent metric for identifying relative trends within the FLASH population. The resulting distributions, shown in Figure 7, span values of
$\mathrm{LS10}\,r$
-band and 1.4 GHz measurements scaled from FLASH fluxes (see Appendix B), which differs from the definition of radio loudness in the classical sense (Kellermann et al. Reference Kellermann, Condon, Kimball, Perley and Ivezić2016). Given these definitional differences, the RL values presented here should not be interpreted in terms of the conventional RL/RQ division. Instead, they are intended to provide a homogeneous, internally consistent metric for identifying relative trends within the FLASH population. The resulting distributions, shown in Figure 7, span values of $-2 \lesssim \mathrm{RL} \lesssim 6$
, with a global peak at RL
$-2 \lesssim \mathrm{RL} \lesssim 6$
, with a global peak at RL $\sim 4.5$
. A clear dependence on source morphology is visible. Sérsic-profile or disc-like sources dominate the lower end of the distribution, peaking at RL
$\sim 4.5$
. A clear dependence on source morphology is visible. Sérsic-profile or disc-like sources dominate the lower end of the distribution, peaking at RL $\sim 3$
, consistent with a population of modestly RL galaxies, potentially including SF systems and low-excitation AGN. Optically point-like sources (PSF) show a unimodal distribution centred around moderate RL, peaking closer to
$\sim 3$
, consistent with a population of modestly RL galaxies, potentially including SF systems and low-excitation AGN. Optically point-like sources (PSF) show a unimodal distribution centred around moderate RL, peaking closer to $\mathrm{RL} \sim 4$
, suggesting that literature claims of RQ versus RL bimodality among quasars might be an artefact of observational biases (e.g. Kellermann et al. Reference Kellermann, Sramek, Schmidt, Shaffer and Green1989; Sikora, Stawarz, & Lasota Reference Sikora, Stawarz and Lasota2007; Mahony et al. Reference Mahony2012. The remaining morphological classes all display a single dominant peak at
$\mathrm{RL} \sim 4$
, suggesting that literature claims of RQ versus RL bimodality among quasars might be an artefact of observational biases (e.g. Kellermann et al. Reference Kellermann, Sramek, Schmidt, Shaffer and Green1989; Sikora, Stawarz, & Lasota Reference Sikora, Stawarz and Lasota2007; Mahony et al. Reference Mahony2012. The remaining morphological classes all display a single dominant peak at $\mathrm{RL} \sim 4.5$
, characteristic of classical RL AGN. When considering sources with additional multi-wavelength AGN signatures, we find that X-ray–detected AGN peak at a lower loudness compared to IR-selected AGN. Using the AGN selection criterion
$\mathrm{RL} \sim 4.5$
, characteristic of classical RL AGN. When considering sources with additional multi-wavelength AGN signatures, we find that X-ray–detected AGN peak at a lower loudness compared to IR-selected AGN. Using the AGN selection criterion
 \begin{equation} {W}1 - {W}2 \gt 0.8,\end{equation}
as introduced by Stern et al. (Reference Stern2012) and Assef et al. (Reference Assef2018), $\sim$
38% of the 24 776 CTPs with S/N
$\sim$
38% of the 24 776 CTPs with S/N $_{{W}1\&{W}2} \geq 3$
satisfy this condition. Roughly 20% of objects classified as AGN according to Equation (3) are also detected in eRASS:5, provided they share the same LS10 CTP. Consequently, this represents a lower limit, as it excludes sources whose X-ray and radio detections were assigned to different optical CTPs. This indicates a significant overlap between the IR-selected and X-ray detected AGN populations within the shared footprint of the CTP sample (Mendez et al. Reference Mendez2013). However, the contrast in peaks displayed in Figure 7 may indicate that eROSITA preferentially identifies moderately RL systems, tracing potentially more massive, quiescent galaxies, while IR selection isolates more obscured AGN, inherently missed in the X-ray selection, found to preferentially be RL (Best et al. Reference Best2005; Smolčić et al. Reference Smolčić2017b; Wang et al. Reference Wang2024).
$_{{W}1\&{W}2} \geq 3$
satisfy this condition. Roughly 20% of objects classified as AGN according to Equation (3) are also detected in eRASS:5, provided they share the same LS10 CTP. Consequently, this represents a lower limit, as it excludes sources whose X-ray and radio detections were assigned to different optical CTPs. This indicates a significant overlap between the IR-selected and X-ray detected AGN populations within the shared footprint of the CTP sample (Mendez et al. Reference Mendez2013). However, the contrast in peaks displayed in Figure 7 may indicate that eROSITA preferentially identifies moderately RL systems, tracing potentially more massive, quiescent galaxies, while IR selection isolates more obscured AGN, inherently missed in the X-ray selection, found to preferentially be RL (Best et al. Reference Best2005; Smolčić et al. Reference Smolčić2017b; Wang et al. Reference Wang2024).
Kernel density estimates of the logarithmic radio-to-optical loudness, $\log_{10}(f_{\mathrm{FLASH}}/f_{\mathrm{LS10}-r})$
, for LS10 galaxies with reliable r-band detections (S/N
$\log_{10}(f_{\mathrm{FLASH}}/f_{\mathrm{LS10}-r})$
, for LS10 galaxies with reliable r-band detections (S/N $\geq$
3). Filled curves show the distributions for different LS10 morphological types, while dashed lines indicate the subsets with X-ray detections in eRASS:5 (black) and MIR-selected (
$\geq$
3). Filled curves show the distributions for different LS10 morphological types, while dashed lines indicate the subsets with X-ray detections in eRASS:5 (black) and MIR-selected ( $W1 - W2 \geq 0.8$
, grey). The KDEs are plotted with common_norm = False, so the curves reflect the absolute fraction of the parent LS10 sample represented by each subset, rather than being rescaled to integrate to unity.
$W1 - W2 \geq 0.8$
, grey). The KDEs are plotted with common_norm = False, so the curves reflect the absolute fraction of the parent LS10 sample represented by each subset, rather than being rescaled to integrate to unity.

6.3. Obscured sources
Because eROSITA is most sensitive in the soft X-ray band, it naturally underdetects heavily obscured sources. This property allows us to use X-ray detections or the lack thereof as a diagnostic for obscuration within our sample. As shown in Figure 8, FLASH radio sources successfully cross-matched with eRASS:5 largely fall into the region of colour space typically associated with a high probabilities of being an X-ray emitter, consistent with expectations. The respective probabilities are computed using a photometric prior defined by Salvato et al. (Reference Salvato2025). In contrast, many sources without an X-ray counterpart cluster in the locus characteristic of obscured AGN (Wright et al. Reference Wright2010). We further probe this obscured population using the optical–MIR colour diagnostic
WISE colour–colour diagram for sources with $W1 - W2 \gt 0.5$
using VEGA magnitudes. The background hexbin map represents the distribution of sources without an eRASS:5 match, coloured by the mean probability of being an X-ray emitter. Overplotted grey contours trace the kernel density of sources successfully matched to eRASS:5. The dashed horizontal line marks the reference threshold at
$W1 - W2 \gt 0.5$
using VEGA magnitudes. The background hexbin map represents the distribution of sources without an eRASS:5 match, coloured by the mean probability of being an X-ray emitter. Overplotted grey contours trace the kernel density of sources successfully matched to eRASS:5. The dashed horizontal line marks the reference threshold at $W1 - W2 = 0.8$
.
$W1 - W2 = 0.8$
.

 \begin{equation} r - {W}2 \geq 5.9\, [\mathrm{VEGA}]\end{equation}
as defined by Hickox et al. (Reference Hickox2007) and utilised more recently in e.g. Andonie et al. (Reference Andonie2025) as the threshold for selecting mainly X-ray AGN with a hydrogen column density $N_{\mathrm{H}} \geq 10^{22}\, \mathrm{cm^{-2}}$
at low redshift, where these bands track the accretion disk and torus. Figure 9 shows that roughly 40% of the sources displayed in Figure 8 pass this criterion. These include 23% of the sources that were successfully cross-matched to eRASS:5.
$N_{\mathrm{H}} \geq 10^{22}\, \mathrm{cm^{-2}}$
at low redshift, where these bands track the accretion disk and torus. Figure 9 shows that roughly 40% of the sources displayed in Figure 8 pass this criterion. These include 23% of the sources that were successfully cross-matched to eRASS:5.
FLASH CTP distribution in regard of the X-ray AGN obscuration selection as defined by Hickox et al. (Reference Hickox2007), showing the full sample (grey dashed line), those matched to eRASS:5 (blue), and the subset sources satisfying the obscuration threshold (red).

These results suggest that a substantial fraction of the FLASH sample occupies regions of colour space consistent with obscured AGN, underscoring the need for multiwavelength approaches to fully characterise AGN demographics.
6.4. Environmental influence on radio power
To quantify the environmental influence of radio AGN, we investigate whether a subset of our radio sources can be associated with brightest cluster galaxies (BCGs) identified in eROSITA DR1 (Kluge et al. Reference Kluge2024; Balzer et al. Reference Balzer2025; Veronica et al. Reference Veronica2025). BCGs are the most massive galaxies in clusters and are often found at or near the center of the gravitational potential well. We perform a positional cross-match between our radio sample and the BCG coordinates, requiring a maximum separation of 3 arcsec. This radius is chosen as these kind of systems tend to be at low redshift where precise centering for extended galaxies is less accurate than for point sources. Because BCGs are known to frequently host powerful RL AGN, this provides a direct diagnostic of the impact of environment on AGN triggering (Shen et al. Reference Shen2020; Popesso et al. Reference Popesso2024). In particular, we compare the incidence of BCG-associated radio sources in clusters (122) against the remaining radio population as shown in Figure 10. We find that the distribution of non-BCG galaxies peaks at higher radio luminosities but fainter optical magnitudes compared to cluster-associated sources, suggesting radio luminosities to be surpressed in dense cluster environments. Part of this trend is likely due to selection effects, such as the lower median redshift of the cluster sample as extended X-ray emission becomes increasingly difficult to detect at higher redshifts because of cosmological surface brightness dimming. In addition, our compact-source selection criterion likely biases against nearby extended, lobe-dominated systems, preferentially selecting core-dominated HERGs and compact LERGs. Nonetheless, genuine differences in AGN fueling channels (mergers and cold- flow-driven activity for high-z powerful AGN vs. hot-halo/maintenance radio mode inside clusters) may also play a role (Best & Heckman Reference Best and Heckman2012; Hardcastle et al. Reference Hardcastle2025).
Kernel density estimate of compact FLASH source luminosities, subject to PICZL photo-zs, at 1.4 GHz and the LS10 r-band for sources matched to eROSITA extended clusters and non-BCG sources.

7. The role of photo-zs in identifying H I absorbers
As a next step, beyond the scope of this paper, it will be important to examine the subset of radio sources exhibiting H I absorption. This includes investigating whether these sources occupy distinct regions of optical, radio, or X-ray parameter space compared to sources without absorption, which could provide insight into the properties of AGN probed by associated absorbers. Confirming whether a detected absorption line arises from gas physically associated with the radio source (i.e. in the host galaxy) or from an intervening system along the line of sight currently requires tight (redshift) constraints. While spec-zs remain the gold standard, they are not always available, especially in large-area radio continuum surveys. Photo-zs provide a practical alternative by supplying a statistical estimate of the source redshift directly from multi-band optical and IR photometry. Even though photo-zs carry larger uncertainties compared to spectroscopy, they are sufficiently accurate to guide the identification and classification of H I absorption features in several ways (Aditya et al. Reference Aditya2024):
-
• Association with the background source: If the redshift of the presumed H I absorption line coincides with the photo-z of the optical CTP within the expected uncertainties, the absorption can be attributed to gas bound to the host galaxy.
-
• Identification of intervening absorbers: In cases where the absorption redshift is significantly lower than the photo-z estimate of the optical background source, the line can be interpreted as an intervening absorber. This distinction allows us to probe the gaseous halos of galaxies along the line of sight not associated with the radio AGN host galaxy.
-
• Statistical population studies: Even when individual identifications are uncertain, photo-zs enable statistical analyses of large samples, such as the redshift evolution of associated versus intervening absorbers, or environmental dependencies. This includes investigating the total comoving absorption path length of the survey as well as estimating the spin temperature and hence interpreting the cold neutral medium fraction of absorbing galaxies(Allison Reference Allison2021; Allison et al. Reference Allison2022).
Ultimately, the goal of FLASH lies in investigating these individual classes in greater detail. Achieving this relies on reliably determining whether sources are physically connected or not. While photo-zs already provide some discriminatory power, recent promising approaches (e.g. Curran Reference Curran2021) have shown that these associations can be disentangled more effectively. In this context, photo-z estimates could serve either as an additional ML input feature or as a tool to construct cleaner training samples. This, in turn, could pave the way toward future classification methods that require only basic spectral information, such as the width and depth of a single absorption line, to distinguish classes robustly.
8. Outlook
As upcoming large H I absorption surveys with instruments such as MeerKAT (Jonas & MeerKAT Team Reference Jonas2016; Wagenveld et al. Reference Wagenveld2024), the Five hundred meter Aperture Spherical Telescope (FAST, Zhang et al. Reference Zhang2025), and the SKA (Dewdney et al. Reference Dewdney, Hall, Schilizzi and Lazio2009) reach deeper flux density limits, they will open the possibility of probing higher-redshift radio sources, including quasars, down to flux densities of 1 mJy. Already, using our FLASH sample, we tentatively select 1 282 radio quasars in the PICZL redshift range $2 \leq z \leq 4.5$
(see Figure 4). In this regime, spec-z completeness reaches
$2 \leq z \leq 4.5$
(see Figure 4). In this regime, spec-z completeness reaches $\sim$
50% with consistent metrics as discussed in Section 6. Assuming the same survey area and selection efficiency as our FLASH sample, and scaling purely based on the flux density limit, we can estimate the increase in detectable sources using the Euclidean source count scaling
$\sim$
50% with consistent metrics as discussed in Section 6. Assuming the same survey area and selection efficiency as our FLASH sample, and scaling purely based on the flux density limit, we can estimate the increase in detectable sources using the Euclidean source count scaling
 \begin{equation} N(\gt S) \propto S^{\,-\frac{3}{2}}.\end{equation}
This suggests, that SKA could detect roughly 160 times more high-z radio quasars than currently found in our selection when lowering the current flux threshold of 30 mJy down to 1 mJy. We note that this is a conservative, first-order estimate and that more detailed forecasts should account for cosmological evolution of the luminosity function, K-corrections, and the flattening of radio source counts at sub-mJy fluxes.
9. Summary
In this work, we have demonstrated that PICZL, which was developed for eROSITA (see Section 3), can produce accurate photo-zs for radio sources even without prior knowledge of their AGN nature (see Section 4). We estimated redshifts for 45 113 FLASH continuum sources using PICZL applied to LS10 imaging, following the identification of their optical CTPs (see Section 6 and Appendix A). To illustrate the scientific potential of the FLASH survey, we carried out a preliminary multiwavelength analysis, where, among other findings, we determined that roughly 30% of FLASH sources are detected in the deepest eROSITA X-ray data, predominantly corresponding to objects that are bright in both X-ray and radio (see Section 6.1). A substantial fraction of sources, however, are radio-bright but X-ray faint, many of which are likely obscured AGN, as suggested by mid-infrared diagnostics (see Section 6.3). We further explored the potential impact of the cluster environment on the radio properties of FLASH sources (see Section 6.4).
Looking forward, a key challenge for absorption-line science remains the reliable association of background sources with intervening absorbers (see Section 7). We outlined strategies to improve these classifications and provide a glimpse at the future of blind H I absorption surveys (see Section 8). The expanding coverage of FLASH will soon enable more extensive redshift-based studies, unlocking a wide range of science opportunities from AGN demographics and multiwavelength source characterisation to detailed investigations of absorption-line systems.
Acknowledgements
WR and MS acknowledge DLR support (Foerderkennzeichen 50002207). HY was supported by the National Research Foundation of Korea (NRF) grant funded by the Korea government (MSIT, RS-2025-00516062). RLD is supported by the Australian Research Council through the Discovery Early Career Researcher Award (DECRA) Fellowship DE240100136 funded by the Australian Government. This scientific work uses data obtained from Inyarrimanha Ilgari Bundara, the CSIRO Murchison Radio-astronomy Observatory. We acknowledge the Wajarri Yamaji People as the Traditional Owners and native title holders of the Observatory site. CSIRO’s ASKAP radio telescope is part of the Australia Telescope National Facility (https://ror.org/05qajvd42). Operation of ASKAP is funded by the Australian Government with support from the National Collaborative Research Infrastructure Strategy. ASKAP uses the resources of the Pawsey Supercomputing Research Centre. Establishment of ASKAP, Inyarrimanha Ilgari Bundara, the CSIRO Murchison Radio-astronomy Observatory and the Pawsey Supercomputing Research Centre are initiatives of the Australian Government, with support from the Government of Western Australia and the Science and Industry Endowment Fund.
This paper uses data that were obtained by The Legacy Surveys: the Dark Energy Camera Legacy Survey (DECaLS; NOAO Proposal ID# 2014B-0404; PIs: David Schlegel and Arjun Dey), the Beijing-Arizona Sky Survey (BASS; NOAO Proposal ID# 2015A-0801; PIs: Zhou Xu and Xiaohui Fan), and the Mayall z-band Legacy Survey (MzLS; NOAO Proposal ID# 2016A-0453; PI: Arjun Dey). DECaLS, BASS and MzLS together include data obtained, respectively, at the Blanco telescope, Cerro Tololo Inter-American Observatory, National Optical Astronomy Observatory (NOAO); the Bok telescope, Steward Observatory, University of Arizona; and the Mayall telescope, Kitt Peak National Observatory, NOAO. NOAO is operated by the Association of Universities for Research in Astronomy (AURA) under a cooperative agreement with the National Science Foundation. Please see http://legacysurvey.org for details regarding the Legacy Surveys. BASS is a key project of the Telescope Access Program (TAP), which has been funded by the National Astronomical Observatories of China, the Chinese Academy of Sciences (the Strategic Priority Research Program ‘The Emergence of Cosmological Structures’ Grant No. XDB09000000), and the Special Fund for Astronomy from the Ministry of Finance. The BASS is also supported by the External Cooperation Program of Chinese Academy of Sciences (Grant No. 114A11KYSB20160057) and Chinese National Natural Science Foundation (Grant No. 11433005). The Legacy Surveys imaging of the DESI footprint is supported by the Director, Office of Science, Office of High Energy Physics of the U.S. Department of Energy under Contract No. DE-AC02-05CH1123, and by the National Energy Research Scientific Computing Center, a DOE Office of Science User Facility under the same contract; and by the U.S. National Science Foundation, Division of Astronomical Sciences under Contract No.AST-0950945 to the National Optical Astronomy Observatory.
This work is based on data from eROSITA, the soft X-ray instrument aboard SRG, a joint Russian-German science mission supported by the Russian Space Agency (Roskosmos), in the interests of the Russian Academy of Sciences represented by its Space Research Institute (IKI), and the Deutsches Zentrum für Luft- und Raumfahrt (DLR). The SRG spacecraft was built by Lavochkin Association (NPOL) and its subcontractors and is operated by NPOL with support from the Max Planck Institute for Extraterrestrial Physics (MPE). The development and construction of the eROSITA X-ray instrument were led by MPE, with contributions from the Dr. Karl Remeis Observatory Bamberg & ECAP (FAU Erlangen-Nuernberg), the University of Hamburg Observatory, the Leibniz Institute for Astrophysics Potsdam (AIP), and the Institute for Astronomy and Astrophysics of the University of Tübingen, with the support of DLR and the Max Planck Society. The Argelander Institute for Astronomy of the University of Bonn and the Ludwig Maximilians Universität Munich also participated in the science preparation for eROSITA.
The Legacy Surveys consist of three individual and complementary projects: the Dark Energy Camera Legacy Survey (DECaLS; Proposal ID 2014B-0404; PIs: David Schlegel and Arjun Dey), the Beijing-Arizona Sky Survey (BASS; NOAO Prop. ID 2015A-0801; PIs: Zhou Xu and Xiaohui Fan), and the Mayall z-band Legacy Survey (MzLS; Prop. ID 2016A-0453; PI: Arjun Dey). DECaLS, BASS, and MzLS together include data obtained, respectively, at the Blanco telescope, Cerro Tololo Inter-American Observatory, NSF’s NOIRLab; the Bok telescope, Steward Observatory, University of Arizona; and the Mayall telescope, Kitt Peak National Observatory, NOIRLab. Pipeline processing and analyses of the data were supported by NOIRLab and the Lawrence Berkeley National Laboratory (LBNL). The Legacy Surveys project is honored to be permitted to conduct astronomical research on Iolkam Du’ag (Kitt Peak), a mountain with particular significance to the Tohono O’odham Nation. NOIRLab is operated by the Association of Universities for Research in Astronomy (AURA) under a cooperative agreement with the National Science Foundation. LBNL is managed by the Regents of the University of California under contract to the U.S. Department of Energy.
This project used data obtained with the Dark Energy Camera (DECam), which was constructed by the Dark Energy Survey (DES) collaboration. Funding for the DES Projects has been provided by the U.S. Department of Energy, the U.S. National Science Foundation, the Ministry of Science and Education of Spain, the Science and Technology Facilities Council of the United Kingdom, the Higher Education Funding Council for England, the National Center for Supercomputing Applications at the University of Illinois at Urbana-Champaign, the Kavli Institute of Cosmological Physics at the University of Chicago, Center for Cosmology and Astro-Particle Physics at the Ohio State University, the Mitchell Institute for Fundamental Physics and Astronomy at Texas A & M University, Financiadora de Estudos e Projetos, Fundacao Carlos Chagas Filho de Amparo, Financiadora de Estudos e Projetos, Fundacao Carlos Chagas Filho de Amparo a Pesquisa do Estado do Rio de Janeiro, Conselho Nacional de Desenvolvimento Cientifico e Tecnologico and the Ministerio da Ciencia, Tecnologia e Inovacao, the Deutsche Forschungsgemeinschaft and the Collaborating Institutions in the Dark Energy Survey. The Collaborating Institutions are Argonne National Laboratory, the University of California at Santa Cruz, the University of Cambridge, Centro de Investigaciones Energeticas, Medioambientales y Tecnologicas-Madrid, the University of Chicago, University College London, the DES-Brazil Consortium, the University of Edinburgh, the Eidgenossische Technische Hochschule (ETH) Zurich, Fermi National Accelerator Laboratory, the University of Illinois at Urbana-Champaign, the Institut de Ciencies de l’Espai (IEEC/CSIC), the Institut de Fisica d’Altes Energies, Lawrence Berkeley National Laboratory, the Ludwig Maximilians Universitat Munchen and the associated Excellence Cluster Universe, the University of Michigan, NSF’s NOIRLab, the University of Nottingham, the Ohio State University, the University of Pennsylvania, the University of Portsmouth, SLAC National Accelerator Laboratory, Stanford University, the University of Sussex, and Texas A&M University.
BASS is a key project of the Telescope Access Program (TAP), which has been funded by the National Astronomical Observatories of China, the Chinese Academy of Sciences (the Strategic Priority Research Program ‘The Emergence of Cosmological Structures’ Grant # XDB09000000), and the Special Fund for Astronomy from the Ministry of Finance. The BASS is also supported by the External Cooperation Program of Chinese Academy of Sciences (Grant # 114A11KYSB20160057), and Chinese National Natural Science Foundation (Grant # 12120101003, # 11433005). The Legacy Survey team uses data products from the Near-Earth Object Wide-field Infrared Survey Explorer (NEOWISE), a project of the Jet Propulsion Laboratory/California Institute of Technology. NEOWISE is funded by the National Aeronautics and Space Administration. The Legacy Surveys imaging of the DESI footprint is supported by the Director, Office of Science, Office of High Energy Physics of the U.S. Department of Energy under Contract No. DE-AC02-05CH1123, by the National Energy Research Scientific Computing Center, a DOE Office of Science User Facility under the same contract, and by the U.S. National Science Foundation, Division of Astronomical Sciences under Contract No. AST-0950945 to NOAO.
Data availability statement
With this paper, we present a catalogue of photo-zs derived using PICZL for the subset of FLASH continuum sources presented in this work that are cross-matched to LS10. A simplified description of the catalogue is given in Appendix C. The full catalogue (including column description) is available at CDS via anonymous ftp to cdsarc.u-strasbg.fr (130.79.128.5) or via https://cdsarc.cds.unistra.fr/viz-bin/cat/J/other/PASA.
Appendix A. Optical cross-matching
We determine optical CTPs for FLASH continuum sources using the Bayesian cross-matching tool NWAY (Salvato et al. Reference Salvato2018), which combines astrometric information with photometric priors to improve the reliability of associations. In NWAY, such priors are typically constructed by training a random forest model to distinguish the target source population, e.g. radio emitting objects, from the general field population (Salvato et al. Reference Salvato2022; Euclid Collaboration: Roster et al. 2025; Salvato et al. Reference Salvato2025). Because the FLASH sample is currently too small to construct a robust training set of its own, we adopt an existing radio prior built from secure, optically matched sources in the Rapid ASKAP Continuum Survey (RACS, McConnell et al. Reference McConnell2020; Hale et al. Reference Hale2021), based on the RACS-low observations at $S = 888$
–
$S = 888$
– $943.5\,\mathrm{MHz}$
, approximately matching the observing frequency of FLASH. Using this prior, we run NWAY on all selected FLASH continuum sources and identify, within 10 arcsec, their most probable optical CTPs in LS10 (Salvato et al. Reference Salvato2025). To validate this approach, we compare the FLASH-based CTPs with those obtained by running NWAY on RACS sources in the area jointly covered by LS10 and the footprint of eROSITA. For sources where the FLASH and RACS positions agree within 3 arcsec (
$943.5\,\mathrm{MHz}$
, approximately matching the observing frequency of FLASH. Using this prior, we run NWAY on all selected FLASH continuum sources and identify, within 10 arcsec, their most probable optical CTPs in LS10 (Salvato et al. Reference Salvato2025). To validate this approach, we compare the FLASH-based CTPs with those obtained by running NWAY on RACS sources in the area jointly covered by LS10 and the footprint of eROSITA. For sources where the FLASH and RACS positions agree within 3 arcsec ( $\gt$
99%), we find a CTP match rate exceeding 90%, which demonstrates the reliability of the adopted prior. The remaining mismatches are most likely attributable to the substantially larger matching radius (1 arcmin) used in the RACS-based NWAY associations.
$\gt$
99%), we find a CTP match rate exceeding 90%, which demonstrates the reliability of the adopted prior. The remaining mismatches are most likely attributable to the substantially larger matching radius (1 arcmin) used in the RACS-based NWAY associations.
The final catalogue comprises 45 113 unique FLASH continuum sources with optical CTPs in LS10. Among these, 6 305 cases correspond to instances where multiple FLASH entries (with distinct source IDs) are associated with the same optical CTP. This duplication arises primarily from the FLASH observing strategy, in which each field assigns unique identifiers independently. As a result, overlapping fields can register the same astrophysical source multiple times under different IDs. To mitigate this, we examined all multi-entry groups, where for groups of two sources, we retained a single entry when their angular separation was less than 5 arcsec (accounting for 99% of such cases). For groups with three or four members, all entries originated from distinct FLASH fields, and we likewise retained only one representative per group. This leaves us with a sample of $\sim$
38 600 unique FLASH CTPs. Approximately 2800 FLASH continuum sources remain without a CTP candidate entirely,
$\sim$
38 600 unique FLASH CTPs. Approximately 2800 FLASH continuum sources remain without a CTP candidate entirely, $\sim$
75% of which lie within the Galactic plane where LS10 coverage is absent. The locations of the remaining sources are covered either by one (654) or all (473) Legacy bands, most of which are likely to be genuine ‘blank fields’ where the optical CTPs are too faint to be visible in LS10 images, suggesting radio galaxies at
$\sim$
75% of which lie within the Galactic plane where LS10 coverage is absent. The locations of the remaining sources are covered either by one (654) or all (473) Legacy bands, most of which are likely to be genuine ‘blank fields’ where the optical CTPs are too faint to be visible in LS10 images, suggesting radio galaxies at $z \gtrsim 1$
, as AGN-related processes (e.g. jets) can be radio-bright but optically/UV faint (Kondapally et al. Reference Kondapally2021). In CENSORS, which has complete redshift coverage for a flux-limited radio sample (
$z \gtrsim 1$
, as AGN-related processes (e.g. jets) can be radio-bright but optically/UV faint (Kondapally et al. Reference Kondapally2021). In CENSORS, which has complete redshift coverage for a flux-limited radio sample ( $\gt$
$\gt$ $7.5\,\textrm{mJy at}\,1.4\, \textrm{GHz}$
), roughly 30% of the sources have
$7.5\,\textrm{mJy at}\,1.4\, \textrm{GHz}$
), roughly 30% of the sources have $z \geq 1.5$
, and about 65% of these have optical CTPs too faint to be detected in LS10. As a result, we expect
$z \geq 1.5$
, and about 65% of these have optical CTPs too faint to be detected in LS10. As a result, we expect $\sim$
20% of FLASH continuum sources to have no visible optical CTP in LS10. A
$\sim$
20% of FLASH continuum sources to have no visible optical CTP in LS10. A
Other reasons why an optical CTP could not be identified include: (1) proximity to the Small or Large Magellanic Clouds, where LS10 entries are limited to brighter sources identified by Gaia (Gaia Collaboration et al. Reference Collaboration2016); (2) incomplete coverage in the redder LS10 bands; (3) edge effects near the LS10 footprint boundaries; (4) regions affected by bright star saturation and other imaging artefacts and (5) significant radio–optical positional offsets. The latter cannot be reliably addressed by simply enlarging the matching radius, as this would increase the risk of false associations. In fact, when restricting the search radius in NWAY to 3 arcsec, only $\sim$
33 500 CTPs remain, with fewer than 5% of these switching their primary match, presumably because the true CTP lies outside this radius.
$\sim$
33 500 CTPs remain, with fewer than 5% of these switching their primary match, presumably because the true CTP lies outside this radius.
To robustly estimate the fraction of radio galaxies at $z \gtrsim 1$
, it is essential to quantify the rate of chance associations and assess the reliability of low-probability CTP candidates within the adopted search radius. To this end, we repeated the matching procedure for a control sample of FLASH continuum sources whose sky coordinates were artificially shifted, thereby representing random associations. The resulting cumulative distributions of the CTP identification probability (p_any) for both the real and shifted samples yield the purity–completeness relation as a function of p_any, shown in the lower panel of Figure A1. By maximising both quantities simultaneously, we find that adopting a lower threshold of p_any
$z \gtrsim 1$
, it is essential to quantify the rate of chance associations and assess the reliability of low-probability CTP candidates within the adopted search radius. To this end, we repeated the matching procedure for a control sample of FLASH continuum sources whose sky coordinates were artificially shifted, thereby representing random associations. The resulting cumulative distributions of the CTP identification probability (p_any) for both the real and shifted samples yield the purity–completeness relation as a function of p_any, shown in the lower panel of Figure A1. By maximising both quantities simultaneously, we find that adopting a lower threshold of p_any $\sim 0.3$
achieves roughly 80% purity and completeness, corresponding to an estimated chance-association rate of
$\sim 0.3$
achieves roughly 80% purity and completeness, corresponding to an estimated chance-association rate of $\sim$
20%. As illustrated in the upper panel of Figure A1, this threshold also naturally limits the radio–optical positional offsets to to a maximum of 6 arcsec for sources with a high probability of being a radio emitter according to the RACS-based prior. Consequently, throughout the remainder of this work we restrict our analysis to CTP associations with p_any
$\sim$
20%. As illustrated in the upper panel of Figure A1, this threshold also naturally limits the radio–optical positional offsets to to a maximum of 6 arcsec for sources with a high probability of being a radio emitter according to the RACS-based prior. Consequently, throughout the remainder of this work we restrict our analysis to CTP associations with p_any $ \ge 0.292$
that are detected in all LS10 optical bands, yielding a final sample of approximately 27 500 CTPs.
$ \ge 0.292$
that are detected in all LS10 optical bands, yielding a final sample of approximately 27 500 CTPs.
Top: Radio–optical separation as a function of association probability (p_any) for all candidate counterparts, colour-coded by the probability of being a radio emitter. Bottom: Cumulative purity and completeness curves as a function of p_any. The intersection point at $\textrm{p_any} \approx 0.29$
(black triangle) marks the optimal balance between purity and completeness (
$\textrm{p_any} \approx 0.29$
(black triangle) marks the optimal balance between purity and completeness ( $\sim$
80%).
$\sim$
80%).

Appendix B. Radio AGN diagnostics
Two commonly used approaches to identify AGN in the radio regime are based on RL and radio-excess (REX), where each method probes emission ratios as a tracer of different underlying physical properties (Yun, Reddy, & Condon Reference Yun, Reddy and Condon2001; Del Moro et al. Reference Del Moro2013; Drake et al. Reference Drake2024; Mazzolari et al. Reference Mazzolari2026). The RL parameter is traditionally defined as
 \begin{equation} \mathrm{RL} = \frac{{f}_{\mathrm{radio}}}{{f}_{\mathrm{optical}}}\end{equation}
and is designed to identify AGN whose emission is dominated by relativistic jets in the radio compared to the optical produced by the accretion disk or host galaxy (Kellermann.et al. Reference Kellermann, Condon, Kimball, Perley and Ivezić2016). This diagnostic is therefore most sensitive to separating AGN into RL and RQ classes within an already AGN-dominated population. However, it is less effective in discriminating AGN from SFGs, since the observed optical emission must not necessarily be linked to the processes responsible for SF-related radio emission. By contrast, the REX approach attempts to disentangle AGN from SFGs, by comparing the observed radio luminosity with the expected contribution from SF processes (Donley et al. Reference Donley, Rieke, Rigby and Pérez-González2005; Panessa et al. Reference Panessa2019; Igo et al. Reference Igo2024). This usually requires a reliable estimate of the star formation rate (SFR) and consequently the associated radio emission. In practice, this is often achieved through SED template fitting, where the host galaxy’s SF radio component is modelled and subtracted to estimate an AGN radio excess. However, template fitting carries its own uncertainties, particularly if the underlying SF history, dust attenuation, or non-thermal emission processes are poorly constrained. Alternatively, following the definition of
 \begin{equation} \log L_{144\, \mathrm{MHz}} = 14 - \frac{M_{W3}}{2.5}\end{equation}
from Hardcastle et al. (Reference Hardcastle2025) to separate AGN and SFGs, we retrieve an AGN fraction that exceeds 99.5%, suggesting that contamination from SFGs in our sample is negligible. Another widely used empirical proxy for estimating the expected radio luminosity from SF is the far-IR (FIR)–radio correlation (FIRC, Helou, Soifer, & Rowan-Robinson Reference Helou, Soifer and Rowan-Robinson1985; Condon Reference Condon1992; Delhaize et al. Reference Delhaize2017). This relation connects the FIR emission from dust heated by young stars with the synchrotron emission from supernova-driven cosmic rays, both of which trace recent SF. This method has the advantage of physically removing SFG contaminants from an otherwise mixed population, though it depends critically on the availability and validity of the FIR–radio relation at the redshift and luminosity regime in question (Wang et al. Reference Wang2024). A more simplified method for identifying radio AGN is therefore to select sources whose radio emission exceeds the level expected from SF alone. Recent deep studies (e.g. Wang et al. Reference Wang2024) place the cross-over luminosity L, i.e. the threshold beyond which the number density of radio AGN surpasses that of SFGs, at $L_{1.4\,\mathrm{GHz}}\gtrsim10^{23}$
W Hz
$L_{1.4\,\mathrm{GHz}}\gtrsim10^{23}$
W Hz $^{-1}$
at
$^{-1}$
at $z \sim 0$
, rising with redshift up to
$z \sim 0$
, rising with redshift up to $L_{1.4\,\mathrm{GHz}}\gtrsim10^{25}$
W Hz
$L_{1.4\,\mathrm{GHz}}\gtrsim10^{25}$
W Hz $^{-1}$
by
$^{-1}$
by $z \sim 4$
(refer to Figure 6). Although many radio sources appear to have a power-law dominated SED across a broad range of radio frequencies, the slope of this power-law may be either ‘steep’ or ‘flat’ and some sources show more complex behaviour with spectral peaks or troughs (see e.g. de Zotti et al. Reference de Zotti, Massardi, Negrello and Wall2010; Kerrison et al. Reference Kerrison, Allison, Moss, Sadler and Rees2024). As a result, measurements made at one radio frequency cannot typically be reliably extrapolated to frequencies that are significantly higher or lower. However, to quantify the intrinsic radio power of our sources, we calculate their radio luminosities following the standard convention:
$z \sim 4$
(refer to Figure 6). Although many radio sources appear to have a power-law dominated SED across a broad range of radio frequencies, the slope of this power-law may be either ‘steep’ or ‘flat’ and some sources show more complex behaviour with spectral peaks or troughs (see e.g. de Zotti et al. Reference de Zotti, Massardi, Negrello and Wall2010; Kerrison et al. Reference Kerrison, Allison, Moss, Sadler and Rees2024). As a result, measurements made at one radio frequency cannot typically be reliably extrapolated to frequencies that are significantly higher or lower. However, to quantify the intrinsic radio power of our sources, we calculate their radio luminosities following the standard convention:
 \begin{equation} L_{856\,\mathrm{MHz}}\,[{{W}\, \mathrm{Hz}^{-1}}] = 4 {\pi} \, d^{2}_{L} \, S_{\nu} \, 10^{-30} \, (1+z)^{\alpha -1},\end{equation}
where $d_{L}$
is the luminosity distance in cm,
$d_{L}$
is the luminosity distance in cm, $S_{\nu}$
is the total integrated flux in units of Jansky (Jy) and
$S_{\nu}$
is the total integrated flux in units of Jansky (Jy) and $(1+z)^{\alpha -1}$
is the K-correction, assuming a radio spectral index
$(1+z)^{\alpha -1}$
is the K-correction, assuming a radio spectral index $\alpha = 0.7$
(Condon Reference Condon1992). Given
$\alpha = 0.7$
(Condon Reference Condon1992). Given $\alpha$
, we can convert
$\alpha$
, we can convert $L_{856\mathrm{MHz}}$
into the more conventionally used
$L_{856\mathrm{MHz}}$
into the more conventionally used $L_{1.4\,\mathrm{GHz}}$
by
$L_{1.4\,\mathrm{GHz}}$
by
 \begin{equation} L_{1.4\,\mathrm{GHz}} = L_{856\,\mathrm{MHz}} \bigg (\frac{1.4}{0.856}\bigg )^{-\alpha}.\end{equation}
Appendix C. Catalogue column description
-
1. FLASH_COMPONENT_ID: Unique source ID assigned to each FLASH source
-
2. FLASH_SBID: FLASH field ID
-
3. Columns 3–4: ASKAP-FLASH coordinates and respective positional uncertainty
-
4. Columns 5–7: ASKAP-FLASH peak and integrated fluxes
-
5. Columns 8–10: Binary flag indicating the (number of) repeated entries of a source and the maximum group separation due to observations of overlapping fields
-
6. LS10_FULLID: Unique LS10 source ID assigned to optical counterpart. It is created by concatenating the LS10 coloumns RELEASE, BRICKID and OBJID.
-
7. Columns 12–13: Right Ascension and Declination in degrees of the LS10 optical counterpart
-
8. Columns 14–15: Binary flags indicating the observation of an LS10 source in all or any of the optical g,r,i,z bands
-
9. LS10_type: LS10 morphological classificationFootnote g
-
10. Columns 17–24: LS10 fluxes divided by Milky Way transmission
-
11. LS10_snr: Binary flag indicating whether the signal to noise ratio is
$\lt$
3 for any of the optical g,r,i,z
-
12. Columns 26–34: NWAY output as presented in the Appendix of Salvato et al. (Reference Salvato2018)
-
13. Columns 35–36: LS10 counterpart sample purity and completeness evaluated at p_any per source
-
14. PICZL_z_phot: PICZL photo-z estimate (most prominent PDF mode)
-
15. PICZL_pdf_degeneracy: Classification of photo-z PDF degeneracy based on the presence, prominence, and separation of (one or more) secondary peaks relative to the primary PDF peak. Values range from ‘none’ (single-peaked PDFs) through ‘light’ and ‘medium’, to ‘strong’ degeneracy
-
16. PICZL_secondary_peak_PSF: Secondary peak at
$z_{\mathrm{phot}} \lt 1.5$
for sources of non-PSF type where
$z_{\mathrm{phot}} \gt 1.5$
when available -
17. PICZL_secondary_peak_high_z: Secondary peak at
$z_{\mathrm{phot}} \lt 2$
for sources of any type where
$z_{\mathrm{phot}} \gt 2$
when available -
18. PICZL_best_z_phot: Item 16 when available for sources with
$z_{\mathrm{phot}} \gt 1.5$
, otherwise Item 17 for sources with
$z_{\mathrm{phot}} \gt 4.7$
when available -
19. Columns 42–43: upper and lower
$1 \sigma$
errors, defined as the highest posterior density (HPD) interval -
20. PICZL_multi_peak_errors: Binary flag indicating whether the
$1 \sigma$
error HPD interval spans multiple peaks.


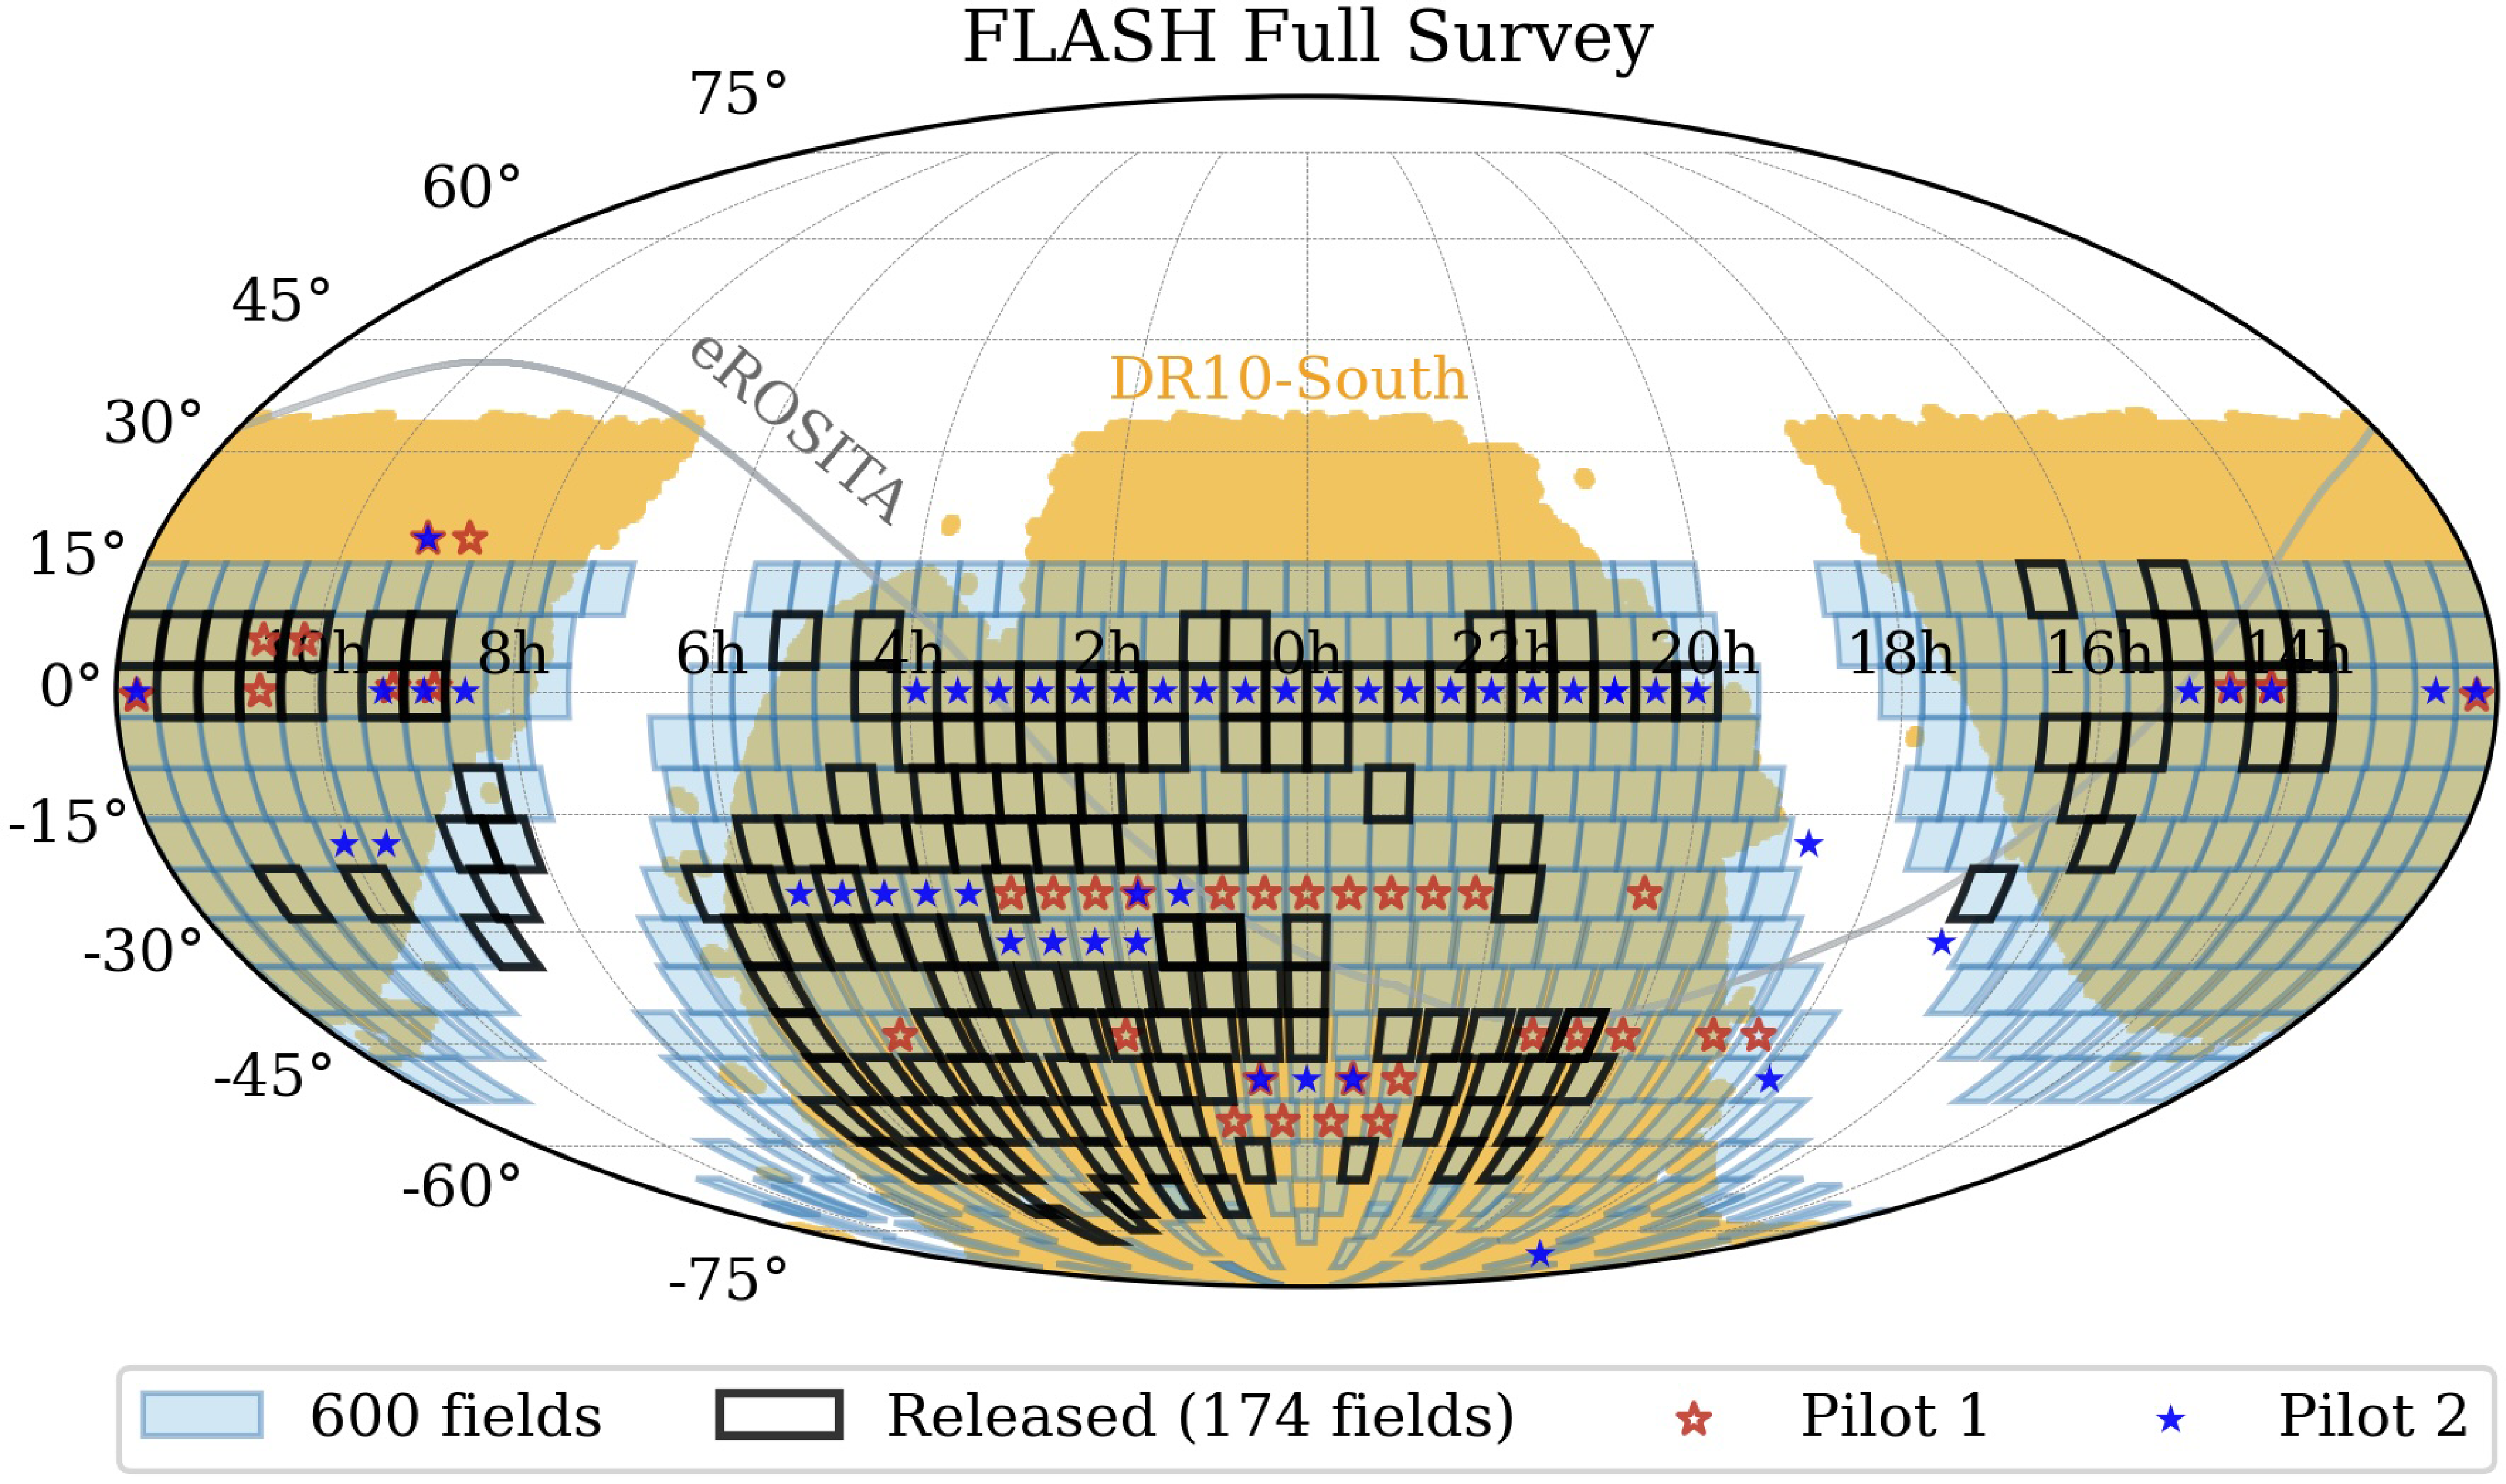
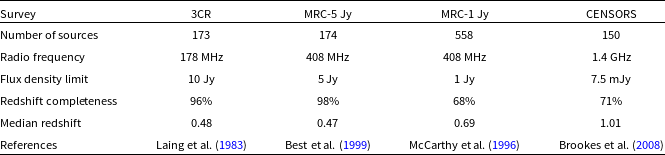
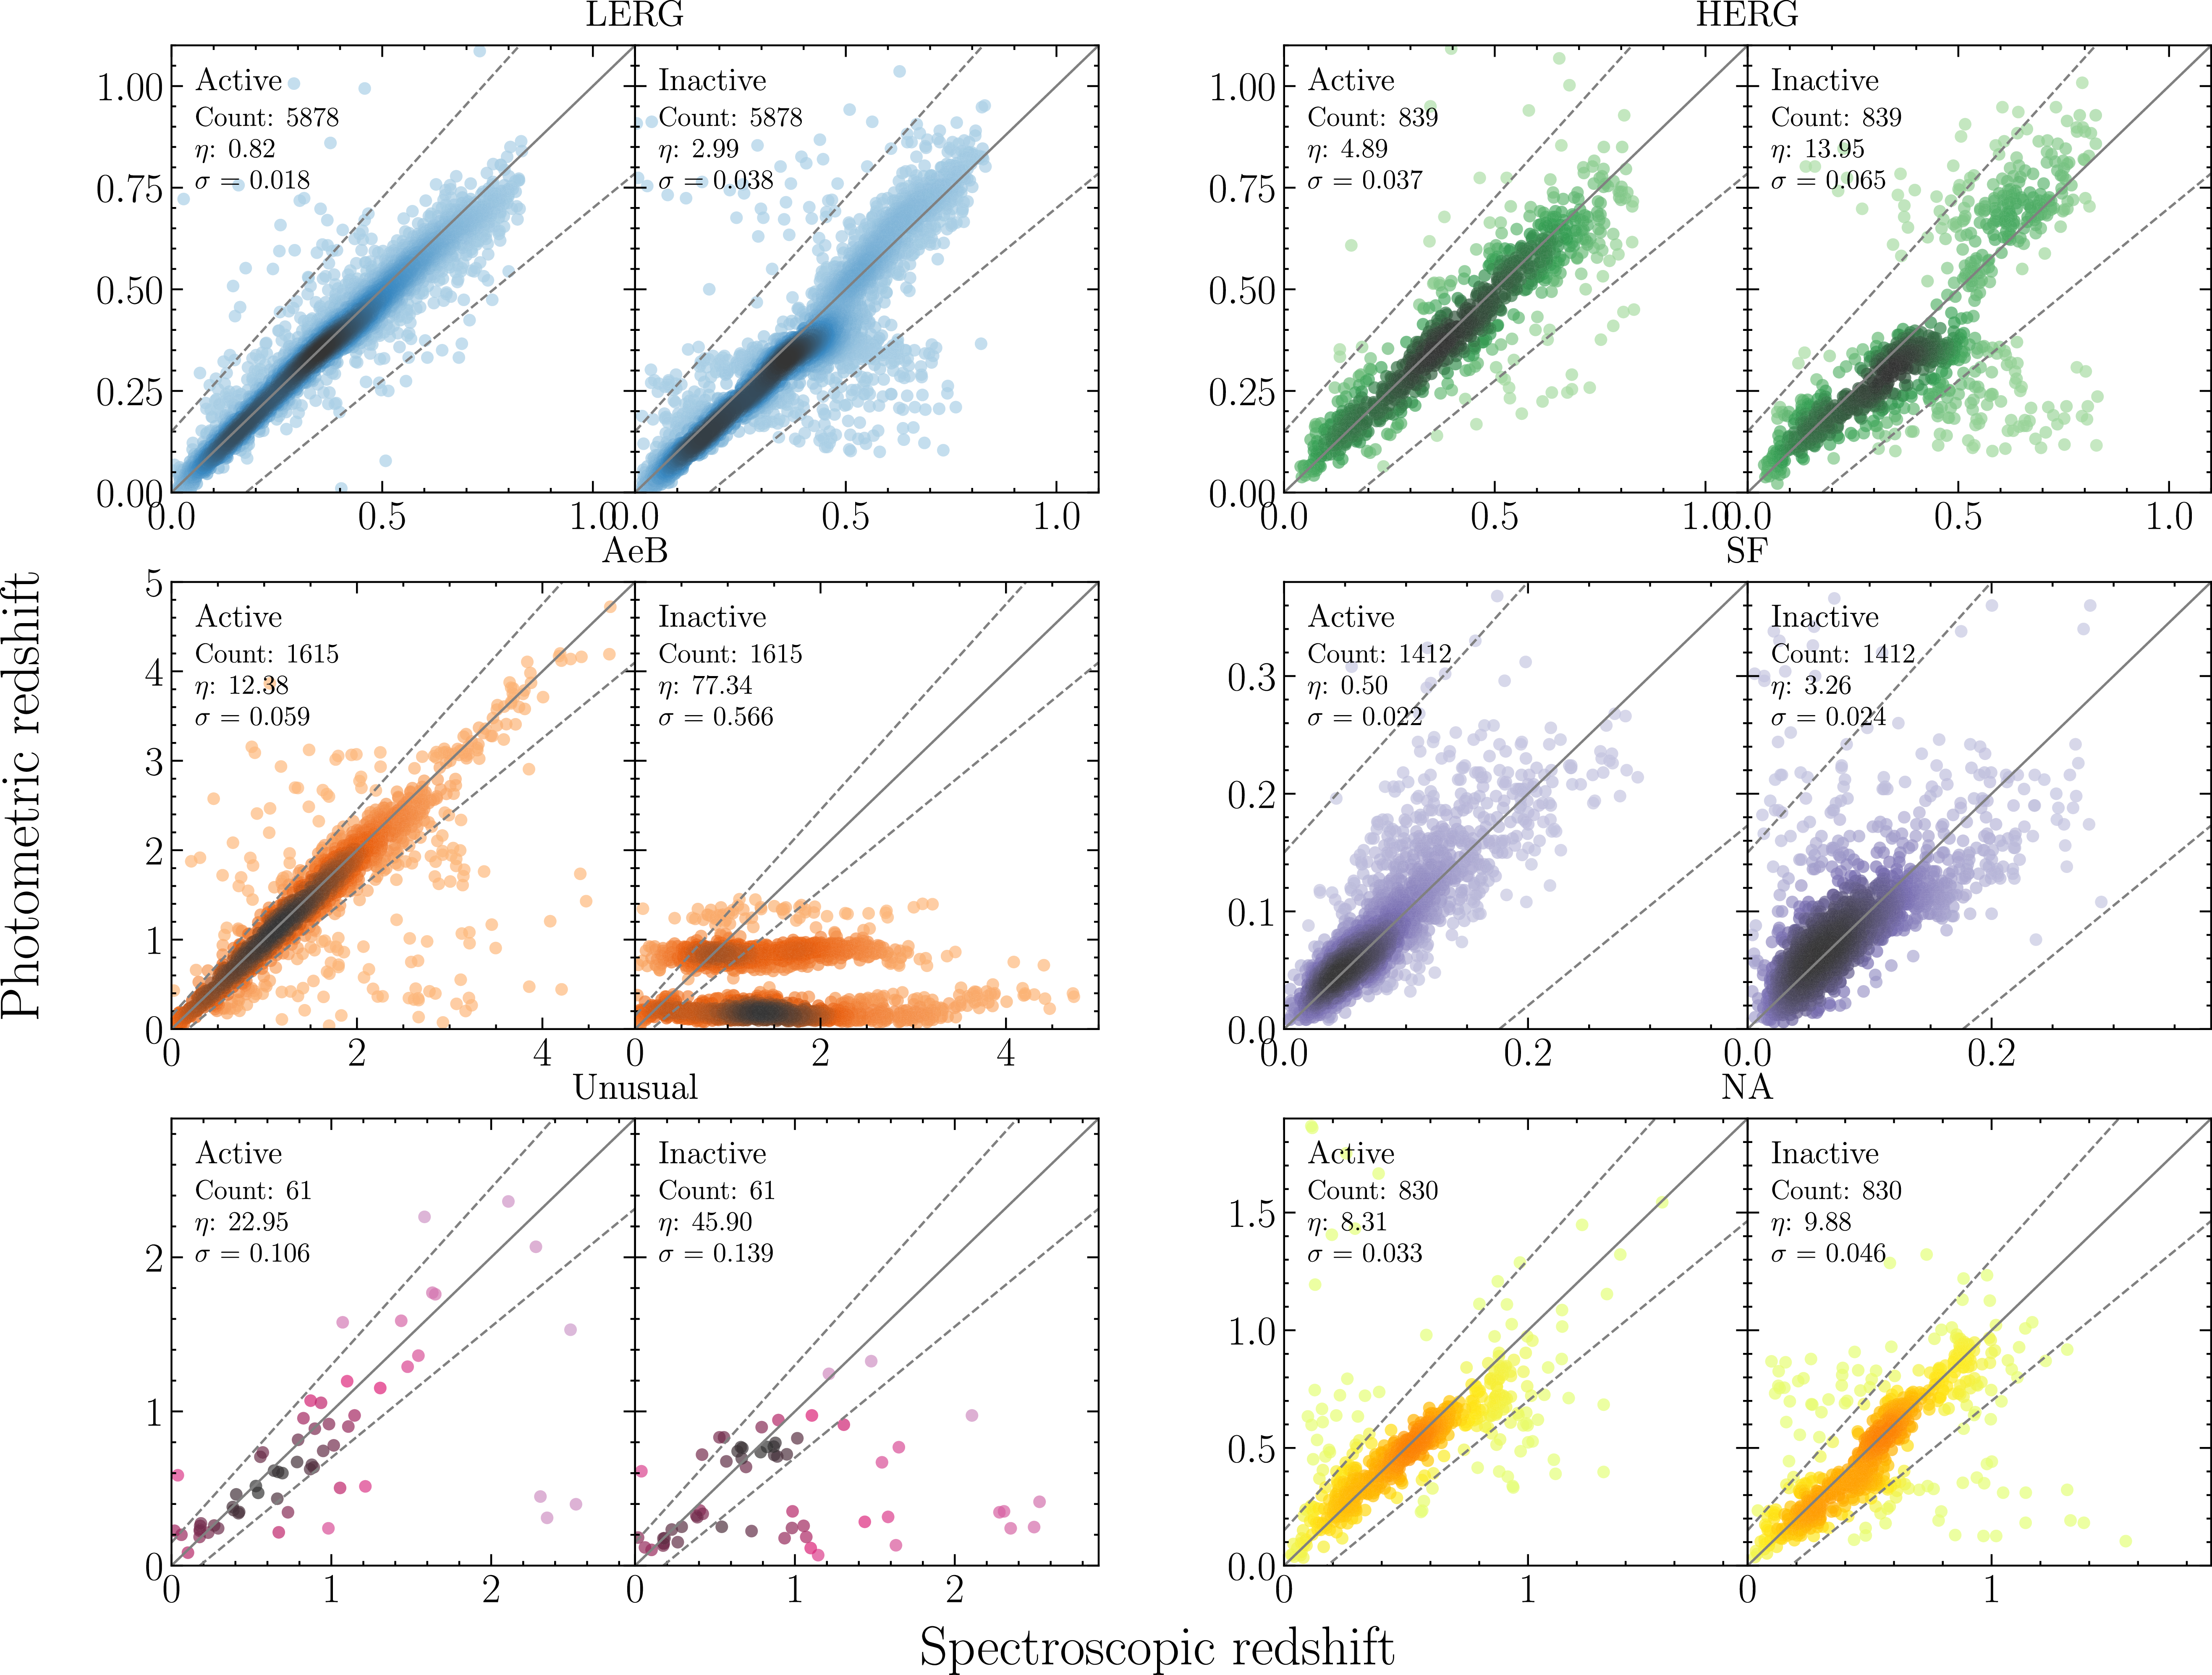


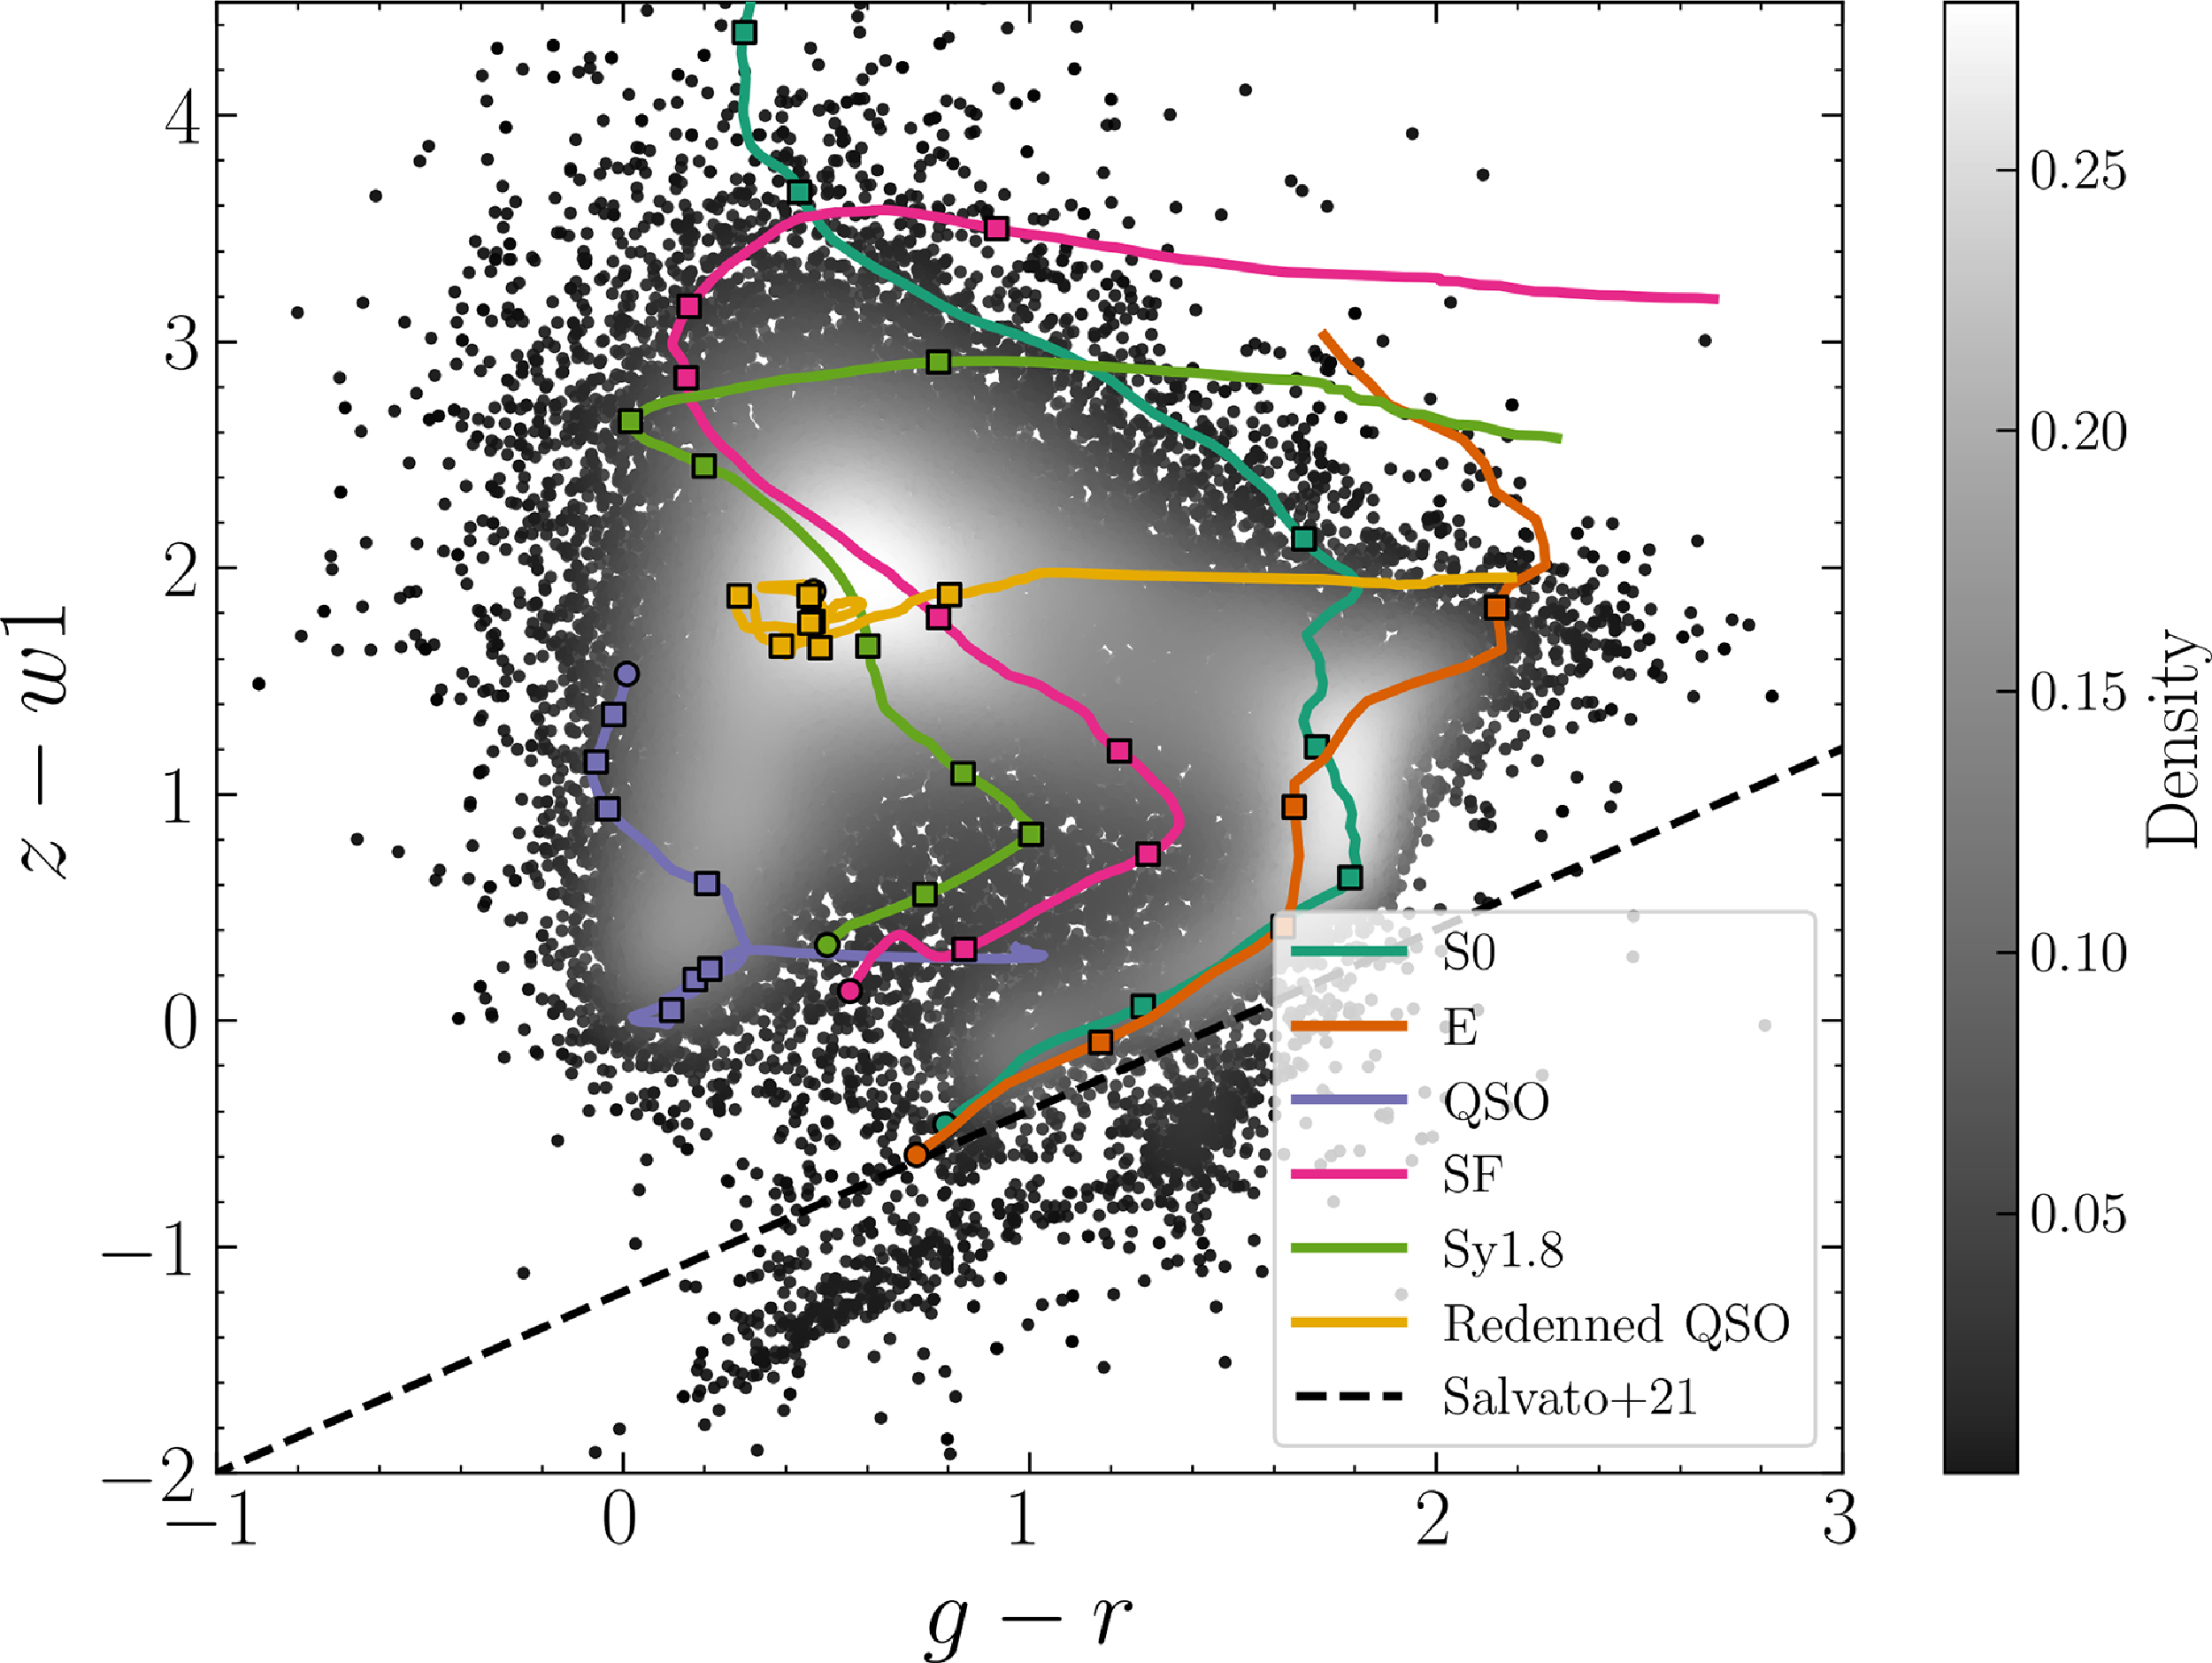


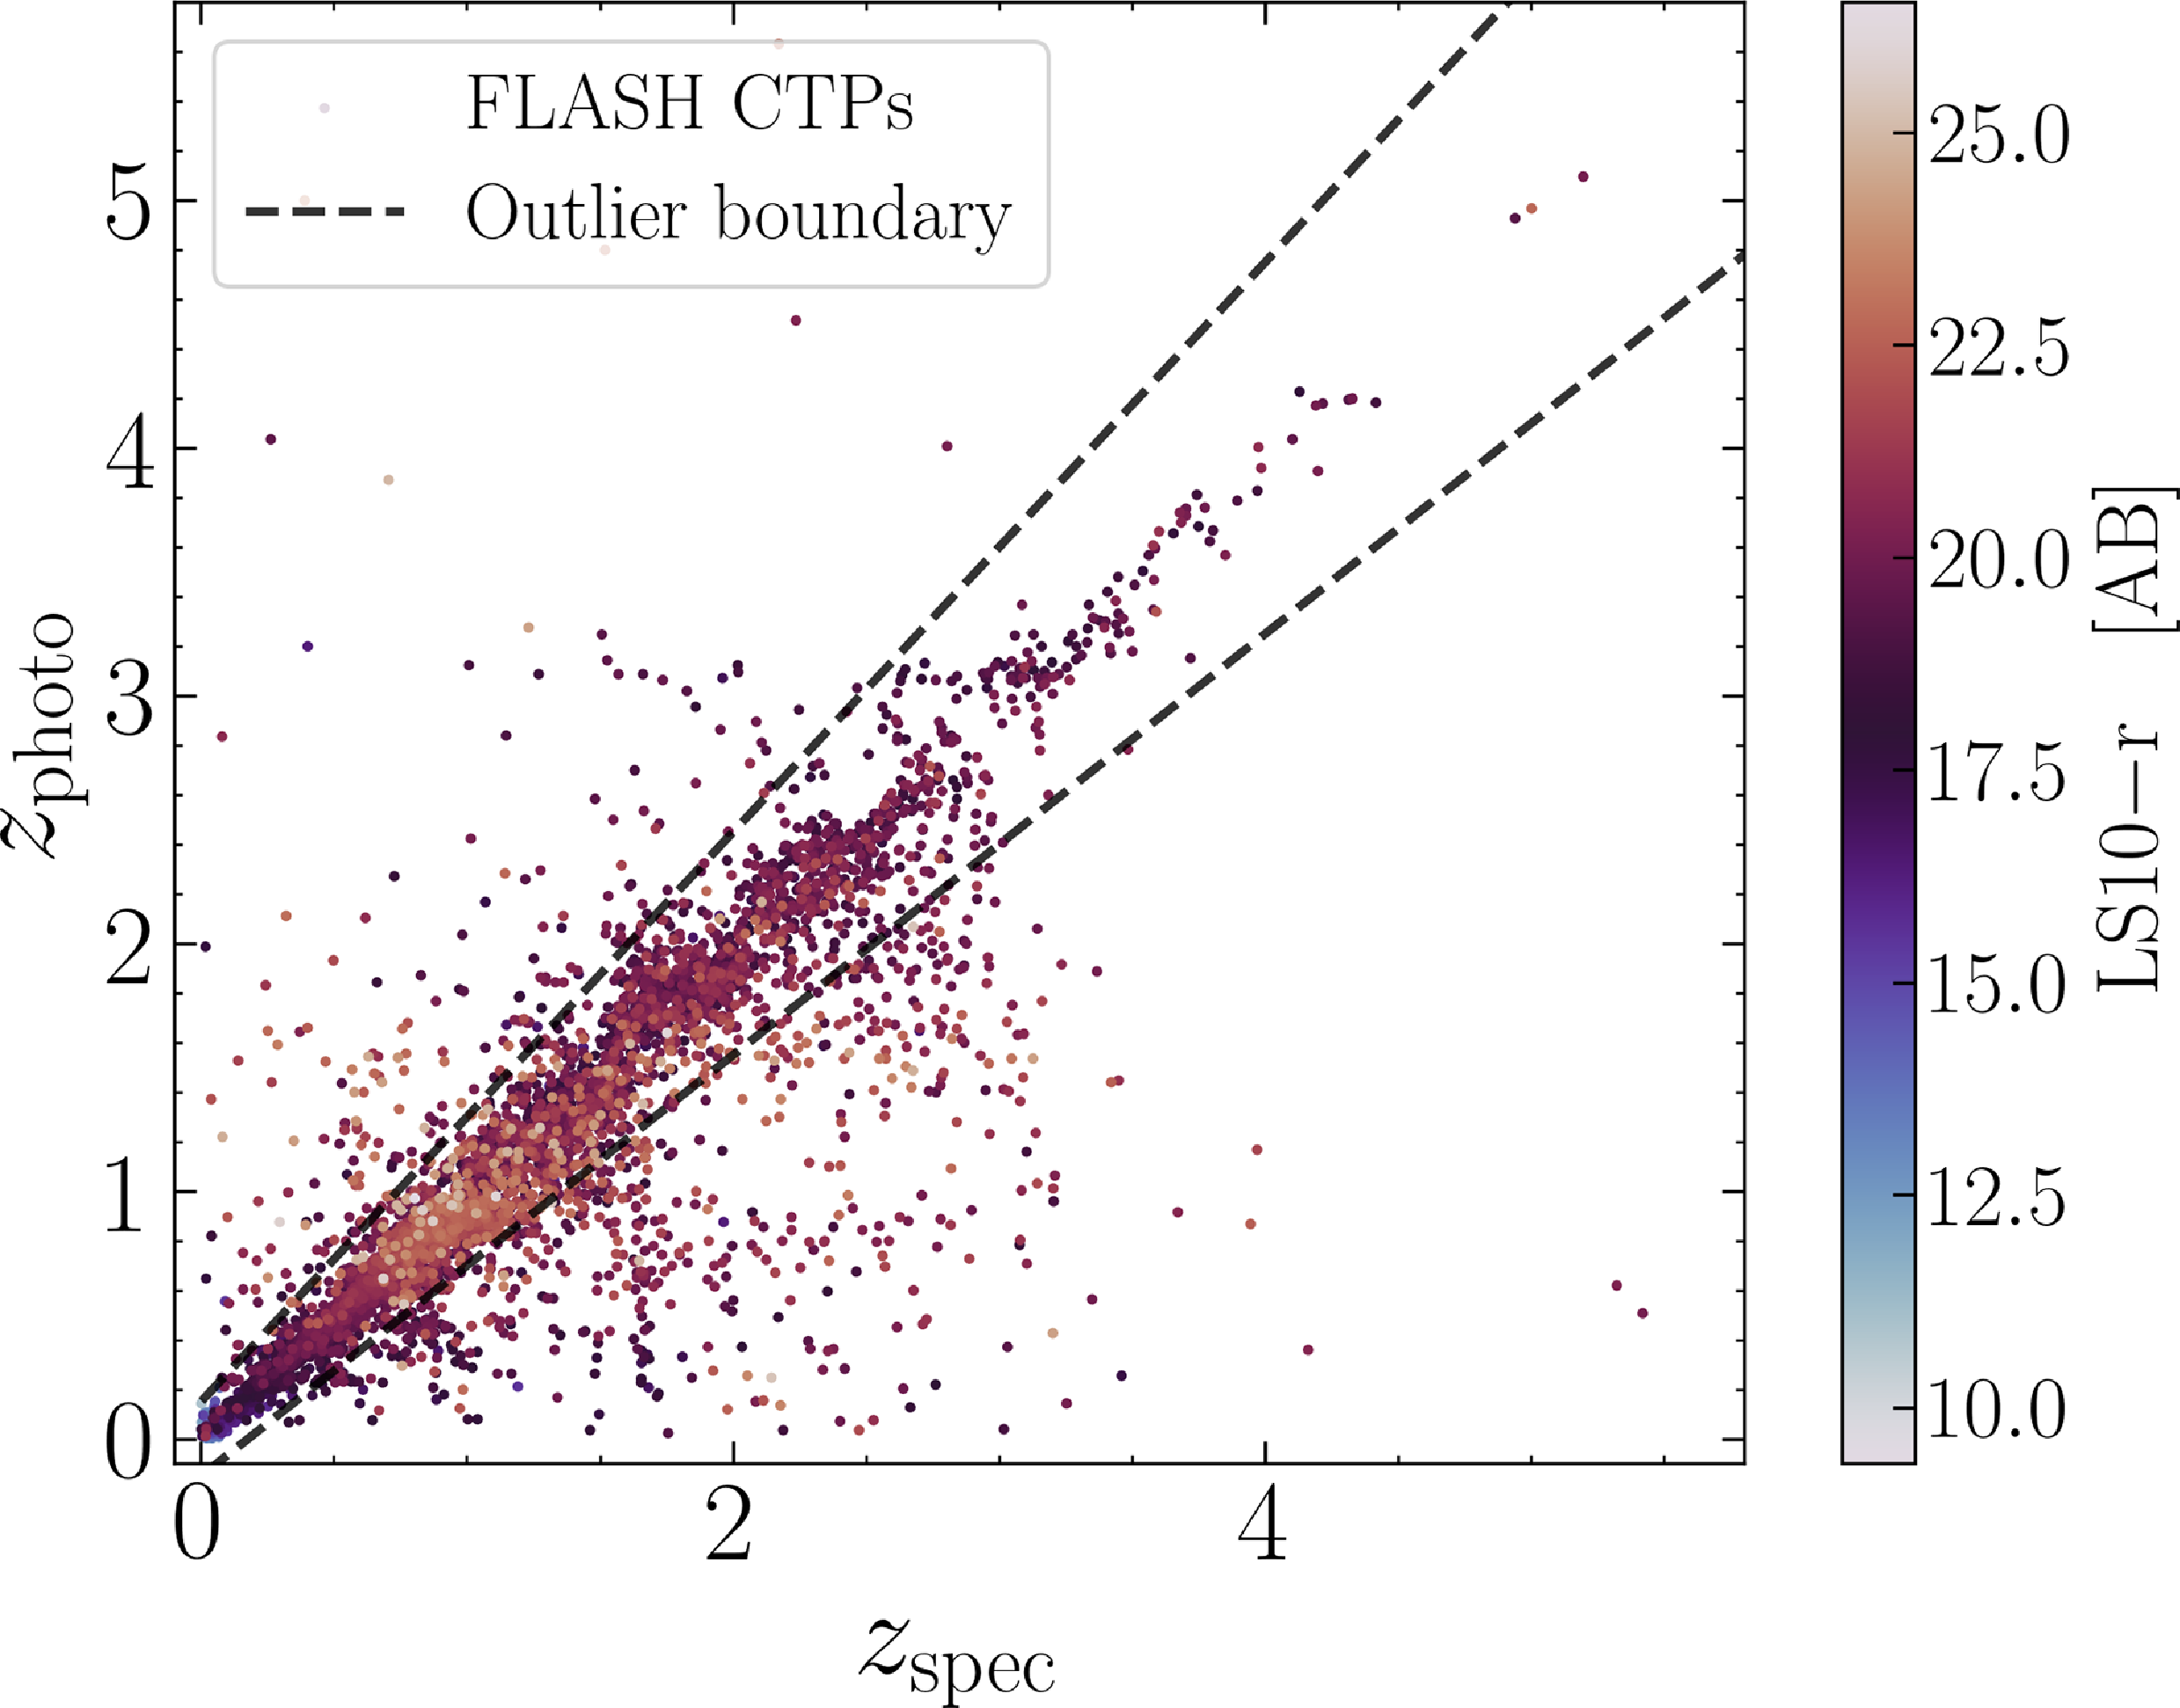

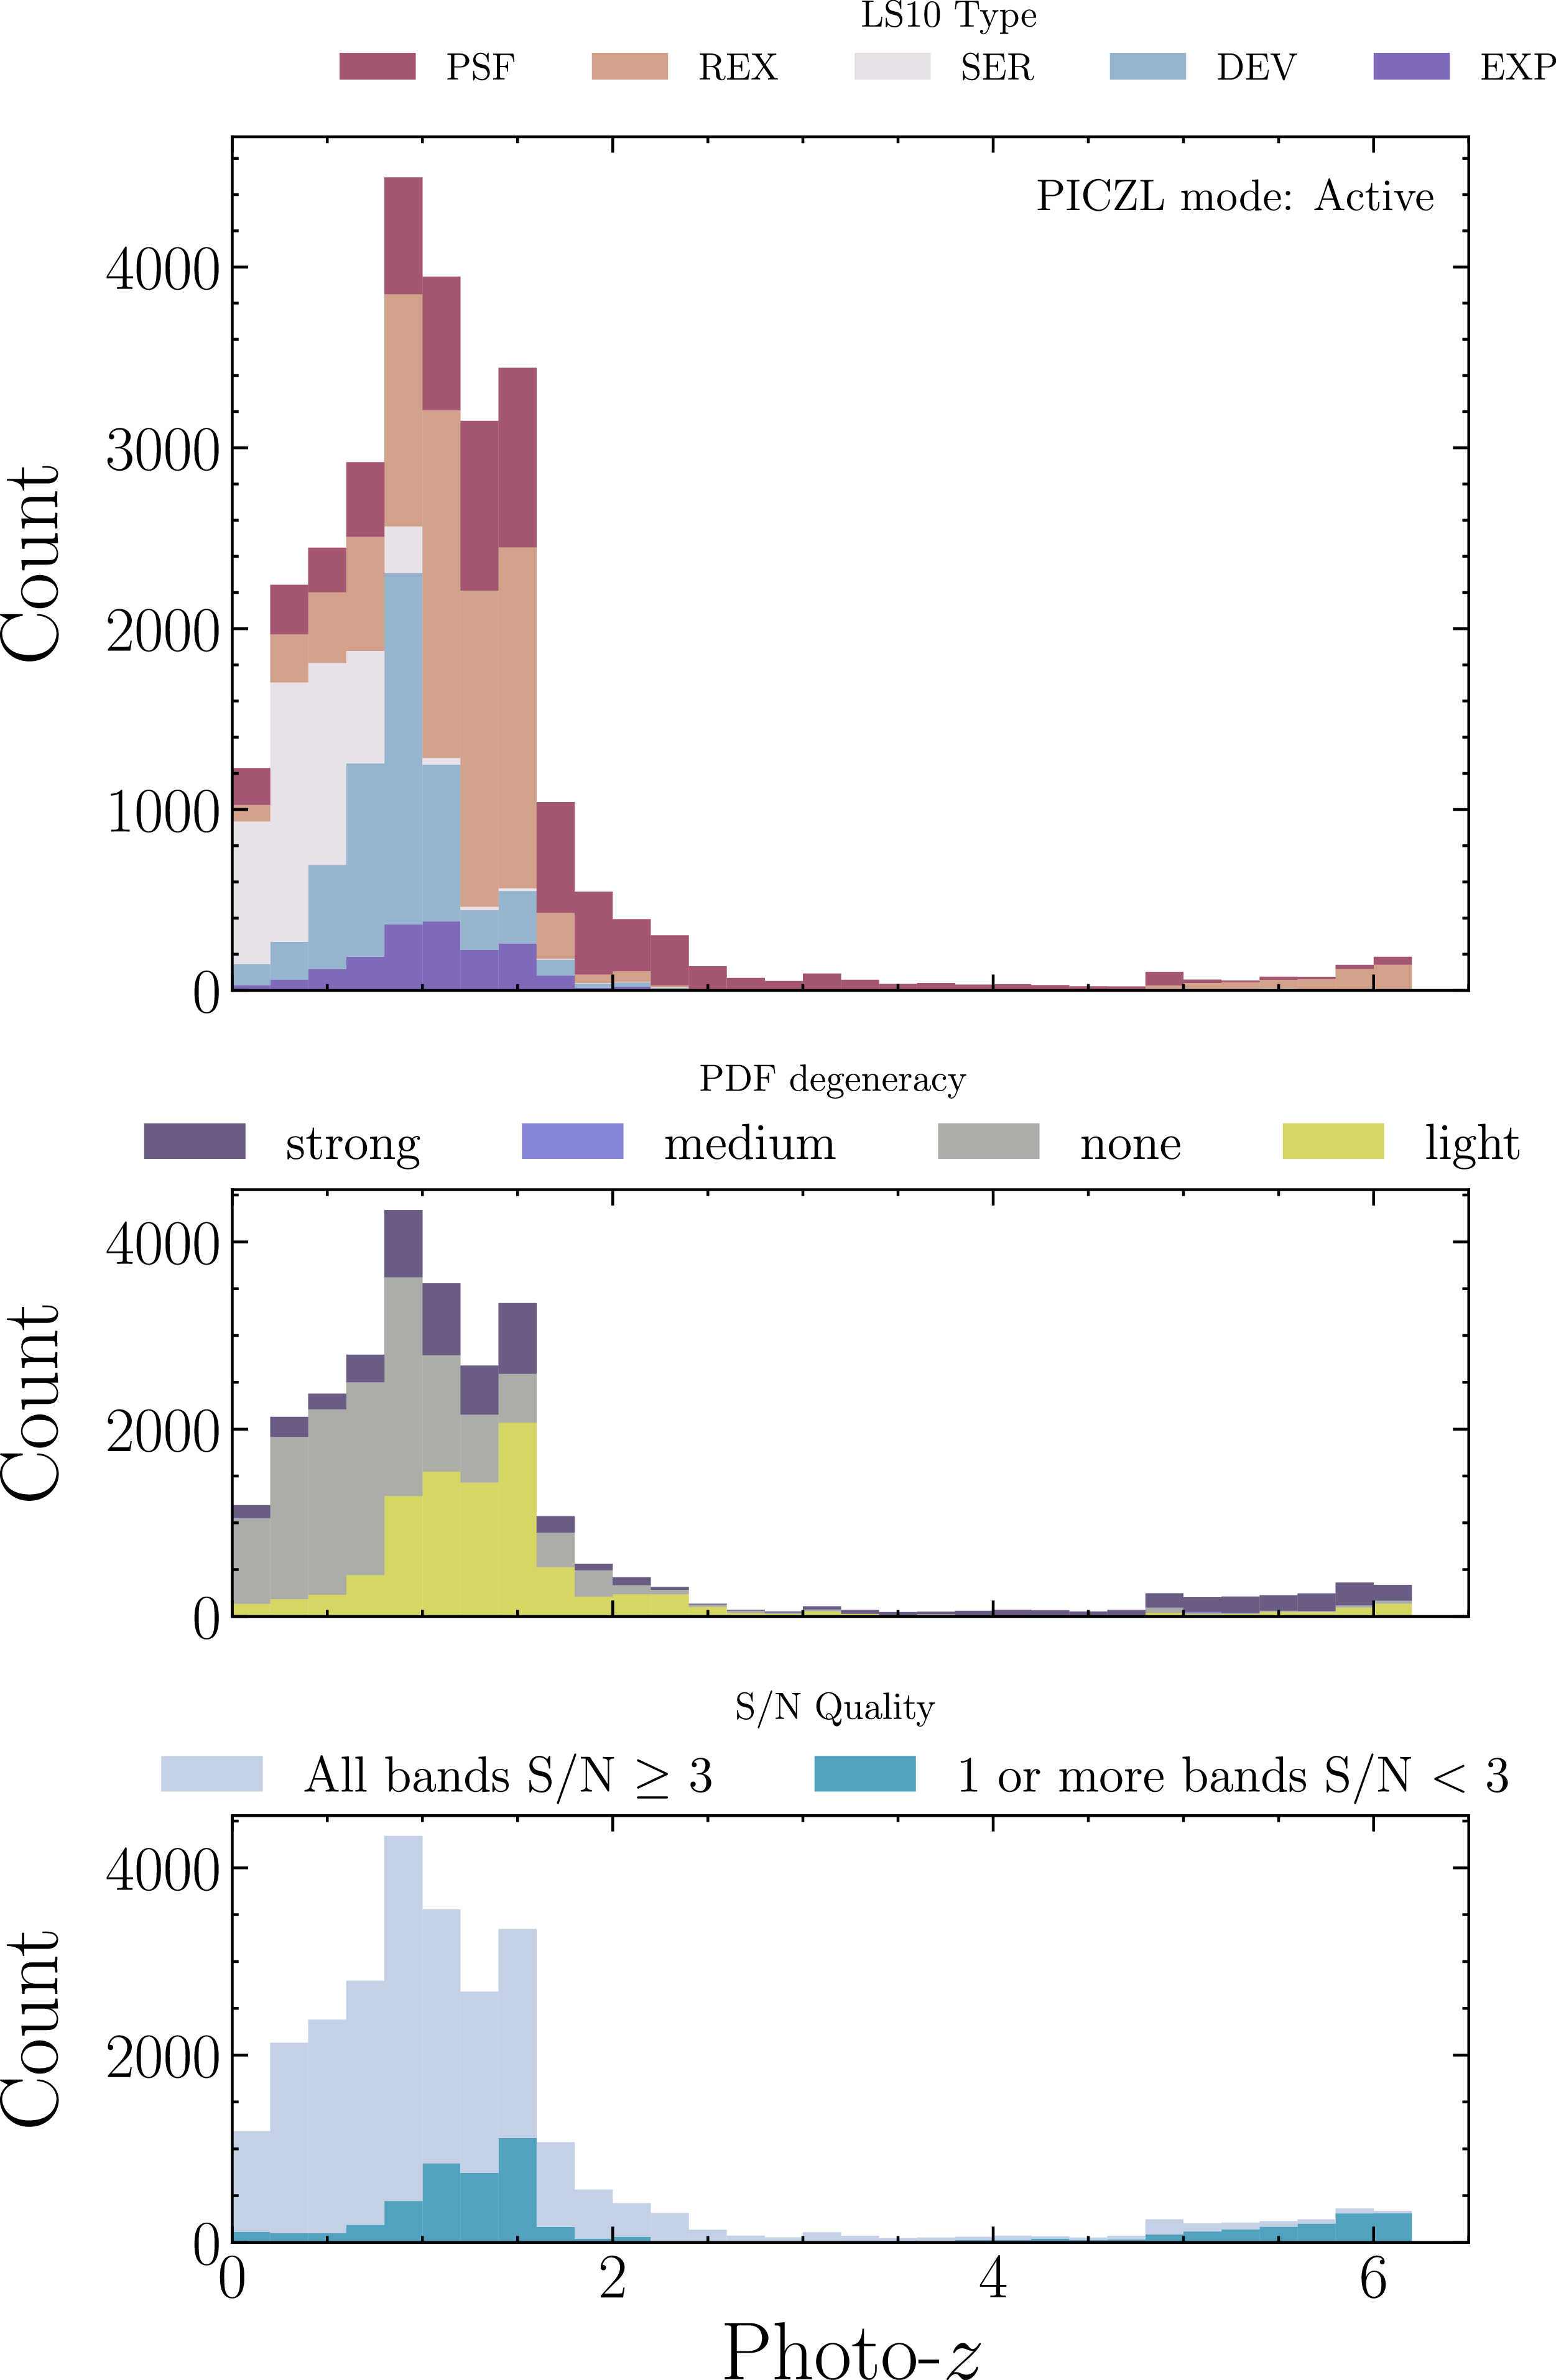

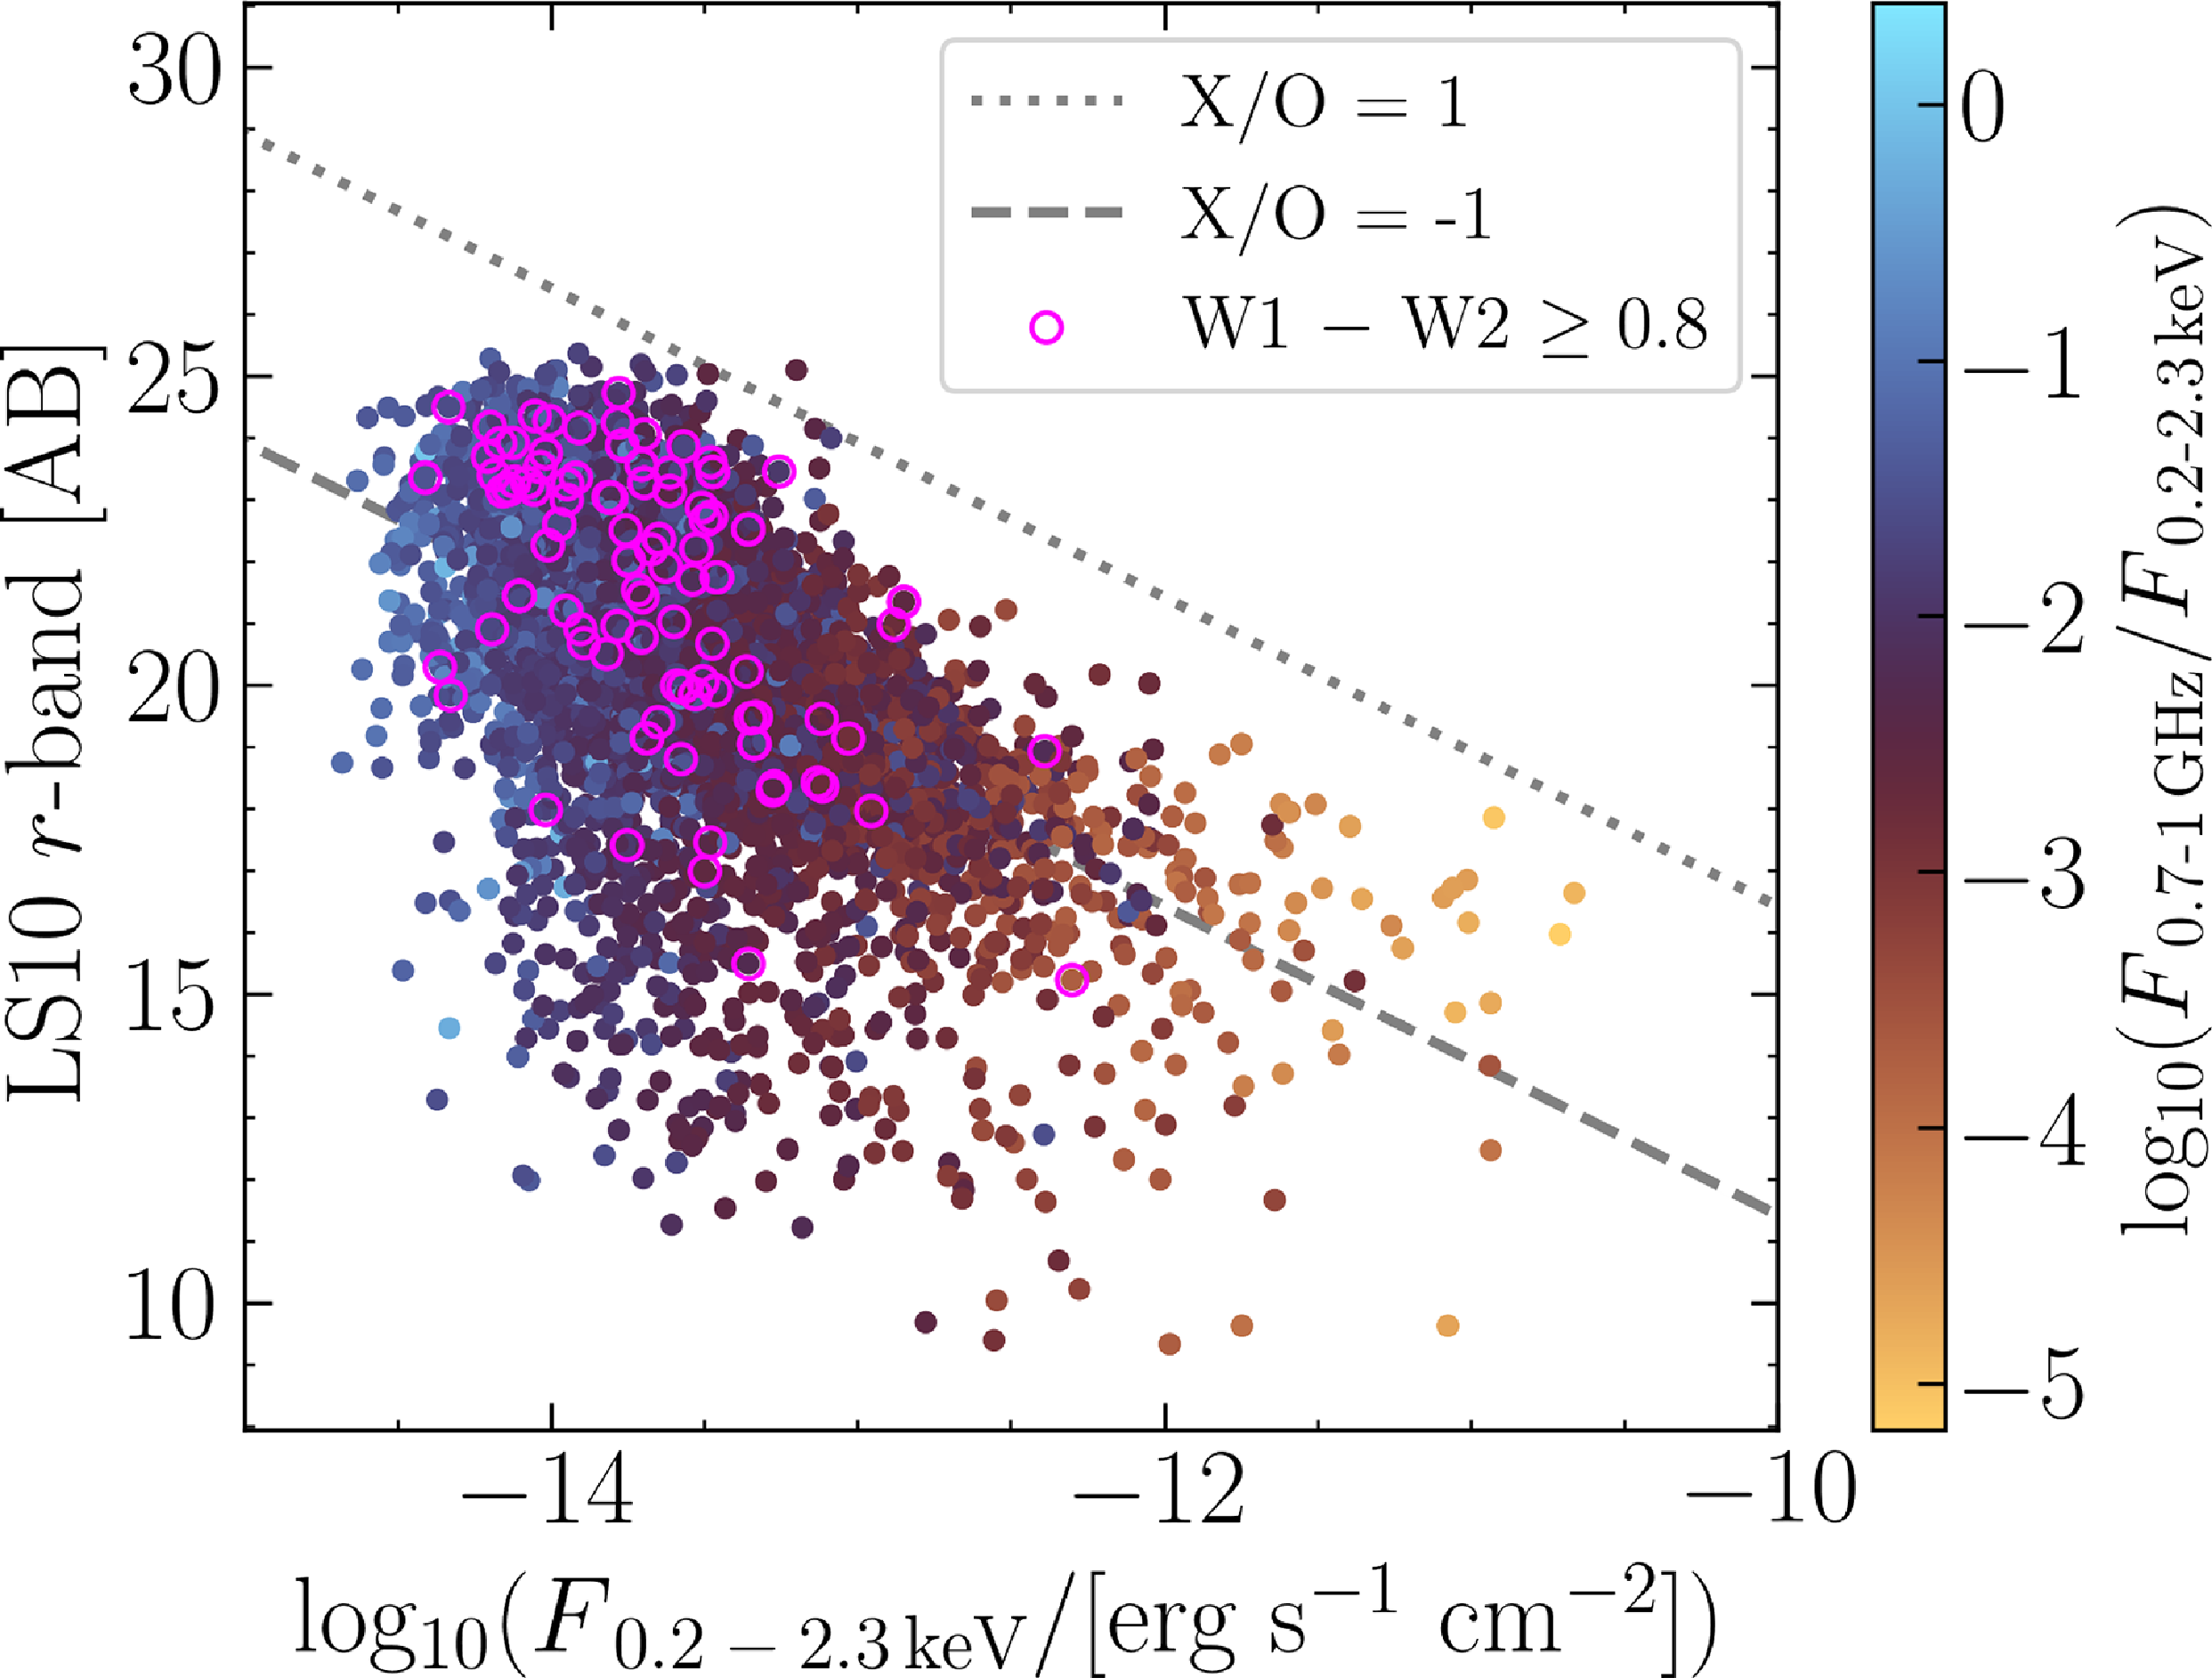


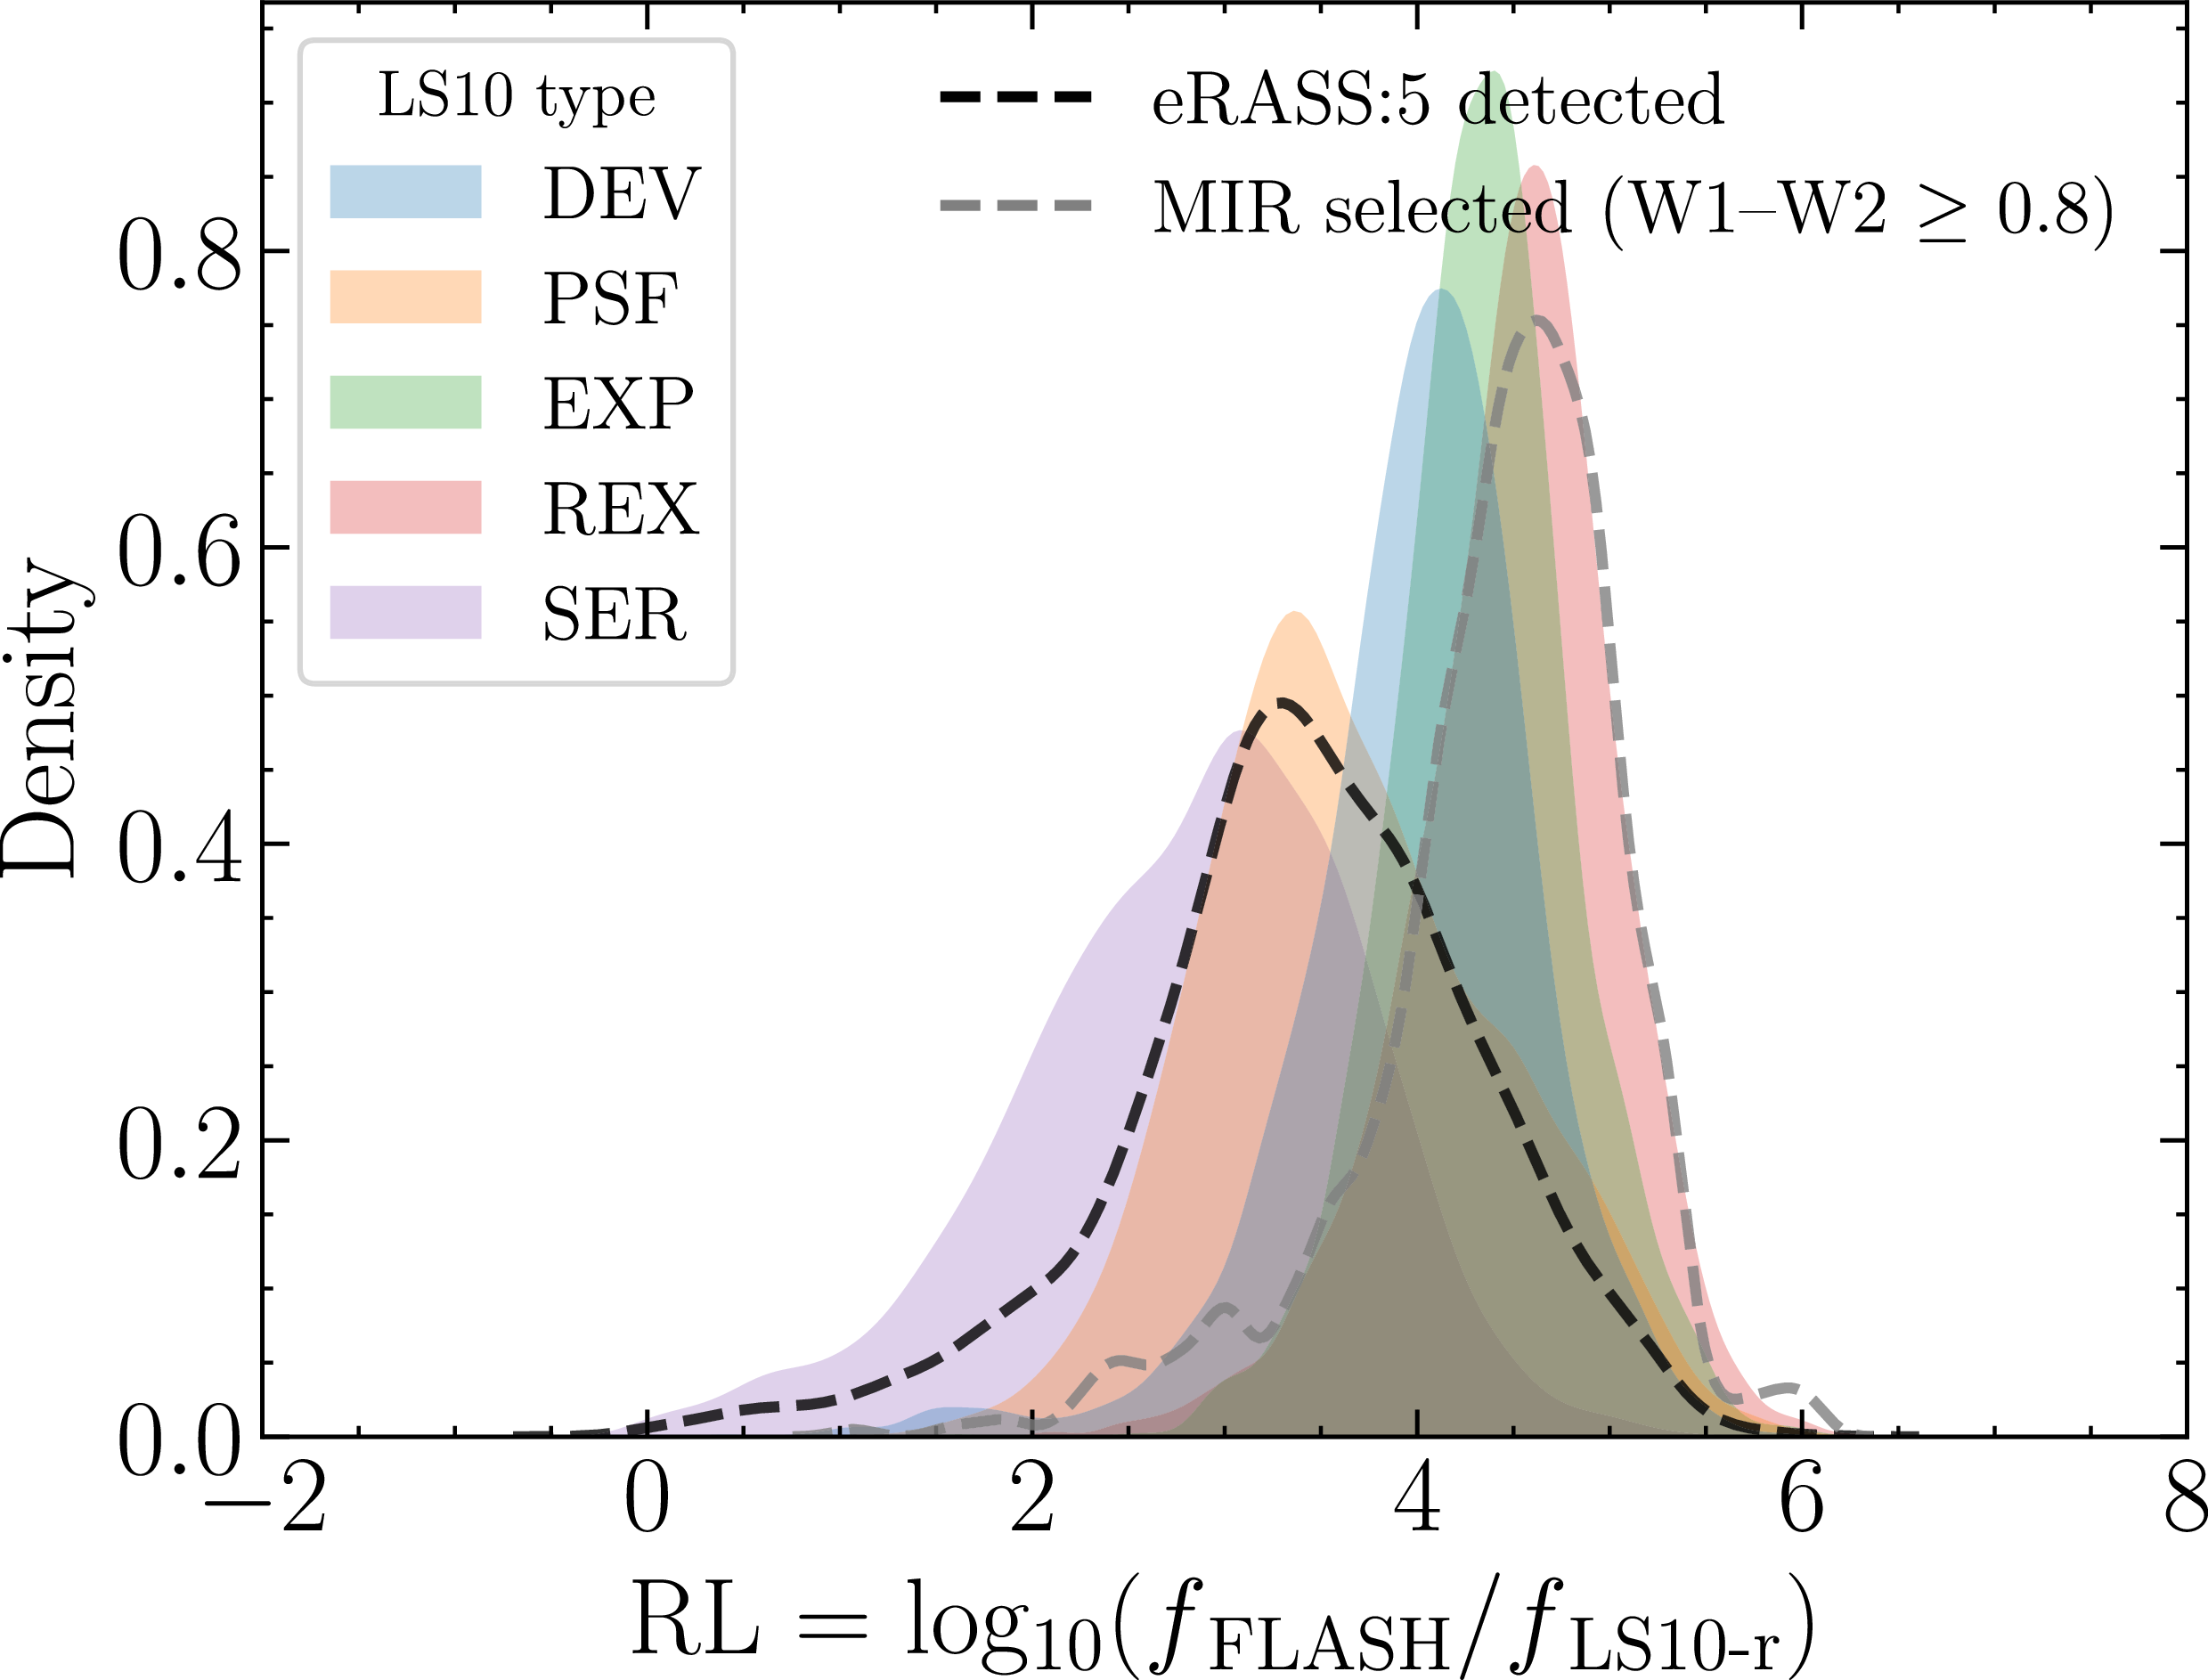


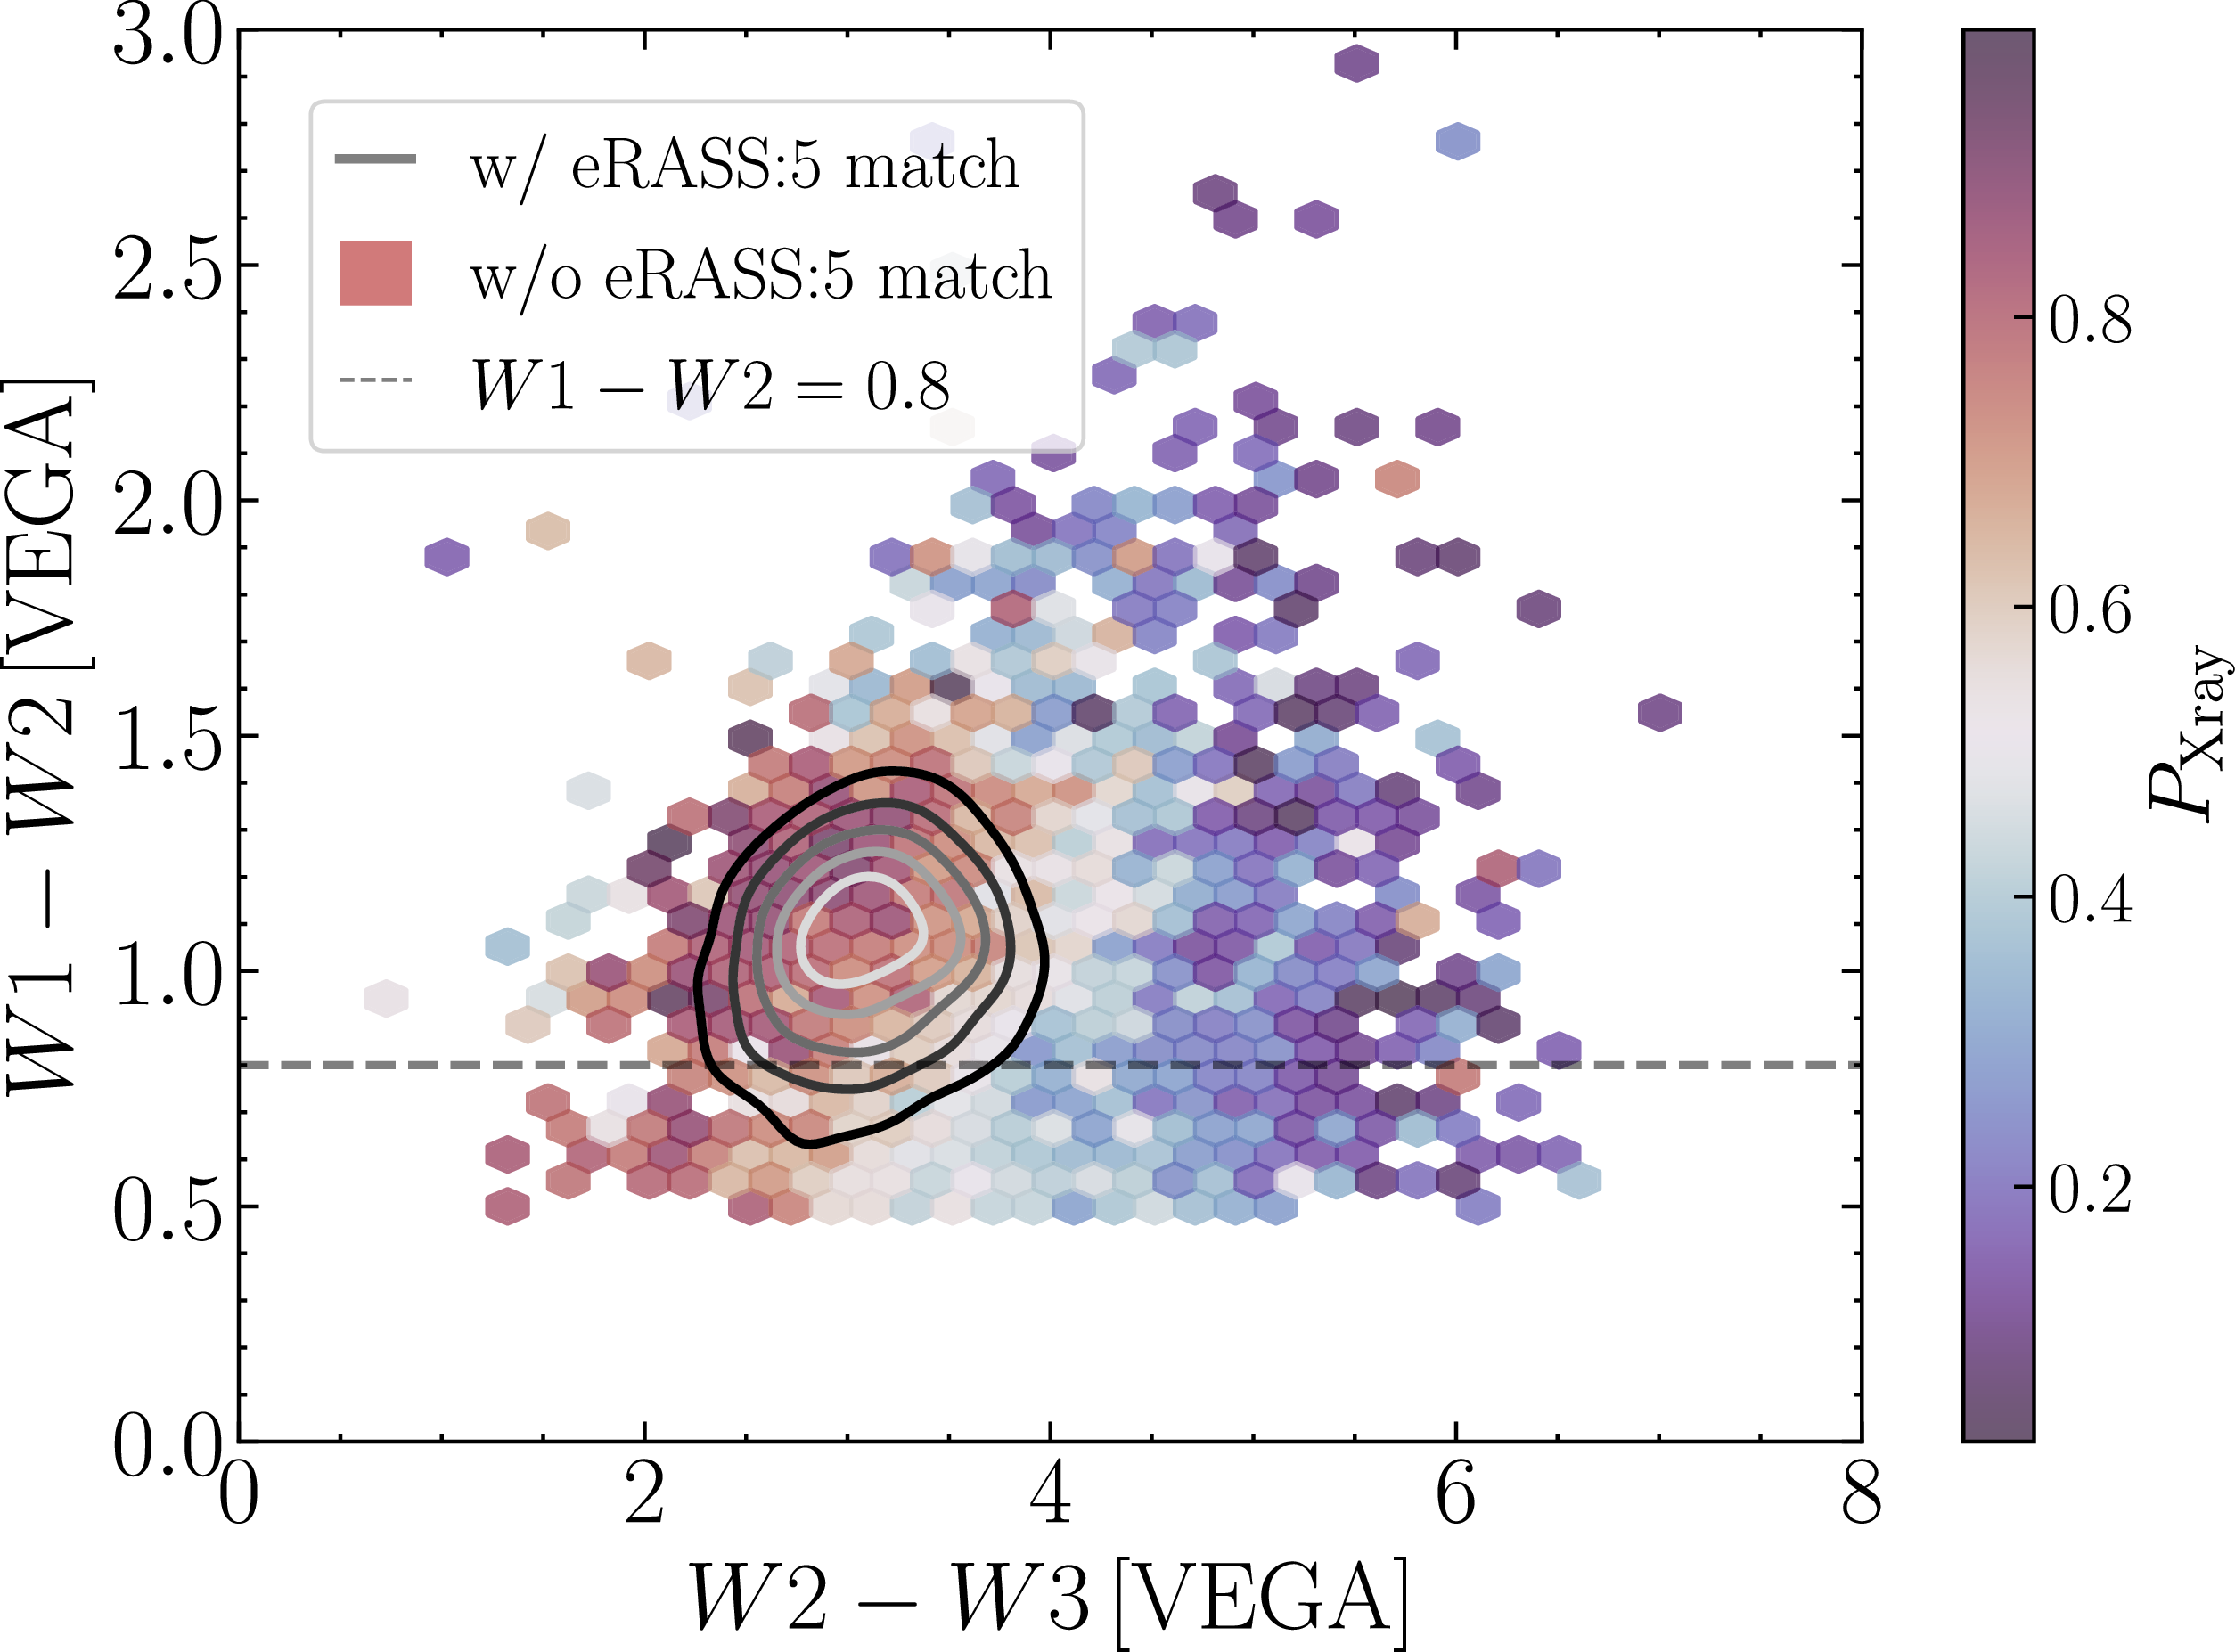


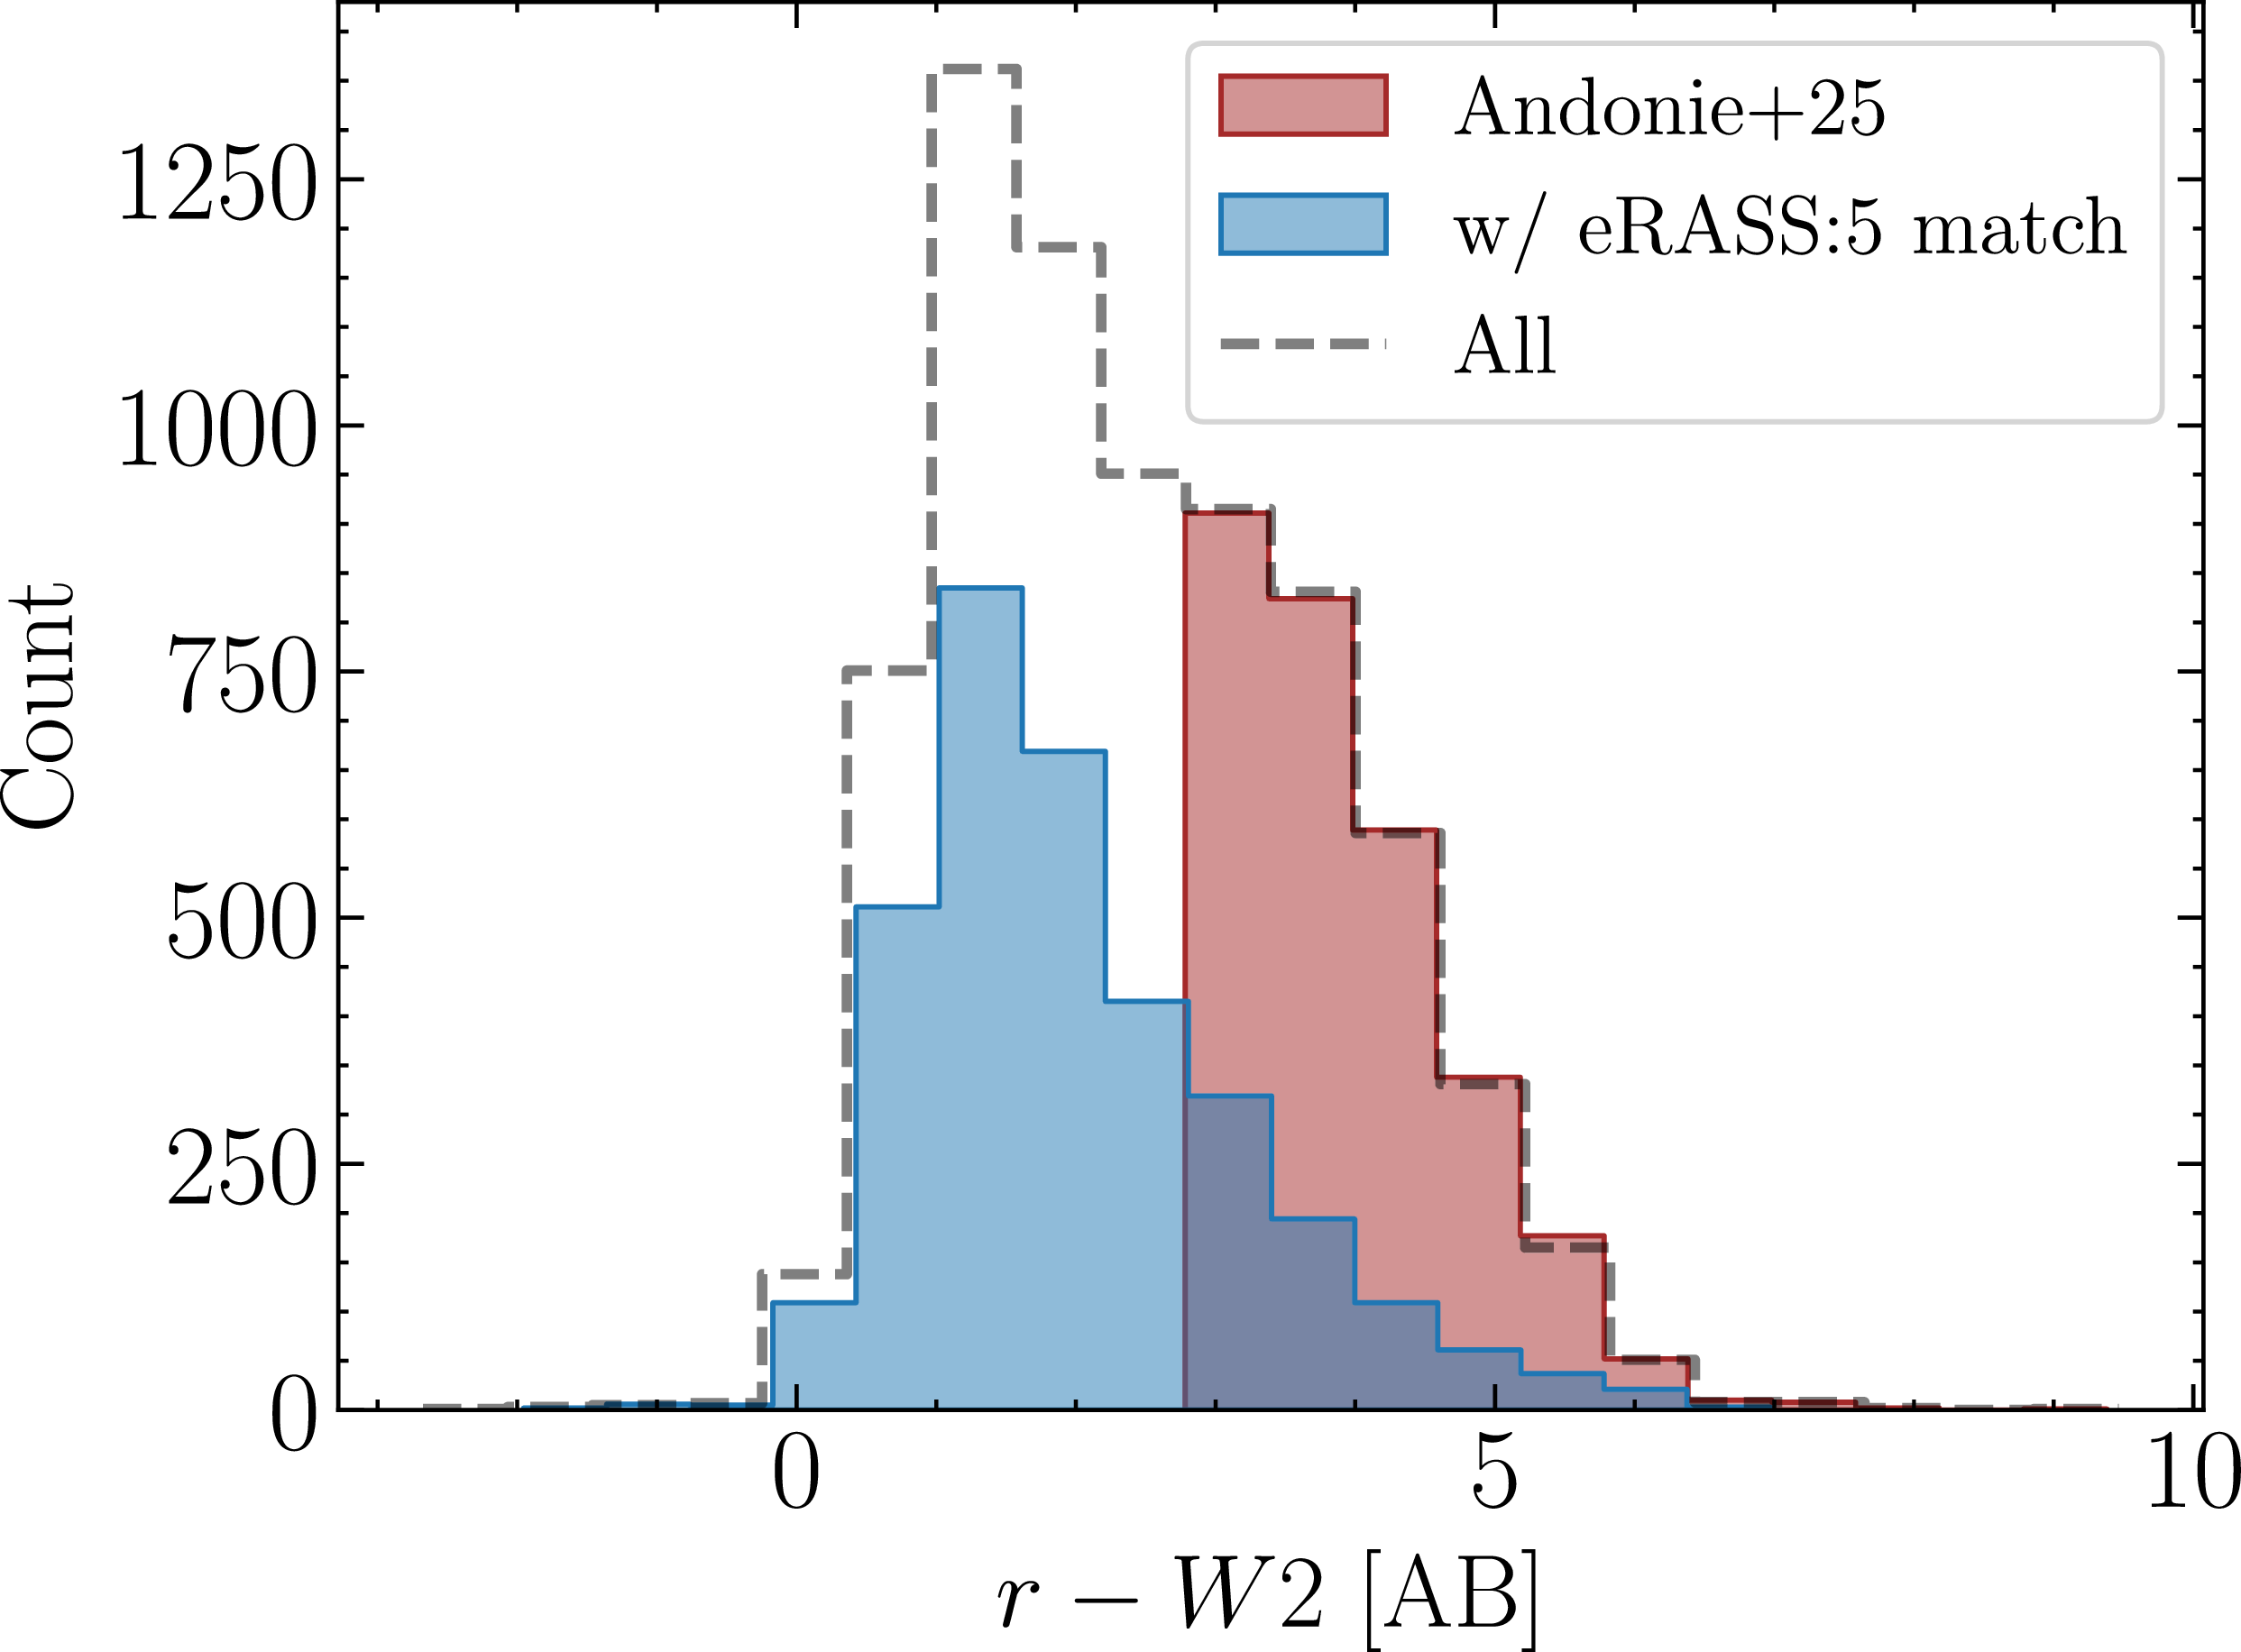
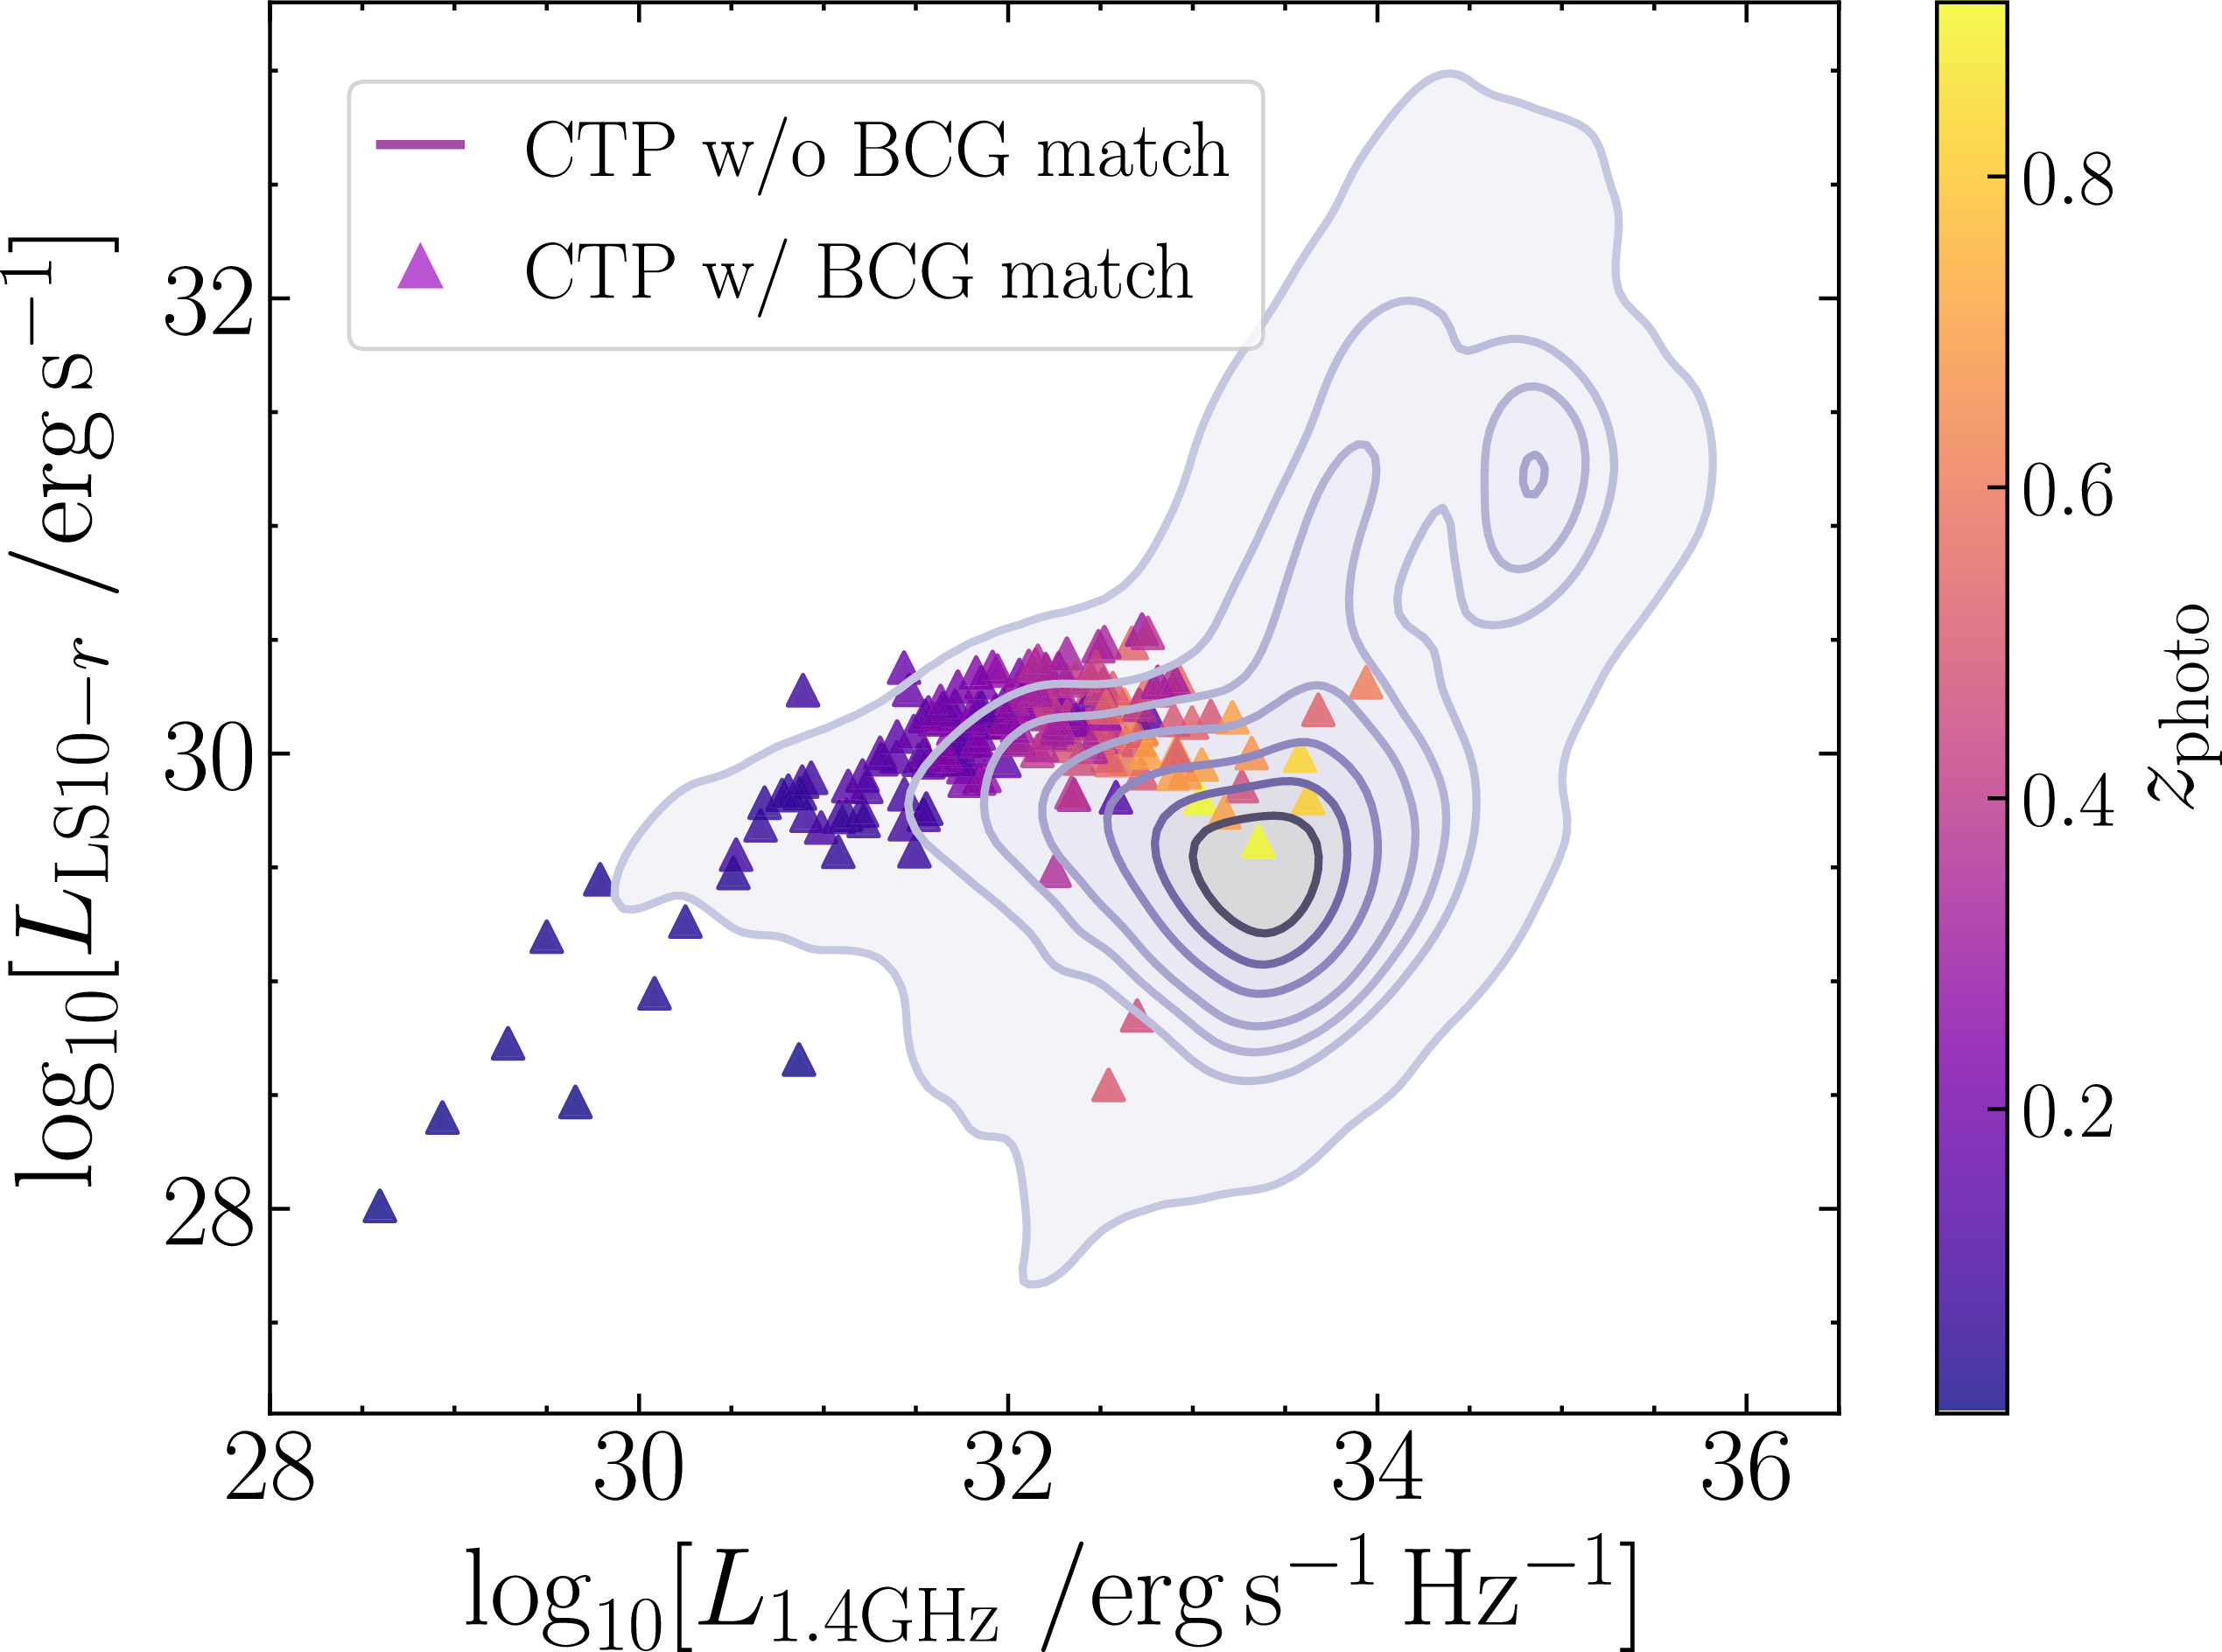
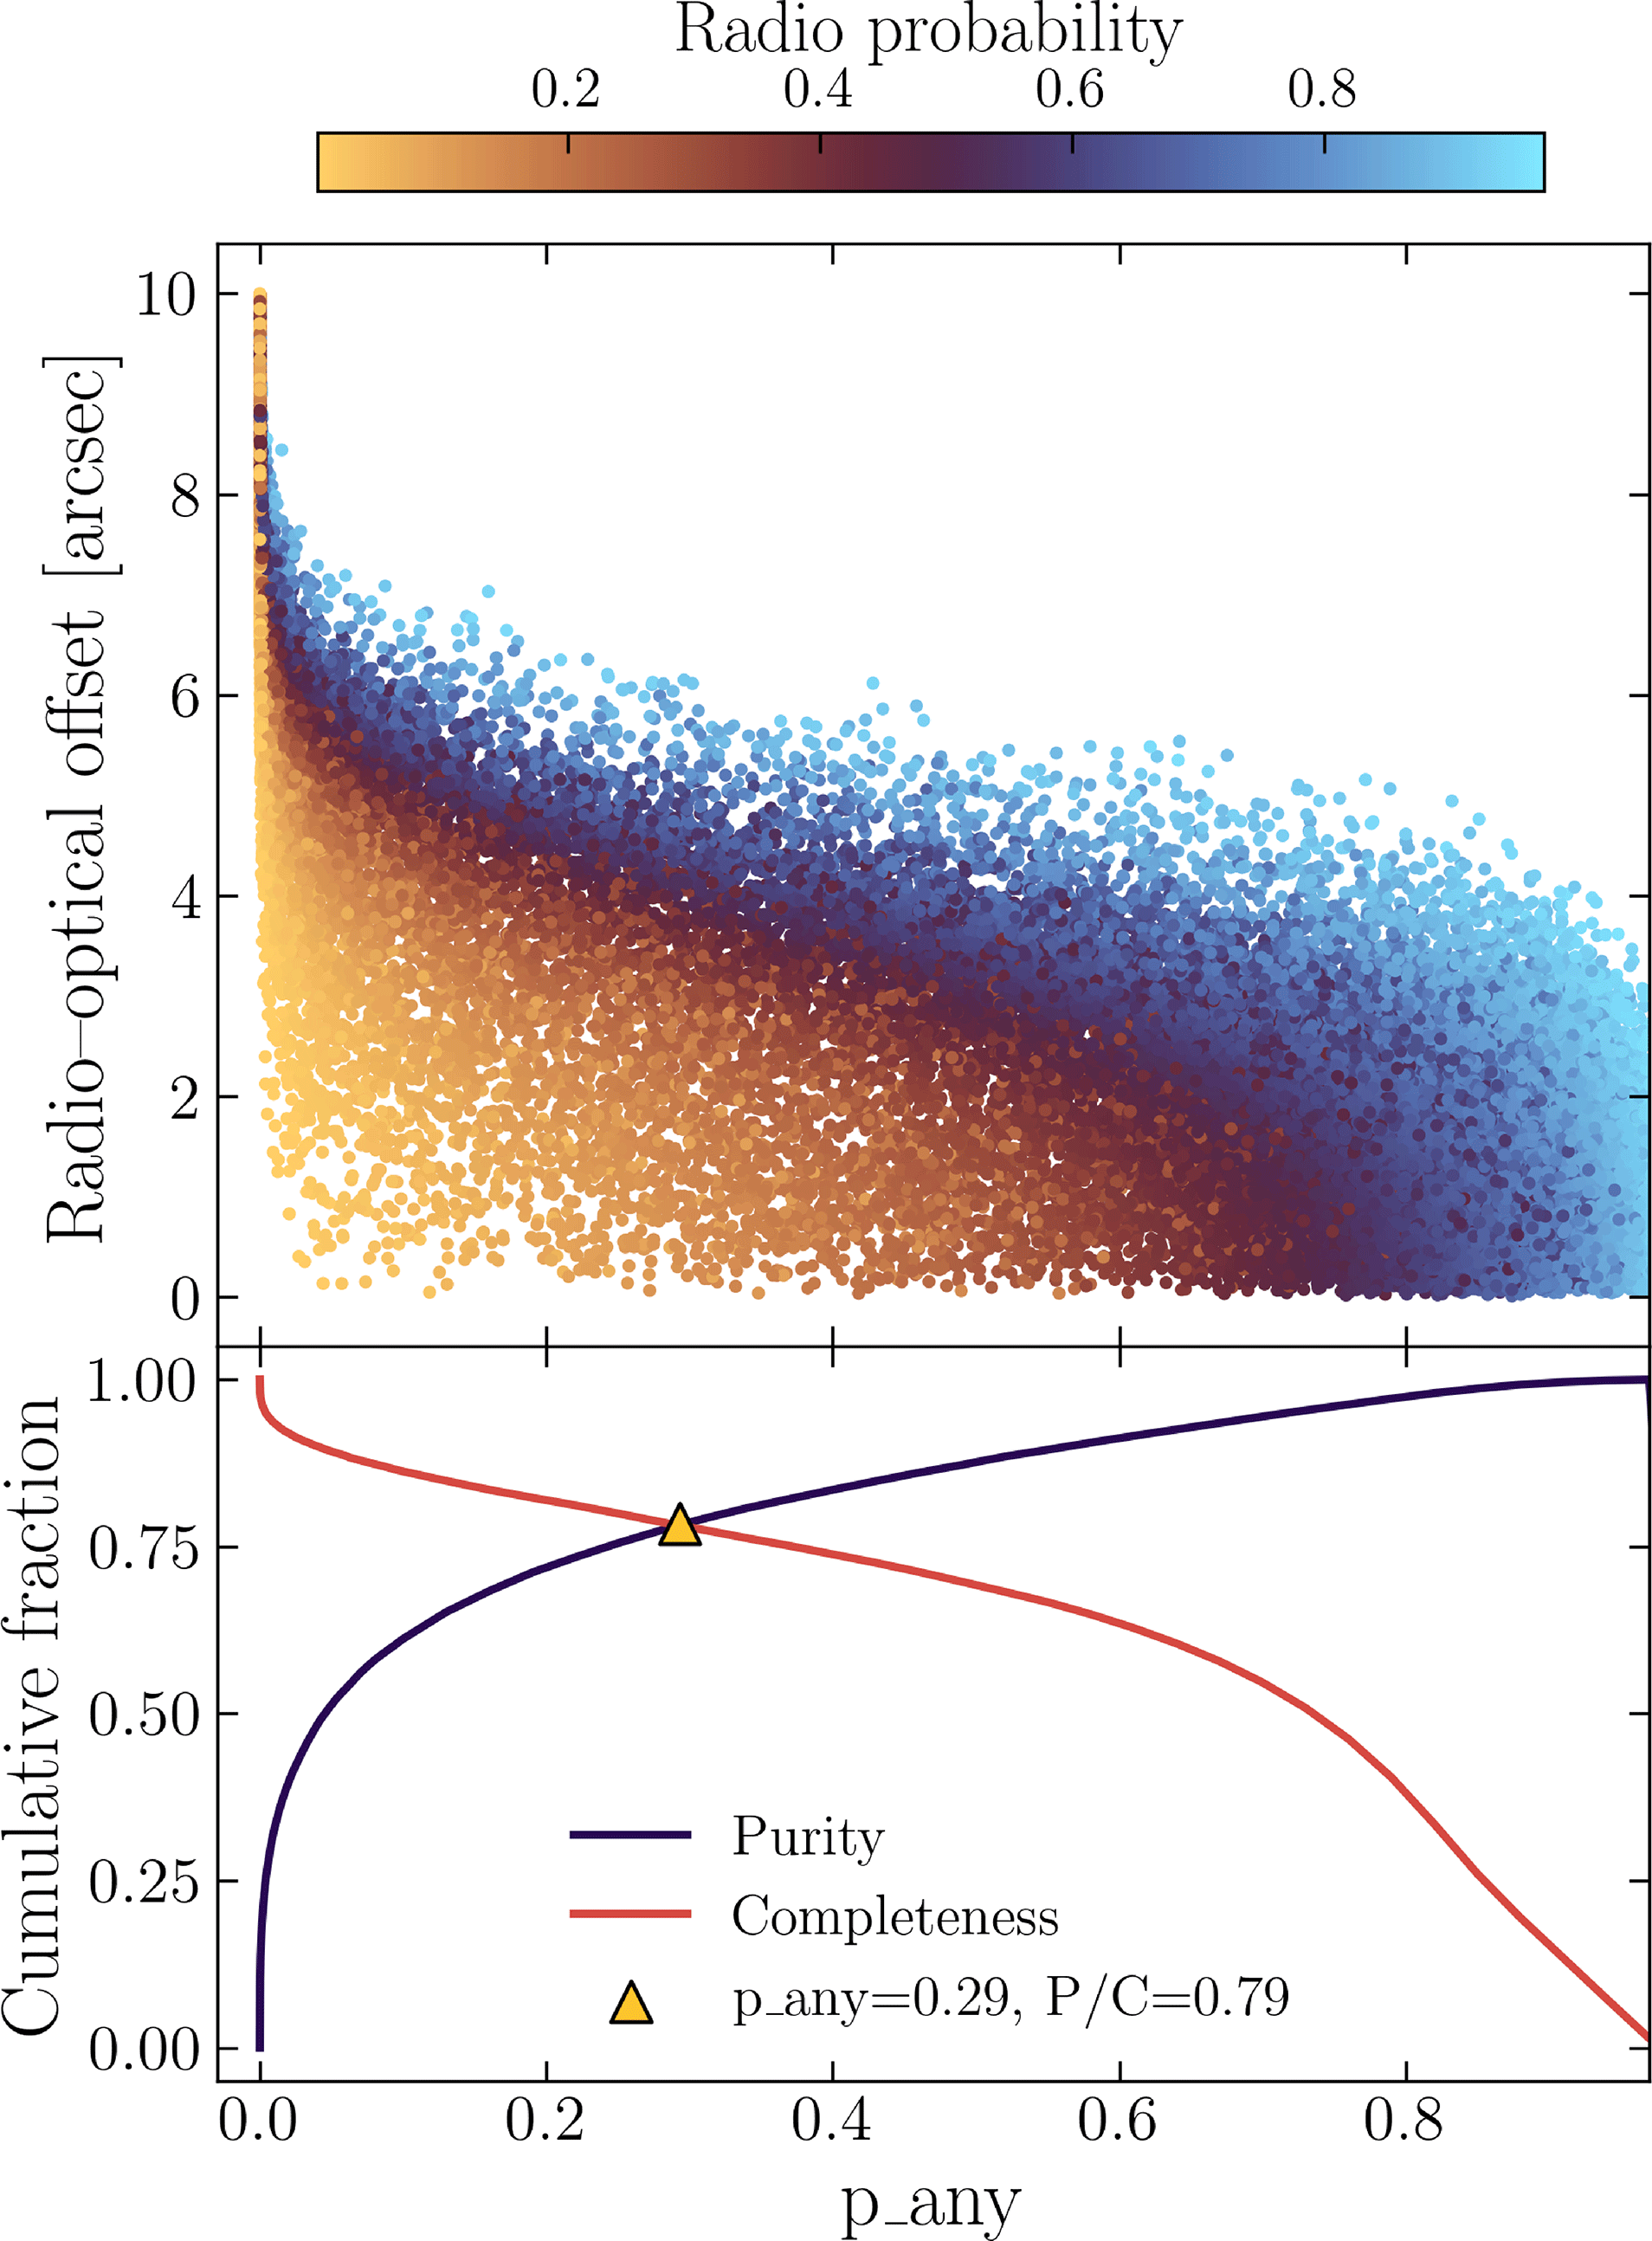


 Open access

