

One of the stated aims of the UK Government is ‘to reduce unacceptable variations in clinical practice’ (Department of Health, 1998). Laudable though this aim is, it begs the questions as to what is an ‘acceptable’ level of variation and what factors, other than the performance of practitioners, influence variation. The first question becomes easier if the extent of variation can be compared with some standard or norm.
There is a consensus among English-speaking countries in the developed world that high doses or polypharmacy of antipsychotic drugs should be avoided, other than in exceptional circumstances (Reference Harrington, Lelliott and PatonHarrington et al, 2002, this issue). A 1-day census of prescribing provided an opportunity to describe variation between UK mental health in-patient services and the extent to which this guidance is followed.
Method
Data collection and the sample
The database used for this study was that described in the accompanying paper (Reference Lelliott, Paton and HarringtonLelliott et al, 2002, this issue), involving a 1-day census of drugs prescribed to inpatients on psychiatric wards of 49 mental health services. Patients on forensic or rehabilitation wards were not included in this study, reducing the number of mental health services involved to 44. The 2149 patients on acute psychiatric wards who were prescribed an anti-psychotic drug were included. The wards were primarily for people aged 18-64.
Data analysis
For each patient, prescribed antipsychotic medication was classified as either standard dose or high dose, as defined in the associated paper by Harrington et al (Reference Harrington, Lelliott and Paton2002, this issue). The unit of analysis was the mental health service. For each service, the percentage of patients in acute wards who were on a high dose of an antipsychotic or polypharmacy was calculated. These percentages were then used as the dependent variable in linear regression analyses to examine how much of the variation between services could be explained by ‘case-mix’ factors that were known to influence prescribing (Reference Lelliott, Paton and HarringtonLelliott et al, 2002, this issue). These independent variables were mean age, proportion of patients who were male, proportion detained under the Mental Health Act (MHA) and proportion with a diagnosis of schizophrenic or delusional disorder. Although ethnicity had been found not to influence the probability of being prescribed a high dose or polypharmacy, the proportion of patients who were Black or from an ethnic minority group was also included. Independent variables were entered into the regression analysis individually and then in combination.
Results
A high dose of antipsychotic drug was prescribed to 19.7% (n=424) of the whole sample; 48% (n=1032) were prescribed more than one antipsychotic drug concurrently. Most patients prescribed a high dose (n=391; 92%) were also prescribed more than one antipsychotic drug.
Variation between services
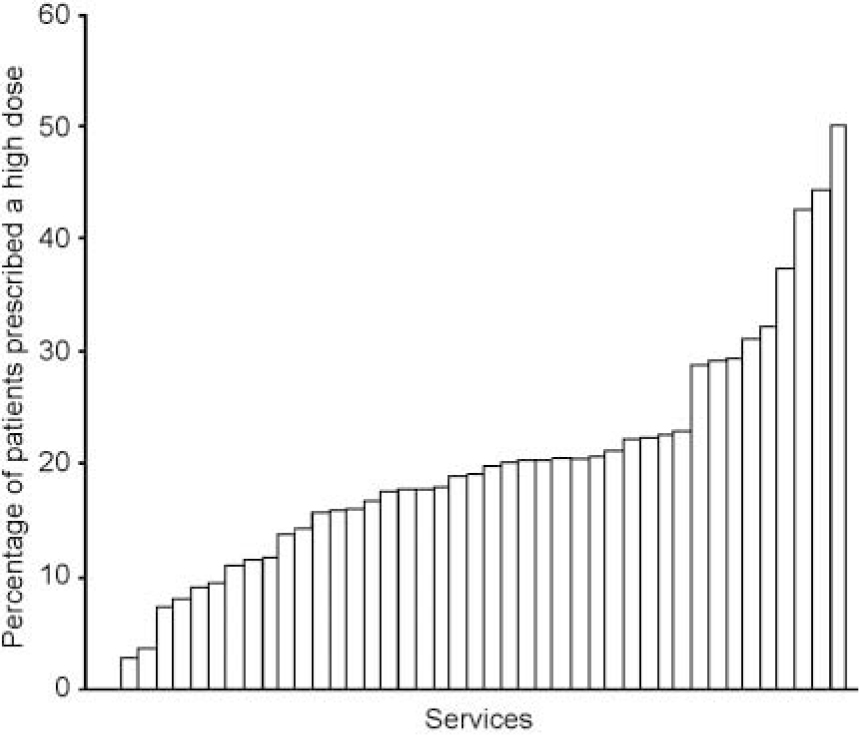
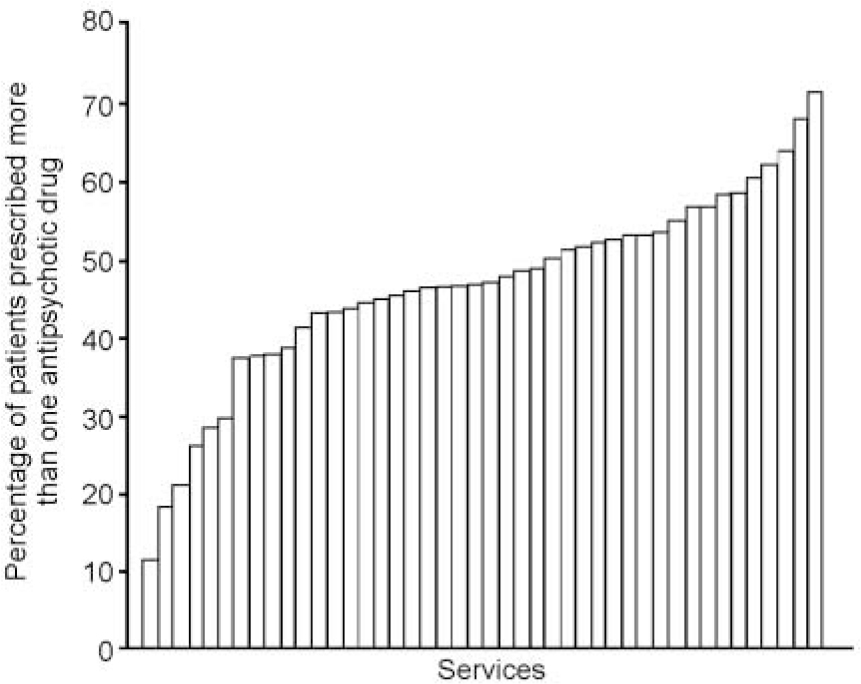
The mean number of eligible patients per service was 49 (range 20-126). Services varied greatly in the proportion of patients who were prescribed high doses (0-50%) and in the proportion on polypharmacy (12-71%). The natures of the distributions are shown in Figs 1 and 2. The extent of variation remains when services with relatively small sample sizes are removed. For the 24 services that included more than 40 patients, the proportion prescribed a high dose ranged 8-50% and the proportion prescribed polypharmacy 26-71%.
Distribution, across services, of the percentage of patients prescribed a high dose.
Distribution, across services, of the percentage of patients prescribed more than one antipsychotic drug.
The effect of case mix
Table 1 shows the extent of variation in case-mix variables between the patient cohorts from the 44 services.
Variation between the services' patient cohorts (n=44) in case mix variables

| Whole sample | Range between services | |
|---|---|---|
| Mean age (years) | 39 | 35-46 |
| Proportion male (%) | 54 | 34-77 |
| Proportion Black or from an ethnic minority (%) | 14 | 0-100 |
| Proportion detained under the Mental Health Act (%) | 46 | 15-73 |
| Proportion with schizophrenic or delusional disorder (%) | 51 | 14-76 |
Effect on high-dose prescribing
The independent variables were first entered separately into a regression analysis, with percentage of patients on a high dose as the dependent variable. There were effects for the proportion detained under the MHA (coefficient=0.37, P<0.01) and the proportion with a diagnosis of schizophrenic or delusional disorder (coefficient=0.34, P<0.01). However, when entered simultaneously, none of the individual predictor variables had a significant effect. The model accounted for 26% of the variance.
Effect on polypharmacy
In the multiple regression analysis with percentage of patients on polypharmacy as the dependent variable, and independent variables entered separately, significant predictors were the proportion of detained patients (coefficient=0.54, P<0.001), the proportion with a diagnosis of schizophrenic or delusional disorder (coefficient=0.44, P<0.01) and the proportion of patients who were Black or from an ethnic minority (coefficient=0.26, P<0.01). When variables were entered simultaneously, the effect of proportion of detained patients remained significant (standardised coefficient=0.41, P<0.05) and there was also a non-significant trend for the percentage of patients from ethnic minorities (coefficient=0.28, P<0.01). The model predicted 40% of the variance.
Discussion
There is very wide variation between the 44 mental health services in the extent to which they adhere to guidance about avoiding the prescription of high dose or polypharmacy of antipsychotic medication. A number of issues need to be considered when attempting to understand or explain this finding.
The data collection method might have exaggerated the extent of variation
This is either due to the small number of patients included by some services or because of selection bias whereby services that participated were able to decide which wards to include. However, the variation between services remains, even after those with smaller patient samples are removed. Only repeated censuses or continuous data collection over a period of time could determine how ‘stable’ this variation is; that is, whether there are services where a high proportion of patients are consistently prescribed high doses and polypharmacy.
Some of the variation is due to differences in case-mix
Simple measures of difference between the patient groups in different services did explain just over a quarter of the variance between services in prescribing of high doses and 40% of the variance in polypharmacy. Variables that most strongly affected prescribing were those most closely related to severity of disorder — the proportion of patients with a schizophrenic or delusional disorder and the proportion detained under the MHA. Perhaps if other and better measures of severity had been included, more of the variance might have been explained. Relevant measures might include length of illness, severity of symptoms and disability, level of agitation or perceived dangerousness, or treatment resistance.
A variety of factors unrelated to the patient might account for some of the unexplained variation
It is possible that the prescribing style of individual psychiatrists might have contributed to the variation between services. However, the identity of the prescriber was not recorded and it is highly likely that, for all services, the data reflect the prescribing of more than one consultant psychiatrist and the supervised practice of more than one trainee psychiatrist. This suggests that other service-level factors also need to be considered. Differences in ward design, staffing levels, bed numbers and access to a locked ward or intensive care area might affect the extent to which very ill or disturbed patients can be managed without resorting to high doses of medication.
In short, the findings of this survey pose more questions than they answer. They do, however, provide a ‘benchmark’ against which other services can compare themselves. Each incident of high-dose prescribing or polypharmacy should probably be audited for whether it is justifiable. Furthermore, services where these prescribing practices are consistently at the upper end of the ranges shown in Figs 1 and 2 might consider a wider review of prescribing practice and of service-level factors that might affect it.
Declaration of interest
C. P. has very occasionally received speaker fees from Eli Lilly and Pfizer. Over the past year she has been involved with research projects funded by Novartis, Ely Lilly and Janssen—Cilag, but has not received any personal income from those projects. T. S. has been paid honoraria by numerous pharmaceutical companies for contributions to educational events. In 2000 he attended a meeting as a participant, in an advisory board for Pfizer. The views expressed do not necessarily reflect those of the Royal College of Psychiatrists.


 Open access
eLetters
No eLetters have been published for this article.