

Introduction
Molluscs, particularly snails (Gastropoda) are, with few exceptions, the exclusive first intermediate hosts for digenean trematode parasites (Trematoda, Digenea) (Cribb et al. Reference Cribb, Bray, Olson and Littlewood2003). These parasites and their snail hosts have developed intimate parasite–host associations, with snails supporting a diverse trematode fauna (Cribb et al. Reference Cribb, Bray, Olson and Littlewood2003; Poulin & Mouritsen Reference Poulin and Mouritsen2003; Lockyer et al. Reference Lockyer, Jones, Noble and Rollinson2004).
Trematodes are important components of ecosystems and can have ecosystem-wide impacts through their effects on snail biology (Wood et al. Reference Wood, Byers, Cottingham, Altman, Donahue and Blakeslee2007; Bernot & Lamberti Reference Bernot and Lamberti2008). Although a wide range of studies have examined the biological and ecological effects of trematode parasites and snails (e.g., see reviews by Sorensen & Minchella Reference Sorensen and Minchella2001; Thieltges et al. Reference Thieltges, Engelsma, Wendling and Wegner2013), the trematode fauna of many snail taxa remains poorly characterised. In freshwater snails, the pulmonate snail families Lymnaediae and Planorbidae (Heterobranchia) have been extensively studied for trematode parasites (Bargues et al. Reference Bargues, Vigo, Horák, Dvořák, Patzner, Pointier, Jackiewicz, Meier-Brook and Mas-Coma2001; Faltýnková et al. Reference Faltýnková, Našincová and Kablásková2007, Reference Faltýnková, Našincová and Kablásková2008; Vázquez et al. Reference Vázquez, Alda, Lounnas, Sabourin, Alba, Pointier and Hurtrez-Boussès2018). However, data are scarce for non-pulmonate freshwater snails (formerly called ‘prosobranch snails’, now in subclass Caenogastropoda), as was also highlighted by Schwelm et al. (Reference Schwelm, Kudlai, Smit, Selbach and Sures2020), who provided the first comprehensive integrative taxonomic study of trematode parasites in Bithynia tentaculata (Linnaeus, 1758), a caenogastropod snail of the family Bithyniidae.
The faucet snail, B. tentaculata, inhabits both lentic and lotic water bodies; it is highly resistant and adaptable in its feeding strategy and survival (Brendelberger Reference Brendelberger1995; Glöer Reference Glöer2002). It is widespread in the Palaearctic; it is one of the most common and abundant snail species in Ireland and Great Britain (Kerney Reference Kerney1999), as well as in other parts of Europe, from Scandinavia to the Mediterranean (Glöer Reference Glöer2002). Bithynia tentaculata is well known as an intermediate host of trematodes in Europe (Glöer Reference Glöer2002), and within the order Littorinimorpha, it is recorded as harbouring the most trematode species (see Cichy et al. Reference Cichy, Faltýnková and Żbikowska2011; Faltýnková et al. Reference Faltýnková, Sures and Kostadinova2016; Schwelm et al. Reference Schwelm, Kudlai, Smit, Selbach and Sures2020). However, there has been a substantial gap in knowledge of the exact species identity of the trematode parasites of B. tentaculata. The trematode cercariae found in these snails belong to families with members that are particularly difficult to identify. Thus, classification has been vague, and authors often used traditional names for the cercariae that are not connected to the adult trematode parasites (see e.g. Morley et al. Reference Morley, Adam and Lewis2004). The first step to clarify this situation was recently completed by Schwelm et al. (Reference Schwelm, Kudlai, Smit, Selbach and Sures2020) who were the first to link DNA sequences to morphological data, followed by Katokhin & Serbina (Reference Katokhin and Serbina2023). Schwelm et al. (Reference Schwelm, Kudlai, Smit, Selbach and Sures2020) found a diverse and unique spectrum of trematodes, revealing the need for more studies to further resolve the species identity, their phylogenetic relationships, and geographical distribution. A thorough knowledge of the trematode fauna hosted by B. tentaculata based on precise identification via integrative taxonomy is crucial for both conservation and epidemiology. Such information is even more important because B. tentaculata is an efficient coloniser and is invasive in North America; the trematode parasites it hosts (Cyathocotyle bushiensis, Sphaeridiotrema globulus, and notocotylids) have been reported from mass mortalities of American migratory birds (Sauer et al. Reference Sauer, Cole and Nissen2007; Karatayev et al. Reference Karatayev, Mastitsky, Burlakova, Karatayev, Hajduk and Conn2012; Weeks et al. Reference Weeks, de Jager, Haro and Sandland2017).
Ireland is situated on the East Atlantic bird flyway and is a wintering ground for birds nesting further north in Iceland, Greenland, and/or Canada (Cramp & Simmons Reference Cramp and Simmons1980). Consequently, a diverse assembly of trematode parasites of migratory birds can be expected to occur in snails in Ireland. Recently, an abundant fauna of trematode parasites from freshwater pulmonate snails (Lymnaeidae and Planorbidae) in Ireland was recorded, overlapping with trematode data reported from other parts of Europe including Finland, Iceland, and Norway (Kudlai et al. Reference Kudlai, Pantoja, O’Dwyer, Jouet, Skírnisson and Faltýnková2021; Pantoja et al. Reference Pantoja, Faltýnková, O’Dwyer, Jouet, Skírnisson and Kudlai2021; Faltýnková et al. Reference Faltýnková, Kudlai, Pantoja, Yakovleva and Lebedeva2022). In Ireland, B. tentaculata has so far not been examined for trematodes, although the species is occurring in most parts of the country (Kerney Reference Kerney1999).
In the present study, during a screening of snails for trematodes in lakes in Ireland (i.e. the surroundings of Galway) we found B. tentaculata harbouring trematode parasite infections. Our aim was to characterise these trematodes using molecular genetic tools and morphology to contribute to further knowledge of these groups, as genetic data are still scarce (see Schwelm et al. Reference Schwelm, Kudlai, Smit, Selbach and Sures2020). All but one trematode species found are new species records for Ireland and provide the most western distribution of these parasites in Europe.
Material and methods
Sample collection and morphological examination
Specimens of the faucet snail, Bithynia tentaculata (Caenogastropoda, Littorinimorpha, Bithyniidae) were collected by hand or with a strainer from stones, mud, or aquatic plants on the bottom of littoral areas of lakes in the surroundings of County Galway, Ireland. In July 2019, a total of 556 B. tentaculata were collected, i.e 22 snails from Hackett Pond (53°29’27.0”N 9°02’31.0”W), 125 snails from Lough Corrib (53°21’27.0”N, 9°04’36.0”W), 15 snails from Lough Mask (53°37’41.0”N, 9°17’01.0”W), 320 snails from Loughrea (53°11’49.8”N, 8°34’51.6”W), and 74 snails from Killeeneen (53°13’30.0”N, 8°47’43.0”W).
The snails were identified based on their shell morphology, and identification was confirmed using Glöer (Reference Glöer2002). Snails were placed individually into small plastic cups with dechlorinated tap water, and emergence of cercariae from snails was stimulated by light and heat from a lamp overnight for two consecutive days.
Emerged cercariae were examined under a light microscope, and for vital staining Neutral red and Nile blue were used; for primary identification, Yamaguti (Reference Yamaguti1975) was used. Live or fixed cercariae from each snail were examined and photographed with a digital camera on Olympus BX41 and BX51 light microscopes to document morphology. Drawings of cercariae were based on microphotographs taken on live specimens. Afterwards, all snails were dissected under a stereomicroscope to detect trematode parasite stages, including non-emerged cercariae, sporocysts or rediae, and metacercariae. Cercariae and metacercariae (isogenophores, sensu Pleijel et al., Reference Pleijel, Jondelius, Norlinder, Nygren, Oxelman, Schander, Sundberg and Thollesson2008) were fixed in molecular grade ethanol (96%) for subsequent molecular analyses and for morphological examination.
Measurements of live and fixed cercariae were taken from digital images with the aid of ImageJ image analysis software (Schneider et al. Reference Schneider, Rasband and Eliceiri2012). All measurements are given in micrometres as the range followed by the mean in parentheses. The following abbreviations of morphological features are used in the text: TSL/BL or TL/BL, body length (BL) to tail stem length (TSL)/tail length (TL) ratio; TSL/FL, furca length (FL) to tail stem length ratio; VSW/OSW, oral sucker width (OSW) to ventral sucker width (VSW) ratio.
Voucher material of cercariae fixed in molecular grade ethanol is deposited in the collection of the National Museum of Ireland Natural History (NMINH), Merrion Street, Dublin 2, D02 F627, Ireland.
DNA processing and phylogenetic analyses
Total genomic DNA was extracted from approximately 20–25 cercariae or one cercariaeum or metacercaria (Lissorchiidae and Psilostomidae) detected in a single snail using the Monarch Genomic DNA Purification Kit (New England Biolabs, Inc., Ipswich, MA, USA) following the manufacturer’s recommendations. Following the recommendations of Blasco-Costa et al. (Reference Blasco-Costa, Cutmore, Miller and Nolan2016), DNA sequence-based identification of trematode larval stages recorded in the present study was based on multiple molecular markers. Depending on the trematode family, the taxonomic identity and phylogenetic relationships of the larval stages were evaluated on DNA sequences of the partial 28S rRNA gene (D1–D3 region), partial mitochondrial cytochrome c oxidase subunit 1 (cox1), partial mitochondrial nicotinamide adenine dinucleotide dehydrogenase subunit 1 (nad1) genes, complete second internal transcribed spacer region (ITS2), and/or the entire internal transcribed spacer (ITS1-5.8S-ITS2) region. Amplification of the partial 28S rRNA gene was completed as described by Scholz et al. (Reference Scholz, de Chambrier, Kuchta, Littlewood and Waeschenbach2013) using the primers ZX-1 and 1500R. Amplification of the partial cox1 gene was completed as described by Van Steenkiste et al. (Reference Van Steenkiste, Locke, Castelin, Marcogliese and Abbott2015) using primers DICE1F and DICE14R and by Wee et al. (Reference Wee, Cribb, Bray and Cutmore2017) using primers Dig_cox1Fa and Dig_cox1R. Amplification of the partial nad1 gene was completed as described by Laidemitt et al. (Reference Laidemitt, Anderson, Wearing, Mutuku, Mkoji and Loker2019) using primers NDJ11 and NDJ2A. Amplification of the complete ITS2 region was completed as described by Cutmore et al. (Reference Cutmore, Miller, Curran, Bennet and Cribb2013) using primers 3S and ITS2.2. Finally, amplification of the entire ITS1-5.8S-ITS2 was completed as described by Galazzo et al. (Reference Galazzo, Dayanandan, Marcogliese and McLaughlin2002) using primers D1 and D2. Amplified DNA was purified using ExoSAP-IT PCR Cleanup enzymatic kit from Thermo Fisher Scientific, Inc. (Waltham, MA, USA) and sequenced from both strands using the PCR primers and additional internal sequencing primers ECD2 (5′-CCT TGG TCC GTG TTT CAA GAC GGG-3′) (Littlewood et al. Reference Littlewood, Rohde and Clough1997) and 300F (5′-CAA GTA CCG TGA GGG AAA GTT G-3′) (Littlewood et al. Reference Littlewood, Curini-Galletti and Herniou2000) for 28S rDNA. Cycle sequencing of DNA was carried out applying ABI Big Dye™v.3.1 chemistry at the commercial company SEQme (Dobříš, Czech Republic, https://www.seqme.eu) with the use of an AB3730x1 capillary sequencer. Geneious Prime ver. 2023.2.1 (Biomatters, Auckland, New Zealand, https://geneious.com) was used to assemble and edit contiguous sequences. The newly generated sequences were deposited in GenBank with accession numbers PP840844–PP840849, PP844658–PP844660, PP849699–PP849722, and PP856383–PP856385.
Identification of novel sequences was checked using the Basic Local Alignment Search Tool (BLAST) (www.ncbi.nih.gov/BLAST/), and thereafter they were aligned with the selected representative sequences from GenBank using MUSCLE implemented in Geneious Prime (Table 1). Ten alignments were prepared for phylogenetic analyses. Muscle standard algorithm was applied. Alignment 1 – Cyathocotylidae (1,122 nt); Alignment 2 – Lecithodendriidae (1,055 nt); Alignment 3 – Lissorchiidae (1,226 nt); Alignment 4 – Opecoelidae (1,199 nt); Alignment 5 – Opisthorchiidae (1,071 nt); Alignment 6 – Notocotylidae (1,156 nt); and Alignment 7 – Psilostomidae (1,120 nt), which all consisted of the 28S rDNA sequences. Two alignments, Alignment 8 – Lecithodendriidae (339 nt) and Alignment 9 – Lissorchiidae (407 nt) consisted of ITS2 sequences, and Alignment 10 – Opisthorchiidae (775 nt) consisted of cox1 sequences. The cox1 alignment was aligned with reference to the amino acid translation, using the trematode mitochondrial code (translation table 21; https://www.ncbi.nlm.nih.gov/Taxonomy/Utils/wprintgc.cgi#SG21) (Garey & Wolstenholme Reference Garey and Wolstenholme1989; Ohama et al. Reference Ohama, Osawa, Watanabe and Jukes1990).
Summary data for the sequences of trematodes used for phylogenetic analyses; novel sequences generated in the present study are in bold

* Sequence of ITS1-5.8S-ITS2;
** Originally identified as Lecithodendrium linstowi, see Duan et al. (Reference Duan, Al-Jubury, Kania and Buchmann2021)
To provide the phylogenetic hypotheses for all alignments, Bayesian inference and maximum likelihood analyses were applied. The best-fitting evolutionary model was estimated using the AIC criterion in jModelTest 2.1.2. (Darriba et al. Reference Darriba, Taboada, Doallo and Posada2012). These were the GTR + I + G (Alignments 1, 2, 4, 6, 7, and 10), GTR + G (Alignments 3, 5, and 9), and HKY + I +G (Alignment 8). The maximum likelihood analysis was conducted using PhyML ver. 3.0 (Guindon et al. Reference Guindon, Dufayard, Lefort, Anisimova, Hordijk and Gascuel2010) run on the ATGC bioinformatic platform (http://www.atgc-montpellier.fr/phyml/). Nodal support for the ML analysis was generated by performing 100 bootstrap pseudoreplicates. The Bayesian inference analysis was conducted using MrBayes software ver. 3.2.3 (Ronquist et al. Reference Ronquist, Teslenko, Van Der Mark, Ayres, Darling, Höhna, Larget, Liu, Suchard and Huelsenbeck2012). Markov Chain Monte Carlo simulations were run for 3,000,000 generations, log likelihood scores were recorded to estimate burn-in, and only the last 75% of trees were used to build the consensus tree. FigTree ver. 1.4 software (Rambaut Reference Rambaut2010) was used for the tree visualisation. Nucleotide differences between sequences were estimated using MEGA ver. 11 (Tamura et al. Reference Tamura, Stecher and Kumar2021) using the following conditions: “Variance Estimation Method = None”, “Model/Method = No. of differences” or “p-distance”, and “Substitutions to Include = d: Transitions + Transversions” and “Gaps/Missing Data Treatment = Pairwise deletion”.
Results
In the present study, we found trematode infections in 38 (6.8%) snails of Bithynia tentaculata in two lakes, Loughrea (0.6%, one species recorded in two snails) and Lough Corrib (28.8%, eight species recorded in 36 snails); in the other three lakes, no infections were found (see Table 2). In total, we found nine species of trematodes in B. tentaculata; seven species were recorded as cercariae and three species as metacercariae (Asymphylodora progenetica Serkova & Bykhowskiy, Reference Serkova and Bychovsky1940, Parasymphylodora parasquamosa Kulakova, 1972, and Sphaeridiotrema sp.), and they belong to seven families (Cyathocotylidae, Opisthorchiidae, Lecithodendriidae, Lissorchiidae, Opecoelidae, Psilostomidae). One species recorded as cercariae (i.e. a tailless cercariaeum), A. progenetica, was also observed as a progenetic metacercaria, but genetic analysis was only possible for its cercariae.
List of larval trematode species and their prevalence in % (No. of infected snails) in the faucet snail, Bithynia tentaculata, in Irish lakes in County Galway

* C, cercaria; M, metacercaria
DNA sequence-based identification
Thirty-six novel sequences were generated for 15 trematode isolates; sequences of the partial 28S rRNA (15 sequences), cox1 (9 sequences), nad1 (3 sequences) genes as well as ITS1-5.8S-ITS2 (1 sequence) and ITS2 (8 sequences) regions (see Table 1).
The 28S rDNA phylogeny of available sequences of the Cyathocotylidae demonstrated that the newly sequenced isolate of Cyathocotyle (PP849699) clustered with sequences of Cyathocotyle prussica Mühling, 1896 ex Gasterosteus aculeatus L., and Cyathocotyle sp. 1 ex B. tentaculata in a well-supported clade (Figure 1). Our 28S rDNA sequence and that of C. prussica were identical and differed from the sequence of Cyathocotyle sp. 1 by 0.2–0.3% (2–3 nt). Comparison of ITS1-5.8S-ITS2 sequences of the same isolates demonstrated that our sequence was identical to the sequence of Cyathocotyle sp. 1 and slightly differed by 0.2% (3 nt) from the sequence of C. prussica. The comparison of the cox1 sequences demonstrated a low level of divergence between our sequence and two sequences of C. prussica; it ranged between 0.85 and 1.03% (5–6 nt). Based on these results we suggest that our species and the unidentified species of Cyathocotyle, Cyathocotyle sp. 1, are conspecific with C. prussica. Thus, we detected a single species of Cyathocotyle ex B. tentaculata in our study.
Phylogram resulting from Bayesian inference (BI) analysis based on the 28S rDNA sequences for species of Cyathocotyle and of the Cyathocotylidae with nodal support values shown at the node as BI/ML (maximum likelihood). Only values > 0.90 (BI) and > 70 (ML) are displayed. Scale bar indicates the expected number of substitutions per site. The sequence generated in this study is in bold.

In the phylogenetic analysis for the Lecithodendriidae based on the 28 rDNA sequences, two of our isolates (PP849700 and PP849701) clustered with sequences of Lecithodendrium linstowi Dollfus, 1931 ex B. tentaculata and Radix balthica (L.), whereas the sequences of the third isolate (PP849702) clustered with sequences of an unidentified Lecithodendrium sp. ex B. tentaculata (Figure 2A). The interspecific divergence between L. linstowi and Lecithodendrium sp. was 0.5% (5 nt). Similar to these results, the phylogenetic analyses based on the ITS2 sequences demonstrated that the sequences of two of our isolates (PP849715 and PP849716) clustered with sequences of L. linstowi, and the sequence of the third isolate (PP849717) clustered with sequences of Lecithodendrium sp. and one isolate identified as L. linstowi (Figure 2B). The ITS2 sequences of L. linstowi were identical as well as the ITS2 sequences of Lecithodendrium sp. The interspecific divergence between two species was 1.2% (4 nt). Thus, two species of Lecithodendrium were detected.
Phylogram resulting from Bayesian inference (BI) analysis based on the 28S rDNA sequences (A) and ITS2 sequences (B) for species of Lecithodendrium and of the Lecithodendriidae with nodal support values shown at the node as BI/ML (maximum likelihood). Only values > 0.90 (BI) and > 70 (ML) are displayed. Scale bar indicates the expected number of substitutions per site. Sequences generated in this study are in bold.

The 28S rDNA phylogeny of the Opecoelidae parasitising freshwater fish demonstrated that the newly sequenced isolates clustered with the isolates of Sphaerostoma bramae (Müller, 1776) ex Abramis brama (L.) and an unidentified isolate, Sphaerostoma sp. ex B. tentaculata in a well-supported clade (Figure 3). Sequences of our isolates were identical to the sequence of S. bramae ex A. brama, whereas the sequence of the unidentified isolate, Sphaerostoma sp. differed by 0.25% (3 nt). The ITS2 sequence comparison demonstrated that our sequences and the sequence of the same isolate of Sphaerostoma sp. (MN726988) available in GenBank were identical. Based on these results we suggest that our species and the unidentified isolate of Sphaerostoma, Sphaerostoma sp. are conspecific with S. bramae. Thus, a single species of Sphaerostoma was detected ex B. tentaculata in the present study.
Phylogram resulting from Bayesian inference (BI) analysis based on the 28S rDNA sequences for species of Sphaerostoma and of the Opecoelidae with nodal support values shown at the node as BI/ML (maximum likelihood). Only values > 0.90 (BI) and > 70 (ML) are displayed. Scale bar indicates the expected number of substitutions per site. Sequences generated in this study are in bold.

Both 28S rDNA and cox1 phylogenetic analyses including representatives of the Opistorchiidae demonstrated that our isolates belong to one species of the genus Metorchis Looss, 1899 and were identified to the species level as M. xanthosomus (Creplin, 1846) (Figures 4A, B). The 28S rDNA sequences of our isolates and the isolate of M. xanthosomus ex Fulica atra L. were identical and differed from the sequence of an unidentified isolate, Opisthorchiidae gen. sp. by 0.1% (1 nt). The intraspecific divergence between cox1 sequences was low and ranged between 0.1 and 0.3% (1–3 nt).
Phylogram resulting from Bayesian inference (BI) analysis based on the 28S rDNA sequences (A) and partial cox1 sequences (B) for species of Metorchis and the Opisthorchiidae with nodal support values shown at the node as BI/ML (maximum likelihood). Only values > 0.90 (BI) and > 70 (ML) are displayed. Scale bar indicates the expected number of substitutions per site. Sequences generated in this study are in bold.

Phylogenetic analyses of the Lissorchiidae based on both 28S rDNA and ITS2 sequences demonstrated that the isolates collected in the present study represented two genera and were identified to the species level (Figure 5A, B). Two cercariaeum isolates of Asymphylodora Looss, 1899 (PP849710 and PP849711) clustered with sequences of isolates of A. progenetica ex B. tentaculata and with a sequence of an unidentified isolate of Asymphylodora sp. ex B. tentaculata in a well-supported clade. The sequence divergence in this clade was low, 0–0.1% (0–1 nt). The 28S rDNA sequence of the metacercarial isolate of Parasymphylodora Szidat, 1943 clustered with a sequence of P. parasquamosa ex B. tentaculata; the sequences were identical. The ITS2 sequences of A. progenetica were identical as well as the ITS2 sequences of P. parasquamosa. Thus, two species of lissorchiids belonging to two genera were found in our study parasitising B. tentaculata in Ireland.
Phylogram resulting from Bayesian inference (BI) analysis based on the 28S rDNA sequences (A) and ITS2 sequences (B) for species of Asymphylodora, Parasymphylodora, and the Lissorchiidae with nodal support values shown at the node as BI/ML (maximum likelihood). Only values > 0.90 (BI) and > 70 (ML) are displayed. Scale bar indicates the expected number of substitutions per site. Sequences generated in this study are in bold.

The 28S rDNA phylogeny of available sequences of the Psilostomidae demonstrated that the sequences of three isolates generated in the present study grouped with the representatives of Sphaeridiotrema Odhner, 1913 in a well-supported clade (Figure 6A). Within this clade, our isolates clustered with two unidentified isolates, Sphaeridiotrema sp. ex B. tentaculata and an isolate of Sphaeridiotrema aziaticum Kalinina, Tatonova & Besprozvannykh, 2022 ex Gallus gallus (L.) f. dom. The latter sequence differs from other identical sequences in the same clade by 0.1% (1 nt). Three nad1 sequences generated for our isolates of Sphaeridiotrema sp. were identical. There were no nad1 or any other mitochondrial sequences of Sp. aziaticum available for comparison; however, our sequences showed 0.2% (1 nt) difference from the nad1 sequence of an unidentified Sphaeridiotrema sp. ex B. tentaculata collected in Germany (MN720149) and 25.3% (110 nt) difference from sequences of Sphaeridiotrema pseudoglobulus McLaughlin, Scott & Huffman, 1993 ex Aythya affinis (Eyton, TC 1838) in the USA (MW963182). Thus, a single species of psilostomids was detected in our study.
Phylogram resulting from Bayesian inference (BI) analysis based on the 28S rDNA sequences for species of Sphaeridiotrema and of the Psilostomidae (A) and for species of Notocotylus and of the Notocotylidae (B) with nodal support values shown at the node as BI/ML (maximum likelihood). Only values > 0.90 (BI) and > 70 (ML) are displayed. Scale bar indicates the expected number of substitutions per site. Sequences generated in this study are in bold.

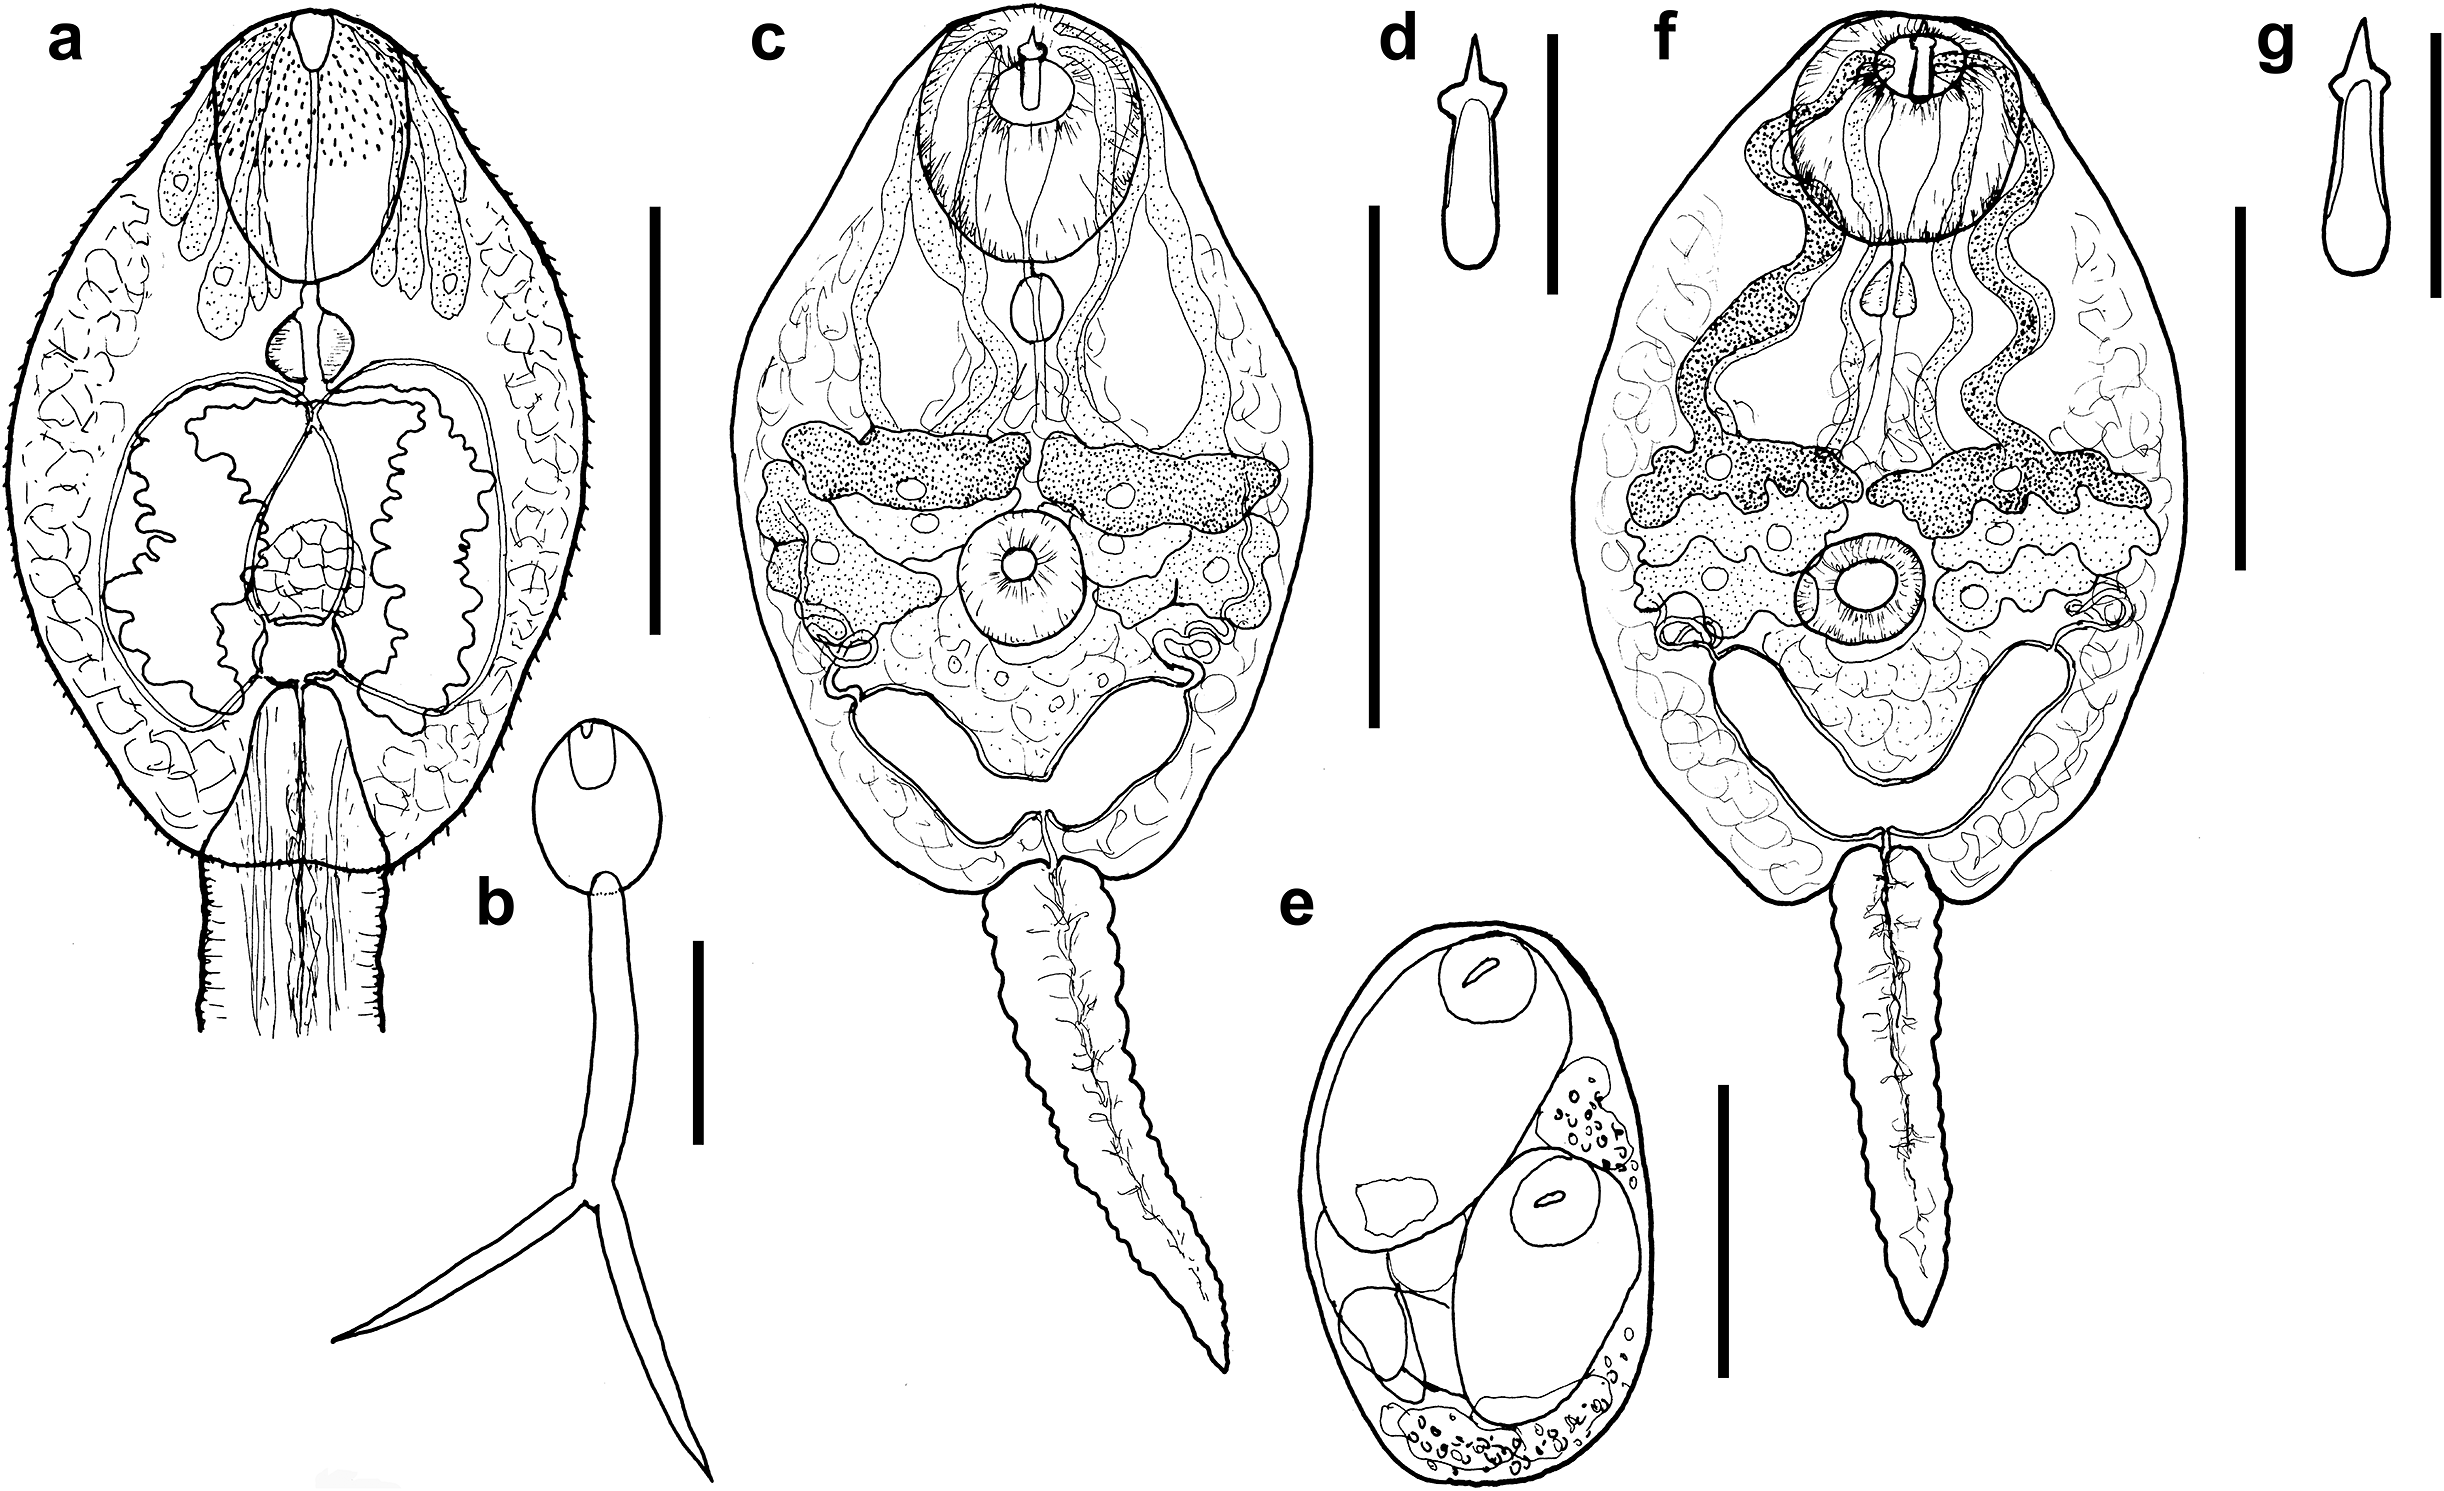
Morphology of trematodes ex Bithynia tentaculata. (A, B) Cyathocotyle prussica (A, ventral view of body; B, total view); (C–E) Lecithodendrium linstowi (C, total view; D, stylet; E, sporocyst); (F, G) Lecithodendrium sp. (F, total view; G, stylet). Scale bars: A, C, E, 100 μm; B, 200 μm; D, G, 20 μm; F, 50 μm.
In the phylogenetic analysis for the Notocotylidae based on the 28S rDNA sequences, our newly sequenced isolate (PP849713) clustered with two sequences of unidentified isolates, Notocotylus sp. ex B. tentaculata in a well-supported clade with the type species of the genus, Notocotylus attenuatus (Rudolphi, 1809) (Figure 6B). The three sequences were identical and differed from the closely related N. attenuatus by 0.3% (3 nt). A single species of notocotylids was detected from B. tentaculata in our study.
Thus, our DNA sequence data analyses identified nine species of trematodes, namely C. prussica, L. linstowi, Lecithodendrium sp., A. progenetica, P. paraquamosa, S. bramae, M. xanthosomus, Sphaeridiotrema sp., and Notocotylus sp. parasitising snails of B. tentaculata in Ireland.
Taxonomic summary and morphological descriptions
Cyathocotylidae Mühling, 1898
Cyathocotyle prussica Mühling, 1896
First intermediate host: Bithynia tentaculata (L.) (Gastropoda, Littorinimorpha).
Site of infection: hepatopancreas.
Locality: Loughrea, Ireland.
Prevalence: 0.6% (2 of 320 snails).
Representative DNA sequences: PP849699 (28S), PP849714 (ITS1-5.8S-ITS2) and PP840844 (cox1).
Voucher material: cercariae (isogenophores) in ethanol in one vial (Coll. No. NMINH: 2024.5.1., coll. 27.vii. 2019).
Cercaria (Figures 7 A, B)
[Description and measurements based on four live specimens.] Body oval, with maximum width at its mid-level, 170–221 × 120–141 (185 × 131). Anterior organ oval, with sub-terminal mouth opening, 50–71 × 47–57 (61 × 51). Ventral sucker absent. Prepharynx short, distinct, of c. half-length of pharynx, 7–11 (10). Pharynx well-developed, oval to pear-shaped, 16–21 × 18–19 (19 × 19). Oesophagus very short, shorter than prepharynx. Intestinal bifurcation just posterior to pharynx. Caeca well-developed, conspicuous, with wide lumen and undulating edges, reaching back to junction of body with tail stem. Cystogenous gland cells in lateral part of body, posterior to anterior organ, extending to posterior extremity of body. Penetration gland cells of different size, with short ducts, of at least four pairs, with fine granular content and nucleus, surrounding anterior organ and reaching back to level of pharynx or slightly beyond; ducts opening anterolaterally to anterior organ. Genital anlagen just anterior to excretory vesicle, 22–27 × 22–31 (25 × 27). Excretory vesicle transversely oval, thin-walled. Main excretory vessels ascending from excretory vesicle in two pairs, median pair uniting at c. mid-body to a short channel that bifurcates and fuses with the ascending lateral vessels in the first half of body. Excretory pore with Cort’s isle, running through tail stem and opening at tips of furca. Flame cell formula not observed. Tail bifurcate; tail stem, 285–354 × 40–55 (324 × 46), longer than body, TSL/BL ratio 1:1.49–1.90 (1.71). Furca with sharply pointed tips, without fin-folds, 254–295 × 21–29 (273 × 27); slightly shorter than tail stem, TSL/FL ratio 1:1.12–1.36 (1.21).
Body spination: Circumoral spines surrounding the first half of anterior organ, larger than tegumental spines, of c. 10 rows. Tegumental spines small, slender, with sharp tip, backwards oriented, longer in forebody, becoming shorter posteriorly, distributed on whole body, only ventral area delimited by median excretory vessels devoid of spines. Very fine, slender spines on tail stem and furca.
Measurements of cercariae fixed in ethanol (based on 11 specimens; not all specimens contributed a data point to all metrical variables): Body 162–218 × 78–106 (185 × 95). Oral sucker 31–53 × 35–46 (44 × 40). Tail stem 299–325 × 29–39 (312 × 35). Furca 202–261 × 24–25 (228 × 25). TSL/BL ratio 1:1.39–1.99 (1.66). TSL/FL ratio 1.28–1.57 (1.39).
Remarks
The present cercariae correspond well in morphology to Cyathocotyle Mühling, 1896 in the presence of a characteristic excretory system with main collecting vessels united in a central anastomosis, a forked tail, and the absence of a ventral sucker (Yamaguti Reference Yamaguti1975). Schwelm et al. (Reference Schwelm, Kudlai, Smit, Selbach and Sures2020) summarised that nine species of cyathocotylids have been reported from B. tentaculata in Europe (C. bithyniae Sudarikov, 1974, C. bushiensis (Khan, Reference Khan1962), C. prussica, Holostephanus cobitidis Opravilová, 1968, H. curonensis (Szidat, 1933), H. dubinini Vojtek & Vojtková, 1968, H. luehei Szidat, 1936, H. volgensis (Sudarikov, 1962), Prohemistomum vivax (Sonsino, 1892)) and added two more species, Cyathocotyle sp. 1 and Cyathotocyle sp. 2, of which we consider Cyathocotyle sp. 1 conspecific with our material (see above). The morphology of our cercariae agrees well with that of Cyathocotyle sp. 1 of Schwelm et al. (Reference Schwelm, Kudlai, Smit, Selbach and Sures2020) in possessing ten rows of postoral spines (vs. 10–12), a short but distinct oesophagus, furcae without fin-folds, and conspicuous caeca with quite wide lumen and undulating edges. Also, the material overlaps in dimensions, although our cercariae exhibit higher minima and maxima for body, tail stem, furca, and anterior organ size. The life cycle of C. prussica was described by Mathias (Reference Mathias1935) (originally as C. gravieri Mathias, Reference Mathias1935). The dimensions of our cercariae agree well with those provided by Mathias (Reference Mathias1935). Kanev (Reference Kanev and Vasilev1984) completed the life cycle of C. prussica experimentally, based on material of cercariae from naturally infected B. tentaculata in Bulgaria. The dimensions of our material overlap with those of Kanev (Reference Kanev and Vasilev1984), although the body of our cercariae is larger (162–218 vs. 136–169). Our material of C. prussica differs from C. bithyniae of Niewiadomska (Reference Niewiadomska1980) in the absence of fin-folds on furca (vs. small triangular fin-folds at the tips of furca), in a larger body (162–218 vs. 161–187) and longer tail stem (299–325 vs. 192–204) and furca (202–261 vs. 119–153). From C. bushiensis of Khan (Reference Khan1962) our cercariae differ in the number and arrangement of penetration gland cells (most probably four, reaching up to pharynx or slightly beyond vs. numerous, in three groups reaching to caeca, ‘between the intestinal caeca’), in a larger body (162–218 vs. 103–133), in a longer and narrower tail stem (299–325 × 29–39 vs. 266–286 × 40–56), i.e. the tail-stem of C. bushiensis appears as more robust and wide in relation to body. In Europe, C. prussica was much more commonly recorded as adults from waterfowl or as metacercariae in fishes or frogs (Razmashkin Reference Razmashkin1975; Sitko et al. Reference Sitko, Faltýnková and Scholz2006; Sulgostowska Reference Sulgostowska2007; Rząd et al. Reference Rząd, Sitko, Kavetska and Kalisińska2013; Kvach et al. Reference Kvach, Ondračková and Jurajda2016). The first DNA sequences were obtained from metacercariae ex Gasterosteus aculeatus in Germany by Locke et al. (Reference Locke, van Dam, Caffara, Pinto, López-Hernández and Blanar2018); however, no sequences of adults exist.
Lecithodendriidae Lühe, 1901
Lecithodendrium linstowi Dollfus, 1931
First intermediate host: Bithynia tentaculata (L.) (Gastropoda, Littorinimorpha).
Site of infection: hepatopancreas.
Locality: Lough Corrib, Ireland.
Prevalence: 1.6% (2 of 125 snails).
Representative DNA sequences: PP849700, PP849701 (28S), PP849715, PP849716 (ITS2), PP844658, PP844659 (cox1).
Voucher material: cercariae (isogenophores) in ethanol in two vials (Coll. No. NMINH: 2024.5.2., NMINH: 2024.5.3., coll. 31.vii. 2019).
Cercaria (Figures 7C–E)
[Description and measurements based on four live specimens.] Body oval, wider in anterior half, maximum width at its mid-level; 140–163 × 66–114 (151 × 93). Tegumental spines fine, dense, backwards directed, on whole body. Oral sucker well-developed, muscular, rounded, with sub-terminal mouth opening, 30–48 × 24–42 (42 × 36). Stylet dorsal to mouth opening, robust, sharply pointed, with well-developed anterior lateral thickening of similar width as base, base well sclerotised, 17–19 × 4–5 (18 × 5). Virgula absent. Ventral sucker well-developed, rounded, just postequatorial, 18–23 × 15–30 (21 × 23). Ventral sucker smaller than oral sucker, VSW/OSW 1:0.53–0.77 (1:0.61). Prepharynx very short, shorter than pharynx. Pharynx rounded to oval, feebly muscular, 8–17 × 7–14 (12 × 11). Oesophagus short, narrow. Intestinal bifurcation and caeca not observed. Cystogenous gland cells throughout body, numerous, delicate, transparent. Penetration gland cells large, of three pairs, with large nuclei, first pair anterior to ventral sucker, with coarse granular content; second pair anterolateral to ventral sucker, with almost transparent content; third pair lateral to ventral sucker, with fine granular content; ducts narrow, passing laterally and medially in body, opening anterolaterally to stylet. Genital anlagen just posterior to ventral sucker. Excretory vesicle V-shaped, thin-walled, arms extending up to posterior level of ventral sucker, 37 long. Ascending excretory vessels forming a glomerulus on both sides posterior to penetration gland cells. Flame cell formula not observed. Tail simple, contractile, with slightly undulating margins, tapered distally, 70–108 × 16–25 (85 × 20). Tail shorter than body, TL/BL ratio 1:0.48–0.76 (0.57).
Measurements of cercariae fixed in ethanol (based on 18 specimens; not all specimens contributed a data point to all metrical variables): Body 93–135 × 48–89 (111 × 66). Oral sucker 21–35 × 20–39 (28 × 31). Ventral sucker 15–20 × 17–24 (28 × 31). VSW/OSW 1:0.51–0.77 (1:0.87). Stylet 11–17 × 3–4 (15 × 4). Pharynx 8 × 7–8. Tail 71–120 × 13–18 (96 × 15). TL/BL ratio 1:0.73–114 (0.87).
Sporocyst (Figure 7E)
[Based on four live specimens.] Body small, oval, 162–192 × 103–122 (179 × 110); containing 1–2 cercariae of advanced development.
Remarks
The morphology of the present cercariae agrees well with that of the genus Lecithodendrium Looss, 1896 in the presence of a stylet, a V-shaped excretory vesicle and penetration gland cells anterolateral to ventral sucker (Kudlai et al. Reference Kudlai, Stunžėnas and Tkach2015). The virgula, which was considered the most typical character for the Lecithodendriidae and other families considered as the ‘virgulate group’, is absent; this was discussed recently by Kudlai et al. (Reference Kudlai, Stunžėnas and Tkach2015) and Enabulele et al. (Reference Enabulele, Lawton, Walker and Kirk2018), who hinted that the virgula cannot be considered a synapomorphic feature any longer. Cercariae of L. linstowi were recorded by Enabulele et al. (Reference Enabulele, Lawton, Walker and Kirk2018) from the United Kingdom and by Schwelm et al. (Reference Schwelm, Kudlai, Smit, Selbach and Sures2020) from Germany who both provided a morphological characterisation linked to DNA sequences. While Schwelm et al. (Reference Schwelm, Kudlai, Smit, Selbach and Sures2020) recorded B. tentaculata as first intermediate host, Enabulele et al. (Reference Enabulele, Lawton, Walker and Kirk2018) reported Radix balthica, which is peculiar. The present cercariae correspond well in morphology and in dimensions with the description of Schwelm et al. (Reference Schwelm, Kudlai, Smit, Selbach and Sures2020), exhibiting lower minima for body size and a higher maximum for tail length. However, we cannot reliably compare our material with that of Enabulele et al. (Reference Enabulele, Lawton, Walker and Kirk2018), as the description is quite general, and the figures do not reveal any details useful for identification. Moreover, the cercariae of Enabulele et al. (Reference Enabulele, Lawton, Walker and Kirk2018) are all conspicuously smaller than our material and that of Schwelm et al. (Reference Schwelm, Kudlai, Smit, Selbach and Sures2020), raising doubts on fixation methods. Adults of Lecithodendrium linstowi are among the most common parasites of a wide spectrum of bats in Eurasia (Esteban et al. Reference Esteban, Amengual and Cobo2001; Lord et al. 2012; Horvat et al. Reference Horvat, Čabrilo, Paunović, Karapandž, Jovanović, Budinski and Čabrilo2017). In Europe, they are widely distributed, and Kudlai et al. (Reference Kudlai, Stunžėnas and Tkach2015) pointed out that they found identical L. linstowi from different bat species in the United Kingdom and in Ukraine. Aquatic insect larvae are used as second intermediate hosts, which can ensure wide dispersion when they metamorphose to imagoes (Kudlai et al. Reference Kudlai, Stunžėnas and Tkach2015; Enabulele et al. Reference Enabulele, Lawton, Walker and Kirk2018).
Lecithodendrium sp.
First intermediate host: Bithynia tentaculata (L.) (Gastropoda, Littorinimorpha).
Site of infection: hepatopancreas.
Locality: Lough Corrib, Ireland.
Prevalence: 0.8% (1 of 125 snails).
Representative DNA sequences: PP849702 (28S), PP849717 (ITS2), and PP844660 (cox1).
Voucher material: cercariae (isogenophores) in ethanol in one vial (Coll. No. NMINH: 2024.5.4., coll. 31.vii. 2019).
Cercaria (Figures 7F, G)
[Description and measurements based on two live specimens.] Body elongate-oval, with maximum width at its mid-level, 126–134 × 57–106 (130 × 75). Tegumental spines minute, dense, on whole body. Oral sucker well-developed, muscular, rounded to oval, with sub-terminal mouth opening, 36–39 × 31. Stylet dorsal to mouth opening, robust, relatively large, sharply pointed, with well-developed anterior lateral thickening, base well sclerotised, 18–19 × 5. Ventral sucker well-developed, muscular, rounded to transversely oval, postequatorial, 18–25 × 20–22 (22 × 21). Ventral sucker smaller than oral sucker, VSW/OSW 1:0.65. Prepharynx short. Pharynx small, feebly muscular, 7 × 6. Oesophagus, intestinal bifurcation, and caeca not observed. Cystogenous gland cells numerous, delicate, transparent. Penetration gland cells of three pairs, quite large, first pair anterior to ventral sucker, with darkish, coarse granular content; second and third pair smaller, anterolateral to ventral sucker, with fine granular content; ducts passing laterally and medially in body, opening anterolaterally to stylet. Genital anlagen just posterior to ventral sucker. Excretory vesicle V-shaped, thin-walled, arms extending up to one third of body length, 33–37 long. Ascending excretory vessels forming a glomerulus laterally, posterior to penetration gland cells. Flame cell formula not observed. Tail simple, contractile, with undulating margins, shorter than body, tapered distally, 86–141 × 16–18 (105 × 17).
Measurements of cercariae fixed in ethanol (based on 22 specimens; not all specimens contributed a data point to all metrical variables): Body 101–137 × 45–96 (124 × 65). Oral sucker 21–36 × 23–39 (29 × 30). Ventral sucker 15–21 × 16–23 (18 × 20). VSW/OSW 1:0.41–0.91 (1:0.64). Stylet 12–17 × 3–4 (16 × 4). Pharynx 8–9 × 7–8 (8 × 7). Tail 60–138 × 12–18 (93 × 15). TL/BL ratio 1:0.49–1.15 (0.74).
Remarks
The present cercariae agree well in their morphology with that of the genus Lecithodendrium in characters as stated above (Kudlai et al. Reference Kudlai, Stunžėnas and Tkach2015). The present cercariae of Lecithodendrium sp. are very similar in morphology and dimensions to L. linstowi, but they differ in the shape of the stylet (the lateral thickening is less prominent in Lecithodendrium sp.; see Figures 7D and 7G) and in the content of penetration gland cells (second and third pair with the same fine granular content vs. second pair with finer, more transparent content than third pair). The present cercariae are identical with those ex B. tentaculata from Lithuania of Kudlai et al. (Reference Kudlai, Stunžėnas and Tkach2015) (see molecular part), which were originally described as Cercaria helvetica XII by Dubois (Reference Dubois1928) from Switzerland and later reported from the Curonian Bay in Lithuania by Bykovskaya-Pavlovskaya & Kulakova (1971). Another recent record is from B. tentaculata in Denmark, where Lecithodendrium sp. was reported as the most common by Duan et al. (Reference Duan, Al-Jubury, Kania and Buchmann2021), who however, erroneously identified them as L. linstowi. It seems that this species is widely distributed and common in Europe as L. linstowi, but because they are very closely related, careful identification via an integrative approach is necessary.
Opecoelidae Ozaki, 1925
Sphaerostoma bramae (Müller, 1776) Lühe, 1909
First intermediate host: Bithynia tentaculata (L.) (Gastropoda, Littorinimorpha).
Site of infection: hepatopancreas.
Locality: Lough Corrib, Ireland.
Prevalence: 1.6% (2 of 125 snails).
Representative DNA sequences: PP849703, PP849704 (28S) and PP849718, PP849719 (ITS2).
Voucher material: cercariae (isogenophores) in ethanol in two vials (Coll. No. NMINH: 2024.5.5., NMINH: 2024.5.6., coll. 31.vii. 2019).
Cercaria (Figures 8A, B)
[Description and measurements based on two live specimens.] Cotylomicrocercous cercaria. Body elongate-oval, maximum width at anterior level of ventral sucker; 295–331 × 126–155 (313 × 141). Tegument thick, devoid of spines; numerous sensory papillae on body surface and on both suckers. Oral sucker well-developed, muscular, sub-spherical, with sub-terminal mouth opening, with 3–5 rows of minute spines, 61–62 × 55–61 (61 × 58). Stylet dorsal to mouth opening, minute, pointed, with slight anterior lateral thickening, base well sclerotised, 10–11 × 5. Ventral sucker large, well-developed, muscular, sub-spherical, just postequatorial, with c. three rows of minute spines, 67–72 × 73–75 (70 × 74). Ventral sucker larger than oral sucker, VSW/OSW 1:1.23–1.32 (1.27). Prepharynx long, narrow, curved. Pharynx well-developed, sub-spherical, muscular, 22 × 23. Oesophagus long, narrow, curved. Intestinal bifurcation anterior to ventral sucker. Caeca narrow, obscured by gland cells, extent not observed. Cystogenous gland cells small, numerous, delicate, transparent. Penetration gland cells small, of five pairs, with fine granular content, anterior to ventral sucker; ducts narrow, passing laterally in two strands each, opening anterolaterally to stylet. Genital anlagen of two, compact, transparent masses of cells, first anterodorsal to ventral sucker, second posterodorsal to ventral sucker. Excretory vesicle large, thick-walled, strawberry-shaped, filling most space of hindbody, 81–88 × 86–90 (84 × 88). Flame cell formula not observed. Cotylocercous tail simple, knob-like, with posterior concavity, 27–39 × 40–46 (33 × 43). Tail much shorter than body, TL/BL ratio 1:0.08–0.13 (0.11).
Measurements of cercariae fixed in ethanol (based on 12 specimens; not all specimens contributed a data point to all metrical variables): Body 221–319 × 82–115 (274 × 99). Oral sucker 49–60 × 46–59 (55 × 50). Ventral sucker 54–77 × 55–71 (63 × 63). VSW/OSW 1:1.20–1.40 (1:1.27). Stylet 10–13 × 3–4 (11 × 3). Prepharynx 18–24 (20) long. Pharynx 19–25 × 16–28 (23 × 22). Excretory vesicle 64–96 × 55–75 (78 × 65). Tail 26–45 × 29–37 (35 × 34). TL/BL ratio 1:0.11–0.15 (0.13).
Remarks
The present cercariae correspond well in morphology to that of Sphaerostoma Rudolphi, 1809 in the presence of a short, cotylocercous tail, a minute stylet, well-developed, muscular suckers and pharynx, and the ventral sucker being larger than the oral sucker (Pike Reference Pike1967; Bykhovskaya-Pavlovskaya & Kulakova Reference Bykhovskaya-Pavlovskaya and Kulakova1971). In morphology and dimensions, our cercariae correspond to those of Sphaerostoma sp. of Schwelm et al. (Reference Schwelm, Kudlai, Smit, Selbach and Sures2020), apart from the number of penetration gland cells, of which we observed five pairs (vs. four pairs). This difference could be due to the fact that the penetration gland cells are difficult to observe as they are partly obscured by cystogenous gland cells. Most of the other authors providing a description of S. bramae (Wesenberg-Lund Reference Wesenberg-Lund1934; Wikgren Reference Wikgren1956; Chernogorenko-Bidulina & Bliznyuk Reference Chernogorenko-Bidulina and Bliznyuk1960; Zdun Reference Zdun1961; Pike Reference Pike1967; Bykhovskaya-Pavlovskaya & Kulakova Reference Bykhovskaya-Pavlovskaya and Kulakova1971) reported four pairs, except for Našincová (Reference Našincová1992), who observed five pairs in her record of Sphaerostoma sp. from B. tentaculata in the Czech Republic. Our material of cercariae overlaps in dimensions with those of the cercariae provided by the above authors (partly reported as Cercaria micrura Filippi, 1857); however, some authors (Wesenberg-Lund Reference Wesenberg-Lund1934; Wikgren Reference Wikgren1956; Pike Reference Pike1967) give much higher maxima of body size (up to 450 μm). Also, a differing number of tegumental spines on suckers has been reported, i.e. three rows of spines on both suckers by Bykhovskaya-Pavlovskaya & Kulakova (Reference Bykhovskaya-Pavlovskaya and Kulakova1971) and two and three rows, respectively by Pike (Reference Pike1967), while we observed 3–5 rows on the oral sucker and three rows of spines on the ventral sucker. Koval (Reference Koval1971) and Našincová (Reference Našincová1992) doubted that the above-mentioned records of cercariae of S. bramae would all belong to one species only. Indeed, the wide size range and the differences in morphology mentioned could indicate that more species are involved. Sphaerostoma bramae is a common fish parasite in Europe, and its cercariae were frequently reported ex B. tentaculata in Denmark, Finland, Great Britain, Lithuania, Netherlands, Russia, and Ukraine (Wesenberg-Lund Reference Wesenberg-Lund1934; Wikgren Reference Wikgren1956; Chernogorenko-Bidulina Reference Chernogorenko-Bidulina1958; Ginetsinskaya Reference Ginetsinskaya1959; Zdun Reference Zdun1961; Pike Reference Pike1967; Bykhovskaya-Pavlovskaya & Kulakova Reference Bykhovskaya-Pavlovskaya and Kulakova1971; Keulen Reference Keulen1981; Petkevičiūtė et al. Reference Petkevičiūtė, Stanevičiūtė and Kiselienė1995; Schwelm et al. Reference Schwelm, Kudlai, Smit, Selbach and Sures2020). Moreover, Chernogorenko-Bidulina (Reference Chernogorenko-Bidulina1958) and Zdun (Reference Zdun1961) reported apart from B. tentaculata also Lithoglyphus naticoides (Pfeiffer) and Theodoxus fluviatilis (L.) as first intermediate hosts. In Europe, there were four other species of Sphaerostoma recorded, S. globiporum (Rudolphi, 1802), S. minus Szidat, 1944, S. romanicum Dinulescu, 1942, and S. salmonis Slusarski, 1958, but their life cycles are thus far unknown. From Ireland, adults of S. bramae were reported by Vickers (Reference Vickers1951) and Kane (Reference Kane1966) from bream, rudd, and pike; in the United Kingdom, S. bramae was reported from fishes in several places (Nicoll Reference Nicoll1924; Kennedy Reference Kennedy1974), indicating that it is a common species in Western Europe.
Opisthorchiidae Looss, 1899
Metorchis xanthosomus (Creplin, 1846) Braun, 1902
First intermediate host: Bithynia tentaculata (L.) (Gastropoda, Littorinimorpha).
Site of infection: hepatopancreas.
Locality: Lough Corrib, Ireland.
Prevalence: 2.4% (3 of 125 snails).
Representative DNA sequences: PP849705, PP849706 (28S) and PP840845, PP840846 (cox1).
Voucher material: cercariae (isogenophores) in ethanol in two vials (Coll. No. NMINH: 2024.5.7., NMINH: 2024.5.8., coll. 31.vii. 2019).
Cercaria (Figures 8C, D)
[Description and measurements are based on seven live specimens. Not all specimens contributed a data point to all metrical variables.] Pleurolophocercaria. Body elongate-oval, with maximum width in mid-body, with brownish pigment located in body posterior to oral sucker; 150–264 × 61–102 (203 × 85). Tegument thick. Tegumental spines minute, arranged in rows, extending from oral sucker level up to eyespots laterally. Eyespots conspicuous, with black pigment, crescent to square-shaped, in first half of forebody, 6–9 × 8–13 (8 × 10). Oral sucker sub-spherical, muscular, 38–56 × 35–46 (43 × 39), with sub-terminal mouth opening and protrusible anterodorsal tip. Anterior part of protrusible tip armed with spines larger than tegumental spines, arranged in three rows with seven, six, and four spines. Ventral sucker rudimentary, postequatorial. Prepharynx very short, 5 long. Pharynx small, feebly muscular, posterior to oral sucker, 10–12 × 11–13 (11 × 12). Oesophagus, intestinal bifurcation, and caeca not observed, obscured by ducts of penetration gland cells. Cystogenous gland cells large, with coarse granular content, posterior to eyespots, extending to posterior extremity of body. Penetration gland cells large, of six pairs, with coarse granular content, in median part of body; ducts wide, median, dividing posterior to oral sucker into two strands on each side, opening anterolaterally to tip of oral sucker. Genital anlagen just anterior to excretory vesicle, of transparent, compact cells. Excretory vesicle large, rounded, thick-walled, 38 × 34. Flame cell formula not observed. Caudal excretory pore forked, opening in proximal fifth of tail. Tail, long, simple, contractile, with tapered tip, 382–455 × 23–24 (415 × 24). Tail longer than body, TL/BL ratio 1:1.57–2.55 (2.12). Tail with fin-folds; in distal half of tail, conspicuous dorso-ventral fin-fold, 22–33 (27) wide, surrounding tip of tail; proximal half of tail with a dorso-ventral dilatation of tegument (fin-fold-like), 12–23 (16) wide.
Measurements of cercariae fixed in ethanol (based on 18 specimens; not all specimens contributed a data point to all metrical variables): Body 161–203 × 50–71 (182 × 70). Oral sucker 28–43 × 27–37 (37 × 30). Eyespot 6–11 × 7–13 (8 × 9). Pharynx 8–10 × 7–10 (9 × 9). Excretory vesicle 33 × 36. Tail 314–387 × 21–36 (341 × 25). TL/BL ratio 1:1.55–2.24 (1.87). Width of dorso-ventral fin-fold of tail 6–8 (7). Width of dorso-ventral dilatation of tegument in proximal part of tail 11–18 (14).
Remarks
The morphology of the present cercariae corresponds well in characters with the genus Metorchis Looss, 1899, i.e. in the pleurolophocercaria-type with eyespots, a rudimentary ventral sucker and long tail with fin-folds (Heinemann Reference Heinemann1937). However, because of close similarity to cercariae of Opisthorchis, a confirmation with molecular genetic methods is of vital importance. In Europe, four species of Metorchis have been reported from B. tentaculata: Metorchis bilis (Braun, 1790), M. intermedius Heinemann, 1937, M. xanthosomus, and Metorchis sp. (summarised by Schwelm et al. Reference Schwelm, Kudlai, Smit, Selbach and Sures2020; see also Zdun Reference Zdun1961; Bykhovskaya-Pavlovskaya & Kulakova Reference Bykhovskaya-Pavlovskaya and Kulakova1971; Cichy et al. Reference Cichy, Faltýnková and Żbikowska2011). As adults, there have been several known species of Metorchis, most of which are now considered synonyms either of M. bilis (Braun, 1790), (M. albidus (Braun, 1893), and M. crassiusculus (Rudolphi, 1809) or of M. xanthosomus (M. intermedius) (for details see Sitko et al. Reference Sitko, Bizos, Sherrard-Smith, Stanton, Komorová and Heneberg2016), indicating the complex taxonomy within this genus. Metorchis intermedius was originally described by Heinemann (Reference Heinemann1937) from B. tentaculata in the Curonian Lagoon, and adults were obtained experimentally from ducks (Anas boschas). Heinemann (Reference Heinemann1937) considered the characters of his species close to M. xanthosomus (obtained previously by Szidat from the same place but not published) but described the species as new because of differences in body spination in adults. We are of the opinion that the worms of Heinemann (Reference Heinemann1937) are identical to those of M. xanthosomus as defined by Sitko et al. (Reference Sitko, Bizos, Sherrard-Smith, Stanton, Komorová and Heneberg2016) (extent of reproductive organs relative to body length). Our material of cercariae corresponds well in morphology and dimensions to those provided by Heinemann (Reference Heinemann1937), only we observed a differing number of penetration gland cells (six pairs vs. seven pairs). The present cercariae are similar to those of Opisthorchiidae gen. sp. of Schwelm et al. (Reference Schwelm, Kudlai, Smit, Selbach and Sures2020): the dimensions of body overlap, the tail of our cercariae is slightly shorter (314–387 vs. 437–494), and the number of penetration gland cells corresponds (six pairs).
Species of Metorchis are parasites of birds and mammals, including man, and can cause serious chronic diseases (Sitko et al. Reference Sitko, Bizos, Sherrard-Smith, Stanton, Komorová and Heneberg2016). Metorchis bilis is considered much more common in Europe than M. xanthosomus; their cercariae are morphologically very close, and they both use B. tentaculata as the first intermediate host (Mordvinov et al. Reference Mordvinov, Yurlova, Ogorodova and Katokhin2012; Sitko et al. Reference Sitko, Bizos, Sherrard-Smith, Stanton, Komorová and Heneberg2016). The two species differ in the definitive host spectrum: M. xanthosomus uses ducks and coots as definitive hosts, whereas M. bilis uses both mammals and birds (birds of prey and cormorants). Not only cercariae, but adults are also difficult to identify by morphology; therefore, the identity of opisthorchiid trematodes should always be verified by molecular genetic methods.
Psilostomidae Looss, 1900
Sphaeridiotrema sp.
First intermediate host: Bithynia tentaculata (L.) (Gastropoda, Littorinimorpha).
Site of infection: mantle cavity.
Locality: Lough Corrib, Ireland.
Prevalence: 3.2% (4 of 125 snails).
Representative DNA sequences: PP849707, PP849708, PP849709 (28S) and PP856383, PP856384, PP856385 (nad1).
Voucher material: metacercariae (isogenophores) in ethanol in one vial (Coll. No. NMINH: 2024.5.9., coll. 31.vii. 2019).
Metacercaria
[Description and measurements based on two live specimens.] Metacercaria rounded, 130–142 × 122–143 (136 × 136). Cyst wall relatively thick, 7–8 (8), difficult to excyst. Oral sucker 50 × 51; ventral sucker 39 × 55; pharynx 31 × 21. Excretory vesicle inconspicuous, with dilated main collecting channels ascending to oral sucker. Conspicuous excretory granules c. 15–21 in number in main collecting channels, 9–17 × 7–10 (11 × 9).
Remarks
The present metacercariae were found encysted in the tissue of snails. They were identified based on results of phylogenetic analyses. When comparing their morphology with that of the members of the genus Sphaeridiotrema Odhner, 1913, they agree in the shape of the cyst, thickness of the wall, and the presence of conspicuous excretory granules in large collecting excretory channels (Yamaguti Reference Yamaguti1975; Kalinina et al. Reference Kalinina, Tatonova and Besprozvannykh2022); however, these characters are too general for any exact identification. Recently, Schwelm et al. (Reference Schwelm, Kudlai, Smit, Selbach and Sures2020) recorded cercariae of Sphaeridiotrema sp. in Germany and summarised the occurrence of species of the genus Sphaeridiotrema in B. tentaculata in Europe: S. globulus being recorded in Bulgaria, Finland, Russia, and United Kingdom, and Sphaeridiotrema sp. of Tkach et al. (Reference Tkach, Kudlai and Kostadinova2016) from Lithuania (for detailed references see Schwelm et al. Reference Schwelm, Kudlai, Smit, Selbach and Sures2020). Based on molecular genetic results, our material is close to S. aziaticum Kalinina, Tatonova & Besprozvannykh, 2022 described from the Russian Far East, which is peculiar. To clarify this case, more sequences of members of the Psilostomidae from different geographical locations are necessary. Species of the genus Sphaeridiotrema are pathogenic parasites of waterfowl (anatids, charadriids). They are widespread in Europe, Asia, and North America (Kostadinova Reference Kostadinova, Jones, Bray and Gibson2005; Bergame et al. Reference Bergame, Huffman, Cole, Dayanandan, Tkach and McLaughlin2011). As many of the bird hosts are migratory, they could ensure a potentially wide dispersion of the trematodes.
Lissorchiidae Magath, 1917
Asymphylodora progenetica Serkova & Bykhowskiy, 1940
First and second intermediate host: Bithynia tentaculata (L.) (Gastropoda, Littorinimorpha).
Site of infection: hepatopancreas (cercariaeum), mantle cavity (metacercaria).
Locality: Lough Corrib, Ireland.
Prevalence: 1.6% (2 of 125 snails).
Representative DNA sequences: PP849710, PP849711 (28S), PP849720, PP849721 (ITS2), and PP840847, PP840848 (cox1).
Cercariaeum and metacercaria
No sufficiently representative morphological data linked to DNA sequences could be obtained for description of the tailless cercariaeum. Therefore, identification is based solely on molecular genetic data. For metacercariae, no DNA sequences could be obtained; neither was the material sufficient for morphology.
Remarks
In the present study, the cercarieum found in B. tentaculata was identical to those found in the same snail species in Germany and Lithuania by Schwelm et al. (Reference Schwelm, Kudlai, Smit, Selbach and Sures2020) and Petkevičiūtė et al. (Reference Petkevičiūtė, Stanevičiūtė and Stunžėnas2020). Previously, A. progenetica has been recorded in the Curonian Lagoon and in the region of St. Petersburg, Russia (Niewiadomska Reference Niewiadomska2003). Its life cycle, completed by Serkova & Bykhovsky (Reference Serkova and Bychovsky1940), is characterised by the presence of a progenetic metacercaria bearing eggs – we did observe such a specimen in the present study, but we failed to obtain DNA sequences. Recently, Petkevičiūtė et al. (Reference Petkevičiūtė, Stunžėnas and Stanevičiūtė2022) clarified the assignment of A. progenetica to the genus Asymphylodora. As before, it has been recognised as Parasymphylodora Szidat, 1943 by some authors (see Niewiadomska Reference Niewiadomska2003; and for details, Petkevičiūtė et al. Reference Petkevičiūtė, Stunžėnas and Stanevičiūtė2022). Thus far, no species of Asymphylodora have been reported from Ireland, but there are records from fishes in the United Kingdom of A. kubanica Issaitschikov, 1923 and A. tincae (Modeer, 1790).
Parasymphylodora parasquamosa Kulakova, 1972
Synonym: Asymphylodora parasquamosa (Kulakova, 1972)
First intermediate host: Bithynia tentaculata (L.) (Gastropoda, Littorinimorpha).
Site of infection: mantle cavity.
Locality: Lough Corrib, Ireland.
Prevalence: 0.8% (1 of 125 snails).
Representative DNA sequences: PP849712 (28S), PP849722 (ITS2), and PP840849 (cox1).
Metacercaria
No sufficiently representative morphological data could be obtained for description of the metacercaria, and identification is based solely on molecular genetic data.
Remarks
The present metacercariae found in B. tentaculata are identical to those recorded in Lithuania by Petkevičiūtė et al. (Reference Petkevičiūtė, Stunžėnas and Stanevičiūtė2022). By molecular genetic analysis, Petkevičiūtė et al. (Reference Petkevičiūtė, Stunžėnas and Stanevičiūtė2022) clarified that the present species belongs to the genus Parasymphylodora Szidat, 1943 and confirmed that B. tentaculata is used as the first and second intermediate host. Parasymphylodora parasquamosa has so far been reported to occur in Central and Eastern Europe (Niewiadomska Reference Niewiadomska2003); thus, our present record extends its occurrence to Western Europe.
Notocotylidae Lühe, 1909
Notocotylus sp.
First intermediate host: Bithynia tentaculata (L.) (Gastropoda, Littorinimorpha).
Site of infection: hepatopancreas.
Locality: Lough Corrib, Ireland.
Prevalence: 0.8% (1 of 125 snails).
Representative DNA sequences: PP849713 (28S).
Voucher material: cercariae (isogenophores) in ethanol in two vials (Coll. No. NMINH: 2024.5.10., coll. 31.vii. 2019).
Cercaria (Figures 8E–H)
[Description and measurements based on three live specimens.] Cercaria monostome, triocellate. Body elongate-oval, with maximum width at its mid-level, 210–259 × 115–145 (234 × 133). Body with dark brownish pigment; at its posterior extremity, two protrusible dorsal adhesive pockets located postero-laterally. Tegument devoid of spines. Eyespots three, with black pigment, two lateral ones posterior to oral sucker, median eyespot with less dense pigment just posterior to oral sucker (Figure 8G), 12–22 × 13–16 (16 × 14). Oral sucker muscular, rounded to oval, 35–46 × 31–37 (38 × 33). Pharynx and ventral sucker absent. Oesophagus short. Intestinal bifurcation just posterior to lateral eyespots. Caeca reaching to excretory vesicle. Cystogenous gland cells with dark content, densely filling whole body. Anlagen of reproductive organs in median line of body as a chain of transparent cells. Excretory vesicle thin-walled, rounded. Main collecting excretory channels filled with numerous, small, refractive excretory granules. Main collecting excretory channels ascending to anterior part of body, fusing at level of lateral eyespots, and forming a finger-like diverticulum reaching to the front of the median eyespot, just posterior to oral sucker (Figure 8G, Yenchingensis morphotype). Flame cells obscured by cystogenous gland cells; flame cell formula not elucidated. Tail long, simple, transparent, highly contractile, with tapered tip, 316–422 × 36–49 (373 × 43). Tail longer than body, TL/BL ratio 1:1.37–2.01 (1.67).
Morphology of trematodes ex Bithynia tentaculata. (A, B) Sphaerostoma bramae (A, total view; B, stylet); (C, D) Metorchis xanthosomus (C, ventral view of body; D, total view); (E–H) Notocotylus sp. (E, ventral view of body; F, total view; G, detail of eyespots and Yenchingensis-type of excretory system; H, redia). Scale bars: A, C, E, 100 μm; D, F, 200 μm; G, 50 μm; B, 10 μm; H, 400 μm.

Measurements of cercariae fixed in ethanol (based on 14 specimens; not all specimens contributed a data point to all metrical variables): Body 186–263 × 82–143 (214 × 120). Oral sucker 32–41 × 33–43 (35 × 37). Eyespot 12–18 × 14–23 (14 × 18). Excretory vesicle 27–32 × 23–26 (29 × 29). Tail 202–363 × 36–49 (304 × 43). TL/BL ratio 1:0.91–1.95 (1.47).
Redia (Figure 8H)
Body elongate, with brownish pigment, without locomotory appendages; anterior extremity blunt, posterior extremity with a pointed tip. Pharynx muscular, relatively small. Sac-like intestine with brownish content, reaching up to mid-level of body. Containing cercariae of different stages of development.
Measurements of rediae fixed in ethanol (based on seven specimens): Body 568–779 × 173–202 (649 × 185). Pharynx 79–101 × 68–88 (89 × 75).
Remarks
The features of the present cercariae, which are the lack of ventral sucker and pharynx, the presence of three conspicuous eyespots, excretory system united behind oral sucker, dark pigment in whole body and prominent cystogenous gland cells, correspond well with the morphology of cercariae of the family Notocotylidae (Filimonova Reference Filimonova1985; Gonchar et al. Reference Gonchar, Jouet, Skírnisson, Krupenko and Galaktionov2019). The present cercariae belong to the Yenchingensis morphotype (excretory system with a diverticulum in anterior part of fusion vs. the Monostomi and Imbricata morphotypes, see Gonchar et al. Reference Gonchar, Jouet, Skírnisson, Krupenko and Galaktionov2019). The Yenchingensis morphotype was observed in marine notocotylids using hydrobiid snails, but also in freshwater notocotylids using bithyniid snails as intermediate hosts (Gonchar et al. Reference Gonchar, Jouet, Skírnisson, Krupenko and Galaktionov2019). The taxonomy of the Notocotylidae is complex and controversial (Gonchar et al. Reference Gonchar, Jouet, Skírnisson, Krupenko and Galaktionov2019). Notocotylid cercariae are particularly difficult to distinguish morphologically, and in reality, they can only be reliably identified to family level, as their morphology is strikingly uniform, and observation is impeded by the dark pigment and cystogenous gland cells (Gonchar et al. Reference Gonchar, Jouet, Skírnisson, Krupenko and Galaktionov2019). From B. tentaculata in Europe, there have been several species of notocotylid cercariae reported: Catatropis verrucosa (Frölich, 1789), N. imbricatus (Looss, 1893), N. parviovatus Yamaguti, 1934, N. ponticus Tschiaberashwili, 1964, N. triserialis Diesing, 1839 (Filimonova Reference Filimonova1985; Kanev et al. Reference Kanev, Vassilev, Dimitrov and Radev1994; Morley et al. Reference Morley, Adam and Lewis2004), and two unidentified species with DNA sequences provided by Schwelm et al. (Reference Schwelm, Kudlai, Smit, Selbach and Sures2020) from Germany. The above list of species reflects the complex systematics of this genus, as N. triserialis is now considered a synonym of N. attenuatus, whereas N. attenuatus is known to utilise only lymnaeid snails as intermediate hosts (Filimonova Reference Filimonova1985; Gonchar et al. Reference Gonchar, Jouet, Skírnisson, Krupenko and Galaktionov2019). Species of the genus Notocotylus Diesing, 1839 use a wide range of snails as intermediate hosts and birds and mammals as definitive hosts; they are distributed worldwide and can be pathogenic to their bird hosts (Barton & Blair Reference Barton, Blair, Jones, Bray and Gibson2005; Gonchar et al. Reference Gonchar, Jouet, Skírnisson, Krupenko and Galaktionov2019). In Galway Bay, Ireland, adults of C. verrucosa and Notocotylus sp. from charadriid birds were recorded by Cabot (Reference Cabot1969).
Discussion
A diverse range of larval trematode parasites was observed in the faucet snail, Bithynia tentaculata, in two lakes in Ireland. A total of nine trematode species of seven families were discovered as cercariae (seven species), metacercariae (three species), or both (one species). While this list represents a small part of the high species richness of trematodes thus far known from B. tentaculata, it is an important result for an initial study on this snail species in Ireland. All but one (S. bramae) of the trematode parasites identified are new species records for Ireland. Notably, our study identifies the most western distribution for the trematode species within Europe. The species list from Ireland almost fully overlaps with that found in Germany and Lithuania by Schwelm et al. (Reference Schwelm, Kudlai, Smit, Selbach and Sures2020), who discovered 20 species belonging to 10 families in their spatially and temporally intensive study concentrated on B. tentaculata.
The species found are known parasites of fish (A. progenetica, P. parasquamosa, and S. bramae), birds (C. prussica, M. xanthosomus, Notocotylus sp., and Sphaeridiotrema sp.), and insectivorous mammals/bats (L. linstowi and Lecithodendrium sp.) (Yamaguti Reference Yamaguti1971; Niewiadomska Reference Niewiadomska2003; Kudlai et al. Reference Kudlai, Stunžėnas and Tkach2015). A common feature of the present species is that the adult trematodes are generalists in definitive host use. For example, L. linstowi was recorded in various bat species (Esteban et al. Reference Esteban, Amengual and Cobo2001), C. prussica is a common parasite of waterfowl (Sitko et al. Reference Sitko, Faltýnková and Scholz2006), and S. bramae was reported from a wide variety of fish species (Kennedy Reference Kennedy1974; Niewiadomska Reference Niewiadomska2003). Another common feature of the present species is that they are widespread in Europe, with many of them (L. linstowi, A. progenetica, P. parasquamosa, and S. bramae) recorded in northern (Finland), eastern (Lithuania, Russia, Ukraine), and western Europe (United Kingdom), complemented now by the present results from the western edge of Europe. Trematodes using birds as definitive hosts can be well disseminated along bird migration routes. As Ireland is situated on the East Atlantic flyway, it is a location used for nesting, wintering, or staging of many migratory birds (Cramp & Simmons Reference Cramp and Simmons1980). In previous studies on larval trematodes from Irish freshwater snails, an overlap in species of bird trematodes with samples from Iceland and continental Europe was observed (Kudlai et al. Reference Kudlai, Pantoja, O’Dwyer, Jouet, Skírnisson and Faltýnková2021; Pantoja et al. Reference Pantoja, Faltýnková, O’Dwyer, Jouet, Skírnisson and Kudlai2021; Faltýnková et al. Reference Faltýnková, Kudlai, Pantoja, Yakovleva and Lebedeva2022). Trematode parasites using less mobile small insectivorous mammals as definitive hosts might rely on life cycle stages other than adults for effective dispersion. The first intermediate host, B. tentaculata itself, has a high dispersion potential and can be introduced to new areas by human activity (e.g. via cargo ships), as well as by migratory birds (Weeks et al. Reference Weeks, de Jager, Haro and Sandland2017; Van Leeuwen et al. Reference van Leeuwen, van der Velde, van Lith and Klaassen2012). The second intermediate hosts harbouring metacercariae can contribute to dispersion too. For example, L. linstowi uses aquatic insect larvae as an intermediate host, which can ensure transmission either in water or in the terrestrial environment after host metamorphosis, thus expanding the range of potential definitive hosts (Kudlai et al. Reference Kudlai, Stunžėnas and Tkach2015).
The range of B. tentaculata expands from Europe to the West Siberian Plain in Asia (Welter-Schultes Reference Welter-Schultes2012), and from there it has been reported as an important intermediate host of trematode parasites in the local ecosystems, including M. xanthosomus and other cercariae of the Opisthorchiidae and Notocotylidae (Serbina Reference Serbina2014, Reference Serbina2016, Reference Serbina2022). From the Russian southern Far East, Sphaeridiotrema aziaticum from the snail Boreoelona ussuriensis (Büttner & Ehrmann) has been reported by Kalinina et al. (Reference Kalinina, Tatonova and Besprozvannykh2022), which seems closely related to our material of Sphaeridiotrema sp. and that from Germany and Lithuania (Tkach et al. Reference Tkach, Kudlai and Kostadinova2016; Schwelm et al. Reference Schwelm, Kudlai, Smit, Selbach and Sures2020). However, to clarify this, still more integrative taxonomic studies using mitochondrial markers are needed from both Europe and Asia.
Many of the trematode species found by us and by Schwelm et al. (Reference Schwelm, Kudlai, Smit, Selbach and Sures2020) belong to groups with unclarified or controversial taxonomy. A typical example is the species of the genus Notocotylus, where cercariae and adults have few distinguishing features and there is conflicting evidence on species identity and life cycle stages (Gonchar et al. Reference Gonchar, Jouet, Skírnisson, Krupenko and Galaktionov2019). Also, for S. bramae, the suspicion exists that it might be a complex of multiple species (Koval Reference Koval1971; Našincová Reference Našincová1992). Alas, the life cycle stages of the other species are still unknown; therefore, no comparative morphological data are available. Also, there is still a lack of robust phylogenetic information for most of the groups, and molecular genetic data are limited. For instance, for the Cyathocotylidae, Achatz et al. (Reference Achatz, Pulis, Junker, Binh, Snyder and Tkach2019) was the first to examine the phylogeny of the family based on molecular genetic data; Sitko et al. (Reference Sitko, Bizos, Sherrard-Smith, Stanton, Komorová and Heneberg2016) revised the species of the genus Metorchis but based predominantly on data from Europe; and for the Notocotylidae, a complex molecular phylogenetic study is still pending. To clarify the status and species diversity of trematode genera, a more intensive sampling campaign of hotspot regions is necessary. We expect that a more species-rich trematode parasite fauna could be found in Ireland during a longer and more geographically spread investigation, as is likely also the case for B. tentaculata in other parts of Europe.
Bithynia tentaculata hosts an array of trematode parasites that can be harmful to definitive host animals. At least four trematode species, including Cyathocotyle bushiensis Khan, Reference Khan1962 and Sphaeridiotrema globulus, were introduced to North America together with B. tentaculata and are causing severe mortality in American migratory birds (Sauer et al. Reference Sauer, Cole and Nissen2007; Bergame et al. Reference Bergame, Huffman, Cole, Dayanandan, Tkach and McLaughlin2011; Roy et al. Reference Roy, St-Louis and House2016; Weeks et al. Reference Weeks, de Jager, Haro and Sandland2017). Similarly, members of the Notocotylidae at high intensities can be pathogenic to birds including domestic waterfowl (Filimonova Reference Filimonova1985; Gonchar et al. Reference Gonchar, Jouet, Skírnisson, Krupenko and Galaktionov2019). Zoonotic trematodes that can affect humans are also hosted by B. tentaculata, e.g. opisthorchiids (Metorchis, and Opisthorchis) (Serbina Reference Serbina2022; Katokhin & Serbina Reference Katokhin and Serbina2023). In Russia, up to West Siberia, opisthorchiasis is common and is particularly linked to the presence of B. tentaculata and related species (Katokhin & Serbina Reference Katokhin and Serbina2023). While it is difficult to distinguish species of Opisthorchis from those of Metorchis, it is of particular importance to carefully identify them for correct assessment of infection foci and for epidemiological measures (Sitko et al. Reference Sitko, Bizos, Sherrard-Smith, Stanton, Komorová and Heneberg2016).
Our findings support the statement by Schwelm et al. (Reference Schwelm, Kudlai, Smit, Selbach and Sures2020) that B. tentaculata hosts a unique diversity of trematode species that do not overlap with those of the better-known trematode fauna of pulmonate snails (Heterobranchia). There is some overlap at family level (e.g. Notocotylidae); however, several of the trematode families (Cyathocotylidae, Echinochasmidae, Prosthogonimidae, Psilostomidae, and Opisthorchiidae) are known to use almost exclusively non-pulmonate snails of the subclass Caenogastropoda as intermediate hosts (Niewiadomska Reference Niewiadomska, Gibson, Jones and Bray2002, Scholz Reference Scholz, Bray, Gibson and Jones2008, Tkach et al. 2016). Further investigations are required to examine the evolutionary and ecological factors responsible for these divergent trematode faunas.
We can affirm that B. tentaculata is a particularly suitable intermediate host for trematode parasites using a wide range of definitive hosts. Thus, this snail species plays an important role in ecosystem functioning as a central hub in a range of trematode life cycles. These trematode parasites are likely to be useful ecological indicators, as demonstrated for trematode parasites in previous studies (e.g. Byers et al. Reference Byers, Altman, Grosse, Huspeni and Maerz2011; Shea et al. Reference Shea, Kersten, Puccia, Stanton, Stiso, Helgeson and Back2012; Taglioretti et al. Reference Taglioretti, Rossin and Timi2018). There is an ongoing need for precise identification of trematode species via integrative taxonomic approaches to ensure that wider ecological contexts can be understood and biodiversity and disease threats can be accordingly evaluated. In the face of changing environments and increasing environmental pressures, the faucet snail, B. tentaculata, and its trematode fauna offer a useful study system due to the versatility and resistance of the snail species as well as its strong potential for colonising new areas. Future studies that could benefit from using this system include those investigating trends in biodiversity, ongoing ecological change, and changes in disease risk for wildlife.
Data availability statement
Data are available from the authors upon reasonable request; sequences are made available via GenBank.
Acknowledgements
We are grateful to Blanka Škoríková for scanning of the drawings and to Libuše Kolářová for help with collecting molluscs.
Author contribution
Conceptualisation: AF, KOD, CP, DJ, KS, OK. Conducting field research and sample processing: AF, KOD, CP, DJ, KS, OK. Molecular data analysis: OK. Preparation of figures: AF, OK. Data interpretation, writing: AF, KOD, OK. All authors have read and agreed to the published version of the manuscript.
Financial support
The present study was supported by the Research Fund of the University of Iceland.
Competing interest
The authors declare that they have no conflicts of interest.
Ethical standard
Not applicable.


 Open access