

1. INTRODUCTION
Ice losses from Greenland and Antarctica have increased rapidly over recent decades – by 278 and 148%, respectively. since 1992 – and the most pronounced changes have occurred in places where the ice sheets are grounded well below sea level (Shepherd and others, Reference Shepherd2012). Such marine-based and marine-terminating ice-sheet sectors are particularly vulnerable to environmental change, because they are in contact with atmospheric and oceanic masses that are relatively warm, where modest changes in temperature can melt and destabilise the ice. In the most rapidly changing regions, such as the Amundsen Sea sector of West Antarctica and Jakobshavn Glacier in west Greenland, warm ocean currents have triggered glacier retreat (Park and others, Reference Park2013), leading to increased rates of ice flow (Joughin and others, Reference Joughin, Smith, Shean and Floricioiu2014) and ice thinning (McMillan and others, Reference McMillan2014) far inland. Elsewhere, at the Antarctic Peninsula for example, changes in air temperature are believed to be a driver (Scambos and others, Reference Scambos, Hulbe, Fahenstock and Bohlander2000) of ice shelf collapse (Rott and others, Reference Rott, Skvarca and Nagler1996), which in turn, has also triggered drawdown of inland ice (Rignot and others, Reference Rignot2004). Ice-sheet grounding lines are therefore a sensitive indicator of dynamic instability, and modelling the rate and spatial pattern of future change remains one of the most significant challenges limiting the accuracy of sea-level rise projections (Church and others, Reference Church and Stocker2013).
An ice-sheet grounding line is the junction between an ice shelf, which floats on the ocean surface, and the ice sheet which is grounded on bedrock (Fig. 1). In reality grounding lines are transitory features with a location that can fluctuate on short (sub-daily) timescales, for example due to the effects of ocean tides, which alter the proportion of ice that floats. The grounding line is located at the base of the ice sheet whereas the hinge line is the manifestation of this feature at the ice surface. Although there may be a small lateral variation in the position of the hinge and grounding lines we can infer from elastic beam theory that their migration rates are directly correlated therefore tracking either is an accurate measure of grounding line motion or stasis (Rignot, Reference Rignot1996). Both junctions lie within a region called the grounding zone, which can be up to a few kilometres wide in the direction of ice flow depending on factors such as bedrock topography and tidal amplitude. The grounding zone is of critical importance for ice-sheet stability, because it determines the rate at which ice is discharged into the oceans from inland (Schoof, Reference Schoof2007). In the absence of pinning points, grounding line retreat leads to a reduction in the resistive force acting to restrain the grounded ice, and consequently an increase in the rate of ice discharge. These effects have been observed and simulated (Joughin and others, Reference Joughin, Smith and Holland2010) to rapidly propagate ice drawdown from further inland. Relatively modest changes at the termini of outlet glaciers can therefore have a marked impact on the wider ice-sheet mass imbalance. Although ice-sheet grounding lines can be detected using ground based techniques, such as kinematic GPS measurements of tidal flexure (Vaughan, Reference Vaughan1995), they can be logistically difficult or impossible to access, and the high cost of repeated surveys limits the practicality of this approach on large scales. Because of this, techniques based upon satellite observations have emerged as an alternative solution, enabling relatively large quantities of data to be regularly acquired. Three independent Earth observation techniques have been employed to date: (1) the detection of change in surface shading caused by the break in ice-sheet surface slope in optical imagery (Scambos and others, Reference Scambos, Haran, Fahnestock, Painter and Bohlander2007; Bindschadler and others, Reference Bindschadler2011), (2) the detection of tidal motion in quadruple difference interferometric synthetic aperture radar (QDInSAR) observations (Goldstein and others, Reference Goldstein, Engelhardt, Kamb and Frolich1993) and (3) repeat satellite altimeter measurements (Fricker and Padman, Reference Fricker and Padman2006). It has been shown (Rignot, Reference Rignot1998a) that the technique of QDInSAR is capable of detecting grounding lines with fine (30 m) spatial resolution and with high precision. However, the temporal sampling frequency of the technique is limited, because of the relative infrequency with which suitable SAR image triplets are acquired; typically, at least three SAR images acquired within a few days are needed. The most useful QDInSAR data were acquired during periods when the two European Remote Sensing (ERS) satellites were orbiting in a 3 d repeat cycle between 1991/92, 1993/94 and in 2011; and in a 1 d repeat cycle between 1995/96.
Illustration showing the position of the ice-sheet grounding line at the ice, bedrock, ocean interface and the hinge line visible at the ice surface.

2. PETERMANN GLACIER STUDY AREA
Petermann Glacier is a large marine terminating ice stream located on the north-west coast of the Greenland ice sheet at 81°N and 62°W (Fig. 2). It drains ~4% of the total ice-sheet area (Munchow and others, Reference Nick2014) and is one of only seven ice streams in Greenland with a permanently floating section (Moon and others, Reference Moon, Joughin, Smith and Howat2012). Inland, Petermann Glacier is grounded on bedrock more than 300 m below present day sea level and its 1280 km2 floating ice tongue flows through a steep sided, 20 km wide fjord into the Hall Basin in the Nares Strait. Satellite observations of surface elevation change inland of the Petermann Glacier grounding line show a moderate rate of thinning (0.3 m a−1) for the period 2003–07, of which 50% is directly attributed to a negative surface mass-balance anomaly (Pritchard and others, Reference Pritchard, Arthern, Vaughan and Edwards2009). Episodic calving events in 1992, 2010 and 2012 have decreased the area of the floating ice shelf by ~40% (Nick and others, Reference Nick2012; Munchow and others, Reference Munchow, Padman and Fricker2014). However, there is no evidence to suggest that these calving events are occurring with greater frequency, or that they have affected the glacier speed, which has remained steady at ~1 km a−1 in the fastest regions (Nick and others, Reference Nick2012). This is in part because, at Petermann Glacier, high rates of channelised basal melting remove the vast majority (80%) of floating ice before calving can occur, making ice/ocean interactions the dominant control on ice mass imbalance (Rignot and Steffen, Reference Rignot and Steffen2008). Although ship-based studies confirm that there is sufficient heat available within the fjord waters to drive the rapid rates of basal melting inferred from satellite observations (Johnson and others, Reference Johnson, Münchow, Falkner and Melling2011) it is not certain whether potential changes in ocean temperature, mixing, or sea ice cover might lead to additional melting potential, fuelling speculation that a warming ocean could trigger future grounding line retreat on Petermann Glacier (Johnson and others, Reference Johnson, Münchow, Falkner and Melling2011; Nick and others, Reference Nick2013).
Map of Petermann Glacier, a marine terminating ice stream in north-west Greenland. The ice stream is shown by an ERS-1 synthetic aperture radar image, and flows from the bottom to top of the image. The 1995/96 grounding line is shown in red, along-flow transects are marked in white (A–G), the calving front is shown in cyan, and ICEBridge flight-line 1 (west) and 2 (east) separated by 2.9 km is shown in blue. Also shown are the seed locations chosen for interferometric phase unwrapping (yellow), and for tide model heights (green). The inset shows the location of Petermann Glacier in Greenland and the location of the start and end points of the fjord (red) and Nares Strait (blue (north) and green (south)) tide model transects.

3. DATA AND METHODS
Maintaining interferometric phase coherence in repeat pass SAR acquisitions is challenging over ice-covered terrain, because the surface rapidly deforms due to flow and in response to changing meteorological events such as snow deposition and redistribution and melting. The nominal 35 d orbit repeat period of the European Space Agency's (ESA) ERS 1 and 2 satellites is typically too long to acquire viable (i.e. coherent) repeat-pass interferometric data over ice, so both platforms were moved into shorter repeat orbits during campaigns dedicated to this purpose. Between 28 December 1991 and 30 March 1992, ERS-1 was placed in a 3 d orbit repeat cycle (termed the first ice phase) and, after the success of this campaign, it was repeated in 1993/94 and in 2011 with ERS-2 in order to acquire repeat measurements over Greenland and Antarctica. SAR data acquired by ERS-1 and 2 between 21 March 1995 and 05 June 1996, when both satellites orbited in tandem 35 d repeats, separated by 1 d, is also suitable for interferometry over ice-covered regions as the short temporal baseline allows phase coherence to be maintained between SAR images acquired from both sensors. Here, we used ERS-1 and 2 data acquired on track 12, frame 1953 over Petermann Glacier during all 3 d ice campaigns and the 1 d tandem campaign, between 1992 and 2011 (Table 1), to produce measurements of the grounding line.
Details of all SAR data used in this study, including sensor, track number, acquisition dates and temporal baseline

The data are listed in rows identifying each SAR frame element of the 17 quadruple difference interferograms used to detect the grounding line (identifiable as 92a through 11d).
We processed ERS-1 and ERS-2 data from raw to Single Look Complex (SLC) images using precise Department of Earth Observation and Space Systems (DEOS) orbit ephemerides (Scharroo and Visser, Reference Scharroo and Visser1998) when available. Temporally sequential SLC master and slave image pairs were formed from ERS-1 and 2 data acquired prior to 1997 (Table 1). However, failure of the ERS-2 gyroscope in 2001 (Rosich and others, Reference Rosich, Meadows, Schättler, Grion and Emiliani2001) resulted in larger and less stable Doppler centroid frequencies, and so it is not always possible to pair temporally sequential images in data acquired during the latter period. To achieve high-interferometric coherence low Doppler centroid differences are required to ensure sufficient spectral overlap, therefore in 2011 SLC image pairs were formed when the Doppler centroid difference was <800 Hz and when temporal baselines were <9 d. Each SAR image pair was co-registered using common features in the backscatter intensity images, with the aid of initial co-registration offsets determined from the orbital state vectors. Assuming the influence of atmospheric delay on the phase signal is negligible, the interferograms computed from each SAR image pair contain signal contributions from the Earth's curvature, topography and surface displacement, as well as noise. We simulated the Earth curvature and topographic phase signals using the orbital geometry of each SAR image pair and using a DEM generated from the ASTER GDEM data, and we assume that no significant ice-surface elevation change has occurred in the time interval between the DEM and SAR data acquisition. These signals were then subtracted from the smoothed interferograms to reduce noise and then isolate the surface displacement phase signal. At the Petermann Glacier, displacement is caused by ice flow and, in floating sections, by ocean tides.
We then combine terrain-corrected interferograms to form quadruple difference interferograms (Rignot, Reference Rignot1998a), a process that removes common signals due to constant ice flow. Over short-time periods, this approach is usually effective because ice flow is relatively stable in comparison with tidal motion; however, short-term changes in ice velocity such as the tidally induced motion observed on Rutford Ice Stream (Rosier and others, Reference Rosier, Gudmundsson and Green2015), would not be removed using this technique. The remaining phase signal, which is manifest as a dense band of interference fringes at the boundary between grounded and floating ice (Fig. 3a), can then be attributed to vertical surface displacement caused by ocean tides. We unwrapped the quadruple difference interferogram phase across the glacier grounding zone using the branch cut method (Goldstein and others, Reference Goldstein, Zebker and Werner1988) to calculate the absolute differential displacement in the satellite line of sight (Fig. 3b). It was not possible to initiate phase unwrapping in the same location in all instances (Fig. 2) due to temporal decorrelation of the SAR imagery inland of the glacier grounding zone. This decorrelation also limited the extent of interferometric data, necessitating the use of manual bridges to link areas of disconnected phase in some places. The bridge locations were selected by identifying the successfully unwrapped regions in each interferogram, and then visually pairing neighbouring unwrapped and wrapped pixels in the same interferometric fringe. The unwrapped phase value was assigned from the reference to the wrapped pixel, and then the unwrapping procedure was recomputed. Finally we calculated differential vertical displacement from the unwrapped phase using the satellite geometry (Fig. 3c).
Wrapped (a) and unwrapped (b) quadruple difference interferometric fringe pattern across the grounding zone of Petermann Glacier, from QDInSAR pair 95a. The grounded (green) and floating (blue) sections of the transect are identified above a profile of the differential vertical displacement (black) extracted along a transect F (white dashed) (c).

We identified the Petermann Glacier grounding line by manually delineating the inland limit of tidal flexure, following the method of Rignot and others (Reference Rignot, Mouginot, Morlighem, Seroussl and Scheuchl2014). In longitudinal profiles (Fig. 3c) grounded ice shows no significant vertical displacement, in contrast to the floating ice shelf, which shows a relative displacement ranging from −124 to +143 cm at times of extreme tidal difference (Fig. 4). In all 17 quadruple difference interferograms the grounding zone is identifiable as a ramp between 7 and 47 interference fringe cycles across the full width of the ice stream, oriented perpendicular to the direction of flow. There is a strong (R 2 = 0.94) positive correlation between the fringe density and the magnitude of the ice-shelf vertical displacement. The inland limit of tidal flexure is more difficult to identify in differential interferograms with a lower fringe density because the magnitude of the vertical displacement signal is smaller; however, the fringes that are present are spread over approximately the same grounding zone width. To investigate the influence of fringe density on the position of the grounding line, we scaled the wrapped phase signal in each differential interferogram by factors of two, three and four. Although this process increased the density of fringes in the grounding zone, it also scaled the phase noise, and when higher scaling factors were employed the phase signal in the differential interferogram became saturated, rendering the grounding zone undetectable. We mapped the grounding line position in the original and phase scaled differential interferograms and examined the difference in position of the inland limit of tidal flexure. Although the fringe density was much higher in the phase scaled images, there was no visible change in the grounding line location measured, and so we used the unscaled differential interferograms to identify the grounding line position throughout the rest of this study.
Relative vertical displacement along the transect E flow-line profile of the Petermann Glacier grounding zone, measured using 17 quadruple difference interferometry (Table 1). Also shown (coloured dots) are relative tidal amplitudes at the same epoch as determined from the AODTM-5 model Arctic Ocean tide model. Between 0 and 8 km, there is no significant vertical displacement, indicating that this section of the glacier is grounded on bedrock. However, from 8 km and farther seaward, up to 1.5 m of relative displacement are recorded, indicating this section of the glacier is influenced by the ocean tide and therefore floating.

We estimated the uncertainty of each QDInSAR grounding line measurement by translating noise in the vertical deformation profiles into a lateral error in the grounding line position. A running mean of the vertical deformation was measured from all 17 quadruple difference interferogram profiles extracted along transect D (Fig. 2), with the residuals computed as the difference of each point from the local mean. All 17 profiles exhibited low variability with a mean absolute difference of 0.4 ± 0.2 cm, and a larger total range of 6.5 cm. The range of the residuals measured along each profile is comparable on both grounded and floating ice, indicating that the uncertainty is independent of tide amplitude. This suggests that the uncertainty is systematic rather than geophysical in origin, and that it may reasonably be used as a formal error budget associated with QDInSAR grounding line measurements made in other areas. We retrieved the standard deviation of the residuals from the mean at the grounding line of each displacement profile, and then translated this into the lateral error in grounding line position by measuring the distance seaward of the grounding line over which the mean vertical displacement was within the range of error. The mean lateral precision of a QDInSAR grounding line position is 30 m with a total range up to 100 m.
4. RESULTS
4.1. Tidal displacement of floating ice
We compared modelled tidal differences with the relative displacement of the Petermann Glacier Ice Shelf, as recorded in each quadruple difference interferogram, along seven stream-wise transects bisecting the grounding zone (Fig. 4). Although the transects are not regularly orientated, they were selected to optimise the data density while also sampling both the most and least variable regions of the Petermann Glacier grounding zone. On the inland (grounded) ice there is very little vertical displacement, and the mean range of relative heights is 3.7 ± 2.0 cm, which is attributed to error in the QDInSAR vertical displacement measurement. In contrast, relative displacement of the floating ice shelf is much larger due to the effects of the ocean tide, and spans a range of 2.8 m over the study period. Overall, there is close agreement between the magnitude of the ice-shelf relative displacement and the size of differential tides predicted by the AODTM-5 model, with positive or negative displacements recorded at times of high and low differential tides respectively. Across the boundary between grounded and freely-floating ice, there is a rapid change in vertical displacement in all 17 interferometric displacement profiles (Fig. 4). The zone of tidal flexure is on average 4.4 ± 0.8 km wide; however, the relatively large range of 2.8 km is caused by three outliers that correspond to low (<0.5 m) observed tide amplitudes, and these are likely to be least certain. Although the change in slope is most abrupt at times of high relative displacement, the transition between grounded and floating ice remains distinct in all profiles, allowing the grounding line to be located as the landward break in surface slope across the zone of ice-shelf flexure (Rignot and others, Reference Rignot1996).
4.2. Comparison of observed and modelled tidal displacement
To verify the AODTM-5 Arctic tide model, we compared the magnitude of the vertical displacement measured in the differential interferograms with differential tides calculated from the tide model (Padman and Erofeeva, Reference Padman and Erofeeva2004). For this comparison, we assume that vertical displacement is solely caused by ocean tides, and is therefore directly comparable. The landward extent of the AODTM-5 tide model domain ends 71 km from the Petermann Glacier grounding line (Fig. 5) which, for the majority of our survey period, is seaward of the ice-shelf calving front (Fig. 2). Consequently, it is not possible to obtain tidal predictions at locations present in the interferometric data. To assess the impact of this mismatch, we examined the spatial variability of modelled tides at the time of each SAR image acquisition in the Petermann Glacier fjord and the open ocean, from the Hall Basin towards the Kennedy (south) and Robeson (north) Channels in the Nares Strait (Fig. 1). In the open ocean, the AODTM-5 model predicts a tidal range of 1.7 m to the North of the Nares Strait, and a considerably larger range of over 3.6 m to the south (Fig. 5). The range of predicted tide amplitudes is relatively large in the open ocean, with 10 and 15 cm of dispersion in the north and south, respectively. North of the fjord the tidal range decreases with distance, whereas to the south it increases. Within the fjord, the predicted tide amplitudes range from −0.6 to +1.1 m, with a low spatial variability of 0.9 cm along each transect, which is measured as the mean standard deviation of the modelled tide amplitude at the time of each SAR acquisition (Fig. 5). Consequently, although the closest available model grid cell in the Petermann Glacier fjord is >70 km away from the floating ice shelf, the spatial separation of the two locations should only account for <1 cm of difference between the modelled and observed vertical displacement.
Ocean tide amplitude in the Petermann Glacier fjord (red), and to the north (blue) and south (green) of the fjord in Nares Strait, as predicted by the AODTM-5 Arctic tide model. Each line shows tidal amplitude at the time of the ERS SAR acquisitions used in this study along longitudinal transects in the three different regions (Fig. 2). The AODTM-5 tide model domain begins 71 km from the grounding line.

We compared tidal amplitudes at the AODTM-5 model grid cell closest to the front of the Petermann Glacier; 81.2°N, −62.2°W (Fig. 2) with vertical displacements recorded in the interferometric data (Table 2). Differential tides were computed using
 $$\Delta T = \left( {T_2 - T_1} \right) - (T_4 - T_3)$$
as the difference of model tides on the dates and times (Table 1) of each individual SAR acquisition used to produce each quadruple differential interferogram (Table 2). The modelled tide amplitude extracted at the time of each SAR acquisition spans a 1.5 m range from −0.5 to +1.0 m; however, at 2.2 m, the range of modelled differential tides is considerably higher (Table 2). This shows that as a result of the differencing technique, the displacement of floating ice recorded in differential interferograms is large relative to the range of absolute tide amplitudes. When the displacement profiles were examined across the width of the grounding zone we did not observe a ‘tilt’, or across flow bias, in the amplitude of the vertical displacement, although this effect may occur in unexamined regions of the Petermann Glacier floating ice shelf.
Ocean tides predicted by the AODTM-5 Arctic tide model at the time of each SAR image acquisition, the differential tide between the four epochs used to form each quadruple difference interferogram, and the vertical displacement measured in each quadruple difference interferogram

We compared the modelled differential tide amplitude with the QDInSAR vertical displacement to assess the degree to which the datasets agree. For this comparison, we used estimates of relative vertical displacement, determined from the interferometric data on the freely floating ice-shelf seaward of the grounding line (Fig. 2). There is a strong (R 2 = 0.95) positive correlation between the modelled tidal difference and the relative vertical displacement of the floating ice, with a mean difference of only 16.8 cm and a standard deviation of 20.6 cm (Fig. 6). We estimate that 0.9 cm of this difference is caused by spatial variability of the tide in the 71 km section of the fjord separating the locations of the tidal prediction and the interferometric data, and that 3.7 cm of the difference is caused by error on the interferometric measurement. The remaining difference could arise through errors in the tidal predictions, or through other factors affecting the vertical displacement of the ice shelf – for example atmospheric pressure variations or non-tidal changes in local sea-level height. It is also possible that the Petermann Glacier Ice Shelf is not freely floating in hydrostatic equilibrium with the ocean; however, the strong correlation between modelled and observed tides suggests that this is the case.
Comparison between ocean tidal amplitude differences determined from the AODTM-5 Arctic tide model (Padman and Erofeeva, Reference Padman and Erofeeva2004), and relative vertical displacement of the Petermann Glacier Ice Shelf determined from quadruple difference interferometry (black points). Error on the QDInSAR vertical displacement measurement is quantified as the maximum range of vertical motion measured on the stable grounded portion of the ice stream. Also shown is the difference (anomaly) between the two measurements (red crosses).

Accurate estimates of ocean tides are required for many glaciological applications, including analysis of ice-shelf thickness changes using satellite altimetry (Shepherd and others, Reference Shepherd, Wingham, Payne and Skvarca2003), assessments of ice-sheet mass change using satellite gravimetry (Velicogna and Wahr, Reference Velicogna and Wahr2013), and characterising patterns of ice-shelf basal melting derived from satellite radar interferometry (Joughin and Padman, Reference Joughin and Padman2003). Direct observations of ocean tides are, however, sparse, and the certainty of ocean tidal predictions is limited by the paucity of bathymetric data (Padman and others, Reference Padman, Fricker, Coleman, Howard and Erofeeva2002). These problems are especially pronounced at the ice-sheet margins, which are relatively inaccessible, and which often exhibit rugged and steep bathymetric slopes. Satellite observations have been used to evaluate ocean tide model predictions in such remote and inaccessible regions. For example, in the Weddell and Amundsen Seas, modelled ocean tidal differences have been shown to deviate from observations of ice-shelf relative displacement by 9 cm, on average (Fricker and Padman, Reference Fricker and Padman2002; McMillan and others, Reference McMillan, Shepherd, Nienow and Leeson2011). Because there are few floating ice shelves in the northern Hemisphere, an assessment of the utility of Arctic ocean tide models for glaciological applications in this region has been lacking. Our assessment that tides predicted by the AODTM-5 model differ from the observed displacement of the Petermann Glacier floating ice shelf by 16.8 cm, on average, confirms, therefore, that ocean tide models perform comparably well for glaciological applications in the northern Hemisphere as they do in the southern Hemisphere.
4.3. Grounding line migration
We mapped the location of the Petermann Glacier grounding line in all 17 quadruple-difference interferograms (Table 1), producing the most extensive time series assembled at any ice stream to date (Fig. 7). Our results show that between 1991 and 2011 there has been clear movement of the grounding line; however, over the 19 a survey period its relative shape has remained broadly constant, with prominent meanders present in each set of interferometric data. The most distinctive features are the inland-pointing notches on the north-east and south-west margins of the ice stream (Fig. 7), which is in line with observations showing that the ice is thicker towards the centre of the glacier (Joughin and others, Reference Joughin, Fahnestock, Kwock, Gogineni and Allen1999), as is the case on other fast flowing ice streams. Although we present a more complete time series of grounding line positions on Petermann Glacier, when the same SAR dataset is used our results are consistent with those from previous studies (Rignot, Reference Rignot1996, Reference Rignot1998a). The furthest inland grounding line positions were measured in February 1992 (92d in Fig. 7) and May 2011 (11b). Relative to these positions, grounding lines recorded at other times are located up to several kilometres downstream, with no obvious progression through time (Fig. 7). The furthest seaward grounding line location was measured in February 1992 (92g, 92h) and June 2011 (11d). The range between the inland and seaward grounding line limit varies across the width of the ice stream, indicating that the grounding lines sensitivity to motion may be influenced by smaller scale, localised processes.
Petermann Glacier grounding line measured between 1992 (92a) and 2011 (11d). Each coloured curve represents a grounding line produced from quadruple difference interferometry at distinct time periods (Table 1). The background image is an ERS-1 synthetic aperture radar amplitude image acquired in May 2008.

To characterise the spatial variability of the Petermann Glacier grounding line, we measured the relative grounding line position along seven transects (A–G) perpendicular to the grounding zone (Fig. 8). Over the 19 a study period, the mean absolute variability of the grounding line position was 470 m. The range of grounding line motion is smallest in the central sector of the ice stream on transects B–F at <2.3 km, with a much larger range of motion observed on both transects bisecting the south-west (A) and north-east (G) sheer margins, of 2.8 and 7.0 km, respectively (Table 3). Of the 7.0 km maximum range, the most inland and seaward positions are measured at −2.1 km and +4.9 km respectively, from the mean grounding line position on each transect. Both extremes occurred at the northern edge of the glacier, along transect G, which bisects the broadest section of the grounding zone. Elsewhere, the range (2.8 km) and variability (320 m) of grounding line positions are considerably lower. This demonstrates that, while the mean grounding line variability is relatively low, this does not preclude large, isolated movements (Fig. 8), thus sparse temporal records should be analysed with care.
Distance of grounding line relative to the start of 7 stream-wise transects straddling the Petermann Glacier grounding zone (A–G; Fig. 2) between February 1992 (92a) and June 2011 (11d).

Mean absolute variability and range of the grounding line position along all seven transects across the Petermann Glacier grounding zone (Fig. 2)
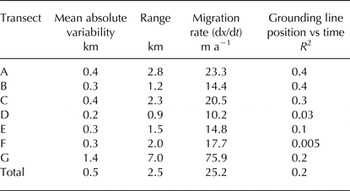
The migration rate is calculated for the full 19 a epoch if all of the observed variability is attributed to grounding line retreat, and R 2 shows the statistical significance of the relationship between grounding line position and time.
We investigated the temporal variability of the Petermann Glacier grounding line position by measuring the mean variability and range of motion along each transect. Transects A–F all exhibit a low mean absolute variability of <470 m in comparison with the anomalously variable north-east sheer margin (G), which experiences one order of magnitude larger variability (<1.5 km) (Table 3). However, as the error on the QDInSAR grounding line measurement is just 6% of the mean absolute variability, this suggests that the observed migration is too large to be accounted for by measurement error alone. The results show that there was no lateral shift in the vertical displacement profile across all seven transects (Fig. 4), or an obvious progression of the grounding line location through time (Fig. 7). When we examined the correlation between time and grounding line position the relationship was statistically insignificant on all seven transects (Table 3; Fig. 9), with the highest correlation (R 2 = 0.4) found along transects A and B, and the lowest correlation found on transect F (R 2 = 0.005), which lies adjacent to the particularly variable north-east margin. Excluding the highly variable north-east margin (transect G), the mean R2 correlation between grounding line position and time is 0.22. The statistical significance of the relationship is further reduced when transect G is included in the calculation (Fig. 9), indicating that even large shifts in grounding line position are not temporally dependent. These results suggest that the Petermann Glacier grounding line has remained relatively stable over the past 19 a, despite the occurrence of large calving events (Nick and others, Reference Nick2012) during the same period.
Change in grounding line position over time between February 1992 (92a) and June 2011 (11d), shown across all seven stream-wise transects (A–G). The correlation between grounding line migration and time is calculated for all transects combined (grey crosses and line), and for all transects excluding transect G, which falls in a particularly variable sector of the Petermann Glacier grounding zone (black crosses and line).

When the mean absolute grounding line variability across all seven transects is converted to a retreat rate over the full 19 a study period, <25.2 m a−1 of migration can be said to have occurred. The largest retreat rate of 75 m a−1 was recorded along transect G in the variable north-east shear margin, whereas the smallest retreat rate of 10.2 m a−1 was recorded along transect D in the central trunk of Petermann Glacier. Although the maximum rate of grounding line retreat observed on Petermann Glacier is in line with Holocene retreat rates of 120 m a−1 inferred from the geological record (Conway and others, Reference Conway, Hall, Denton, Gades and Waddington1999), it is two orders of magnitude lower than the highest rates observed in regions of contemporary imbalance, such as Pine Island Glacier in West Antarctica (Park and others, Reference Park2013). Grounding line retreat rates of a similar magnitude to those observed on Petermann Glacier would be too small to detect in an annual snapshot of data given the lateral precision (30 m) of the QDInSAR technique, reinforcing the importance of long-term data archives for monitoring change.
5. ANALYSIS OF FACTORS AFFECTING GROUNDING LINE MIGRATION
Although a modest secular retreat of the Petermann Glacier grounding line cannot be ruled out, the high variability suggests that other factors are responsible for the majority of its motion. The position of an ice-sheet grounding line is influenced by changes in the ice thickness, in atmospheric pressure, and in ocean tides, and the pattern of any retreat is in turn governed by the bedrock and ice geometry (Thomas, Reference Thomas1984). However, the influence of these factors will vary in space and time. Progressive grounding line retreat has been observed over annual to decadal timescales at the Antarctic Peninsula following ice-shelf collapse (Rack and Rott, Reference Rack and Rott2004), and in West Antarctica through sustained ocean-driven melting (Park and others, Reference Park2013). Fluctuations in ocean tides and atmospheric pressure will cause grounding line positions to move over much shorter timescales. For example, at the Filchner-Ronne Ice Shelf, ocean tides are estimated to cause over 130 m change in grounding line position between high and low tide (Smith, Reference Smith1991). In areas where grounding line migration has been recorded, irregular patterns of movement have occurred. For example, although the Pine Island Glacier grounding line retreated by over 28.4 km between 1992 and 2011, the retreat has been asymmetric and episodic in time due to the presence of a prominent, subglacial bedrock pinning point (Park and others, Reference Park2013). Likewise, although the Totten Glacier grounding line retreated by 1–3 km along the south and north lobes between 1996 and 2013, advance was observed in the central trunk of the ice stream over the same time period (Li and others, Reference Li, Rignot, Morlighem, Mouginot and Scheuchl2015).
Because the Petermann Glacier grounding line has migrated forwards and backwards on numerous occasions during our survey period (Fig. 7), it seems likely that a short-term forcing mechanism is responsible. Ignoring the effects of atmospheric pressure changes, which are very small, the main controlling factors on grounding line position are ocean tides and localised changes in ice thickness. We use a simple geometrical relationship (Rignot, Reference Rignot1998b) to simulate these effects on the position of the Petermann Glacier grounding line. In this formulation Eqn (2) grounding line positions $(\dot x)$
migrate back and forth with time by following changes in ocean tide
$(\dot x)$
migrate back and forth with time by following changes in ocean tide $(\dot z)$
and ice thickness
$(\dot z)$
and ice thickness $(\dot h)$
, where
$(\dot h)$
, where $(\dot h)$
> 0 for thickening,
$(\dot h)$
> 0 for thickening, $(\dot x)$
> 0 for hinge-line retreat, alpha and beta are the surface and basal slopes respectively, counted positive upward, and ρ
w and ρ
i are the densities of sea water (1027.5 kg m−3) and ice (900 kg m−3), respectively. Migration rates are asymmetrical, with larger migration upstream than downstream (Li and others, Reference Li, Rignot, Morlighem, Mouginot and Scheuchl2015; Tsai and Gudmundsson, Reference Tsai and Gudmundsson2015) and further details can be found in Tsai and Gudmundsson (Reference Tsai and Gudmundsson2015). Using this relationship, changes in grounding line position associated with changes in tide and ice thickness can be simulated.
$(\dot x)$
> 0 for hinge-line retreat, alpha and beta are the surface and basal slopes respectively, counted positive upward, and ρ
w and ρ
i are the densities of sea water (1027.5 kg m−3) and ice (900 kg m−3), respectively. Migration rates are asymmetrical, with larger migration upstream than downstream (Li and others, Reference Li, Rignot, Morlighem, Mouginot and Scheuchl2015; Tsai and Gudmundsson, Reference Tsai and Gudmundsson2015) and further details can be found in Tsai and Gudmundsson (Reference Tsai and Gudmundsson2015). Using this relationship, changes in grounding line position associated with changes in tide and ice thickness can be simulated.
 $$\dot h - \left( {\displaystyle{{\rho _{\rm w}} \over {\rho _{\rm i}}}} \right)\dot z = \left\{ {\matrix{ {\left[ {\alpha - \beta \left( {1 - \; \displaystyle{{\rho _{\rm w}} \over {\rho _{\rm i}}}\; } \right)} \right]\dot x,\; \;{\rm if}\; \; \dot x\; \lt \; 0,} \cr {\left[ {\left( {\displaystyle{{\rho _{\rm i}} \over {\rho _{\rm w} - \; \rho _{\rm i}}}} \right)\alpha - \beta } \right]\dot x,\; \;{\rm if}\; \; \dot x\; \gt \; 0.} \cr } } \right.\;$$
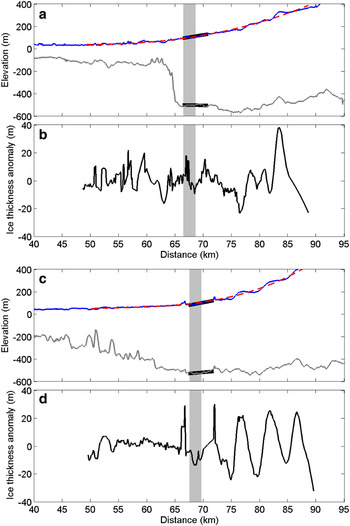
To estimate the surface and bedrock slopes, and the potential size of short-term fluctuations in glacier thickness, we used geometry data acquired along two stream-wise profiles of the Petermann Glacier in 2010 by the NASA Operation Ice Bridge Airborne Topographic Mapper (ATM) lidar and Multichannel Coherent Radar Depth Sounder (MCoRDS) (Allen, Reference Allen2013) (Fig. 10). Although the ice-surface elevation is similar along both flight lines, there are large differences in the elevation of the ice base (Fig. 10). Along the western flight-line, there is an abrupt 420 m change in the elevation of the glacier base over a 2.6 km distance, in sharp contrast to the eastern flight-line where the step is only 75 m over a similar distance (Fig. 10a, b). The MCoRDS instrument detects the ice/bedrock interface on the grounded portion of the ice stream and the ice/ocean interface on the ice shelf, assuming re-frozen marine ice is not present, therefore the ice base only represents the bedrock topography inland of the grounding line. We calculated ice surface and bedrock slopes along a 4.4 km section (the mean width of the flexure zone) of each flight-line centred on the most inland grounding line position measured from the interferometric data (Fig. 10). Using these data, the estimated ice surface (α) and bedrock (β) slopes from the western flight-line are 0.83 and −0.11% respectively, and from the eastern flight-line they are 0.94 and 0.42%, respectively.
Ice surface (blue curve) and ice bottom (grey curve) elevation measured along adjacent western (a) and eastern (c) stream-wise profiles of the Petermann Glacier (Fig. 2). The spread of grounding line positions measured in this study are highlighted (grey shaded area). We also show regions over which the surface and bedrock slopes are computed (thick black curve), and a polynomial fit (red dashed curve) to the ice-surface elevation from which ice thickness anomalies (b) and (d) in the vicinity of the grounding zone are calculated.
Given that such a strong relationship exists between ice-shelf vertical displacement and ocean tides at Petermann Glacier (Fig. 6), we conclude that the floating tongue is in hydrostatic equilibrium with the surrounding ocean, meaning that the grounding line position ought to be sensitive to short-term changes in the ocean tides. We simulated the degree of tidally induced grounding line migration by scaling estimates of the differential tide $(\dot z)$
derived from the AODTM-5 Arctic tide model (Table 2) by the tidal migration factors for each flight line. Based on the maximum simulated differential tide (4.4 m), we estimate that the Petermann Glacier experiences up to 560 m of tidally-induced grounding line motion. For comparison, this range of tidally-induced grounding line motion is approximately three times smaller than at the Pine Island Glacier in West Antarctica (Rignot, Reference Rignot1998b), where the bedrock slope, in particular, is more pronounced. The average simulated tidally-induced relative grounding line motion of the Petermann Glacier at the epochs of our QDInSAR survey was 45 and 38 m along the western and eastern flight-lines, respectively. By comparison, the mean actual grounding line variability measured along transects D and E adjacent to each flight-line (Fig. 2) was 193 and 281 m, respectively. We conclude, therefore, that ocean tides are responsible for only a small fraction (18% on average) of the observed grounding line movement.
$(\dot z)$
derived from the AODTM-5 Arctic tide model (Table 2) by the tidal migration factors for each flight line. Based on the maximum simulated differential tide (4.4 m), we estimate that the Petermann Glacier experiences up to 560 m of tidally-induced grounding line motion. For comparison, this range of tidally-induced grounding line motion is approximately three times smaller than at the Pine Island Glacier in West Antarctica (Rignot, Reference Rignot1998b), where the bedrock slope, in particular, is more pronounced. The average simulated tidally-induced relative grounding line motion of the Petermann Glacier at the epochs of our QDInSAR survey was 45 and 38 m along the western and eastern flight-lines, respectively. By comparison, the mean actual grounding line variability measured along transects D and E adjacent to each flight-line (Fig. 2) was 193 and 281 m, respectively. We conclude, therefore, that ocean tides are responsible for only a small fraction (18% on average) of the observed grounding line movement.
Because the Petermann Glacier grounding line movement has been irregular in space (Fig. 7), it is possible that it has arisen through temporal changes in ice thickness. Such changes can be due to localised variations in the thickness of ice that is advected downstream, or temporal variations in the rate of basal melting. In the absence of detailed information on rates of basal ice melting, we examined the evidence for changes in inland ice thickness over time. Although there is some evidence for modest long-term change in dynamic ice thickness (0.15 m a−1) on Petermann Glacier (Pritchard and others, Reference Pritchard, Arthern, Vaughan and Edwards2009), given the geometrical configuration, these changes would not induce substantial grounding line motion. However, previous studies (Rignot and Steffen, Reference Rignot and Steffen2008) have shown that there are large (±25 m) stream-wise fluctuations in the thickness of the floating section (Fig. 10), which could potentially influence the location of the grounding line if they are advected downstream. To assess their potential impact, we characterised the ice thickness variations on Petermann Glacier by computing the ice thickness anomaly from the difference between the mean polynomial fit to the ice-surface elevation profiles within a 40 km region centred on the 2011 grounding line (Fig. 10). The mean absolute variability was 7.1 and 8.1 m along the western and eastern flight-lines respectively, with a combined range of 61.7 m. Ice thickness changes of this magnitude would lead to 490 m of grounding line motion – 2 to 3 times the observed variability – if they were to affect the glaciers hydrostatic balance.
Tidally-induced motion is too small to account for the range of grounding line migration observed on Petermann Glacier (Fig. 8). Moreover, when applied as a correction to the grounding line position, the simulated tidal motion does not reduce the variance in the observed grounding line position, suggesting that ocean tides are not the dominant cause of grounding line variability on Petermann Glacier. While localised ice thickness change many not fully translate into change in grounding line position due to the effect of lateral support from surrounding ice, the motion attributed to the range of ice thickness anomalies is greater than the observed mean grounding line variability and therefore may be sufficiently large to account for all the observed motion. Other factors, such as a change, or spatial variability in the basal boundary conditions, may have also modulated the grounding line position; however, new observations or a dedicated modelling study would be required to investigate this further. It is unclear what process has driven the relatively large shifts in grounding line position that have occurred at the glaciers north-east shear margin. Alternative causal mechanisms, such as adverse snow loading on the floating section or atmospheric pressure variations, are unlikely to exhibit spatial variability over scales small enough to induce such changes. In consequence, short-term changes in ice thickness remain the most likely cause of the observed grounding line motion.
6. CONCLUSIONS
We have used interferometric synthetic aperture radar data to create map the Petermann Glacier grounding line position on 17 occasions between 1992 and 2011. This dataset is the most comprehensive record of grounding line position for an ice stream to date. Using these data, we have been able to assess the ability of the AODTM-5 Arctic ocean tide model to simulate differential tides, despite the landward extent of the model domain ending 71 km from the grounding line. The RMS difference between the observed and modelled differential tides is 20.6 cm, ~5% of the tidal range in the Nares Strait, indicating that AODTM-5 provides reliable predictions in this region. Between 1992 and 2011, the Petermann Glacier grounding line advanced and retreated on numerous occasions and, while the average movement was just 470 m over the 19 a period, the range of grounding line positions spanned a 7.0 km distance. We conclude, therefore, that the Petermann Glacier is dynamically stable, consistent with observations of only modest changes in the thickness of the grounded ice inland (Pritchard and others, Reference Pritchard, Arthern, Vaughan and Edwards2009), though in contrast to several ice streams on the south-west coast of Greenland (Moon and others, Reference Moon, Joughin, Smith and Howat2012; Joughin and others, Reference Joughin, Smith, Shean and Floricioiu2014).
Assuming that the Petermann Glacier is in a state of hydrostatic balance, only a small proportion (18%) of the observed variation in grounding line position can be attributed to the influence of ocean tides. We conclude, therefore, that short-term changes in ice thickness are the likely source of grounding line motion. Although the glacier thickness is sufficiently variable to drive these changes, there is insufficient data to determine whether these changes are advected downstream and whether they affect the glaciers hydrostatic balance. Further work is required to characterise the range of short term grounding line motion exhibited on different ice streams, which should enable a more robust understanding of the physical mechanisms driving change to be achieved.
Although the technique of QDInSAR provides a precise estimate of ice-shelf tidal motion (to within 3.7 cm, on average) and of grounding line position (to within 30 m, on average), our analysis suggests that short-term fluctuations in grounding line position can be large (470 m on average). The impact of such changes should be taken into account when assessing grounding line migration over time; for example, had our survey consisted of measurements acquired in 1992 and 2011 only, the change in grounding line position could have been misinterpreted as a 2.3 km retreat across the main trunk of Petermann Glacier – 4.8 times larger than the mean variability (470 m) based on the entire 19 a dataset. Moreover, at Petermann Glacier the degree of grounding line motion associated with ocean tides and changes in ice thickness is relatively small when compared with other locations (Padman and others, Reference Padman, Fricker, Coleman, Howard and Erofeeva2002; McMillan and others, Reference McMillan2014), and so the impact of short-term variations may be even larger elsewhere. To overcome this problem, grounding line positions should be monitored on multiple occasions when attempting to quantify rates of migration over time.
ACKNOWLEDGEMENTS
This work was jointly funded by a NERC studentship, a European Space Agency (ESA) Young Graduate Trainee (YGT) position, and by the ESA ice sheets Climate Change Initiative (CCI) project. We thank ESA for acquiring and supplying the satellite dataset, which formed the basis of this study. ERS data was provided by the C1P.9925 project. We acknowledge the use of data and/or data products from CReSIS generated with support from NSF grant ANT-0424589 and NASA grant NNX10AT68G.


 Open access