

1 INTRODUCTION
Observations of the Galactic plane in the radio regime are dominated by five distinct components: H ii regions; supernova remnants (SNRs); the diffuse Galactic synchrotron background; pulsar wind nebulae, and background radio galaxies. Stars of spectral type ~ B0 or earlier (masses > 8 M⊙) produce a sufficient number of high-energy ultra-violet photons to ionise a large region of the surrounding interstellar medium (ISM). These regions of ionised gas are known as H ii regions and they can have a significant impact on the surrounding ISM through heating, photo-evaporation, and dissipation, and the formation of D-type shocks (Yorke Reference Yorke1986). H ii regions are therefore an important driver of the chemical and kinematic evolution in galaxies and may be responsible for triggering new episodes of star formation (Elmegreen & Lada Reference Elmegreen and Lada1977; Thompson et al. Reference Thompson, Urquhart, Moore and Morgan2012). The massive stars responsible for generating H ii regions have relatively short lifetimes on the order of ~ 10 Myr and so provide an unambiguous tracer of the current epoch of massive star formation (Zinnecker & Yorke Reference Zinnecker and Yorke2007). At the end of their lives, massive stars undergo core collapse resulting in a supernova and associated remnant, which emits in the radio regime. The diffuse Galactic synchrotron background is generated by the emission of cosmic ray electrons (CRes) interacting with magnetic fields. It is now widely accepted that these CRes are initially accelerated in supernova events and then proceed to propagate outwards into the ISM through diffusion and convection (Reynolds Reference Reynolds2008; Duric Reference Duric, Taylor, Landecker and Joncas1999). In addition to these Galactic sources of radio continuum emission, extragalactic sources comprising mainly radio galaxies are also observed.
One distinct characteristic of H ii regions compared to other sources of radio emission is their spectral index (α: S ν∝να). The radio continuum emission of H ii regions is generated by the thermal Bremsstrahlung mechanism (Rybicki & Lightman Reference Rybicki and Lightman1986). The radio spectral index of this process depends on the properties of the H ii region. For example in compact and classical H ii regions with sizes from s ≈ 0.5 to 10 pc; electron temperatures of T e ≈ 104 K; and electron densities of n e ≈ 107 to 102cm−3, the radio emission is optically thin above ~ 200 MHz with a spectral index of α ≈ −0.1. Below this frequency, such H ii regions become optically thick leading to a turnover and rapid steeping of the spectral index with values of ~ 2.0 (Kurtz Reference Kurtz, Cesaroni, Felli, Churchwell and Walmsley2005; Mezger & Henderson Reference Mezger and Henderson1967). In contrast, the radio emission associated with the diffuse Galactic background, SNRs, and extragalactic sources is generated by the synchrotron process. This process leads to a much steeper negative spectral index in the optically thin regime than thermal Bremsstrahlung. The average spectral index of the diffuse background synchrotron emission in the Galactic plane is α ≈ −0.8 (Platania et al. Reference Platania, Bensadoun, Bersanelli, De Amici, Kogut, Levin, Maino and Smoot1998) with typical values for SNRs of α ≈ −0.5 (Green Reference Green2014), background radio galaxies of α ≈ −0.85 (Lisenfeld & Völk Reference Lisenfeld and Völk2000), and pulsar wind nebulae of α ≈ 0.0 to − 0.3 (Weiler & Sramek Reference Weiler and Sramek1988). There are three cases where the spectral index of SNRs may result in a flatter or positive spectral index. First, all SNRs will turnover into the optically thick regime due to synchrotron self-absorption at very low frequency (~ 1 MHz; Ginzburg & Syrovatskii Reference Ginzburg and Syrovatskii1969). At frequencies below ~ 100 MHz, the SED of some SNRs have been found to turnover into the optically thick regime due to the presence of foreground absorbing gas (Kassim et al. Reference Kassim, Perley, Dwarakanath and Erickson1995). Finally, the spectral index of very young and resolved SNRs have been found to flatten towards the central regions due to absorption by thermal ejecta associated with the SNR (DeLaney et al. Reference DeLaney, Kassim, Rudnick and Perley2014). If consideration is given to these cases, the spectral index can be used as a tool for identifying H ii regions in the Galactic plane.
Surveys for H ii regions have tended to be carried out using tracers such as their mid-infrared (MIR) colour and morphology, which probes the emission of heated dust (Anderson et al. Reference Anderson, Bania, Balser, Cunningham, Johnstone and Armentrout2014; Churchwell et al. Reference Churchwell2006; Urquhart et al. Reference Urquhart, Hoare, Lumsden, Oudmaijer, Moore, Beuther, Linz and Henning2008). Observations of hydrogen radio recombination lines (RRL) are also commonly used (Caswell & Haynes Reference Caswell and Haynes1987; Bania et al. Reference Bania, Anderson, Balser and Rood2010; Bania, Anderson, & Balser Reference Bania, Anderson and Balser2012). Wide area radio continuum surveys of H ii regions have been primarily carried out at frequencies above 1 GHz and concentrated on searching for young and compact H ii regions. These studies include: the Coordinated Radio and Infrared Survey for High-Mass Star Formation (CORNISH) survey at 5 GHz (Hoare et al. Reference Hoare2012), the combined 20 GHz and 843 MHz study by Murphy et al. (Reference Murphy, Cohen, Ekers, Green, Wark and Moss2010), and the 1.4 and 5 GHz study carried out by Giveon et al. (Reference Giveon, Becker, Helfand and White2005). Surveys such as these can be effectively used to identify H ii regions but require the use of ancillary data, primarily infra-red observations, to positively identify H ii regions. The low-frequency regime and multiple frequency bands of the Murchison Widefield Array (MWA) provide an opportunity to uniformly survey large areas of the Galactic plane and identify optically thick H ii regions by their spectral index and characterise their SEDs at low frequency.
Studies of the Galactic plane at low frequency are limited and have historically had poor angular resolution resulting in H ii regions being poorly characterised below 1 GHz. One of the most sensitive radio surveys below 1 GHz is the Molonglo Galactic Plane Survey (MGPS) I and II at 843 MHz (Green et al. Reference Green, Cram, Large and Ye1999; Murphy et al. Reference Murphy, Mauch, Green, Hunstead, Piestrzynska, Kels and Sztajer2007). The MGPS catalogue has good coverage (245° < l < 365°), resolution (~ 45 arcsec), and sensitivity (1–2 mJy beam−1). Cross matching between the MGPS survey and MIR data from the Midcourse Space Experiment (MSX; Mill et al. Reference Mill1994) has been used by Cohen & Green (Reference Cohen and Green2001) to identify H ii regions. However, MGPS images suffer from significant artefacts, a limited bandwidth (3 MHz), and poor spatial sensitivity that limits the ability to sample angular scales above ~ 30 arcmin. This makes characterising H ii regions difficult and prone to underestimating the total flux density. The Southern Galactic Plane Survey (SGPS; Haverkorn et al. Reference Haverkorn, Gaensler, McClure-Griffiths, Dickey and Green2006) observed the Galactic plane between 253° < l < 358° at 1 420 MHz with a resolution of 100 arcsec and sensitivity of 0.3–0.6 mJy beam−1. Whilst this is not typically characterised as the low-frequency regime, we mention the survey here as we make use of it later in Section 5.2. Like the MGPS, the spatial sensitivity of the SGPS is limited to structures < 30 arcmin. The inner Galaxy has been studied at 74 MHz using the Very Large Array (VLA) in multiple configurations (Nord et al. Reference Nord, Henning, Rand and Lazio2006) (hereafter VLA 74). These observations have good resolution and sensitivity (~ 10 arcmin) but only mapped a small region of between 26° > l > −15°. The VLA has also surveyed the northern sky at 74 MHz in the VLA Low-frequency Sky Survey (VLSS), which was re-reduced as the VLA Sky Survey Redux (VLSSr; Lane et al. Reference Lane, Cotton, van Velzen, Clarke, Kassim, Helmboldt, Lazio and Cohen2014). The VLSSr has good sensitivity and resolution (0.1 Jy beam−1 and 75 arcsec) but lacks sensitivity to sources on spatial scales above ~ 23 arcmin. The 408 MHz survey of Haslam et al. (Reference Haslam, Salter, Stoffel and Wilson1982) mapped the entire Galactic plane using the single-dish Parkes and Jodrell Bank MK1A telescopes. This means that all spatial scales are sampled; however, studies of individual H ii regions are not possible due to the large 51 arcmin beam. The Westerbork Galactic Plane Survey at 327 MHz (WENSS; Taylor et al. Reference Taylor, Goss, Coleman, van Leeuwen and Wallace1996) and the Canadian Galactic Plane Survey (CGPS; Taylor et al. Reference Taylor2003) at 408 MHz have carried out surveys of the northern Galactic plane with a resolution of ~ 1 and 3 arcmin and sensitivities of 10 and 3 mJy beam−1, respectively. The CGPS is an interferometric study that made use of the single-dish maps of Haslam et al. (Reference Haslam, Salter, Stoffel and Wilson1982) to recover spatial information on large scales. There has not yet been a low-frequency survey of the southern Galactic plane of sufficient resolution, bandwidth, and sensitivity to large scale structure to study H ii regions in detail at low frequency. In particular, the limited bandwidth and spatial sensitivity of surveys such as MGPS and SGPS are unable to study the SED of Galactic emission.
Characterising the low-frequency SED of H ii regions can provide important constraints on physical properties, such as the electron density and ionising flux, by identifying the turnover frequency, which is the point at which the H ii region becomes optically thick (Mezger & Henderson Reference Mezger and Henderson1967). These optically thick H ii regions can also be seen as absorption features against the extended CRe synchrotron Galactic background. This allows the emissivity of CRes behind the H ii region to be derived and can also be used to study the three-dimensional relativistic gas content in the Galaxy (Sun et al. Reference Sun, Reich, Waelkens and Enßlin2008; Nord et al. Reference Nord, Henning, Rand and Lazio2006). In some cases, numerous optically thick H ii regions can lead to a drop in the synchrotron dominated integrated radio continuum of a galaxy, which may have important implications for models of starburst galaxies (Lacki Reference Lacki2013; Kassim Reference Kassim1989).
Recent developments in instrumentation are for the first time allowing wide-field, high resolution, and sensitive observations at low frequency. Instruments such as the GMRT (Swarup et al. Reference Swarup, Ananthakrishnan, Kapahi, Rao, Subrahmanya and Kulkarni1991), JVLA (Clarke et al. Reference Clarke, Kassim, Helmboldt, Ray, Peters, Hicks, Brisken, Perley, Owen and Intema2015), LOFAR (van Haarlem et al. Reference van Haarlem2013), and the MWA have either performed or are in the process of performing large-area sky surveys at low frequency. In this paper, we present a technique for identifying H ii regions using multi-band observations at low frequency. The resultant catalogue of H ii regions was compiled using the GaLactic Extragalactic All-sky MWA (GLEAM: Wayth et al. Reference Wayth2015) survey between 72 and 231 MHz. The GLEAM observations allow us to probe new areas of parameter space as compared with existing Galactic plane surveys (see Figure 1). In particular, using the MWA we are able to examine a largely unexplored frequency range on large spatial scales, making this an ideal work to detect H ii regions. The paper is organised as follows: in Section 2, we discuss our observations and data analysis process. In Section 3, we present our method for detecting and characterising H ii regions and provide a sample of our catalogue in Section 4. We present our discussion of these results in Section 5, which includes: uncertainties, the physical properties of H ii regions that show signs of spectral turnover; and a comparison to the H ii region catalogue constructed by Anderson et al. (Reference Anderson, Bania, Balser, Cunningham, Johnstone and Armentrout2014).
Top panel: this plot shows the logarithm of the frequency vs. sensitivity for low-frequency Galactic surveys (< 1.4 GHz). Bottom panel: the spatial sensitivity and corresponding sensitivity, scaled to 1.4 GHz assuming a spectral index of − 0.7. The CGPS survey includes single dish data and so recovers all spatial information. The MWA provides both high sensitivity and access to a broader range of angular scales compared with previous surveys of the Galactic plane.

2 OBSERVATIONS AND DATA ANALYSIS
We use observations that utilise the MWA interferometer, which is the low-frequency precursor for the Square Kilometre Array (SKA), located at the Murchison Radio-astronomy Observatory in Western Australia. We provide a brief description of the MWA here and direct the reader to Tingay et al. (Reference Tingay2013) and Bowman et al. (Reference Bowman2013) for a detailed description of the MWA and its science goals. The MWA consists of 128 ‘tiles’ of 16 dipoles, each with two polarisations, which are distributed in a dense core < 1.5 km in diameter with a sparser distribution of tiles out to a diameter of approximately 2.5 km. This layout coupled with the very large number of antenna elements gives the array excellent snapshot u,v coverage and sensitivity to low surface brightness emission. The field of view (FoV) of the MWA is 610 to 375 deg2 with a resolution from ~ 6 to 2 arcmin and spatial sensitivity to structures from ~ 3 to 950 arcmin, depending on frequency. The MWA operates at frequencies between 72 and 300 MHz with an instantaneous bandwidth of 30.72 MHz.
2.1. The GLEAM survey
The observations presented in this study were obtained as part of the GLEAM survey (Wayth et al. Reference Wayth2015). The GLEAM survey has observed the entire southern sky from a declination (δ) of + 25° to − 90°. Observations were obtained using drift-scans at a range of declination settings (δ = +18.6°, + 1.6°, − 13.0°, − 26.7°, − 40.0°, − 55.0°, − 72.0°). Snapshots of 112 s were collected in five 30.72 MHz wide frequency bands between 72 and 231 MHz centred on 87.67, 118.40, 154.24, 184.96, and 215.68 MHz (hereafter 88, 118, 154, 185, and 216 MHz). Scans of bright compact sources were obtained every 2 h for use as calibrators. This results in 55 snapshots per frequency per night. The δ = −55.0° observations used in this study were obtained on 2014 March 17 and cover the sky from an RA of 6–16 h.
2.2. Data reduction
The data reduction process used to flag, calibrate, and image individual snapshots follows a process very similar to that used in the MWA commissioning survey presented in Hurley-Walker et al. (Reference Hurley-Walker2014). The post processing steps, which includes establishing a flux density scale and mosaicking, follows the method utilised in the GLEAM survey pipeline (Wayth et al. Reference Wayth2015; Hurley-Walker et al., in preparation).
For each snapshot, the raw data from the correlator were first processed through the cotter pipeline (Offringa et al. Reference Offringa2015). This is a pre-processing pipeline designed to perform initial flagging and radio frequency interference excision using aoflagger, data-averaging to 1 s time and 40 kHz frequency resolution, and conversion of the data into the measurement set format readable by casaFootnote 1 . A single complex gain solution was determined for each tile and frequency using the bandpass routine on a single pointed observation of Hydra A. The calibrated Stokes XX and YY snapshots were then imaged using the clean task with a robust weighting of 0.0. The pixel size for each image is set to 0.75 arcmin. This results in the synthesised beam being sampled by three pixels in the highest frequency image and leads to an oversampling of the synthesised beam at the lowest frequency by approximately seven pixels.
The poor sampling of low-frequency radio sources complicates the characterisation of the flux density scale in our 55 snapshots. The only large scale survey carried out at these declinations is the Molonglo Reference Catalog (MRC) survey at 408 MHz (Large et al. Reference Large, Mills, Little, Crawford and Sutton1981). To define the flux density scale in our snapshots, we first perform source finding using the aegean algorithm (Hancock et al. Reference Hancock, Murphy, Gaensler, Hopkins and Curran2012) to produce a catalogue of sources in each Stokes XX and YY snapshot. We remove faint and extended sources and cross match the resulting catalogue of bright and unresolved sources with the MRC catalogue. This results in ~ 200 sources per snapshot that we use to characterise the flux density scale. To determine the correction, we need to apply to the flux density scale in each MWA snapshot, we first scale the MRC flux density to the appropriate MWA central frequency by assuming a spectral index of − 0.85. The applied correction is the average of the ~ 200 sources weighted by the MWA source peak flux density divided by the local noise (rms). This provides an initial flux density scale in each snapshot that we refine in an additional step described below.
At low frequency, the ionosphere generates slow astrometric changes in source position that can result in shifts on the order of 10–20 arcsec in 112 s GLEAM snapshots at 154 MHz (Loi et al. Reference Loi2015). In an effort to correct for these shifts in the apparent position of sources, we cross match the position of compact sources detected in each of the GLEAM snapshots with MRC sources to determine an average astrometric correction and update the headers in each snapshot accordingly. This method results in a residual offset in source position and is discussed further in Section 3.3.
The topology and wide FoV of the MWA means that the w-term in the standard two-dimensional visibility equation can no longer be assumed to be zero (Thompson Reference Thompson, Taylor, Carilli and Perley1999). The varying w-term in each snapshot leads to a systematic positional offset increasing with distance from the centre of the observed field. To account for this effect, the coordinate system of each sine projected snapshot was corrected by adding fits keywords to the header that allow us to represent the slant orthographic correction (Perley Reference Perley, Taylor, Carilli and Perley1999; Calabretta & Greisen Reference Calabretta and Greisen2002). The effect of w-projection also leads to sources being smeared out on a small scale. As sources appear further from the phase centre, this effect becomes more apparent. Our reduction method is unable to account for this effect as at the time of the analysis the CASA implementation of w-term correction was found to be far too computationally expensive. However, the Galactic plane is well centred in the primary beam in the majority of our snapshots and we primarily study resolved sources where the effects of w-term smearing are minimised.
After applying these corrections, we combine the stokes XX and YY snapshots in each band into large scale mosaics using swarp (Bertin et al. Reference Bertin, Mellier, Radovich, Missonnier, Didelon, Morin, Bohlender, Durand and Handley2002). Analysis of large scale GLEAM mosaics such as those produced here has revealed residual variation in the flux density with declination (Hurley-Walker et al., in preparation). This is caused by errors of order 5–20% in the primary beam model of the MWA (Sutinjo et al. Reference Sutinjo, O’Sullivan, Lenc, Wayth, Padhi, Hall and Tingay2015). To correct for this variation and refine the flux density scale, we adopted the strategy that is used in the GLEAM survey. This process involves identifying a sample of sources that are 8σ above the noise floor of the MWA mosaic and brighter than 2 Jy in VLSSr. These sources must also be: detected in MRC and NRAO/VLA Sky Survey (NVSS; Condon et al. Reference Condon, Cotton, Greisen, Yin, Perley, Taylor and Broderick1998); unresolved at all the observed frequencies; isolated from potentially confusing sources including the Galactic plane; and have a spectrum that was well fit by a power law. Correction factors were derived by comparing the measured MWA flux density and the expected flux density derived from the power law fit to a source’s spectrum. A polynomial was then fit to the correction factors as a function of declination to remove the residual primary beam uncertainties. Since the necessary frequency coverage of VLSSr is not available at the low declination of the δ = −55.0° observations, we exploited the symmetrical nature of the MWA beam to derive the flux density dependant correction in the δ = +1.6° drift scan and mirrored the results to the δ = −55.0° region. Note that in this process, all surveys used were placed on the absolute flux density scale of Baars et al. (Reference Baars, Genzel, Pauliny-Toth and Witzel1977). Due to the slight variation in the correction factors, our flux density measurements have a systematic uncertainty of ~ 5–8%.
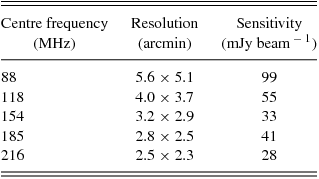
Combining wide-field snapshots that have residual ionospheric and w-term errors results in a distortion of sources and a blurring of the point spread function (PSF). This blurring of the PSF varies across the mosaic depending on the ionospheric conditions at the time and also the location of sources within the primary beam. The magnitude of these variations is 10–30% and leads to a decrease in peak flux measurements in our mosaics. Again, we correct for this following the same approach as the GLEAM survey. We characterise the PSF across our images by selecting unresolved and isolated MRC sources and fit the sources with a Gaussian model. We then use these results to map the position dependant PSF and correct the peak fluxes in our images accordingly. We summarise the resolution and sensitivity in our MWA mosaics in Table 1. Given the angular resolution of these observations, ~ 5.3–2.3 arcmin, we expect to resolve H ii regions with physical sizes > 1–31 pc at distances from 1–20 kpc, respectively. The sensitivity to angular scales up to ~ 950–390 arcmin results in sensitivity to structures of < 270 and < 5400 pc at distances of 1–20 kpc. This allows us to recover flux from the largest of H ii regions (~ 100 pc: Kurtz Reference Kurtz, Cesaroni, Felli, Churchwell and Walmsley2005) at all bands which makes spectral index studies possible. With the exception of the CGPS in the northern sky, previous surveys have had to sacrifice good spatial sensitivity for resolution or have had limited Galactic coverage.
Summary of the image properties for each of our MWA Galactic plane mosaics.
3 SOURCE-FINDING
To identify and define the boundaries of features in our Galactic plane images, we employ the fellwalker clump finding algorithm (Berry Reference Berry2015), which is part of the starlink project. fellwalker is an automated thresholding approach to source detection that identifies contiguous features in an image by finding the paths of steepest gradient for each pixel. Starting with the first pixel in an image, each of the surrounding pixels is inspected to locate the pixel with the highest ascending gradient. This process continues until a peak is located (i.e., a pixel surrounded by flat or descending gradients). The pixels along the steepest path to the peak are assigned an arbitrary integer to represent their connection along a path. All pixels in the image are inspected in a similar process and the image is segmented into clumps by grouping together all paths that lead to the same peak pixel. The output of this process is an image with the identified regions specified by their clump number which can be used as a template to perform aperture photometry.
We chose to use fellwalker over other thresholding algorithms such as clumpfind (Williams, de Geus, & Blitz Reference Williams, de Geus and Blitz1994) and blobcat (Hales et al. Reference Hales, Murphy, Curran, Middelberg, Gaensler and Norris2012) due to our familiarity and successful application of the algorithm to identify similarly complex emission in the Galactic plane (Hindson et al. Reference Hindson, Thompson, Urquhart, Clark and Davies2010). In addition, fellwalker makes no assumptions as to the shape of a source, which makes it suited to characterising complex emission features. Source finding algorithms currently in use such as those above work in fundamentally the same way by applying a thresholding approach to source detection. There are very few, if any, automatic source detection algorithms that are able to robustly characterise complex or occluded sources (see Hollitt & Johnston-Hollitt Reference Hollitt and Johnston-Hollitt2012 for a discussion). Regarding fellwalker, the gradient-based approach allows it to deal reasonably well with complex topologies and it allows easy manual manipulation of the identified regions if necessary.
We apply the source finding process to the 216 MHz MWA mosaic, which has the best resolution and sensitivity and probes the part of the H ii regions spectral profile where emission is expected to be brightest. Before applying the fellwalker algorithm, we first filter out the extended Galactic background emission by applying the spatial filtering algorithm findback, which is also part of the starlink project. This algorithm works by applying a three-stage filtering process. First, each pixel within a user specified box size is replaced with the minimum value. The box size specifies the minimum size of features that will remain in the image. The pixels in this minimum filtered image are then replaced by pixels with the maximum value. The final step is to replace each pixel by the mean value within the boxed region. A region size of 0.5 × 0.5° was chosen; this corresponds to the average size of the compact emission features seen in the image and resulted in the effective removal of the diffuse Galactic background emission. We did note a reduction in the flux density measurements for sources larger than the chosen region size in this filtered image. However, this does not affect the ability of the fellwalker algorithm to identify features. Finally, we create a 216 MHz signal-to-noise image to account for variations in the image noise that would affect the thresholding source detection.
The resultant template image was carefully checked by eye to ensure that the identified regions closely matched the emission features in the Galactic plane. We found that fellwalker was able to accurately define emission features in the majority of cases. There were a few instances where the algorithm incorrectly features into multiple components or failed to properly trace very complex and blended emission features. In these cases, we manually altered the template regions. An example of the template regions produced by fellwalker can be seen in Figure 2.
Here, we show the output of our source finding process for a complex (top panel) and simple (bottom panel) source. The green contours are taken from our signal-to-noise 216 MHz image and have a signal-to-noise level of 2, 10, 20, 30, 40, 50. In the top panel, the different highlighted regions indicate where the algorithm has separated the region into distinct clumps.

3.1. Galactic background estimation
To estimate the integrated flux density and spectral index of H ii regions in our MWA images, we must first account for the large-scale diffuse Galactic synchrotron background. H ii regions in our images are contaminated by the synchrotron background, which results in an increase in the measured integrated flux density at lower frequencies and a corresponding flattening of the H ii region spectral index. The filtering process (findback) used to eliminate the Galactic background in our source finding step was not suitable because it was found to decrease the flux density of larger sources. In an effort to characterise the Galactic background more accurately, we make use of the bane background estimation algorithmFootnote 2 . bane applies a sliding boxcar filter over an image and provides an estimate of the background emission and noise. We found it difficult to obtain a good estimate of the Galactic background using Bane alone. We were unable to produce an estimate of the background that did not contain residual emission from large and bright sources in the Galactic plane. We solved this problem by masking all emission features that were included in our initial fellwalker template. We then run bane to determine the background and use cubic interpolation to fill in the gaps where sources have been masked. Cubic interpolation was chosen over other methods such as linear or quadratic because it was found to more accurately recover the background emission. We then use this background image to subtract the estimated integrated background flux density from our raw H ii region integrated flux densities. An example of the effect of background subtraction applied to the G326.23+0.72 H ii region is shown in Figure 3. We discuss the errors associated with this approach in Section 3.3.
This plot shows the background subtraction for the G326.23+0.72 H ii region. Top: blue squares indicate the integrated flux density; green triangles show the integrated background emission; and red circles show the integrated flux density with the background subtracted. Bottom: G326.23+0.72 at 88 (left panel) seen in absorption and 216 MHz (right panel).

The background subtracted integrated flux density and spectral index is only applicable for H ii regions that may be easily distinguished from the Galactic background synchrotron emission. In the cases where an H ii region is blended with the Galactic synchrotron background, we are unable to estimate the fraction of the observed flux that is due to the H ii region or background. This occurs primarily in the 88 and 118 MHz bands where the synchrotron background is brighter and the H ii emission is fainter. If ignored, then this effect would lead to very steep and non-physical spectral indices. We only fit the spectral index using frequency bands where the raw H ii region integrated flux is at least two times greater than the integrated background. As an example, the spectral index for the raw integrated flux density for G326.23+0.72 shown in Figure 3 is 0.4 ± 0.2 (blue line), the background has a spectral index of − 0.9 ± 0.3 (green-dashed line). When we subtract this background, we find a spectral index for the H ii region of 1.8 ± 0.3 (red line).
3.2. H ii region identification
The output of our source detection is an image with the features defined by an arbitrary number that can be used as a template to perform aperture photometry in our MWA images. The features identified by fellwalker are comprised of primarily H ii regions, SNRs, and background radio sources. We take advantage of the multiple bands provided by the MWA to identify H ii regions by eye. We first construct a three-colour image using the 88, 118, and 216 MHz bands in red, green, and blue, respectively (Figure 4). Selecting this colour combination reveals optically thick H ii regions by their distinct blue colour. Optically thick H ii regions appear blue due to their steep positive spectral index of ~ 2.0. SNRs, the Galactic background, and background radio galaxies on the other hand appear to be red to white due to the steep negative spectral index of synchrotron emission ~ − 0.7. To identify H ii regions, we first select all the features in our template that correspond to blue sources. We then verify that these sources have a steep spectral index characteristic of an optically thick H ii region by extracting the integrated flux density using our source finding template and subtracting the corresponding Galactic background emission. We fit the SED across our MWA band and apply a spectral index selection criteria for H ii regions, which requires the source to have a spectral index of > 0.0. This limits our H ii region sample to optically thick H ii regions. However, we do not expect to detect optically thin H ii regions given the low frequency, resolution, and sensitivity limits of the MWA.
This three-colour image is constructed using the 88, 118, and 216 MHz MWA images in red, green, and blue, respectively. This combination results in H ii regions being seen as distinctive blue emission. H ii regions identified as part of the G305 massive star forming complex by Anderson et al. (Reference Anderson, Bania, Balser, Cunningham, Johnstone and Armentrout2014) are shown by green circles.

As an H ii region evolves, its diameter (s) increases and the electron density (n e) and emission measure (EM = ∫n 2 e ds) decreases. The relationship between emission measure and H ii region diameter is EM = 6.3 × 10⁵ D −1.53 ± 0.09 (Garay & Lizano Reference Garay and Lizano1999). This results in the frequency at which the radio continuum emission turns over from optically thin (α = −0.1) to thick (α = 2.0) to shift to lower frequencies as an H ii region evolves. H ii regions are commonly classified based on their size and emission measure into the following classes: hypercompact (≲ 0.03 pc, ≳ 109 pc cm−6), ultracompact (≲ 0.1 pc, ≳ 107 pc cm−6), compact (≲ 0.5 pc, ≳ 106 pc cm−6), and classical (~ 10 pc, ≳ 104 pc cm−6). These classes represent a continuous distribution of H ii region properties rather than discreet classes. Assuming a spherical, homogenous, isothermal H ii region with an electron temperature of 104 K, we can plot the expected SED for these classes of H ii regions using equations (1– 4) of Mezger & Henderson (Reference Mezger and Henderson1967). Figure 5 shows that we are unlikely to detect any hypercompact or ultracompact H ii regions given that their SED turns over in the GHz regime and then quickly drops off below our detection threshold. H ii regions that we expect to detect will lie between the compact and classical classes. The SED of these types of H ii region are expected to be either optically thin or within the turnover regime where the optical depth is unity (τ = 1). This figure also demonstrates that we are likely to miss H ii regions at large Galactic distances (~ 20 kpc) due to the sensitivity of our observations.
This plot shows the model SEDs for hypercompact (green), ultracompact (blue), compact (red), and classical (black) H ii regions. The dashed black line shows the expected SED for H ii regions that follow the relation EM = 6.3 × 10⁵ D −1.53 ± 0.09 for diameters of 8, 5, and 2 pc. The top panel shows the expected flux at 1 kpc whilst the bottom panel shows the expected flux at 20 kpc. The shaded region shows the 5-sigma sensitivity limit and bandwidth thresholds of our MWA images.

To demonstrate the effectiveness of this method of selecting optically thick H ii regions, we present a small subregion in Figure 4. The massive star-forming complex known as G305 is comprised of a number of H ii regions (Clark & Porter Reference Clark and Porter2004; Hindson et al. Reference Hindson, Thompson, Urquhart, Faimali, Johnston-Hollitt, Clark and Davies2013) and can be clearly seen as bright blue emission whilst the SNR G304.6+0.1 (Green Reference Green2014) and background source PMN J1302-6257 appears bright white. We take advantage of these spectral properties to detect SNRs in the Galactic plane and present the results in Johnston-Hollitt et al. (in preparation).
The resolution of the MWA limits us to identifying H ii regions with sizes > 1 to > 31 pc depending on distance (1–20 kpc). Given the frequency regime and sensitivity of the MWA, we can expect to detect optically thick H ii regions from the compact to classical stage with sizes of ≳ 0.5 to > 10 pc. Massive star formation occurs in large star forming complexes which results in multiple epochs of H ii regions, with a range of sizes, in close proximity Murray & Rahman (Reference Murray and Rahman2010). It is therefore unsurprising that we see evidence of blended H ii regions present in massive star-forming complexes such as in the case of G305. In Figure 4, we overlay the H ii regions identified by the high-resolution (6–12 arcsec) detected H ii regions of Anderson et al. (Reference Anderson, Bania, Balser, Cunningham, Johnstone and Armentrout2014), which was compiled using the Wide-Field Infrared Survey Explorer (WISE; Wright et al. Reference Wright2010) at MIR wavelengths from 3.4 to 22μm and ancillary data. G305 is clearly associated with many more H ii regions than we are able to resolve.
3.3. Uncertainties
To determine the positional uncertainty in each of our MWA images, we compare the peak flux density position of MWA point sources, compiled using Aegean, to those in the MRC survey within ± 15° of the Galactic plane. We find a persistent positional offset between our MWA sources and the matched MRC sources in both right ascension and declination (Figure 6). We find an average offset for each increasing band from 88 to 216 MHz of 102, 89, 80, 69, and 60 arcsec, respectively. These offsets are smaller than the synthesised beam in each band and correspond to an offset of approximately a third of a beam. The source of this offset lies in the w-term and ionospheric effects. Given the large synthesised beam and extended nature of the majority of our H ii region sample, we find that this offset is an acceptable level of accuracy.
Plot of the offset (MWA position minus MRC position) in right ascension (Δα) and declination (Δδ) in units of arcseconds for 792 bright point sources found within ± 15° of the Galactic plane in our 154 MHz MWA image.

Centaurus A (Cen A) is responsible for introducing significant contamination resulting in an approximately two-fold increase in the local noise between Galactic longitudes of 206<l<307°. Attempts were made to peel Cen A from the image using standard peeling techniques (e.g., Mitchell et al. Reference Mitchell, Greenhill, Wayth, Sault, Lonsdale, Cappallo, Morales and Ord2008). However, due to the complex nature and extreme brightness of Cen A (peak flux density of 456 Jy at 154 MHz) we were unable to satisfactorily peel the source. The flux density estimates in our catalogue within this region reflect the increase in the local noise caused by Cen A.
To determine the accuracy of our background subtraction method, we inject a Gaussian shaped model source with a randomly selected flux density, size, and position into each of our MWA images. In each band, we choose a flux density range that starts at 1 Jy and upper limits of 40, 30, 20, 15, and 10 Jy for each increasing band starting from 88 MHz. The size of the Gaussian sources range from 0.1 to 1.0°. We compare the integrated background flux density in our MWA image before injecting the source to the background estimated after applying our background estimation approach described in Section 3.1. We carry out this procedure 1 000 times and find that on average our estimated background is accurate to approximately 20% for each band.
The uncertainty for the flux densities are calculated using the uncertainty derived from the flux density scale, local noise uncertainty, and the error associated with the background estimation where appropriate combined in quadrature.
Optically thick SNRs and absorption processes could potentially contaminate our selection method, which is based on a source having a steep positive spectral index. The spectral index of SNRs can increase due to a number of processes including: synchrotron self-absorption; intrinsic free-free self-absorption due to thermal ejecta; and extrinsic free-free absorption by a foreground source. Synchrotron self-absorption is expected to occur only in very bright and very compact SNRs and results in spectral indices between α = 2.0 and 2.5 (Longair Reference Longair and Malcolm2011; Ginzburg & Syrovatskii Reference Ginzburg and Syrovatskii1969). However, for a typical SNR with a solid angle of 1 arcmin2, magnetic field of 10 μG and flux density of 100 Jy at 150 MHz synchrotron self-absorption would occur at 1 MHz. It is therefore highly unlikely that such a process would contaminate our results and we can disregard this mechanism. In the case of intrinsic free-free self-absorption, thermal ejecta associated with young SNRs (on the order of 103 yr) may cause a flattening of the SED towards the centre of SNRs. For example, the resolved spectral index of the SNR Cassiopeia A has been found to flatten to − 0.35 between 330 and 74 MHz (Brogan, et al. Reference Brogan, Lazio, Kassim and Dyer2005; DeLaney et al. Reference DeLaney, Kassim, Rudnick and Perley2014) due to this effect. The spectra of such SNRs is still dominated by the synchrotron process and we do not expect such young SNRs to be resolved by the MWA except in the case of nearby and obvious SNRs such as Vela. We note that the spectral index of the Vela SNR, located at l = 263.9, b = −03.3, ranges from − 1.3 towards the edge to 0.2 towards the centre with an integrated spectral index of − 0.3 ± 0.1 between 88 and 216 MHz. This is in good agreement with previous findings where the spectral integrated index is approximately − 0.39 ± 0.03 between 30 and 8 400 MHz (Alvarez et al. Reference Alvarez, Aparici, May and Reich2001). The shallow spectral index of Vela does not satisfy our selection criteria (α > 0.0) but does result in a somewhat blue colour in our three-colour image towards the centre of Vela. Finally, it has been suggested that free–free absorption along the line of sight is responsible for a turnover in the SED of ~ 2/3 of Galactic SNRs below 100 MHz (Kassim Reference Kassim1989; Lacey et al. Reference Lacey, Lazio, Kassim, Duric, Briggs and Dyer2001). The foreground sources responsible may be due to low-density (n e ~ 1–10 cm−3), intermediate temperature (T ~ 5000 K) ionised thermal gas or H ii regions. We would only expect such SNRs to turnover below 100 MHz. Given the frequency bands of the MWA, this would result in only the 88 MHz band being affected which would not lead to a significant change in our spectral index measurements.
Both mechanisms of absorption in SNRs by the free–free mechanism are observed at frequencies below 100 MHz. In comparison, Hii regions with typical physical properties, see Section 5.2, are expected to be optically thick between approximately 10 and 400 MHz and optically thin above 400 MHz. Given the resolution and frequency band coverage of the MWA, we do not expect to detect SNRs that could be mistaken as H ii regions. In fact, the frequency coverage of the MWA provides us with the unique opportunity to identify H ii regions that are projected against SNRs. To check for any contamination, we compare our catalogue of H ii regions to the catalogue of SNRs compiled by Green (Reference Green2014). We find that none of our H ii regions are coincident with known SNRs presented in the Green (Reference Green2014) catalogue.
The low resolution of these observations results in the blending of discrete H ii regions. For sources that are part of the same complex, this leads to an averaging of the emission across multiple H ii regions in the complex. For cases where H ii regions lie at different distances but along the same line of sight H ii regions that are not physically associated will be blended together.
4 RESULTS
We find a total of 306 H ii regions, which are shown in Figure 7. We present a small section of the resultant catalogue in Table 2. This table reports the background subtracted integrated flux density and associated spectral index. A machine readable version of the complete catalogue, which includes the raw and background integrated flux densities can be found online via VizierFootnote 3 .
Three-colour image generated using our 88, 118, and 216 MHz MWA images in red, green, and blue, respectively. At these low frequencies, the thermal free–free emission of H ii regions leads to a distinctly steep spectral index of ~ 2.0 compared to the − 0.8 to − 0.5 spectral index of the Galactic background and supernova remnants, respectively. Using this colour scheme results in H ii regions appearing blue, whilst other features appear white to red. H ii regions detected in our source-finding step are indicated by green ellipses.

The first 50 of 306 H ii regions identified in this study with increasing distance from the Galactic centre. The integrated flux density measurements have had the background component subtracted. Due to space limitations, we present only the 88, 185, and 215 MHz results here and refer the reader to the full version of the catalogue which may be found online. This full version also contains the integrated flux density of MGPS and SGPS sources where available.

We identify 45 optically thick H ii regions that can be seen as absorption features against the diffuse Galactic background synchrotron emission. Theses H ii have an integrated flux density at 88 MHz that is lower than the associated Galactic background. An example of such an H ii region can be seen in the bottom left panel of Figure 3. These H ii regions are concentrated towards the Galactic centre, between 314 and 340°, where the diffuse Galactic background is brightest.
4.1. Source properties
We apply the source finding template to our five MWA images to perform aperture photometry and extract the peak, integrated, and background flux density and spectral index. We characterise the source centre and size of the major and minor axes by computing the spatial moments (or ‘inertial axes’) of each source in the 216 MHz image. We determine the position angle of the major axes, which allows us to define the H ii regions as an ellipse. The integrated source and background flux density is derived by extracting the flux density within the template regions. We then subtract the corresponding background level to arrive at the background subtracted integrated flux density of the H ii region. We determine the spectral index for each source by fitting the background subtracted integrated flux density across our five MWA bands using a least-squares fit to the function S ν = aνα. Using this criteria, we are able to determine the spectral index towards 184 H ii regions and find an average spectral index of 1.5 with a standard error on the mean of 0.05. This is slightly lower than the expected values of 2.0, which suggests that we may have underestimated the contribution by the synchrotron background or that some H ii regions are in the regime where the optical depth is beginning to turnover from optically thick to optically thin. We find 17 H ii regions with spectral indices that are greater than 2.0 after including the uncertainty. Most of these H ii regions (12) are absorption features in the 88 MHz band, which would account for the steeper than expected spectral index. The high spectral index for the remaining five H ii regions is mostly likely due to an overestimation of the background contribution in the lower frequency bands. For comparison, the average spectral index of the raw integrated flux density estimates for our H ii regions is much shallower at α = 0.4. We also determine the spectral index for the background estimate and find an average value of − 0.7 as expected for optically thin synchrotron emission.
We define the angular size of a source using the geometric mean of the ellipsoid major and minor axis given in columns 4 and 5 of Table 2. The angular size of the MWA H ii regions ranges from 2 to 39 arcmin with a mean of 6.0 arcmin. The distribution of angular sizes can be seen in Figure 8.
The angular size distribution for the sample of H ii regions identified in our MWA three-colour images. The mean angular size of 6.0 arcmin is shown by a dashed red line.

5 DISCUSSION
5.1. H ii regions blended with SNRs
We find four cases where the colours in our MWA image suggest that H ii regions are blended with SNRs that have not been previously identified. The H ii regions associated with these sources are G333.6 − 0.02, G326.98+0.01, G320.37 − 1.05, and G318.28+0.09. These H ii regions may be projected in front or behind the SNR emission or may be physically related. We find that these blended H ii regions have lower than average spectral indices: 0.75, 0.98, 0.14, 0.48, for G333.6 − 0.02, G326.98+0.01, G320.37 − 1.05, and G318.28+0.09, respectively. This suggests that the integrated flux densities are being contaminated by the synchrotron emission from the SNRs. The SNRs associated with H ii regions G333.6 − 0.02 and G326.98+0.01 are new detections and are presented along with other SNRs detected in these MWA images and associated properties in our partner publication Johnston-Hollitt et al. (in preparation).
5.2. The turnover frequency
We expect to detect H ii regions from the compact to classical stage. Such H ii regions have typical sizes of s ≈ 0.5–10 pc, electron temperatures of T e ≈ 104 K and electron densities of n e ≈ 102–103 cm−3 (Kurtz Reference Kurtz, Cesaroni, Felli, Churchwell and Walmsley2005). The SED of H ii regions with these properties turns over from optically thin to thick above 200 MHz. If the turnover frequency (νt) can be identified, it can be used to probe the physical properties of the H ii region. From Mezger & Henderson (Reference Mezger and Henderson1967), we can write the turnover frequency of an H ii region as
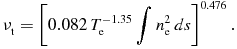 $$\begin{equation}
\nu _{\rm t} = \left[ 0.082\,T_{\rm e}^{-1.35}\int n_{\rm e}^2\,ds \right]^{0.476}.
\end{equation}$$
$$\begin{equation}
\nu _{\rm t} = \left[ 0.082\,T_{\rm e}^{-1.35}\int n_{\rm e}^2\,ds \right]^{0.476}.
\end{equation}$$
Using the turnover frequency and the size of an H ii region and assuming spherical geometry, we can estimate the emission measure (EM: ∫n 2 e ds), and if the distance is known, we may then determine the electron density, and thereby the ionised gas mass and ionising (Lyman continuum) photon count (N ly).
We do not see any convincing evidence of a turnover for H ii regions in our 88 to 216 MHz band. To search for evidence of turnover at higher frequency, we obtain the integrated flux density at 843 and 1420 MHz using the MGPS and SGPS, respectively. The MGPS and SGPS surveys both suffer from significant artefacts and a lack of large scale sensitivity to structures greater ~ 30 arcmin. This leads to lower than expected integrated flux densities, which results in an optically thin spectral index that is steeper than expected and a turnover that will be at a lower frequency. We therefore consider the results of the following analysis to be lower limits. We extract the integrated flux density in the MGPS and SGPS by applying our MWA source finding template. The resultant integrated fluxes can be seen in online version of Table 2. A number of our H ii regions extend beyond the boundaries, or in some cases are outside of the SGPS and MGPS survey regions. We are unable to obtain an accurate estimate of the integrated flux density for these sources and so exclude them from further analysis. We find a total of 234 H ii regions with complete MGPS and SGPS coverage. Where distances are available from the catalogue of H ii regions in Anderson et al. (Reference Anderson, Bania, Balser, Cunningham, Johnstone and Armentrout2014), we are able to use the turnover frequency to extract the physical properties mentioned above. We use the skyellipse cross matching available in stilts to determine the best matches between our MWA H ii regions and those in Anderson et al. (Reference Anderson, Bania, Balser, Cunningham, Johnstone and Armentrout2014) and check the results by eye. We find reliable distances to 61 H ii regions which range from 1.6 to 14.7 kpc. Using these distances, we derive the physical radius of our H ii region sample. We determine the electron temperature by cross matching our H ii regions with those in Caswell & Haynes (Reference Caswell and Haynes1987). If the electron temperature is not available, we assume a representative electron temperature of 104 K (Spitzer & Savedoff Reference Spitzer and Savedoff1950; Caswell & Haynes Reference Caswell and Haynes1987). The physical parameters derived using the turnover frequency are weakly dependant on the electron temperature and this assumption leads to at most a 10% uncertainty in the derived physical properties. Under these limitations, we are able to determine the turnover and physical properties towards 61 H ii regions presented in Table 3. An important caveat is that due to the low resolution of these observations, we will in many cases blend distinct H ii regions into a single source. In the case of H ii regions that are physically associated, we will therefore estimate the average physical properties over the region. Sources that are located along the same line of site but are not physically associated will result in a contaminated estimate of the physical properties.
Physical properties derived from our turnover frequency estimate. We caution that these results are lower limits due to the missing flux in the SGPS and MGPS.

As an example, we derive the turnover frequency for the well-known G305 complex (Hindson et al. Reference Hindson, Thompson, Urquhart, Faimali, Johnston-Hollitt, Clark and Davies2013). We find the total integrated flux density of the G305 complex by adding together the integrated flux density of the component H ii regions. We perform a least-square fit to the SED between 88 and 1420 MHz and find spectral indices of 2.3 ± 0.3 and − 0.5 ± 0.2 for the optically thick and thin regime, respectively (Figure 9). As expected, the optically thin regime is steeper than the expected value of − 0.1 due to the missing flux in the MGPS and SGPS surveys. For G305, we measure a turnover frequency of νt = 390 ± 30 MHz. If we assume G305 has a spectral index of − 0.1 in the optically thin regime, this suggests that the MGPS and SGPS are missing approximately 20 and 60% of the flux, respectively, at scales of ≈ 1.0°. The distance to G305 is 3.8 ± 0.6 kpc (Davies et al. Reference Davies2012) giving a physical radius of 36 ± 6 pc and the average electron temperature is 5400 K. Using the electron temperature and turnover frequency, we derive an emission measure of 1.8 ± 0.3 × 10⁵ pc cm−6. This leads to an electron density of 70.0 ± 0.8 cm−3, ionised gas mass of 3.5 ± 1.7 × 10⁵ M⊙, and Lyman continuum photon rate of 1.0 ± 0.5 × 1050 s−1. This ionising flux is lower than that found in higher frequency observations at 5.5 GHz (2.4 × 1050 s−1; Hindson et al. Reference Hindson, Thompson, Urquhart, Faimali, Johnston-Hollitt, Clark and Davies2013) as is expected given the missing flux in the MGPS and SGPS surveys.
We show the turnover frequency of the HII region G305. The integrated flux density is shown by red symbols. The red line shows the best fit to the data. The vertical blue dashed line shows the turnover frequency of 390 ± 30 MHz.

5.3. WISE comparison
Cross matching this initial catalogue of H ii regions with all previous surveys such as those described in Section 1 is beyond the scope of this paper. We choose to compare our results to one of the most comprehensive catalogues of H ii regions in the Galaxy to date, which has been compiled by Anderson et al. (Reference Anderson, Bania, Balser, Cunningham, Johnstone and Armentrout2014) using WISE. The resolution (6–12 arcsec) and sensitivity (~ 0.2 mJy beam−1) of WISE should in theory be able to detect all H ii regions in the Galactic plane. The authors compiled their catalogue by searching for the characteristic MIR morphology of H ii regions and then searched the literature for additional information to determine distances. The catalogue consists of more than 8 000 sources, which are split into the following categories: known; group; candidate; radio quiet; and sources with no radio data available. The sample includes 1 986 candidate H ii regions where the MIR emission is coincident with radio continuum emission but no RRL or Hα emission. There are also 4124 radio quiet H ii regions that are not associated with any radio continuum emission. Finally, there are 115 regions that lack any high quality radio data. By comparing our catalogue of H ii regions detected with the MWA with the catalogue of Anderson et al. (Reference Anderson, Bania, Balser, Cunningham, Johnstone and Armentrout2014), we are able to check the validity of our H ii region selection approach. We are also able to comment on the completeness of our sample and search for radio emission associated with radio quiet and no radio data H ii regions in the WISE sample.
There are 2 247 H ii regions detected by Anderson et al. (Reference Anderson, Bania, Balser, Cunningham, Johnstone and Armentrout2014) between Galactic longitudes 260 and 340°. These H ii regions consist of 260 known, 166 group, 818 candidate, 933 radio quiet sources which have no detectable radio emission, and 70 sources which have no available data at radio frequencies. We use ellipse cross matching provided by stilts (Taylor Reference Taylor, Gabriel, Arviset, Ponz and Enrique2006) to match H ii regions in our sample and the WISE catalogue. We then verify these matched regions by eye to ensure that we do not falsely match sources such as cases where unresolved WISE sources are embedded within larger H ii regions. We find that all of the H ii regions in our sample are associated with H ii regions reported in the WISE sample. We do not identify any new H ii regions however, which given our sensitivity and resolution is not surprising. The fact that all of our H ii regions are identified in the WISE sample suggests that our three-colour selection method is effective at identifying optically thick H ii regions.
We use the Anderson et al. (Reference Anderson, Bania, Balser, Cunningham, Johnstone and Armentrout2014) catalogue to search for optically thin H ii regions in our images that may be missed due to our selection criteria. Such optically thin H ii regions would have approximately flat (α = −0.1) spectral indices and so appear white in our three-colour image described in Section 3.2. We do not find any convincing examples where an H ii region identified by Anderson et al. (Reference Anderson, Bania, Balser, Cunningham, Johnstone and Armentrout2014) is coincident with a source in our three-colour image that is indicative of an optically thin H ii region. This suggests that the all of H ii regions detected by our MWA observations are optically thick as we expect given the sensitivity, resolution, and frequency range of the MWA, which limits our sample to bright and large compact and classical H ii regions.
We are in a position to search for emission associated with WISE H ii regions that are classified as radio quiet and sources which have previously had no radio data available. For the 933 radio quiet WISE H ii regions, we are only able to detect low-frequency radio emission associated with one H ii region in the WISE sample which is designated G282.842 − 01.252 and G282.84 − 1.25 in the WISE and the MWA catalogue, respectively. We find that only 36 of the sample of radio quiet H ii regions are reported to have sizes equal to or greater than our synthesised beam at 216 MHz. It is therefore unsurprising that we do not detect many radio quiet sources. For the 70 sources with no radio data, we are able to reliably identify radio emission in seven cases.
The major limitation of our study is clearly the low resolution of our observations. Only 503 of the 2 247 H ii regions detected by WISE in our FoV would be at or above the resolution threshold in our 216 MHz image. A significant number of these H ii regions would also be blended in complex regions. If we compare our sample of 306 H ii regions to the resolved WISE sample, we arrive at a lower limit to the completeness of 61%. Clearly, a large number of H ii regions we detect resolved as multiple H ii regions by WISE.
The majority of massive star formation occurs within a small number of massive star-forming complexes. Many of our H ii regions are associated with Group sources from Anderson et al. (Reference Anderson, Bania, Balser, Cunningham, Johnstone and Armentrout2014). A catalogue of 88 massive star-forming complexes using the Wilkinson Microwave Anisotropy Probe (WMAP) has also been compiled by Murray & Rahman (Reference Murray and Rahman2010). They report that over half of the total ionising luminosity of the Galaxy is produced within just 17 massive star-forming complexes. There are 20 such massive star-forming complexes in our survey region. We find H ii regions associated 16 of these regions.
6 SUMMARY AND FUTURE WORK
This paper presents an initial sample of 306 H ii regions detected in the GLEAM survey between 340 < l < 260°. We exploit the wide-area, low frequency sky coverage of the MWA to detect H ii regions without the need for ancillary data, which greatly simplifies source characterisation. The MWA frequency coverage allows us to distinguish morphologically similar but physically distinct objects by probing the significantly different SEDs of sources in the Galactic plane.
The GLEAM survey has observed the Galactic plane from 72 to 231 MHz, covering the Galactic plane from 70 < l < 180° and is currently being processed. The GLEAM pipeline includes peeling of bright sources in the primary beam sidelobes, correction for w-projection and ionospheric offsets and phase-only self-calibration. This will improve the astrometry and image fidelity of GLEAM images but we do not expect many more H ii regions within the area presented here to be detected.
The primary limitation of current MWA observations of Galactic H ii regions is the low angular resolution. Current MWA observations are only able to resolve emission that is larger than approximately 2.5–5.6 arcmin depending on frequency. In the future, both the upgraded MWA and further afield SKA1-LOW will provide an improvement in resolution that will allow us to detect many more H ii regions in the Galactic plane. The expanded MWA will have approximately double the resolution of the current array and will allow us to improve our sensitivity. Such an improvement would allow us to resolve individual H ii regions and identify both fainter and younger H ii regions. The resolution of SKA1-LOW may even be sufficient to start to make such unambiguous detections in other, nearby galaxies. Additionally, the wider frequency coverage of SKA1-LOW (50–350 MHz) will allow the turnover frequency of more H ii regions to be detected.
ACKNOWLEDGEMENTS
LH was partially supported in this work via grant MED E1799 (PI: Johnston-Hollitt) provided by the Ministry of Business, Employment & Innovation, New Zealand. MJ-H acknowledges support from the Marsden Fund. This scientific work makes use of the Murchison Radio-astronomy Observatory, operated by CSIRO. We acknowledge the Wajarri Yamatji people as the traditional owners of the Observatory site. We acknowledge the iVEC Petabyte Data Store, the Initiative in Innovative Computing and the CUDA Center for Excellence sponsored by NVIDIA at Harvard University. The authors thank the referee for their very useful comments that resulted in the improvement of this paper.


 Open access