

1. Introduction
Population aging, coupled with low labor market participation rates among older cohorts, is increasing the burden on unfunded pension liabilities in many developed economies. Exemplifying its growing urgency for policy, the average old-age dependency ratioFootnote 1 among OECD countries is expected to increase from 31.6% in 2022 to 58.6% in 2075. Longer careers are often proposed as a remedy.
The present paper studies whether “age-tagged carrots” in the income tax code can constitute an effective policy measure to encourage workers to postpone retirement. The intuition is straightforward: the retirement decision hinges in part on the trade-off between labor income and pension income. By reducing labor income taxes for older workers, retirement becomes more costly. Consequently, this encourages workers to remain in the workforce for longer. Sweden implemented such a policy in 2007 through the provision of more generous earned income tax credits (EITC) and a reduction in the employer-paid payroll tax for workers aged 65 and above. Similar policies have been proposed by Euwals et al. (Reference Euwals, de Mooij and van Vuuren2009), Laitner and Silverman (Reference Laitner and Silverman2012) and Biggs (Reference Biggs2012). The latter two studies suggest that abolishing the payroll tax for older workers would increase participation in the US.Footnote 2 Nevertheless, as discussed in Alpert and Powell (Reference Alpert and Powell2020), the notion of exploiting the tax code, instead of social security reform, to encourage longer careers has generally been overlooked in the literature.
Several quasi-experimental studies that evaluate the causal effects of tax/benefit reforms on participation and hours worked support such policy proposals.Footnote 3 Among the few previous studies that focus on the participation of older workers, Laun (Reference Laun2017) evaluates the Swedish reforms and finds that the working life increases primarily among low to middle income-earners, with a participation elasticity of 0.22. Alpert and Powell (Reference Alpert and Powell2020) study both the intensive and extensive-margin responses to changes in income taxation among older workers in America and find compensated participation elasticities of 3.9 for women and 0.7 for men. They conclude that eliminating the social security portion of payroll taxes for older workers would increase participation by 16 % among women, and 4% among men.
Without downplaying the policy relevance of these findings, it is important to acknowledge that reduced form evidence alone is generally insufficient for drawing conclusions regarding the life-cycle effects of the tax treatment, along both labor and savings margins. Nor is it sufficient to determine the consequences for the public finances and the macro economy in the long-run. Instead, the present paper takes a structural approach, in line with Laitner and Silverman (Reference Laitner and Silverman2012) and Gustman and Steinmeier (Reference Gustman and Steinmeier2015). In the former study, the authors simulate the retirement response of reducing payroll taxes for older workers in a partial equilibrium life-cycle model with indivisible labor. Their simulations suggest that eliminating the social security portion of the US payroll tax after the age of 54 would lead to a 10.6% increase in after-tax wages, and extend careers by an average of one year.
In line with the critical discussion in Laitner and Silverman (Reference Laitner and Silverman2012), the present paper acknowledges that the assumption of indivisible labor may not be entirely innocuous. Indeed, forward-looking individuals will account for changes in the opportunity cost of leisure over the life cycle when deciding on their intertemporal allocation of hours worked. In a standard life-cycle model, favorable tax treatment of older workers incentivizes individuals to substitute hours from the non-treated age to the treated age. Any observed increase in the participation of older workers can then be at least partially offset by lower participation of younger workers. To give perspective on the potential size of this effect, French (Reference French2005) estimates that an anticipated permanent wage increase of 20% at the age of 60 leads to an increase in life-time labor supply of 1,906 hours, but a 519-hour decrease in overall labor supply before the age of 60. In a life-cycle model, Gustman and Steinmeier (Reference Gustman and Steinmeier2015) also find that the elimination of the payroll tax after full retirement age leads to workers substituting hours from pre-treatment to post-treatment ages. These results suggest that the results obtained in Laitner and Silverman (Reference Laitner and Silverman2012) may overestimate the effect of the policy.
Furthermore, previous studies have, to the best of my knowledge, not accounted for general equilibrium effects. On the one hand, policies that promote fewer years in retirement are likely to reduce savings in the economy. On the other hand, a payroll tax cut implies an increase in the lifetime budget constraint, which could lead to increased savings. Ultimately, the net effect on the aggregate capital stock becomes a quantitative question. In addition to its direct effect on output, any change to the capital–labor ratio implies changes to factor pricing. For example, in the event that workers delay retirement and save less, equilibrium wages will fall and capital returns will increase. A higher interest rate should encourage individuals to work more while young and less while old. As a consequence, the final earnings payment should fall—making retirement less expensive and the policy less effective.
Taking the findings of French (Reference French2005) regarding the intertemporal substitution of labor supply over the life-cycle seriously, I account for this, and potential factor pricing effects, within a general equilibrium OLG model with endogenous intensive and extensive margins of labor supply. Favorable tax treatment of older workers is implemented by eliminating the non-social security (NSS) portion of the labor income tax above a certain age. The model is calibrated to match an array of macro and public finance regularities of an average OECD economy. I then carry out a number of numerical experiments to study the life-cycle effects on consumption, hours worked, and retirement, as well as economy-wide effects on output and tax revenue. An important question for the public finances is whether labor income tax cuts for older workers can be self-financed.Footnote 4 If not, can the government modify other taxes so that revenue-neutrality is maintained? What are the welfare implications?
From these analyses, I highlight six main results. (i) Favorable tax treatment of older workers can prolong the average career and increase aggregate efficient labor supply. In the preferred calibration, eliminating the NSS labor income tax at the age of 60 delays retirement by approximately 1.93 years. Meanwhile, 22 % of the increase in hours worked after treatment can be explained by a substitution of hours from the pre-treatment career to the post-treatment career. (ii) Lowering the treatment age has only little to moderate effect on aggregate efficient labor supply. I find that the greatest increase in the aggregate efficient labor supply is achieved if treatment is given at the age of 40 (by about 3.25 %), compared to 3.06 % if treatment occurs at the age of 60. (iii) The age of tax treatment that delays retirement the most is not the same as the age that achieves the largest increase in aggregate efficient labor supply. While retirement increases the most if treatment is given close to retirement, efficient labor supply increases the most if treatment is instead given in the middle of the career. This further highlights the role of the intertemporal substitution of hours worked. (iv) The treatment age does matter for the size of the capital stock. If treatment occurs late in the career, savings are reduced following less time spent in retirement. If treatment occurs earlier in the career, the tax cut implies an increase in the lifetime budget constraint large enough for savings to increase. (v) The labor income tax is too distortive in its age-homogeneous form. Eliminating the NSS labor income tax for workers over the age of 62 is found to be entirely self-financed, and it increases total revenue if treatment takes place closer to the calibrated retirement age. (vi) If the treatment takes place at an age younger than 62, the government needs to increase other taxes for the policy to remain revenue neutral. In this instance, tax shifting toward capital taxes or labor income taxes paid by younger workers only increase welfare if treatment occurs close to retirement. Tax shifting toward consumption taxes always increases welfare relative to the baseline scenario in which there is no treatment.
The findings of this paper contribute to several strands of the literature. First, they complement evidence from the quasi-experimental and structural partial equilibrium models on the effects of age-targeted income taxation on labor supply. Second, the analysis contributes to the extensive literature on how policymakers can increase incentives for postponing retirement through social security reform. Wallenius (Reference Wallenius2013), Alonso-Ortiz (Reference Alonso-Ortiz2014), and Laun and Wallenius (Reference Laun and Wallenius2016) find that differences in social security design can account for a substantial share of cross-country differences in old-age participation rates.Footnote 5 These findings support the idea of removing inherent financial incentives for early retirement. Kitao (Reference Kitao2014) study how fiscal sustainability of social security can be achieved by either increasing the social security portion of payroll taxes, reducing benefits across the board, raising the normal retirement age, or reducing benefits as incomes rise. However, any “stick” policy that penalizes early retirement may impose substantial welfare costs on those incapable of working longer, which many find unjust. This is likely to make such proposals difficult to sell to a broad voter base and to sustain if implemented.Footnote 6
Third, since the policy includes an age-targeted tax treatment, this paper also relates to a strand of the tax literature concerning the use of tagging. Following the seminal paper of Akerlof (Reference Akerlof1978), the consensus is that the efficiency costs of redistribution can be reduced by applying different tax schemes to different sub-populations. The present study is perhaps most closely related to Bastani et al. (Reference Bastani, Blomquist and Micheletto2013), Karabarbounis (Reference Karabarbounis2016), and Heathcote et al. (Reference Heathcote, Storesletten and Violante2020), who study optimal age-tagging in multi-period OLG models. However, none of these papers study how the tax code can be exploited to encourage longer careers, and they also abstract from modeling endogenous retirement.
The remainder of the paper is organized as follows. In section 2, the model is introduced and solved analytically. Section 3 describes the calibration of the model and documents the model fit. The main numerical analysis is presented in Section 4. Section 5 concludes the paper.
2. The model
Time is continuous and denoted $t$
. Consider an overlapping generations model with a constant population size of unit mass, where each generation replicates themselves identically. Under these assumptions, the life-cycle behavior of one generation is then representative of both intra- and intergenerational economic activity at any point in time. As such, from hereon, calendar time and age will be used interchangeably.
$t$
. Consider an overlapping generations model with a constant population size of unit mass, where each generation replicates themselves identically. Under these assumptions, the life-cycle behavior of one generation is then representative of both intra- and intergenerational economic activity at any point in time. As such, from hereon, calendar time and age will be used interchangeably.
Aggregate output consists of one final good that is produced by a representative firm. This good may be either consumed or saved, whereby any savings are realized one-to-one as physical capital. All markets are competitive and they clear at every instant.
Individuals face an uncertain life-time, and the probability of surviving to age $t$
is governed by the distribution
$t$
is governed by the distribution $Q(t)$
, with a maximum lifespan of
$Q(t)$
, with a maximum lifespan of $T$
periods. Individuals chose their consumption, savings, hours worked, and when to retire.
$T$
periods. Individuals chose their consumption, savings, hours worked, and when to retire.
The government taxes consumption at rate $\tau ^c$
, as well as personal income through labor income taxes
$\tau ^c$
, as well as personal income through labor income taxes $\tau ^h$
, pension income taxes
$\tau ^h$
, pension income taxes $\tau ^b$
, and capital income taxes
$\tau ^b$
, and capital income taxes $\tau ^k$
, to finance public expenditures. It also finances a self-sustained pay-as-you-go public pension system through a separate contribution rate
$\tau ^k$
, to finance public expenditures. It also finances a self-sustained pay-as-you-go public pension system through a separate contribution rate $\tau ^s$
.
$\tau ^s$
.
Moreover, the labor income tax can be age-dependent and take two different values over the life cycle. Let the timing of the tax treatment be denoted $\bar {t}\in (0,R)$
, and let
$\bar {t}\in (0,R)$
, and let $j=1,2$
denote pre- and post-treatment careers. Henceforth, I refer to
$j=1,2$
denote pre- and post-treatment careers. Henceforth, I refer to $\tau _1^h$
as the labor income tax rate on younger workers, and
$\tau _1^h$
as the labor income tax rate on younger workers, and $\tau _2^h$
as the labor income tax rate on older workers.
$\tau _2^h$
as the labor income tax rate on older workers.
Ultimately, the model framework shares many characteristics with the continuous time life-cycle and OLG models in Gahramanov and Tang (Reference Gahramanov and Tang2013), Feigenbaum et al. (Reference Feigenbaum, Gahramanov and Tang2013), Gahramanov (Reference Gahramanov2016), Caliendo and Findley (Reference Caliendo and Findley2020) and Cottle Hunt and Caliendo (Reference Cottle Hunt and Caliendo2020). In relation to these, the model considers both intensive margin and extensive margin labor supply decisions. While Gahramanov and Tang (Reference Gahramanov and Tang2013) include both margins, they do not allow for hours worked to vary over the life-cycle, which is key to the analysis in this paper. Following Laitner and Silverman (Reference Laitner and Silverman2012), I keep the model free from uninsured income risk for analytical tractability. As in Bastani et al. (Reference Bastani, Blomquist and Micheletto2013), I abstract from modeling transitional paths and instead make comparisons between different zero-growth steady states of the economy for computational reasons. I follow, e.g., Conesa and Garriga (Reference Conesa and Garriga2008), Wallenius (Reference Wallenius2013), Alonso-Ortiz (Reference Alonso-Ortiz2014), Bagchi (Reference Bagchi2017), Bagchi and Jung (Reference Bagchi and Jung2023), in the context of retirement policy and model the economic behavior of representative agents.
2.1 Individuals
A representative individual discounts the future exponentially at the time-invariant rate $\theta$
, and derives utility from consumption
$\theta$
, and derives utility from consumption $c(t)$
, intensive-margin leisure
$c(t)$
, intensive-margin leisure $(1-h(t))$
, where
$(1-h(t))$
, where $h(t)$
is the labor supply, and retirement leisure
$h(t)$
is the labor supply, and retirement leisure $T-R$
, where
$T-R$
, where $R\in (0,T)$
is the retirement age. Retirement is assumed to be an absorbing state. The individual is endowed with a stream of labor productivity units
$R\in (0,T)$
is the retirement age. Retirement is assumed to be an absorbing state. The individual is endowed with a stream of labor productivity units $\epsilon (t)$
.
$\epsilon (t)$
.
Let $w$
denote the wage rate per unit of effective labor when working, and
$w$
denote the wage rate per unit of effective labor when working, and $b$
the annual pension benefits received when retired. Any income not instantaneously used for consumption flows into a savings account
$b$
the annual pension benefits received when retired. Any income not instantaneously used for consumption flows into a savings account $k(t)$
and appreciates by the risk-free real interest rate
$k(t)$
and appreciates by the risk-free real interest rate $r$
. There are no bequest motives, but because lifetimes are uncertain, individuals may die with assets at hand. At any time, a living individual can therefore receive an accidental bequest
$r$
. There are no bequest motives, but because lifetimes are uncertain, individuals may die with assets at hand. At any time, a living individual can therefore receive an accidental bequest $\psi$
.
$\psi$
.
Assuming additive separable CRRA preferences, which is a standard assumption in the literature, the optimization problem is:
 \begin{equation} \underset {\{c(t),h(t),R\}}{\text{max }} \int _0^T \frac {c(t)^{1-\sigma }}{1-\sigma }Q(t)e^{-\theta t}dt-\chi \int _0^{R} \frac {h(t)^{1+\nu }}{1+\nu }Q(t)e^{-\theta t}dt+\eta \frac {(T-R)^{1-\phi }}{1-\phi }, \end{equation}
subject to:
 \begin{equation} \dot {k}=\begin{cases} r(1-\tau ^k)k(t)+h_1(t)w\epsilon (t)(1-\tau ^h_1-\tau ^s)-c(t)(1+\tau ^c)+\psi &\text{for } t\in [0,\bar {t});\\ r(1-\tau ^k)k(t)+h_2(t)w\epsilon (t)(1-\tau ^h_2-\tau ^s)-c(t)(1+\tau ^c)+\psi &\text{for } t\in [\bar {t},R); \\ r(1-\tau ^k)k(t)+b(1-\tau ^b)-c(t)(1+\tau ^c)+ \psi &\text{for } t\in [R,T]; \end{cases} \end{equation}
and
 \begin{equation} k(0)=k(T)=0, \end{equation}
where $\sigma$
is the inverse elasticity of intertemporal substitution of consumption, and
$\sigma$
is the inverse elasticity of intertemporal substitution of consumption, and $\nu$
the inverse Frisch elasticity of labor supply. It can be interpreted as the aversion to changes in working hours over the life-cycle.
$\nu$
the inverse Frisch elasticity of labor supply. It can be interpreted as the aversion to changes in working hours over the life-cycle. $\phi$
is the inverse retirement elasticity, which governs the sensitivity of the preferred retirement age to changes in the net replacement rate.
$\phi$
is the inverse retirement elasticity, which governs the sensitivity of the preferred retirement age to changes in the net replacement rate. $\chi$
and
$\chi$
and $\eta$
are weights attached to the disutility of labor supply and the utility of retirement leisure respectively.
$\eta$
are weights attached to the disutility of labor supply and the utility of retirement leisure respectively.
Following the steps outlined in Appendix A, we obtain the following closed-form solutions for consumption and intensive-margin labor supply:
 \begin{equation} c^*(t)|_{\{\mu _0,R\}}=\Bigg [\frac {Q(t)e^{(\hat {r}-\theta )t}}{\mu _0(1+\tau ^c)}\Bigg ]^{\frac {1}{\sigma }}, \end{equation}
which follows from the Euler equation for optimal consumption, and
 \begin{equation} h_j^*(t)|_{\{\mu _0,R\}}=\Bigg [\bigg (\frac {\mu _0}{\chi Q(t)}\bigg )w\epsilon (t)(1-\tau ^h_j-\tau ^s) e^{(\theta -\hat {r})t} \Bigg ]^{\frac {1}{\nu }}, \end{equation}
which characterizes the optimal intensive-margin labor supply.
Optimal retirement is in turn determined by the following condition:
 \begin{equation} -\chi \frac {h(R^*)^{1+\nu }}{1+\nu }Q(R^*)e^{-\theta R^*}\!-\eta (T-R^*)^{-\phi }\!+\mu _0e^{-\hat {r}R^*}[w\epsilon (R^*)(1-\tau ^h_2-\tau ^s)h_2(R^*)-b(1-\tau ^b)]=0, \end{equation}
where $\hat {r}=r(1-\tau ^k)$
.
$\hat {r}=r(1-\tau ^k)$
. $\mu _0$
is the marginal utility of wealth in period
$\mu _0$
is the marginal utility of wealth in period $t=0$
and satisfies the life-cycle budget constraint:Footnote
7
$t=0$
and satisfies the life-cycle budget constraint:Footnote
7
 \begin{equation} \begin{split} &w\,\Bigg ((1-\tau ^h_1-\tau ^s)\int _0^{\bar {t}}h_1(t)\epsilon (t)e^{-\hat {r}t}dt+(1-\tau ^h_2-\tau ^s)\int _{\bar {t}}^R h_2(t)\epsilon (t)e^{-\hat {r}t}dt\Bigg ) \\&\quad +(1-\tau ^b) \int _R^T b e^{-\hat {r}t}dt - (1+\tau ^c)\int _0^T c(t)e^{-\hat {r}t}dt+ \psi \int _0^T e^{-\hat {r}t}=0. \end{split} \end{equation}
From the cases in equation (2), assets held at age $t$
are in turn given by:
$t$
are in turn given by:
 \begin{equation} k(t)=\begin{cases} e^{\hat {r} t}\bigg \{w(1-\tau ^h_1-\tau ^s)\int _0^t h_1(s)\epsilon (s)e^{-\hat {r}s}ds-\\ (1+\tau ^c)\int _0^t c(s)e^{-\hat {r}s} ds+\psi \int _0^t e^{-\hat {r}s}ds\bigg \} &\text{for } t\in [0,\bar {t})\\ e^{\hat {r} t}\bigg \{ k(\bar {t})e^{-\hat {r}\bar {t}}+w(1-\tau ^h_2-\tau ^s)\int _{\bar {t}}^t h_2(s)\epsilon (s)e^{-\hat {r}s}ds-\\ (1+\tau ^c)\int _{\bar {t}}^t c(s)e^{-\hat {r}s} ds+\psi \int _{\bar {t}}^t e^{-\hat {r}s}ds \bigg \} &\text{for } t\in [\bar {t},R)\\ e^{\hat {r} t}\bigg \{k(R)e^{-\hat {r}R} + b(1-\tau ^b)\int _R^t e^{-\hat {r}s}ds-\\ (1+\tau ^c)\int _{R}^t c(s)e^{-\hat {r}s} ds+ \psi \int _{T}^t e^{-\hat {r}s}ds \bigg \} &\text{for } t\in [R,T]\\ \end{cases} \end{equation}
As discussed in Jacobs (Reference Jacobs2009), the chosen approach to modeling retirement offers important flexibility for the researcher to calibrate the model to realistic values for both intensive- and extensive margin labor supply elasticities. This flexibility would not be available if the retirement decision was solely determined by a reduction in marginal productivity. For example, in Gahramanov and Tang (Reference Gahramanov and Tang2013), where the separate retirement utility term is not present, the retirement decision is largely determined by the relative weight attached to intensive-margin leisure preferences. In this specification, the timing of retirement is instead tightly linked to a separate weight of retirement leisure preferences $\eta$
. The responsiveness of retirement timing to a change in the implicit cost of retirement (the inverse of the net replacement rate) is, in turn, governed by the inverse elasticity parameter
$\eta$
. The responsiveness of retirement timing to a change in the implicit cost of retirement (the inverse of the net replacement rate) is, in turn, governed by the inverse elasticity parameter $\phi$
. For example, the Frisch elasticity of retirement with respect to a change in this implicit tax is given by
$\phi$
. For example, the Frisch elasticity of retirement with respect to a change in this implicit tax is given by $-(T-R)/(\phi R)$
. This allows me to calibrate the retirement age without modifying the Frisch elasticity of retirement or changing any of the parameters that govern the intensive-margin labor–leisure trade-off. Ultimately, if the retirement utility term is removed from the analysis, it would not be possible to produce sensitivity analyses of the results with respect to other values for the labor supply elasticities without abandoning the calibration target for the average retirement age. In absence of the retirement utility term, ceteris paribus, the individual would retire at an older age. This follows from Equation (6) as the second term, which constitutes a utility cost of delaying retirement, disappears. Then it would not be possible to maintain the same retirement age as before without modifying the intensive margin Frisch elasticity.
$-(T-R)/(\phi R)$
. This allows me to calibrate the retirement age without modifying the Frisch elasticity of retirement or changing any of the parameters that govern the intensive-margin labor–leisure trade-off. Ultimately, if the retirement utility term is removed from the analysis, it would not be possible to produce sensitivity analyses of the results with respect to other values for the labor supply elasticities without abandoning the calibration target for the average retirement age. In absence of the retirement utility term, ceteris paribus, the individual would retire at an older age. This follows from Equation (6) as the second term, which constitutes a utility cost of delaying retirement, disappears. Then it would not be possible to maintain the same retirement age as before without modifying the intensive margin Frisch elasticity.
From equations (4)–(6), we can draw some analytical conclusions regarding the effects of eliminating the labor income tax at age $\bar {t}$
. First, since preferences are additive separable in consumption and labor supply, the labor income tax code does not directly influence the optimal consumption profile.
$\bar {t}$
. First, since preferences are additive separable in consumption and labor supply, the labor income tax code does not directly influence the optimal consumption profile.
If the labor income tax is age-differentiated, the optimal labor supply profile in equation (5) will be subject to a discrete change at the time of treatment. Taking the ratio of hours worked between pre- and post-treatment careers, at the time of treatment, gives:
 \begin{equation} \frac {h^*_1(\bar {t})}{h^*_2(\bar {t})}=\bigg [\frac {(1-\tau ^h_1-\tau ^s)}{(1-\tau ^h_2-\tau ^s)}\bigg ]^{\frac {1}{\nu }}. \end{equation}
This implies that any difference in the marginal tax rates will cause a discrete change in hours worked at the time of treatment. This ratio is increasing with the size of the treatment, and decreasing in the inverse of the Frisch elasticity of hours worked $\nu$
.
$\nu$
.
Regarding the retirement response, the first two terms in equation (6) capture the utility cost of continued work in the form of disutility of hours worked and forgone retirement leisure. The terms inside the square brackets constitute the monetary trade-off between net-of-tax labor and retirement income. These income effects are converted to present-value utils through the multiplication of the discounted shadow price term. From this equation, it is clear that reducing the labor income tax rate encourages individuals to delay retirement by increasing their final net earnings.
Ultimately, the first order conditions in equations (4)–(6) and the life-cycle budget constraint in equation (7) jointly determine the solutions to the individual’s problem. In turn, aggregate capital and labor supply are given by:
 \begin{align}&\qquad\qquad\qquad K^S=\int _0^T Q(t)k(t)dt, \end{align}
 \begin{align}& H^S=\int _0^{\bar {t}} Q(t)h_1(t)\epsilon (t)dt + \int _{\bar {t}}^R Q(t)h_2(t)\epsilon (t)dt. \end{align}
And aggregate private consumption of the final good is:
 \begin{equation} C=\int _0^T Q(t)c(t)dt. \end{equation}
2.2 Production
Following a convention in the literature, the representative firm uses a Cobb-Douglas production function with inputs of capital and labor to produce output:
 \begin{equation} Y=K^\alpha H^{1-\alpha }, \end{equation}
where $\alpha$
is the share of capital used in the production process. Operating in perfectly competitive factor markets, the firm hires labor and rents capital so that the values of their marginal products equal the factor prices, implicitly defining the labor and capital demand functions
$\alpha$
is the share of capital used in the production process. Operating in perfectly competitive factor markets, the firm hires labor and rents capital so that the values of their marginal products equal the factor prices, implicitly defining the labor and capital demand functions $\{H^D,K^D\}$
:
$\{H^D,K^D\}$
:
 \begin{align}& w=(1-\alpha )\frac {Y}{H^D}, \end{align}
 \begin{align}&\,\,\, r=\alpha \frac {Y}{K^D}-\delta , \end{align}
where $\delta$
is a constant capital depreciation rate.
$\delta$
is a constant capital depreciation rate.
2.3 Government
The government administrates the public pension system, finance miscellaneous public expenditures, and redistributes accidental bequests.
2.3.1 Pension system
In the self-contained pension system, total pension expenditures $B$
equal total contributions:
$B$
equal total contributions:
 \begin{equation} B=w\tau ^s H. \end{equation}
As in most pension systems, pension benefits are realized as annuities:
 \begin{equation} b=\frac {w\tau ^s H}{\int _R^T Q(t)dt}. \end{equation}
This is obviously a stylized representation of a typical public pension system. If I had studied the effects of changing the social security portion of payroll taxes, in this case $\tau ^s$
, it would probably have been a problematic over-simplification since pensions are often, at least partially, earnings-based. This means that the effective tax rate is reduced by the share of contributions that goes toward the earnings-based pillar. Since I model the non-social security portion of labor income taxes, which goes toward general public expenditures, I consider this simple, stylized representation of the pension system to be sufficient.Footnote
8
$\tau ^s$
, it would probably have been a problematic over-simplification since pensions are often, at least partially, earnings-based. This means that the effective tax rate is reduced by the share of contributions that goes toward the earnings-based pillar. Since I model the non-social security portion of labor income taxes, which goes toward general public expenditures, I consider this simple, stylized representation of the pension system to be sufficient.Footnote
8
2.3.2 Public expenditure
Any revenues from labor income, capital, and consumption taxes are used to finance public expenditures $G$
:
$G$
:
 \begin{equation} G=\tau ^c C+ \tau ^k r K + \tau ^b B+w\Bigg (\tau ^h_1 \int _0^{\bar {t}} Q(t)h_1(t)\epsilon (t)dt + \tau ^h_2 \int _{\bar {t}}^R Q(t)h_2(t)\epsilon (t)dt \Bigg ). \end{equation}
That is, I assume that the government cannot use debt financing or lump-sum taxation. Government purchases are, in turn, thrown into the sea. This is analogous to assuming that government consumption enters the utility function as an additive separable argument.
2.3.3 Accidental bequests
The government confiscates any assets held by deceased individuals and redistributes these equally among their surviving brethren.
 \begin{equation} \psi = \frac {\int _0^T Q(t)k(t)d(t)dt}{\int _0^T Q(t)dt}, \end{equation}
where $d(t)=-\frac {d \ln Q(t)}{dt}$
is the hazard rate of dying.
$d(t)=-\frac {d \ln Q(t)}{dt}$
is the hazard rate of dying.
2.4 Steady state
A competitive equilibrium steady state requires that the following conditions are simultaneously met:
-
• Households consume according to equation (4), and supply labor according to equations (5) and (6), conditional on the life-cycle budget constraint in equation (7) being satisfied.
-
• Factor supplies $\{H^S, K^S\}$
are given by equations (10) and (11).
$\{H^S, K^S\}$
are given by equations (10) and (11). -
• Factor demands
$\{H^D, K^D\}$
are given by equations (14) and (15). -
• Factor prices
$\{w,r\}$
satisfy the factor market clearing conditions
$H^S=H^D$
and
$K^S=K^D$
. -
• Accidental bequests
$\psi$
are given by equation (19) -
• Government budget constraints in equations (16) and (18) balance.
-
• Invested capital equals depreciated capital, so that the aggregate resource constraint is:
\begin{equation*} Y \equiv C+G+\delta K. \end{equation*}


See Appendix D for a detailed description of the computational algorithm.
3. Calibration
The calibration strategy is standard. Some parameters, such as tax and public pension contribution rates, are observable and directly lifted from data and documentation collected from https://www.oecd.org and https://databank.worldbank.org. Unless explicitly stated, these values correspond to average OECD statistics for the year 2020. Others, such as elasticities, are chosen based on estimates from the empirical literature. Any remaining parameters are disciplined so that the model output matches the following set of observable moment targets in the data:
(1) A capital–output ratio close to 3 (e.g., Song et al. Reference Song, Storesletten and Zilibotti2012; Caliendo and Findley, Reference Caliendo and Findley2020). (2) The target interval for the real interest rate is wider. Based on US data, Wallenius (Reference Wallenius2013) target 4%. Gahramanov and Tang (Reference Gahramanov and Tang2013) consider 3.5% to be a preferable target. Laun and Wallenius (Reference Laun and Wallenius2016) use 3%. In keeping with average OECD statistics, Caliendo and Findley (Reference Caliendo and Findley2020) settle for an equilibrium interest rate close to 2%, while Song et al. (Reference Song, Storesletten and Zilibotti2012) targets 4% (referencing the target value for the US and EU-14 countries in Trabandt and Uhlig (Reference Trabandt and Uhlig2011)). I settle for the intermediate value of 3.5%, but tolerate values within the interval of 2–4%. (3) For the target year, the average retirement age in the OECD was 63.4 for women, and 64.2 for men (OECD, 2021). I target the mean of 63.8, which corresponds to model age 38.8. (4) The average number of hours worked per year was 1752. After accounting for sleep, commuting time, work week standards, and minimum paid vacation weeks, I calculate that the yearly time-endowment available for labor–leisure decisions is 3977 hours.Footnote
9
Thus, the average intensive-margin labor supply intensity is 1752/3977 = 0.44. When accounting for the time spent in retirement, this would imply that the calibrated individual spends roughly 1/3 of their lifetime working. This is a standard value in the business cycle literature with dynastic individuals. (5) The average value for government expenditure on final consumption, as a share of GDP, ( $G/Y$
), was 18.6%. (6) The corresponding value for the share of private expenditures, (
$G/Y$
), was 18.6%. (6) The corresponding value for the share of private expenditures, ( $C/Y$
), was 59%. (7) The consumption tax revenue share of GDP was 10.6%. (8) The personal tax revenue share of GDP was 8.33%. (9) Public expenditure on pensions, as a share of GDP, was 7.7% in 2019, or 8.2% when including non-cash benefits such as housing benefits. While the social security contribution share of GDP was 9.2%, this indicator also includes contributions that go toward unemployment insurance, which I do not model here.
$C/Y$
), was 59%. (7) The consumption tax revenue share of GDP was 10.6%. (8) The personal tax revenue share of GDP was 8.33%. (9) Public expenditure on pensions, as a share of GDP, was 7.7% in 2019, or 8.2% when including non-cash benefits such as housing benefits. While the social security contribution share of GDP was 9.2%, this indicator also includes contributions that go toward unemployment insurance, which I do not model here.
Since the model is in general equilibrium, it is not always possible to discipline a specific parameter based on one particular target. In the discussion that follows, I associate a parameter with the target it has the greatest quantitative effect upon.
3.1 Technology
For technology parameters, a capital share of production equal to 35% is standard, so I set $\alpha =0.35$
. Equally standard is a depreciation rate of 8% (
$\alpha =0.35$
. Equally standard is a depreciation rate of 8% ( $\delta =0.08$
).
$\delta =0.08$
).
3.2 Demographics and preferences
As concluded in a review by Thimme (Reference Thimme2017), there is little academic consensus on the value of the elasticity of intertemporal substitution (EIS). A value of 1 is commonly used in the business cycle literature and consistent with balanced growth (Lucas, Reference Lucas1990). Given the preference specification used in this paper, values below 1 result in a dominating income effect. I rule out this possibility for an individual of average income. Consequently, I restrict this interval to 1–2, whereby the upper limit is consistent with the findings of Gruber (Reference Gruber2013). As such, $\sigma \in [0.5,1]$
. In the baseline calibration, I set it equal to 1.
$\sigma \in [0.5,1]$
. In the baseline calibration, I set it equal to 1.
The Frisch elasticity of intensive-margin labor supply concerns the willingness of individuals to substitute hours worked over the life cycle. Whalen and Reichling (Reference Whalen and Reichling2017) concludes that the relevant interval for fiscal analysis ranges from 0.27 to 0.53. This corresponds to an interval of $\nu \in [1.88,3.7]$
. Conditional on
$\nu \in [1.88,3.7]$
. Conditional on $\sigma =1$
, I set
$\sigma =1$
, I set $\nu =2$
. This results in a compensated wage elasticity equal to 1/3, which is consistent with the point estimate obtained from meta analyses of both micro and macro studies in Chetty et al. (Reference Chetty, Guren, Manoli and Weber2011).
$\nu =2$
. This results in a compensated wage elasticity equal to 1/3, which is consistent with the point estimate obtained from meta analyses of both micro and macro studies in Chetty et al. (Reference Chetty, Guren, Manoli and Weber2011).
There is scant empirical evidence regarding the retirement elasticity parameter. Studies on how retirement timing is affected by a change in the implicit retirement tax (the inverse of the net-of-tax replacement rate) suggest that the uncompensated elasticity is around −1/3 (Duval, Reference Duval2004). In the baseline calibration, I set $\phi =1.65$
, which results in a compensated elasticity equal to −0.33.
$\phi =1.65$
, which results in a compensated elasticity equal to −0.33.
Last, I set the discount rate to 1% ( $\theta =0.01$
) to match the target value for the capital-output ratio. Then, by setting the utility weights
$\theta =0.01$
) to match the target value for the capital-output ratio. Then, by setting the utility weights $\eta =0.5$
and
$\eta =0.5$
and $\chi =12$
, the model matches targets 3 and 4 well.
$\chi =12$
, the model matches targets 3 and 4 well.
3.3 Taxes
Values for the tax rates are directly lifted from the relevant documentation. For the target year, the VAT rate was 19.2%, the average overall implicit tax rate on capital income was 16.8% (European Commission and Directorate-General for Taxation and Customs Union, 2022), and the labor income tax wedge, excluding social security contributions, was 13.1%.Footnote 10
A pensioner whose gross replacement rate corresponded to that of a full-career average earner paid 10% in taxes and contributions on average in the target year (OECD, 2021). Regarding the contribution rate to the public pension system, I exclude mandatory contributions to private pension systems and use the average mandatory contribution rate only to public pensions, which was 15.4% (OECD, 2021) in the target year.
3.4 Endowments
Individuals are subject to two endowments: marginal productivity of labor and survival probability.
Since the model allows the individual to flexibly vary the hours worked over their entire career, it is important that the model is fitted with a realistic life-cycle profile of labor productivity. To the best of my knowledge, no study has estimated an average life-cycle productivity profile among OECD economies. I therefore settle for the polynomial specification obtained in Feigenbaum (Reference Feigenbaum2008) for a representative US worker. As illustrated in Figure 1, this profile is hump-shaped, whereby productivity initially increases with age, peaks when the worker is middle-aged, and then decreases, capturing how skill-depreciation eventually dominates skill-accumulation.
Life-cycle endowment of marginal productivity units.

It should be noted that the reduction in productivity lowers the cost of retirement in terms of forgone earnings. However, as explained by equation (6), this feature contributes to, but does not solely determine, the timing of retirement.
I also consult Feigenbaum (Reference Feigenbaum2008) for the specification of the survival density function $Q(t)$
.
$Q(t)$
.
3.5 Summary of parameters and equilibrium objects
A summary of the parameter values is presented in Table 1, while Table 2 contains the calibrated steady-state values. Evidently, the model does a very good job in matching moments 1, 2, 3, 4, and 7, while being less precise, but not unreasonably so, with regards to moments 5, 6, 8, and 9. To exemplify, The deviations for these targets are of comparable magnitudes to those in Bucciol et al. (Reference Bucciol, Cavalli, Fedotenkov, Pertile, Polin, Sartor and Sommacal2017). An alternative strategy, employed by Gahramanov and Tang (Reference Gahramanov and Tang2013), would be to treat the labor income tax as a free parameter to target the observed value for $G/Y$
. This would obviously improve the matching to both targets 5 and 8, but at the cost of a more ad hoc calibration exercise.
$G/Y$
. This would obviously improve the matching to both targets 5 and 8, but at the cost of a more ad hoc calibration exercise.
Parametrization for calibration

Equilibrium objects for calibration

4. Numerical analysis
With the baseline calibration as the point of reference, I proceed to study the effects of the tax treatment through a series of numerical experiments. First, I illustrate how the treatment affects the life-cycle profiles of labor and capital supply respectively. Then, I study its implications for the aggregate economy. Last, I explore the aggregate effects and welfare consequences when the government commits to a fixed expenditure target and leverages tax shifting toward consumption taxation, capital income taxation, or labor income taxes paid by younger workers, to compensate for any forgone revenue from the labor income tax.
4.1 Life cycle effects
As previously discussed, two of the main concerns of this paper relate to the intertemporal substitution of hours worked over the life cycle, and general equilibrium effects, following treatment. Therefore, it is useful to illustrate how these mechanisms affect the optimal allocation of savings and labor over the life cycle of the individual.
For the sake of argument, consider that the NSS labor income tax is abolished for all workers aged 45 and above ( $\bar {t}=20$
). The partial and general equilibrium effects of this treatment are presented in Table 3 and Figure 2.
$\bar {t}=20$
). The partial and general equilibrium effects of this treatment are presented in Table 3 and Figure 2.
Partial and general equilibrium effects

As predicted by equation (6), the treatment makes retirement more costly for the individual as final net-earnings increase. As a result, the retirement age increases. On the intensive margin, work becomes more attractive post-treatment following a discrete increase in the net wage. Forward-looking individuals recognize this when planning their life-cycle labor supply and subsequently shift hours from their pre-treatment careers to their post-treatment careers. Ultimately, the increase in the labor supply post-treatment can partially be explained by a substitution of hours worked over the life cycle. This result is consistent with equation (9), and corresponds to the discrete increase in labor supply at the age of treatment shown in Figure 2.
Since the individual anticipates future increase in the net wage, they work fewer hours before treatment and save less. The incentive to save for retirement is reduced as the individual spends fewer years in retirement. This leads to lower private savings, and, as a result, the available capital stock is reduced. However, the tax treatment also implies a reduction in the individual’s lifetime tax burden. This corresponds to an increased lifetime budget constraint, allowing the individual to increase both consumption and savings. While these simulations suggest that this effect is dominated, it nevertheless dampens the negative effect of the tax treatment on capital availability.
In the general equilibrium simulation, treatment also generates feedback effects through changes in factor prices that have a neutralizing effect on changes in labor supply and savings. As capital is crowded out, the interest rate increases, while the wage level is reduced following an increase in the total labor supply. Once the factor price effects are accounted for, the capital stock is reduced by about 1.3 %, and total hours increase by 4 %. In the partial equilibrium experiment, the capital stock is reduced by 8.2 % and hours increase by 4.6 %, suggesting that the factor price effects are not trivial.
Life-cycle profile comparisons. Treatment occurs at model age 20. Black lines illustrate baseline profiles, blue lines the treated profile in partial equilibrium, and red lines the treated profile in general equilibrium.

Overall, the results suggest that total labor supply increases, while a non-trivial share of the observed increase in the labor supply among older workers is offset by a reduction in the labor supply by younger workers. In partial equilibrium, 30.3 % of the increase in labor after treatment is attributable to a shift of hours from the pre-treatment years. In general equilibrium, the corresponding number is 23 %.
4.2 The timing of treatment and aggregate effects
This section compares the long-run aggregate effects of the tax treatment to the baseline scenario when varying the timing of treatment. The results of this experiment are contained in Table 4 and Figure 3.
Quantitative results

Note: Full tax treatment. All values are expressed in relation to the baseline calibration.
First, as shown in panel 1 of Figure 3, for any treatment age, the aggregate efficient labor supply increases relative to the baseline scenario. Lowering the treatment age initially bolsters this increase, and the largest aggregate efficient labor supply is achieved if treatment takes place at around 45 to 50 years old. This can be explained by the hump-shaped marginal productivity profile of the individual. If treatment occurs at around the age of 45, the individual shifts hours to a period of higher productivity. If lowering the treatment age further, the increase in hours is spread out over a larger portion of the career and subsequently does not become as concentrated in the period of high productivity.
The tax treatment introduces opposing effects for savings, and thus the aggregate capital stock in the economy. Interestingly, as shown in panel 2 of Figure 3, I find that the net effect on the capital stock, both in qualitative and quantitative terms, depends on the timing of treatment. If treatment occurs at the age of peak labor productivity, the individual borrows more excessively against the future increase in net income. As such, most capital is crowded out if treatment occurs at around the age of 50. If treatment occurs early in the individual’s career, at least before the age of 38, it results in a sufficiently large increase in the lifetime budget constraint for savings to increase.
As the lifetime tax burden increases with the timing of treatment, the percentage increase in private consumption increases as the treatment age is reduced. This is illustrated in panel 5 of Figure 3. The highest level of steady-state private consumption is achieved, not surprisingly, when the labor income tax is eliminated altogether.
Furthermore, as illustrated in panel 4 of Figure 3, the tax treatment increases total tax revenue if treatment occurs sufficiently close to the calibrated retirement age. The increased tax revenue from higher participation is enough to dominate the lower labor income taxes paid by each worker receiving the treatment. The more granular presentation of the results in Figure 3 shows that the treatment is revenue-neutral if it takes place at approximately the age of 62. While lowering the treatment age can increase the aggregate efficient labor supply, this leads to lower total tax revenue. For example, $\bar {t}=45$
results in a reduction in government expenditures on the final good of 14.7 %, while the corresponding number given a complete removal of the labor income tax is 30.66 %. Ultimately, the age-homogeneous labor income tax profile is found to be too distortive, but for most treatment ages its removal results in a reduction in funds available for financing public expenditures.
$\bar {t}=45$
results in a reduction in government expenditures on the final good of 14.7 %, while the corresponding number given a complete removal of the labor income tax is 30.66 %. Ultimately, the age-homogeneous labor income tax profile is found to be too distortive, but for most treatment ages its removal results in a reduction in funds available for financing public expenditures.
The effect on aggregates for different treatment ages, ( $\bar {t}\in [1,38]$
). Black lines denote steady-state values in the baseline calibration. Red lines denote treatment values.
$\bar {t}\in [1,38]$
). Black lines denote steady-state values in the baseline calibration. Red lines denote treatment values.

4.2.1 Sensitivity
How responsive the individual is to the tax treatment in terms of re-allocating hours and consumption over the life cycle, as well as changing when they retire, is governed by the three inverse elasticity parameters $\{\sigma ,\nu ,\phi \}$
. This motivates analyses of whether the qualitative and quantitative results are sensitive to the values assumed in the baseline calibration.
$\{\sigma ,\nu ,\phi \}$
. This motivates analyses of whether the qualitative and quantitative results are sensitive to the values assumed in the baseline calibration.
The EIS disciplines the responsiveness of savings to a change in the interest rate. Furthermore, it partially determines the compensated wage elasticity. In the baseline calibration, I set the inverse EIS parameter $\sigma =1$
which is equivalent to assuming logarithmic preferences over consumption. This implies that the income and substitution effects for a symmetric change in the wage rate perfectly offset each other. Given the preference specification in this paper, a value of
$\sigma =1$
which is equivalent to assuming logarithmic preferences over consumption. This implies that the income and substitution effects for a symmetric change in the wage rate perfectly offset each other. Given the preference specification in this paper, a value of $\sigma \gt 1$
results in a dominating income effect and therefore backward bending labor supply curves. Gruber (Reference Gruber2013) instead finds evidence in favor of a substantially higher value for the EIS around 2. I therefore consider
$\sigma \gt 1$
results in a dominating income effect and therefore backward bending labor supply curves. Gruber (Reference Gruber2013) instead finds evidence in favor of a substantially higher value for the EIS around 2. I therefore consider $\sigma =0.5$
in this sensitivity analysis. The results are presented in Appendix B.1.
$\sigma =0.5$
in this sensitivity analysis. The results are presented in Appendix B.1.
In this alternative calibration, the substitution effect dominates the income effect. As such, the increase in the aggregate labor supply following treatment is larger relative to the baseline calibration. This leads to a greater increase in the lifetime budget, and total savings increase for any treatment age. This implies that the tax treatment can achieve the desirable outcome of simultaneously delaying retirement, increasing government revenue, and increasing the capital stock in the economy.
The second sensitivity analysis concerns the intensive-margin Frisch elasticity. Whalen and Reichling (Reference Whalen and Reichling2017) conclude that the most relevant interval for the Frisch elasticity for studying the effects of fiscal policy is [0.24, 0.53]. In the baseline calibration, the implied intensive-margin Frisch elasticity is equal to 0.5, and thus close to the upper boundary of this interval. I therefore re-calibrate the model by setting $\nu =3.7$
, which gives an elasticity equal to the lower limit of 0.24. The results are presented in Appendix B.2.
$\nu =3.7$
, which gives an elasticity equal to the lower limit of 0.24. The results are presented in Appendix B.2.
As suggested by equation (9), a lower value for the intensive-margin Frisch elasticity reduces the willingness to shift hours from pre- to post-treatment careers. Overall, the increases in the efficient labor supply and the retirement age are slightly reduced. Tax treatment can still increase total revenue if treatment occurs at a sufficiently late career stage.
Last, the baseline calibration implies a compensated Frisch elasticity of retirement, with respect to a change in the implicit tax of retirement, of approximately −0.42. Evidence suggests that the corresponding uncompensated elasticity is close to −1/3. By setting $\phi =0.5$
, the implied Frisch elasticity is halved relative to the baseline calibration. The results are presented in Appendix B.3.
$\phi =0.5$
, the implied Frisch elasticity is halved relative to the baseline calibration. The results are presented in Appendix B.3.
Since the retirement decision is now less sensitive to a change in the net replacement rate, the tax treatment implies smaller increases in the retirement age and the aggregate labor supply. This means that the reform becomes more costly for the government as the tax revenue from increased participation is lower than in the baseline calibration. Nevertheless, abolishing the NSS labor income tax for workers close to retirement is found to increase total tax revenue.
Ultimately, the qualitative result that the tax treatment can increase tax revenue, conditional on that treatment being given sufficiently late in the career, is seemingly robust to reasonable permutations of the key behavioral parameters explored. I therefore continue to perform the remaining numerical experiments with the baseline calibration as the preferred reference.
4.3 Tax shifting and welfare
The analysis in subsection 4.2 suggests that the tax treatment can increase tax revenue if treatment occurs sufficiently late in the career. Otherwise, treatment implies a reduction in the funds available for public expenditure. Subsequent sensitivity analyses suggest that these results are qualitatively robust to reasonable variations in the elasticity parameters. However, for most hypothetical treatment ages, the increased revenue obtained from the additional participation is not enough to offset the forgone revenue from abolishing the labor income tax.
To finalize the analysis, I ask how much the government would have to adjust consumption, capital, or pre-treatment labor income taxes to maintain revenue neutrality. Consequently, I consider what effects such tax shifting may have for the life-cycle profiles of the individual, and whether it is desirable from a welfare perspective.
Since the model concerns a representative individual, it is natural to use a standard utilitarian criterion to evaluate the welfare effects:
 \begin{equation} \begin{split} \mathcal{W}&=\int _0^{T} \frac {c(t)^{1-\sigma }-1}{1-\sigma }Q(t)e^{-\theta t}dt - \chi \Bigg \{ \int _0^{\bar {t}} \frac {h_1(t)^{1+\nu }}{1+\nu }Q(t)e^{-\theta t}dt \\&\quad + \int _{\bar {t}}^R \frac {h_2(t)^{1+\nu }}{1+\nu }Q(t)e^{-\theta t} dt\Bigg \}+ \eta \frac {(T-R)^{1-\phi }}{1-\phi } \end{split} \end{equation}
I use the compensating variations (CV) metric to quantify any changes in welfare. This measure informs about the percentage change in the annual consumption of the household necessary for welfare to be equal to the level obtained in the baseline calibration. A positive CV implies that the policy reform improves welfare.Footnote 11
4.3.1 Shifting toward consumption taxes
Conditional on all other tax instruments remaining unchanged, the task of the government is to adjust the consumption tax $\tau ^c$
to maintain the same total tax revenue as in the baseline scenario, given the elimination of the labor income tax for older workers. The result of this experiment is contained in Table 5.
$\tau ^c$
to maintain the same total tax revenue as in the baseline scenario, given the elimination of the labor income tax for older workers. The result of this experiment is contained in Table 5.
Shifting toward consumption taxation

Note: Full tax treatment. All values are expressed in relation to the baseline calibration.
Tax treatment at the age of 63 generates an increase in the steady-state revenue level. This allows the government to reduce the consumption tax rate from 19.4 to 18.85 to remain revenue neutral. As a result, lifetime consumption increases. For the younger treatment ages considered, the government needs to increase the consumption tax rate relative to the baseline scenario. Following the assumption of logarithmic preferences for the calibrated profile, the only real economic implication of increasing the consumption tax rate is a proportional reduction in consumption expenditures. As shown by equations (4) and (6), the tax does not modify the intertemporal allocation of consumption, nor the retirement decision. Regarding savings dynamics, as described by equation (2), the consumption tax terms cancel out when $\sigma =1$
. Ultimately, changes to the consumption tax do not modify the capital–labor ratio and do not give rise to any changes in factor prices. Thus, there is no feedback effect on labor supply decisions either. Shifting from the labor income tax to the consumption tax is always welfare improving in this framework. Tax shifting toward consumption taxes also leads to an increase in welfare when I consider the alternative parameterization for the inverse of the EIS (
$\sigma =1$
. Ultimately, changes to the consumption tax do not modify the capital–labor ratio and do not give rise to any changes in factor prices. Thus, there is no feedback effect on labor supply decisions either. Shifting from the labor income tax to the consumption tax is always welfare improving in this framework. Tax shifting toward consumption taxes also leads to an increase in welfare when I consider the alternative parameterization for the inverse of the EIS ( $\sigma =0.5$
).
$\sigma =0.5$
).
4.3.2 Shifting toward capital taxes
As the age-homogeneous labor income tax is found to be too distortive, it is natural to ask whether this is also true of the calibrated capital income tax rate. Thus, I consider whether the government can compensate for the deficit effects of the labor income tax treatment by reducing capital income taxes. The results are contained in Table 6.
Shifting toward capital taxation

Note: Full tax treatment. All values are expressed in relation to the baseline calibration.
I find that any deficit that follows from eliminating the labor income tax needs to be compensated by an increase in the capital income tax rate. This tax shifting results in lower welfare, except when treatment is given at the age of 55 or at an older age. When treatment occurs this late in the career, the labor income tax reduction largely finances itself. The increase in capital tax required is not large enough for a subsequent reduction in the capital stock to reduce welfare relative the baseline scenario. Since I allow for borrowing, the capital tax effectively constitutes a subsidy on loans. As the capital tax burden peaks around retirement age, discounting may partially explain why it is desirable from a welfare perspective to abolish the labor income tax for workers aged 60 and above, alongside an increase in the capital tax rate to ensure revenue neutrality.
For lower treatment ages, it is preferable to keep the age-homogeneous labor income tax than to shift the tax burden to capital income. For example, if treatment occurs at age 50, $\tau ^k$
needs to be more than doubled to offset the forgone revenue. Compensating for the full elimination of the labor income tax requires a capital income tax rate of 72.30%, which has substantial negative effects on steady-state capital stock, GDP, and consumption possibilities.
$\tau ^k$
needs to be more than doubled to offset the forgone revenue. Compensating for the full elimination of the labor income tax requires a capital income tax rate of 72.30%, which has substantial negative effects on steady-state capital stock, GDP, and consumption possibilities.
4.3.3 Shifting toward labor income taxes on younger workers
The final tax shifting option I consider is for the government to shift the tax burden from older workers to younger workers by modifying $\tau ^h_1$
to maintain revenue neutrality. The results are contained in Table 7.
$\tau ^h_1$
to maintain revenue neutrality. The results are contained in Table 7.
Shifting toward labor income taxation of younger workers

Note: Full tax treatment. All values are expressed in relation to the baseline calibration.
If treatment occurs after the age of 62 then total revenue increases, which allows the government to reduce the labor income tax paid by young workers, thereby increasing welfare. Since the individual discounts the future at a positive rate, shifting the tax burden from an older to a younger age reduces welfare. In fact, of the three different tax shifting policies considered, this results in the lowest welfare for any treatment age where the tax rate has to be increased. A natural limitation to this strategy is that it is not possible to execute if treatment implies a complete elimination of the labor income tax. I find that if treatment takes place at ages 30 or 35, it is not possible to shift the tax burden to younger workers.
4.3.4 Life-cycle profiles after tax shifting
Figure 4 compares life-cycle profiles under the different tax shifting regimes when the tax treatment takes place at the age of 45. Comparing the labor supply profiles, differences between shifting toward consumption taxes and capital taxes imply similar life-cycle profiles. Under the capital income shifting scheme, the net return to savings decreases, reducing the incentive to work while young.
When the tax burden is shifted to younger workers, the incentive to transfer hours worked from the pre- to post-treatment period increases. Since the net wage gap increases, this has a dramatic effect on the earnings profile as labor income becomes much more concentrated in the period between treatment and retirement. The individual reduces savings while young, given a lower net income and the anticipation of higher net earnings following treatment.
Life-cycle profiles given treatment age $\bar {t}=20$
conditional on revenue neutrality. Blue = tax shifting to consumption tax. Red = shifting to capital income tax. Gold = shifting to the labor income tax on young workers.
$\bar {t}=20$
conditional on revenue neutrality. Blue = tax shifting to consumption tax. Red = shifting to capital income tax. Gold = shifting to the labor income tax on young workers.

5. Model limitations
In this paper, I consider a stylized model in line with Gahramanov and Tang (Reference Gahramanov and Tang2013), Cottle Hunt and Caliendo (Reference Cottle Hunt and Caliendo2020), Caliendo et al. (Reference Caliendo, Casanova, Gorry and Slavov2023), and Gustafsson (Reference Gustafsson2023a) for the purpose of obtaining closed-form solutions to labor supply and savings behavior. Although tractability is a desirable feature, it is important to acknowledge the limitations of a stylized model for quantitative analyses. In this section, the key assumptions are discussed in relation to the findings in the literature and how they might affect the results obtained in this paper.
5.1 Perfect capital markets
The analysis in this paper is based on the assumption of competitive factor markets. Of course, this is not an innocuous assumption. It is well-documented that a substantial share of wealth is illiquid, such as housing wealth (e.g., Hurst and Stafford, Reference Hurst and Stafford2004; Slacalek, Reference Slacalek2009; Garriga and Hedlund, Reference Garriga and Hedlund2020). In addition, individuals can be subject to borrowing constraints (e.g., De Gregorio, Reference De Gregorio1996; Cameron and Taber, Reference Cameron and Taber2004; Drechsel, Reference Drechsel2023). Both these imperfections reduce one’s ability to smooth consumption and adjust hours worked at ages subject to credit constraints. Ceteris paribus, a young individual who would have preferred to borrow, but is unable to do so, will choose to work more and respond less to an increase in the labor income tax. By symmetry, the capital tax subsidizes borrowing in the model. Consequently, the capital tax will crowd out less capital if the borrowing constraint binds.
Adding per-period borrowing constraints to the continuous-time framework would require me to introduce a continuum of complementary slackness conditions, rendering the model extremely difficult to solve. If I instead recast the model in discrete time, this change would make adjustments on the retirement margin less marginal. Since the feature of marginal adjustments along the extensive margin is a main feature of the analysis, and the role of borrowing constraints would be of secondary importance, I stick with the continuous-time framework without borrowing constraints.
5.2 Exogenous labor efficiency profile
Following, e.g., Feigenbaum et al. (Reference Feigenbaum, Gahramanov and Tang2013), Kitao (Reference Kitao2014), and Bagchi (Reference Bagchi2017), I assume an exogenous labor efficiency profile to obtain closed-form solutions for intensive-margin labor supply.
In an alternative setting where productivity is endogenous, the effects of shifting the tax burden from older workers to younger workers could change relative to the results presented in Table 7. If training follows from hours worked, the effects of increasing the marginal tax on young workers should become smaller as they realize that the cost of reducing hours worked today includes forgone future wage growth. If human capital investments instead follow from some alternative learning activity that competes with hours worked, such as on-the-job training, the effects could instead be larger.
5.3 Steady state comparisons
The welfare analysis in this paper is restricted to steady-state comparisons. As such, I cannot conclude on the short-run welfare effects of the policy experiments, which could be non-trivial in terms of their redistributive effects across generations. For example, reducing the labor income tax of older workers and compensating by increasing consumption or capital taxes will not benefit the generations that have already retired at the time of the tax treatment. This should reduce the incentive for a social planner with a low enough generational discount rate to implement such a policy. However, since the pension system is PAYG, these generations will receive higher pension benefits as the aggregate labor supply increases. This effect will be larger in the periods just after treatment before the wage rate has been adjusted.
Importantly, I do not consider any reform to the funding of the pension system. Specifically, no generation is subject to a double burden over the transition path, as would be the case if the PAYG transfer mechanism were reformed.
5.4 Absence of inter-generational links
A model without bequests often struggles to explain the wealth holdings of older individuals observed in data (e.g., Davies and Shorrocks, Reference Davies and Shorrocks2000; Love et al. Reference Love, Palumbo and Smith2009; De Nardi and Yang, Reference De Nardi and Yang2014. In a model with intergenerational links, following from, for example, a warm-glow of leaving capital to the next generation, the age profile of capital holdings will shift towards the later periods of the lifetime. Consequently, a capital tax will place a greater burden on older individuals. The capital tax will then, on the one hand, reduce welfare by reducing savings for planned bequests. On the other hand, as the tax burden shifts towards older ages, this burden is more heavily discounted given both the subjective discount rate and the mortality probability.
5.5 No joint decision-making
Following, e.g., Wallenius (Reference Wallenius2013), Alonso-Ortiz (Reference Alonso-Ortiz2014), and Bagchi and Jung (Reference Bagchi and Jung2023), I study retirement policy in a representative household model and thus ignore heterogeneity in labor supply and savings elasticities. For example, Alpert and Powell (Reference Alpert and Powell2020) find that the average compensated participation elasticity is 3.9 for women, but only 0.7 for men. As such, this simplifying assumption likely masks the distributive consequences of eliminating labor income taxes for older workers.
Furthermore, I also abstract from intra-household bargaining between spouses (see, e.g., Chiappori, Reference Chiappori1988; Hagstrom, Reference Hagstrom1996; Fehr et al. Reference Fehr, Kallweit and Kindermann2016). In a joint decision-making model, the household’s labor supply and savings decisions are made to equalize the marginal values of savings and leisure (Blundell and MaCurdy, Reference Blundell and MaCurdy1999). This could have non-trivial effects on the labor supply outcomes of the policy experiments considered in this paper. For example, if only one spouse is old enough to be treated by a lower labor income tax, the household’s labor supply response could involve the trading of hours worked from the non-treated spouse to the treated spouse
5.6 No idiosyncratic risk
Introducing income risk into the model could have important implications for both savings and labor supply behavior. For example, Browning and Lusardi (Reference Browning and Lusardi1996) find that precautionary savings is an important motive for household savings, and a standard life cycle model without a precautionary savings motive will struggle to explain the amount of capital observed in the economy. In an OLG model with uninsurable income risk, Krueger et al. (Reference Krueger, Ludwig and Villalvazo2021) shows that the optimal capital tax rate is increasing in income risk. This suggests that this paper possibly underestimates the positive effects of tax shifting towards capital taxes.
Households can also insure themselves against negative shocks by adjusting their labor supply. For example, Attanasio et al. (Reference Attanasio, Low and Sánchez-Marcos2005) show in a life-cycle model that additional risk increases female labor participation rates. This effect is most pronounced among households that are unable to borrow when hit by a negative shock. However, Pruitt and Turner (Reference Pruitt and Turner2020) and Busch et al. (Reference Busch, Domeij, Guvenen and Madera2022) find limited evidence for the added-worker effect in economic downturns. Conesa and Krueger (Reference Conesa and Krueger2006) show that idiosyncratic income risk motivates increased progressivity in the tax system as it can provide partial insurance for missing insurance markets and reduce inequality. Ultimately, exploring the implications of income risk for the effects of age-targeted income taxation is a natural next step.
6. Conclusions
Given population aging, longer careers can be desirable to reduce the burden on unfunded pension liabilities. This has influenced many economies to introduce policies that encourage older workers to remain in the workforce. While the literature has focused primarily on social security reform, less attention has been given to the notion of encouraging longer careers through income tax codes.
The present paper studies whether removing the NSS portion of labor income taxes for older workers can constitute an effective policy to increase overall participation in the long run. To this end, I build a general equilibrium model with overlapping generations. The microfoundations allow for decisions along the consumption-savings margin, the intensive-margin labor-leisure margin, and decisions on when to retire. Calibrating the model to an average OECD economy provides the baseline for policy simulations.
In terms of life-cycle effects, eliminating the NSS labor income tax after a certain age introduces an incentive to shift hours from the pre- to the post-treatment working life. On average, the reduction in pre-treatment hours explains 22% of the post-treatment increase in labor supply, after accounting for general equilibrium effects. This result is robust to lower-range empirical estimates of the intensive- and extensive-margin Frisch elasticities.
The effects on the capital stock depend on the timing of treatment. While a delayed retirement reduces the need for savings, the tax treatment implies an increase in the lifetime budget constraint. I find that the tax treatment has to be given sufficiently early in the career, at around the age of 39, for the wealth effect to dominate and for total savings to increase.
The simulations suggest that the age-homogeneous NSS labor income tax, at a rate equal to the average for OECD economies, is too distortive. The elimination of the labor income tax after the age of 62 increases government revenue, which in turn allows the government to reduce other tax rates and increase welfare. If treatment is given at earlier ages, the effects on participation are negligible, while being increasingly costly for the government in terms of forgone revenue. While shifting toward consumption taxes to maintain revenue neutrality always improves welfare in this model economy, shifting toward capital income taxes, or labor income taxes paid by younger workers, reduces welfare in most scenarios. For example, if the NSS labor income tax is eliminated for workers above the age of 45, increasing consumption taxes to maintain revenue neutrality is associated with a welfare increase, calculated using compensating variations, of 1.72%. The corresponding welfare changes of instead shifting towards capital taxes or labor income taxes on young workers are −1.99% and −2.73%, respectively.
Ultimately, the takeaway message of this paper is that age-differentiation of the income tax system, in the form of favorable tax treatment of older workers, can be a viable policy option for achieving longer careers. For example, conditional on revenue neutrality, eliminating the labor income tax at age 60 increases aggregate efficient labor supply by 3.05–3.12%, output by 0.85–1.53%, and private consumption by 3.02–3.41%. Given this treatment age, welfare also increases under any tax shifting measure which maintains a balanced budget, including higher capital taxes.
There are several avenues worth exploring further. Populating the model with heterogeneous agents would allow for studying the effects on intragenerational economic inequality. Redistributive effects are likely to be sensitive to the inclusion of endogenous health and human capital effects. Another direction is to explore whether other parameters in the tax code, such as the progressivity of the tax system, can achieve similar effects on participation among older workers. This paper considers the elimination of the NSS portion of labor income taxes. Similar experiments could eliminate the social security portion of payroll taxes. However, if the calibration exercise is to be generalized to the OECD, the question of pension system design becomes unavoidable, since the outcome of any reform is likely to be sensitive to the link between contributions and received benefits.
Acknowledgement
I thank the editor, William A. Barnett, an Associate Editor, two anonymous Referees, Thomas Aronsson, Spencer Bastani, Pavel Brendler, Jane Gravelle, Åsa Hansson, Katharina Jenderny, Gauthier Lanot, Jacob Lundberg, Felix Reichling, Tomas Sjögren, Mattias Vesterberg, Magnus Wikström, and Sonal Yadav, the participants at the 2020 National Tax Association Conference, the 2021 CESifo Area Conference on Public Economics, and the Economic Policy Network (TEPN) seminar at Umeå University, for their valuable input. I also gratefully acknowledge the financial support of the Jan Wallander and Tom Hedelius Foundation and the Tore Browaldh Foundation for the project Human Capital, Heterogeneity and the Performance of Social Insurance (project number: P17-0217). This paper is a substantially revised version of a paper that has circulated under the title “Age-Targeted Income Taxation, Labor Supply, and Retirement” (CESifo working paper, No. 8988-2021).
Supplementary material
The supplementary material for this article can be found at https://doi.org/10.1017/S1365100525100230.


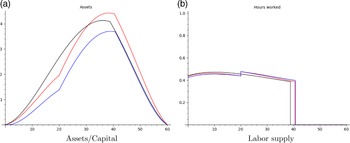

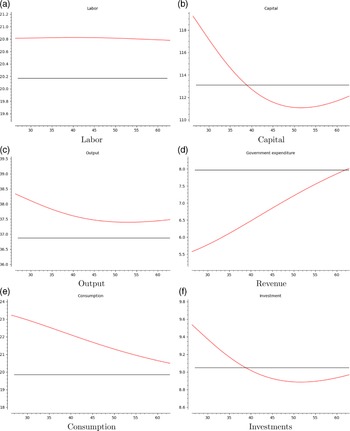


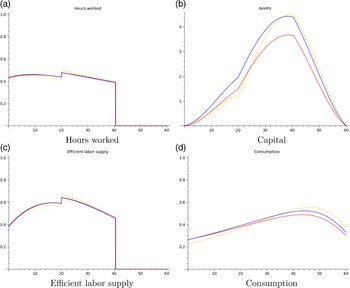


 Open access