


1. Introduction
When conducting a simple Google search on the term ‘retirement planning’, one finds an overwhelming share of articles which contain recommendations on saving decisions and on how to allocate savings to increase financial wellbeing in retirement. Given this prevailing focus on savings and investment decisions, one could forgive a typical retiree for believing that retirement planning is synonymous with wealth accumulation. Yet, while wealth accumulation is certainly a mandatory condition for successful retirement preparation, it is not a sufficient condition to achieve a targeted steady stream of income during retirement. However, determining how to draw down his wealth is not an easy task for a person contemplating retirement, as one cannot rely on experience.
Rational choice theory predicts that, in the absence of a bequest motive, households will fully convert their savings into a lifetime annuity (Yaari, Reference Yaari1965). Yet, despite the attractiveness of annuities as a way to protect against the risk of outliving one's retirement wealth, relatively few of those facing retirement actually annuitize a significant proportion of their wealth, a discrepancy coined the annuity puzzle.Footnote 1
In this paper, we seek to investigate the wealth decumulation decision from the perspective of a retiree who is averse to the prospect of fully annuitizing his savings. Such an individual faces the following decision problem. Out of one's non-annuitized wealth, one must decide how much to allocate to a savings account (e.g., as protection against early unexpected expenditures) and how much (if anything) to decumulate during retirement. As an alternative to annuities, we investigate consumers' preferences for phased withdrawal accounts. In the light of recent findings, which question the benefit of full annuitization in the presence of stochastic health shocks (e.g., Reichling and Smetters, Reference Reichling and Smetters2015; or Peijnenburg et al., Reference Peijnenburg, Nijman and Werker2017), such an analysis might not only provide valuable insights for the design of complementary products but also important policy implications.Footnote 2
To study these issues, we field a large online survey in cooperation with a national German newspaper, Frankfurter Allgemeine Zeitung (FAZ), in which we elicit preferences for simple withdrawal strategies. The strategies differ across two main dimensions, risky vs. risk-free asset allocation and constant vs. dynamic withdrawal rates. We examine (1) what hypothetical products individuals find most appealing, (2) what factors people say are most important in their wealth decumulation decision, (3) whether standard utility functions to study consumption decisions adequately capture observed preferences for phased withdrawals, (4) how the demand for phased withdrawal products compares to the demand for annuities, and (5) how retirement preparation affects individuals' willingness to decumulate wealth.
Using a survey to investigate our research question has both advantages and disadvantages. On the positive side, we can use hypothetic choice questions to measure preferences for specific (non-existing) products, which are unobservable in field data. Another advantage is the sample from which we can draw the survey data. While readers of the FAZ are not representative of the general population (they are on average more educated and have higher income), they are highly representative of those most affected by the decision of how much wealth to decumulate. On the negative side, the choices individuals make do not translate to their actual life outcomes. As a consequence, the results may not correspond to the choices people would make in a real-life situation. However, even though the resulting choice behavior might be noisy, it would be surprising if it leads to systematic patterns that are absent in actual behavior.
From our survey, five main findings emerge. First, we find that most participants prefer phased withdrawal accounts with equity-based asset allocation and dynamic withdrawal rates, which smooth the withdrawal amount across market phases. Overall, roughly 81% of our respondents select a drawdown strategy with an equity-based asset allocation, while only 19% prefer a strict risk-free asset allocation. Additionally, out of those participants who prefer an equity-based decumulation strategy, only 35% prefer constant withdrawal rates, which cannot offer protection against depleting the capital stock early, as withdrawal rates do not adjust for periods of low returns. Conversely, 65% prefer dynamic withdrawal rates, which adjust the withdrawal amount based on realized returns in order to avoid depleting the capital stock too fast. This choice pattern suggests that while retirees are highly averse to some risks (namely having to live on a permanently lower income) they are less risk-averse when it comes to equity investments with long planning horizons.
Second, the self-reported importance of various withdrawal characteristics closely mirrors participants' actual choice. The two considerations that respondents report being most important for their withdrawal account choice are sufficient protection against the risk of depleting the capital stock early, while also achieving relatively high returns on the invested assets. Taken together with the actual withdrawal account choice, our results highlight that customers desire flexible payout structures, which dynamically adjust in states of low returns. Most currently offered decumulation products (e.g., lifelong annuities) primarily offer constant income streams, even though there is no economic reason to do so assuming that major expenses (e.g., vacations or health costs) do not occur on a regular basis. While such income streams may allow customers to plan ahead, they could also have detrimental effects on the demand and – relatedly – the generated returns (guaranteed income streams come at the expense of less risky investment options). We provide new evidence that the latter effect is of importance.
Third, a time-separable power utility function with bequest motives as frequently employed in life cycle models predicts that a decumulation strategy with equity-based asset allocation and dynamic withdrawal rates is the utility-maximizing choice for a large number of preference parameter combinations. As the predictions of the utility function are closely in line with participants' actual choice, our results provide evidence for the suitability of such utility functions to study not only consumption and savings decisions but also wealth decumulation topics.
Fourth, we find that only 12% of all respondents would choose an annuity product to decumulate their wealth, while 88% would rather select a phased withdrawal solution. This result – while surprising – is not only in line with subjects' preference to be flexible in the way they decumulate wealth but also with general findings on the annuitization puzzle. According to a survey conducted by Beshears et al. (Reference Beshears, Choi, Laibson, Madrian and Zeldes2014), many subjects report that ‘flexibility in the timing of my spending’ is an important factor in their annuitization decision. Nonetheless, many consumers seem to neglect the insufficient protection against longevity risk in their choice. Even though the annuity in our study provides higher yearly payments compared to a phased withdrawal strategy with risk-free asset allocation for horizons greater than 20 years (due to the mortality credit), only 22% of retirees actually choose the annuity in this comparison.
Finally, we find that participants are willing to decumulate on average 65% of their liquid savings over the course of their retirement. In contrast to this rather high self-reported willingness to decumulate wealth, actual spending in retirement is still quite low (e.g., Olafsson and Pagel, Reference Olafsson and Pagel2018). Given the low demand for annuities in our sample, we conjecture that part of this discrepancy is driven by the lack of alternative wealth decumulation products. Additionally, we find two opposing effects of how retirement preparation affects individuals' willingness to decumulate wealth. First, individuals who successfully prepare for retirement by consulting financial planners or by sticking to saving plans do not show an increased propensity to draw down a greater fraction of their savings, even though they accumulated more wealth on average. Thus, while wealth accumulation is certainly an important ingredient for retirement preparation, it does not predict subsequent decumulation. However, we do find that individuals' attitude towards retirement affects their willingness to decumulate wealth. We find that while moderate optimism is positively related to the wealth participants are willing to decumulate, extreme optimism leads to a strong negative effect. Consistent with the model of Brunnermeier and Parker (Reference Brunnermeier and Parker2005), it appears that moderately optimistic individuals are more inclined to take small risks to increase their wellbeing, while extreme optimists reduce their spending possibly to protect against longevity, thereby overestimating their income from non-annuitized wealth.
Our study contributes to the literature on optimal retirement planning under consideration of both phased withdrawals and annuities (e.g., Milevsky and Young, Reference Milevsky and Young2002, Reference Milevsky and Young2007a; Dus et al., Reference Dus, Maurer and Mitchell2005; Kingston and Thorp, Reference Kingston and Thorp2005; Horneff et al., Reference Horneff, Maurer and Stamos2008b, Reference Horneff, Maurer and Stamos2008c; or Horneff et al., Reference Horneff, Maurer, Mitchell and Rogalla2015). Prior literature on optimal withdrawal planning ties annuities to financial planning and thus investigates a combined consumption and portfolio choice problem including mortality risk. We extend this work by investigating which phased withdrawal characteristics most closely resemble actual retirees' preferences. Consistent with the predictions of Dus et al. (Reference Dus, Maurer and Mitchell2005) as well as Horneff et al. (Reference Horneff, Maurer, Mitchell and Dus2008a), our results show that many retirees value variable payout structures, higher returns from equity investments, as well as the option to bequeath wealth in the event of early death. At the same time, many retirees still seem to neglect that even though phased withdrawals provide more flexibility in the timing of the spending, they cannot offer protection against longevity risk. In the light of current regulatory efforts, which discuss the benefits and drawbacks of forced annuitization of defined contribution payments, our results suggest that policymakers should consider offering combined solutions. Distributing wealth among annuities and phased withdrawals could help retirees who are averse to full annuitization to insure against longevity risk, while also preserving wealth and making use of the equity premium.
The remainder of the paper is organized as follows. In Section 2, we describe several phased withdrawal strategies and illustrate their implications in a utility framework. In Section 3, we describe the design of our online survey and outline how we elicit preferences about the properties of retirement products. We then present our key empirical results in Section 4 and conclude with a discussion of possible policy implications and future research questions in Section 5.
2. Phased withdrawal accounts
2.1 Decumulation schemes
A phased withdrawal account requires that retirees allocate a fraction of their retirement savings across various financial assets such as equities and bonds where the assets will earn returns depending on the chosen asset allocation. To fund consumption during retirement, retirees can withdraw a certain amount of the invested funds according to a prespecified rule over a given planning horizon. Compared to life annuities, phased withdrawals offer greater liquidity as well as the possibility of greater consumption while being alive. Additionally, they offer the possibility of bequeathing some of the invested assets in the event of early death. At the same time, however, retirees can potentially outlive their retirement resources, as the asset drawdown provides no pooling of longevity risk.
To assess the relative importance of various withdrawal characteristics for potential consumers in our survey, we construct phased withdrawal strategies that differ across two main dimensions: constant vs. dynamic withdrawal amounts and risky vs. risk-free asset allocation. We label the resulting drawdown strategies as (1) risk-free – constant consumption, (2) risky – constant consumption, and (3) risky – dynamic consumption.Footnote 3 To avoid too much complexity in the decumulation strategies and to ensure that the characteristics are still clearly differentiable for participants, we use simple heuristics to construct the strategies.
Strategy 1: risk-free – constant consumption
For the first strategy, calculating the constant amount C t that can be withdrawn over a fixed number of years assuming deterministic returns only depends on participants' planning horizon and their accumulated wealth. As such, the withdrawal amount C t in every period t is defined using the following formula:

where r f is the real risk-free rate of return, H is the planning horizon in years, and W 0 is the initial disposable retirement wealth that an agent wants to decumulate. Although this strategy cannot default due to the risk-free asset allocation, the average consumption is low.
Strategy 2: risky – constant consumption
The second strategy combines a constant yearly withdrawal amount C t with a risky investment strategy. We implement these features by withdrawing each year a fixed percentage w of the original retirement wealth W 0 (adjusted for inflation), which is invested in a well-diversified portfolio.Footnote 4


Note that by combining constant withdrawal rates with stochastic returns, the strategy can neither guarantee that the capital stock is sustained until the end of the planning horizon (i.e., it can default), nor that the initial wealth will be fully exhausted in the decumulation process (i.e., it could also end up with a large terminal wealth). In other words, as long as there is enough wealth, the real withdrawal amount remains constant every year. If there is not enough wealth, the remaining wealth is withdrawn and the strategy ends prematurely (i.e., it defaults in our terminology). To ensure comparability across different planning horizons, we selected the withdrawal rate w such that the default probability remains constant at 10% (i.e., a higher withdrawal amount for shorter horizons).Footnote 5 The resulting withdrawal rates for different planning horizons (determined with simulations) are displayed in the Appendix.
Strategy 3: risky – dynamic consumption
The third strategy features dynamic withdrawal rates paired with a risky investment strategy. It can be implemented in a similar fashion as the first strategy with one exception. Once return expectations are stochastic, the realized return will most likely not equal the expected return. As a consequence, the actual withdrawal amount for each year has to be recalculated each period, taking the realized return (and as such the actual portfolio value) of the previous period into account. The real withdrawal amount C t in every period t is thus determined as follows:

where E[r] is the real expected return of the underlying investment strategy, H is the planning horizon, and W t is the current wealth level in period t that the agent wants to decumulate. Whenever the expected return in any given period does not equal the realized return, the consumption does not equal to the consumption in the previous period. In other words, the resulting consumption pattern fluctuates and directly depends on the realized return and the number of periods that are left (denoted with H − t). The resulting relatively high withdrawal rates (the portfolio value will be fully exhausted at the end of the final period) come at the expense of uncertainty about the actual withdrawal amount.
Besides the withdrawal strategies we employ in our study, several other options have been suggested in the literature. Among the most prominent decumulation strategies is the so-called ‘self-annuitization’ (e.g., Milevsky and Robinson, Reference Milevsky and Robinson2000; Albrecht and Maurer, Reference Albrecht and Maurer2002; Dus et al., Reference Dus, Maurer and Mitchell2005; Bateman et al., Reference Bateman, Eckert, Iskhakov, Louviere, Satchell and Thorp2018). The idea of this strategy is to replicate the payout from a life annuity as long as the funds permit, while at the same time offering liquidity and some bequest in the event of an early death. The self-annuitization strategy is in essence identical to our second strategy (risky – constant consumption), as both strategies withdraw a constant amount in every period. The main difference is that a self-annuitization strategy keeps the withdrawal amount constant for different planning horizons, which means that the default probability increases for longer horizons. To ensure comparability across different planning horizons, we instead choose to keep the default probability constant, which requires that the withdrawal amount decreases for longer horizons. Dynamic withdrawal strategies frequently discussed in the literature include the 1/T rule and the related 1/E(T) rule (e.g., Dus et al., Reference Dus, Maurer and Mitchell2005; or Horneff et al., Reference Horneff, Maurer, Mitchell and Dus2008a). In both strategies, the idea is to withdraw a fraction of the remaining wealth according to the remaining years of the planning horizon. The difference is whether the maximum limiting age is taken into account in a static way (1/T rule) or in a dynamic way depending on the retiree's remaining life expectancy (1/E(T) rule). Another dynamic withdrawal strategy employed in the literature ties the withdrawal amount to an annuity factor. The annuity factor can either be fixed at the beginning of retirement (as for the ‘self-annuitization strategy’) or vary annually with the progressing age of the retiree to generate a dynamic consumption profile (e.g., Milevsky and Young, Reference Milevsky and Young2007b; or Horneff et al., Reference Horneff, Maurer, Mitchell and Stamos2010).
Although some of these strategies are well established in the financial planning literature, we seek to put a stronger emphasis on highlighting the properties of various decumulation schemes in our survey. That is, instead of examining whether consumers always follow the most optimal decumulation scheme, we are interested in how they weight different options in their decision making.
To allow participants to compare risk and benefit characteristics of each strategy conditional on survival, we conduct Monte Carlo simulations. To do so, we assume that retirees decumulate their wealth over a period of a minimum of 20 years and a maximum of 30 years (i.e., to the age of 95 years assuming a retirement age of 65 years). For the risk-free asset allocation, we use the historical inflation-adjusted average of 1-year German government bonds, which amounts to roughly 1.22% for the past 30 years (as reported by the German Federal Bank). The risky investment strategies assume that retirees hold their non-annuitized assets in a 60% stock, 40% bond portfolio, as typically offered by balanced funds (e.g., Gomes et al., Reference Gomes, Kotlikoff and Viceira2008). The equity component in our study is represented by the MSCI World Index, while the bond component is represented by monthly US treasury bills. The plan assets are rebalanced annually and returns are adjusted for inflation. Portfolios are constructed for the period between February 1970 and February 2018. Return data for the MSCI component was obtained from Datastream, while the risk-free rate was downloaded from the union of the CRSP/Compustat database. Overall, the expected yearly gross rate of return of the risky portfolio amounts to 7.14% with a standard deviation of 10.01%. Additionally, we assume fund fees of 0.50%, thus yielding an expected net return of 6.64% p.a.
To simulate outcomes, we employ a bootstrapping algorithm, which randomly draws (with replacement) 360 return observations (12 months over 30 years) from our portfolio data to generate one scenario with 30 years of data. This process is then repeated 10,000 times to obtain a sufficient number of scenarios. The resulting wealth profiles as well as the consumption paths of all three phased withdrawal strategies are displayed in Part A of the Appendix.
2.2 Utility simulations
In this section, we derive some normative predictions regarding the properties of the phased withdrawal plans we use in our survey. We start by assuming that an exemplary agent enters retirement at the age of 65 yearsFootnote 6 (t = 1) with an accumulated initial wealth W 0 > 0. To decumulate his wealth, the retiree has access to the three different withdrawal strategies described previously, which ultimately define the amount C t he is able to consume at the beginning of each period. Moreover, we assume that the retiree survives every year with a positive probability p t,g > 0 (g ∈ {male, female}) until the last year of the planning horizon is reached. If the retiree either dies before the final period or does not consume all of his wealth before the plan ends, we assume that the remaining wealth will be transferred to an heir, yielding a (dis-)utility in the form of a bequest B. Note that this analysis only captures a fixed period of years and neglects the period after the planning horizon. While simplifying, the assumption is not unjustified as non-insurance products cannot offer longevity protection. As such, retirees face both capital markets risk and longevity risk.
We assume that retirees' preferences are described by a time-separable power utility function proposed by Cocco et al. (Reference Cocco, Gomes and Maenhout2005):

where δ < 1 is the discount factor and γ > 0 is the coefficient of relative risk aversion. The parameter b controls the intensity of the bequest motive. While positive values of b translate to retirees' desire to benefit future generations, negative values of b correspond to a view that bequests are an inefficient resource allocation. For simplicity, we assume that the utility function applied to the bequest is identical to the utility function of the retiree's own consumption.Footnote 7
We begin our analysis by restricting our attention to preference parameter tuples (γ, b) for which γ ∈ [1, 10], and b ∈ [−0.5, 2]. We focus on values of γ that are below 10, as this is the upper bound for risk aversion considered reasonable by Mehra and Prescott (Reference Mehra and Prescott1985), and restrict the intensity of the bequest motive to not exceed the benefit of own consumption by a factor of two. We then discretize each of the two intervals (γ, b) into a set of 40 and 25 equally spaced points and study parameter tuples where each parameter takes a value that corresponds to one of the discrete points. As we repeat the analysis for four different planning horizons T ∈ {20, 25, 30, 35}, we study 40 ⋅ 25 ⋅ 4 = 4, 000 different scenarios for each simulated consumption path.
Figure 1 presents results. First, we see that the withdrawal strategy with risky asset allocation and dynamic consumption is the utility-maximizing choice for the majority of more realistic preference parameter combinations. Considering all combinations, this strategy is optimal in 2,533 out of the 4,000 parameter tuples. In particular, for medium positive values of the intensity of the bequest motive (0 ≤ b ≤ 0.5), we find the third strategy is the utility-maximizing choice for all levels of risk aversion. Yet, as risk aversion increases, the floor between the third and the other two strategies is decreasing. This finding is not surprising. As relative risk aversion increases, the benefit of an additional unit of consumption is strictly decreasing. As such, the high average consumption of the third strategy becomes relatively less important.
Utility simulations. These figures display the utility-maximizing withdrawal plan for the given preference parameter tuple, as indicated by the colored dots. The y-axis captures the intensity of the bequest motive for parameter values b ∈ [ − 0.5, 2]. The x-axis depicts the parameter of relative risk aversion for values γ ∈ [1, 10]. Each figure displays one planning horizon for T = {20, 25, 30, 35}.
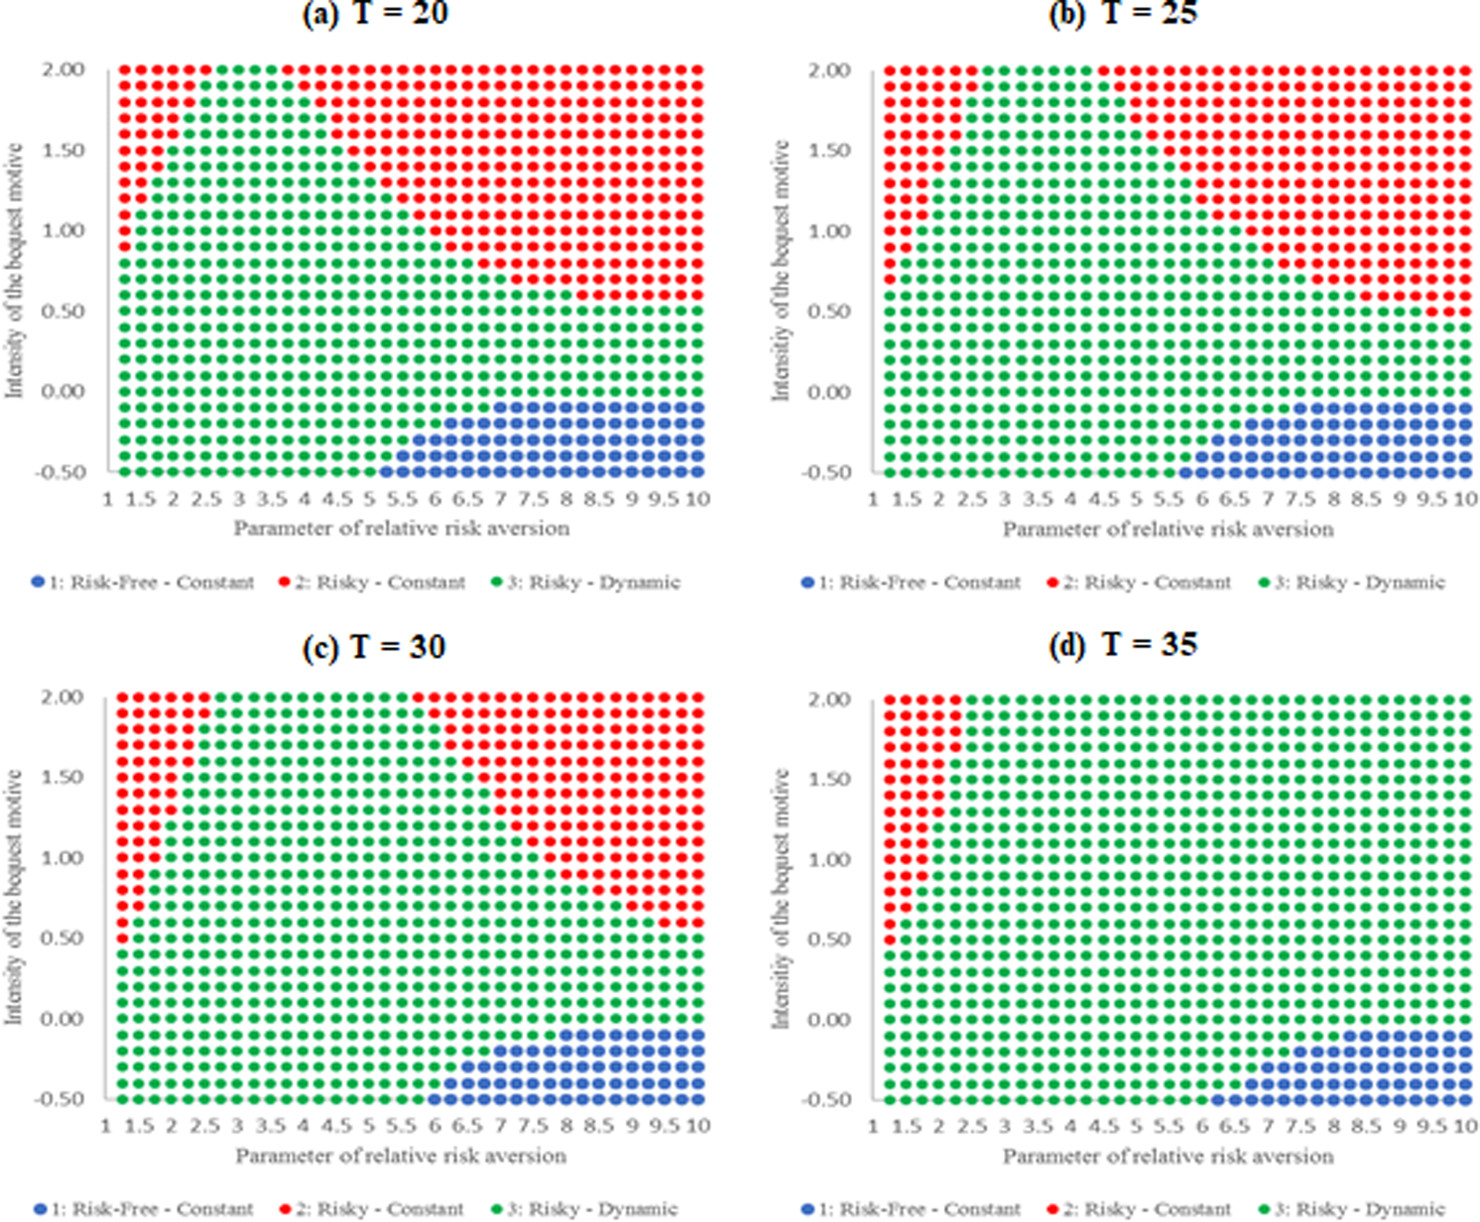
Observation 1: A withdrawal strategy with risky asset allocation and fluctuating consumption is the utility-maximizing choice for most realistic parameter tuples. Its utility is decreasing in the parameter of relative risk aversion and decreasing the further the intensity of the bequest motive is away from zero.
Second, we find that a withdrawal strategy with risk-free asset allocation and constant withdrawals is never optimal as long as b ≥ 0. As risk aversion increases and the bequest intensity decreases, this strategy becomes gradually the optimal choice until it is optimal for any b < 0. In other words, as long as a retired investor with preferences as described here is at least indifferent to the prospect of leaving a bequest, he would never choose to decumulate his wealth using a completely risk-free asset allocation. For those investors, however, who are both highly risk-averse (and as such do not value high consumption) and who view bequests as an ‘inefficient’ way of allocating their retirement resources, such an allocation would be the utility-maximizing choice.
Observation 2: A withdrawal strategy with risk-free asset allocation is never the optimal choice unless investors are both highly risk-averse and averse to the prospect of leaving bequests.
The remaining withdrawal strategy features a risky asset allocation paired with constant withdrawal amounts. In contrast to the risk-free strategy, we observe that as the intensity of the bequest motive increases, this strategy becomes the utility-maximizing choice for both low and high parameters of relative risk aversion. For medium values of relative risk aversion, however, the strategy with dynamic withdrawal amounts remains the utility-maximizing choice. The intuition for this finding is as follows. Both strategies follow the same asset allocation, and as such, generate the same returns over the respective time horizon. As the consumption of the constant withdrawal strategy is on average lower compared to the consumption of the dynamic strategy, more overall wealth is generated. As bequests rise in importance, so does overall wealth, which explains the positive relation with the intensity of the bequest motive. The relation with the parameter of relative risk aversion is a little more subtle. For low levels of risk aversion, more consumption (or wealth) is always better due to the low concavity of the utility function. As average wealth is much higher than average consumption, the lower consumption of Strategy 2 is outweighed by the high average bequeathable wealth and as such, Strategy 2 is the optimal choice. For intermediate values of risk aversion however, the more balanced relation between consumption and wealth of Strategy 3 eventually becomes superior. Yet, for high levels of risk aversion, this relation shifts once again. Now, the utility function has a fairly high concavity and as such, even great differences in consumption and wealth translate to only marginal increases in utility. At this point, the difference in consumption between both strategies is no longer enough to offset the difference in wealth at later stages of the planning horizon. In particular, while the wealth profile of Strategy 3 is decreasing, it is increasing for Strategy 2. As a consequence, Strategy 2 becomes optimal once again, given a relatively high intensity of the bequest motive.
Observation 3: A withdrawal strategy with risky asset allocation and constant withdrawals is the utility-maximizing choice for investors with strong bequest motives who show either a relatively low level of risk aversion or a relatively high level of risk aversion.
Finally, we can also compare the utility of the withdrawal strategies across different time horizons. Most notably, we find that while Strategy (3) becomes the utility-maximizing choice for an even greater range of preference parameters, Strategy (2) vanishes nearly entirely for very long planning horizons (T = 35). Only for very low values of relative risk aversion and a high intensity of bequests, Strategy (2) is still utility maximizing. This is partially related to how the second strategy was constructed for different time horizons. To make the strategy comparable, we adjusted the withdrawal amounts under the constraint that the probability of default remains constant across all horizons. As such, average yearly consumption declines for longer planning horizons while average wealth levels increase. For higher parameters of risk aversion, the increase in wealth is, however, not enough to outweigh the drop in consumption compared to other strategies.
Observation 4: With longer planning horizons, withdrawal strategies with dynamic withdrawal rates gradually become the utility-maximizing choice for most preference parameter combinations.
3. Survey design and summary statistics
3.1 Survey design
To investigate the wealth decumulation decision and to elicit actual preferences regarding the design of phased withdrawal strategies, we conduct an online survey in cooperation with the newspaper FAZ. The survey was promoted to cover retirement decisions and planning and was accessible through a link that was posted on their online portal on August 16, 2018. The survey and related material can be found in the Appendix.
Overall, 3,598 participants with an age ranging from 18 to 93 completed the survey. Participants answered hypothetical questions about different retirement products, their willingness to decumulate wealth in retirement, and rate how the payout structure of a hypothetical income drawdown offering should look like. Moreover, they answered questions about demographics and household characteristics, risk preferences, financial literacy, and numeracy.
In the survey, we focus on four characteristics, which are all related to the shape of the stream of payouts. The first characteristic resembles participants' expectations about the magnitude of the payouts. The second characteristic is what we refer to as the variance in the payout stream. Although constant payout streams allow consumers to plan with a given budget, fluctuating (or dynamic) payout streams can adjust to economic conditions. That is, in states of high returns, consumers can either increase consumption or increase savings (e.g., by capping the maximal withdrawal amount) to shift more consumption to states with adverse market conditions. The third characteristic we assess is the uncertainty in the payout stream. As phased withdrawals can invest in equities, they are necessarily subject to capital market risks, which – depending on the payout policy – can lead to default risk. In our context, we use the term default risk to refer to the probability of exhausting the capital stock before the end of the planning horizon. Finally, the fourth characteristic resembles bequest motives. In other words, we assess to what extent participants view wealth that is not consumed before they die as an inefficient way of allocating resources or as an opportunity to benefit future generations. Each of the four characteristics was elicited in two different ways in a within-subject design.
Product-based
In the product-based elicitation, we seek to measure the relative importance of the payout characteristics by presenting participants with three different phased withdrawal accounts to choose from (described earlier). The three withdrawal strategies we present all differ with respect to the benefits they offer to participants. Although the first strategy cannot default due to the risk-free investment strategy, the resulting consumption is low on average. Conversely, while the second strategy offers higher returns it can both default or alternatively end with a high terminal wealth. Finally, even though the third strategy cannot default in a strict sense (i.e., consumption can never reach zero before the final period of the planning horizon), the average withdrawal amount fluctuates in tandem with the economy which can lead to several periods of low consumption despite its high average consumption.
As each withdrawal strategy focuses on different characteristics, participants have to trade-off the benefits and drawbacks and decide which combination best suits their preferences. Their preferred choice allows us to elicit which characteristic carries the most weight in their decision-making process. Each withdrawal strategy is described by five key financial variables (average withdrawal amount, default probability, consumption fluctuation, withdrawal amount in the worst 5% of the cases, as well as average possible bequest after the final period of the planning horizon) and a brief overview of advantages and disadvantages.Footnote 8 Additionally, each withdrawal account was tailored to participants' indicated household wealth and the horizon over which they would want to decumulate their assets (choice between 20, 25, or 30 years). Figure 2 depicts the order in which questions on the phased withdrawal choice are presented. The exact wording of the strategies is reported in the Appendix.
Survey structure. This figure displays the order in which the questions regarding demographics, the withdrawal plan choice, and the annuity choice were presented. Both decumulation strategies and annuities were adjusted for previously reported demographics, including gender, wealth, and planning horizon.

In a consecutive question, participants decide whether they prefer a decumulation strategy or a life-long annuity. The annuity is presented in a similar fashion compared to the withdrawal strategies. The annuity values are calculated assuming a real interest rate of 1.22% (as for the risk-free decumulation strategy) and using the latest life tables for Germany. Moreover, due to adverse selection in the annuity market, we made a downward adjustment to the expected present discounted value of the fair annuity following Mitchell et al. (Reference Mitchell, Poterba, Warshawsky and Brown1999). This downward adjustment amounts to 15% and 10% of the fair value for male and female participants, respectively. To avoid potentially confounding framing effects as discussed by Brown et al. (Reference Brown, Kling, Mullainathan and Wrobel2008), the variables for the phased withdrawals and the annuity were both framed in terms of consumption and described periods in terms of participants' age in retirement. Finally, after subjects decided which product best suits their preferences, they are asked to answer a question about how much of their overall wealth they would be willing to decumulate over the course of their retirement.
Self-reported
In the self-reported elicitation strategy, we directly ask subjects to assess the importance of the four payout characteristics on a seven-point Likert scale. The exact wording is reported in the Appendix. Participants have to answer these questions after they chose their preferred decumulation strategy. While this was done to ensure that subjects have a profound understanding of what the statements mean, the increased knowledge comes at the expense of individuals potentially ex-post rationalizing their initial choice. To avoid that the order in which questions are presented affects our results, we focus the subsequent analyses on participants' preferred strategy and use the self-reported measures as consistency check. In addition, we also ask participants to provide an estimate of their life expectancy and health status (adopted from the Survey of Consumer Finances and Mirowsky, Reference Mirowsky1999), to indicate which tools they use to prepare for retirement and whether they have tried to figure out how much their household would need to save for retirement. Self-reported life expectancy and health status have been found to be amongst the most important factors influencing the annuitization decision, while the latter factors are important determinants for successful retirement planning (Lusardi and Mitchell, Reference Lusardi and Mitchell2011).
Controls
We elicit a financial literacy score based on participants' answers to six questions, of which three are pure knowledge questions and another three are related to financial numeracy. We select one of the basic questions from Lusardi and Mitchell (Reference Lusardi and Mitchell2007), two advanced questions from van Rooij et al. (Reference van Rooij, Lusardi and Alessie2011), one question from Schreiber and Weber (Reference Schreiber and Weber2016), one question from Lusardi and Tufano (Reference Lusardi and Tufano2009), and one question from Ensthaler et al. (Reference Ensthaler, Nottmeyer, Weizsäcker and Zankiewicz2018). The exact wording of the questions can be found in the Appendix. Following the suggestion of Behrman et al. (Reference Behrman, Mitchell, Soo and Bravo2012) and Fernandes et al. (Reference Fernandes, Lynch and Netemeyer2014), we also collect information on parents' and siblings' highest level of education as instruments for financial literacy not caused by financial behaviors.
To control for risk and loss aversion, we ask participants to rate their risk and loss attitude on a seven-point Likert scale (higher values correspond to higher risk/loss aversion). Earlier studies on risk taking find that self-reported risk attitude is a good predictor of actual risk taking (e.g., Nosic and Weber, Reference Nosic and Weber2010; van Rooij et al., Reference van Rooij, Lusardi and Alessie2011). Moreover, we also assess participants' trust in financial markets on a seven-point Likert scale (higher values correspond to more trust) as a proxy of participants' general willingness to invest in financial products.
3.2 Summary statistics
Table 1 presents summary statistics on participant demographics, life expectancy, financial literacy, and risk aversion. All income figures are at the household level.
Summary statistics
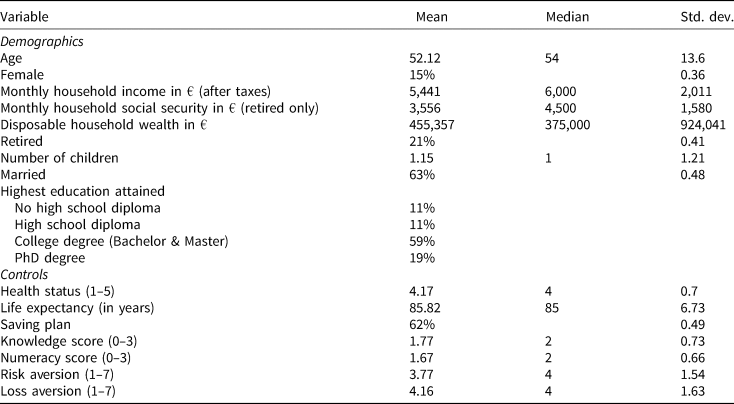
This table presents summary statistics of our survey. Included are all 3,598 participants. Statistics are split across two categories: demographics and controls. Reported are mean, median (whenever applicable), and standard deviation. Female, retired, married, and saving plan are dummy variables. For Health status, higher values correspond to a healthier status.
Source: Author's calculations.
The average age in our sample is 52.1 years (median 54). While this is higher compared to similar surveys of our kind (e.g., Merkle et al., Reference Merkle, Schreiber and Weber2017; or Müller and Weber, Reference Müller and Weber2014), it is well suited to study hypothetical retirement choices. Men are overrepresented in our study (85%), which reflects the fact that the majority of FAZ readers are male. Participants report a relatively high after-tax household income of about 5,440€ per month, compared to the German average of about 3,300€ (as reported by the German Federal Statistical Office). Additionally, participants report having Social Security benefits of roughly 3,556€ per month at the household level (retired participants only), and an average net worth of roughly 455,357€Footnote 9. They are well educated with about 78% having obtained a university degree. Around 21% are already retired, 63% are married, and participants have on average 1.15 children. We also asked respondents about their average life expectancy. While female participants expect to live on average 86.5 years, male participants expect to live on average 85.7 years. While these estimates are slightly higher than the average life expectancy implied by recent life tables for the respective cohort, this does not necessarily present evidence for an optimism bias, since our participants are on average wealthier and more educated which is positively correlated to life expectancy (Meara et al., Reference Meara, Richards and Cutler2008).
Participants correctly answer on average 1.77 of the knowledge questions and roughly 1.67 of the numeracy questions out of 3. Given the level of complexity of the questions, participants do quite good. Asking participants for their risk and loss aversion leads to an average of 3.77 and 4.16, respectively.
Overall, one should emphasize that our sample is most likely not representative of the general German population. However, it is highly representative to study wealth decumulation preferences for individuals who have the choice to decumulate a significant proportion of their accumulated savings.
4. Results
We present four set of findings: (1) observed choices and demographic correlates of phased withdrawal accounts, (2) a utility analysis for the demand of phased withdrawal accounts under a standard time-separable power utility function, (3) factors differentiating the demand for annuities vs. phased withdrawals, and (4) factors related to the decision of how much wealth one is willing to decumulate. In all subsequent analyses, we present results for our full sample. However, the conclusions we draw do not critically depend on this, as results are similar when restricting our analyses to individuals close to retirement age.
4.1 Preferences on the structure of phased withdrawal accounts
Figure 3 displays both the withdrawal strategies that participants prefer and the characteristics they deem important on an aggregate level (Panel A) and across age (Panel B).
Withdrawal strategy choice and characteristics. This figure displays participants' preferred withdrawal strategies and their rating of various decumulation attributes. Panel A displays the strategies and attributes for the whole sample, while Panel B displays the predictive margins with 95% confidence intervals from logit regressions on the plan choice or the respective characteristic for age.
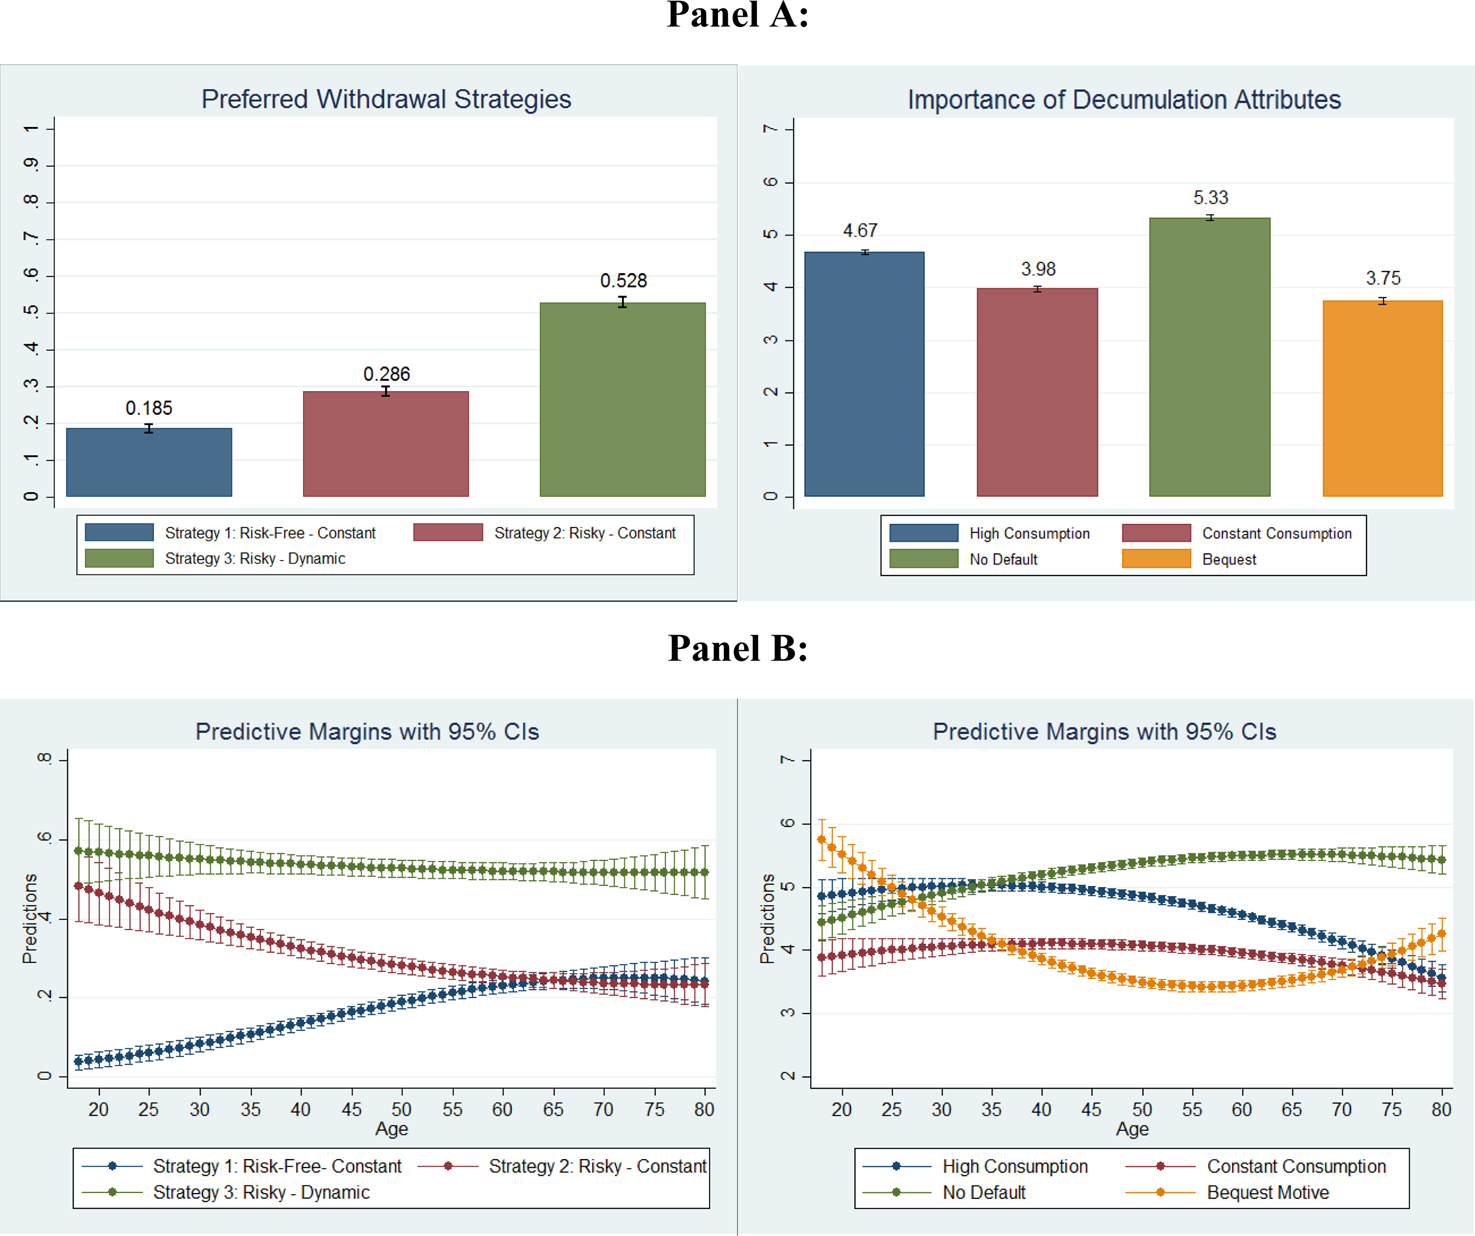
From Figure 3, it becomes evident that independent of age, the majority of participants prefer a withdrawal strategy with risky asset allocation and dynamic withdrawal rates. Given that many currently offered decumulation products (such as most lifelong annuities) involve constant income streams, this finding is quite surprising. However, it indicates that consumers are by no means averse to fluctuating income streams, assuming that they receive sufficient compensation in return. Regarding the strategies with constant withdrawals, we observe two opposing effects across different age groups. While the strategy with risk-free asset allocation is mostly preferred by participants who are close to retirement, it is hardly chosen by younger participants. Conversely, the strategy with constant withdrawals and risky asset allocation is popular among younger participants while it loses in popularity among those close to retirement. When looking at the assessed withdrawal characteristics, this pattern becomes even clearer. In particular, avoiding the risk of depleting the capital stock early gradually becomes the most desired characteristic as individuals approach retirement followed by the desire for a high average consumption. However, quite the reverse appears to hold for bequest motives. While younger participants list bequest motives among the most important characteristics, they are hardly relevant for those close to retirement and become more important again as participants approach later stages of their retirement. The latter relation is consistent with participants' declining demand for the strategy with risky asset allocation and constant withdrawals, which is the only strategy that might result in unintended bequests after the final period. Finally, a constant consumption stream in retirement is deemed rather unimportant by most participants, which is not only consistent with the dynamic withdrawal strategies participants choose but also further evidence for the demand for flexible decumulation options.
Besides the descriptive analysis, we also examine how cognitive abilities and demographic characteristics relate to the choice using multinomial logistic regressions. The dependent variable is strategy that takes on three values, which capture participants' preferred withdrawal strategy. The independent variables are knowledge, numeracy, the log of wealth, and various demographics. Results are reported in Table 2.
Demographic correlates
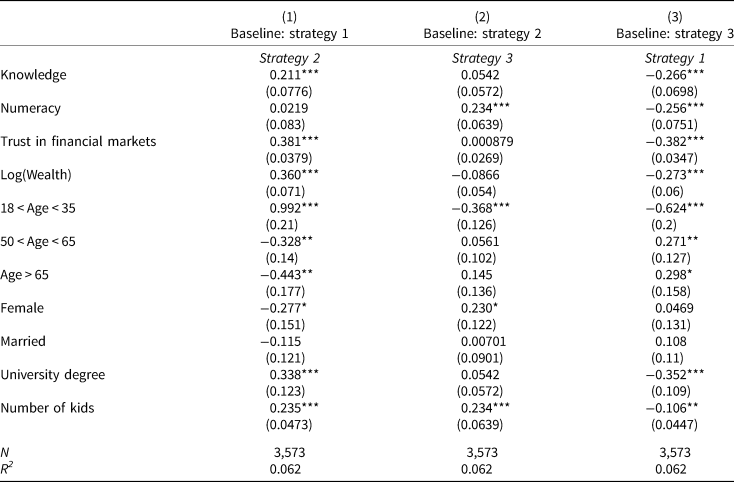
This table reports results of three multinomial logit regressions with varying baseline values. Dependent variable is Strategy, a categorical variable, which denotes participants' preferred withdrawal strategy (1–3). Age is captured by clustering participants in four age groups, with the medium category (between 36 and 49) as baseline. Financial Markets measures participants' self-reported trust in financial markets on a 1 (low trust) to 7 scale (high trust). Reported are coefficients and robust standard errors (in parentheses). Trust in ***, **, and * indicate significance at the 1%, 5%, and 10%-level, respectively.
Source: Author's calculations.
We can draw several conclusions from Table 2. First, it appears that the more financially savvy individuals are, the more likely they are to select an equity-based withdrawal strategy (i.e., Strategy 2 or 3). Similarly, the more trust individuals have in financial markets and the more educated they are (i.e., having at least a university degree), the more likely they are to select either the second or the third strategy. Yet, we also observe differences within the strategies, which invest in equities. That is, more statistically numerate individuals show a higher propensity to choose withdrawal strategies with dynamic withdrawal rates, both relative to the risk-free alternative and relative to the risky strategy with constant withdrawal rates. Taken together, these results imply that while financial education is positively related to a return-oriented investment behavior in retirement, it cannot explain whether investors prefer dynamic or constant payoff streams. Those individuals, however, who show – ceteris paribus – also a deeper understanding of financial mathematics and compound interest, are significantly more likely to choose dynamic payoff streams. Consistent with the findings from Bateman et al. (Reference Bateman, Eckert, Iskhakov, Louviere, Satchell and Thorp2018), basic financial literacy helps retirees to manage decumulation, but it is not sufficient for effective ruin risk management. Regarding the impact of demographics and household characteristics, we find a positive relationship between participants' accumulated wealth and their willingness to invest in equity products, with no significant difference between dynamic and constant withdrawal rates. Earlier studies find that wealthier individuals usually have a higher exposure to financial markets, are on average more sophisticated, and hold better diversified stock portfolios (e.g., Goetzmann and Kumar, Reference Goetzmann and Kumar2008). Our results suggest that their familiarity with equity investments also makes them more likely to favor a return-oriented asset allocation for wealth decumulation post retirement.
4.2 Utility analysis of phased withdrawal account choice
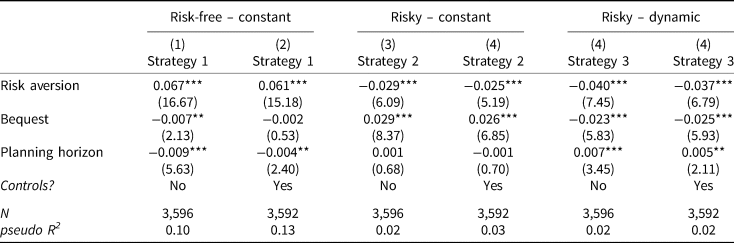
To test how well a time-separable power-utility function with bequest motives describes participants' actual choice behavior, we construct three dummy variables that indicate which of the three withdrawal strategies a participant prefers, which will be the dependent variables for our subsequent analyses. To match participants' actual choices with the predictions of our utility framework, we discretize their self-reported risk-aversion (1–7) and their self-reported bequest motive (1–7) into seven equally spaced points to fit the described intervals used for the utility simulations, i.e., γ ∈ [1, 10] and b ∈ [− 0.5, 2]. Since self-reported risk-aversion and bequest intentions are only noisy measures of the true parameter values, we also consider alternative limits for both intervals. To assign each participant a ‘best-choice’ prediction, we match the simulated utility-maximizing choices with our survey data based on the two described intervals and based on participants' chosen planning horizon. As a result, each participant is matched with a unique utility-maximizing choice that corresponds to her parameter triple (γ, b, T), which will serve as the main independent variable. Table 3 reports the marginal effects of five sets of probit regressions with participants' chosen decumulation strategy as dependent variable. Each specification represents a different interval over which parameters were linearized while the last specification represents a placebo-test, where participants were matched with random recommendations.
Utility analysis of account choice

This table reports the marginal effects of probit regressions. Dependent variables are indicator variables of participants' chosen withdrawal strategies. The main independent variables are indicator variables that denote whether our utility specification would recommend a participant to choose a specific strategy, based on self-reported risk-aversion, bequest intensity and planning horizon. Self-reported risk-aversion and bequest are linearized into a set of seven equally spaced points on the intervals denoted in the four specifications. Our full set of controls is included in every regression. Reported are coefficients and t-statistics. ***, **, and * indicate significance at the 1%, 5%, and 10%-level, respectively.
Source: Author's calculations.
Across all specifications, we reliably find that a time-separable power utility function with bequest motives successfully predicts preferences for the first and the third withdrawal strategy. For the risk-free strategy (Strategy 1), we find that when the utility functions predict the first strategy to be the optimal choice for a given participant, participants are on average between 11% and 19% more likely to also select this strategy. Similarly, for the strategy with dynamic withdrawal rates (Strategy 3), we find that participants are on average between 10% and 15% more likely to also select the strategy if the utility function would predict it to be the optimal choice. Yet, despite these consistent results, the employed utility function appears to struggle in predicting preferences for the strategy with constant withdrawal rates (Strategy 2), as reported in column (2). While the coefficients are not only economically small, they are also not statistically different from zero. One potential driver for this inconsistency is the relation with risk aversion. Instead of the positive relation implied by Figure 3, our data suggests the reverse.Footnote 10 In our sample, it appears that the more risk-averse participants are, the less likely they are to select a decumulation strategy with risky asset allocation and constant withdrawals. This is not entirely unexpected. Due to the nature of how the second strategy is constructed (constant withdrawals paired with stochastic returns), it cannot guarantee that wealth levels are always sufficient to sustain the withdrawal rate. While this strategy only defaults in about 1.2% of the time 5 years before the planning horizon, this risk increases to roughly 10% until the final year. Considering that most participants are highly averse to the prospect of defaulting before the planning horizon (most important characteristic across all age groups), this fear appears to be reflected in participants' self-reported risk aversion.
4.3 Determinants of participants' product choice
In this section, we investigate whether participants rather prefer a lifelong annuity or a phased withdrawal account. A summary of observed choices is provided in Figure 4.
Demand for phased withdrawals and annuities. This figure displays participants' choice between their preferred phased decumulation option and a lifelong annuity. Displayed are comparisons for the full sample and for each option individually. All differences are significant at the 1%-level.

Overall, we observe that only a small fraction of participants preferred an annuity over a phased withdrawal plan (12%). This result is more or less independent of the actual properties of the phased withdrawal account, although it is smaller for those participants who initially preferred the risk-free decumulation option (Strategy 1). While consistent with earlier results on the annuitization puzzle (in which participants rather prefer a lump sum payment), this finding provides a new perspective to the discussion. More precisely, it appears that individuals do not exhibit a general aversion to wealth decumulation but rather a specific aversion to invest in annuities.Footnote 11 Looking at the difference between the risk-free phased withdrawal account and the annuity, this aversion seems even more surprising. For any wealth level and any planning horizon except 20 years, the annuity in our study provides higher monthly payments than the risk-free decumulation option, which are not only indefinitely, but also guaranteed by an insurance provider. Conversely, the only benefit of selecting a completely risk-free phased withdrawal account comes in the form of retaining control over one's financial assets, which – depending on the situation – can fulfil both precautionary and bequest motives. Yet, even for this comparison, roughly 78% appear to favor a phased decumulation option.
Next, we investigate potential drivers of this discrepancy. Table 4 shows the results of regressing annuity (a dummy that equals one if participants would prefer an annuity to a phased decumulation product) on participants' self-reported life expectancy, trust in financial markets, financial literacy and a set of demographic variables. In columns (2) to (4), we shift the focus on the tradeoff between choosing an annuity vs. a specific phased withdrawal account, which a participant previously preferred. To differentiate the characteristics of the phased withdrawal accounts, we also include the self-reported importance of the four self-assessed withdrawal characteristics as additional explanatory variables.
Annuitization decision
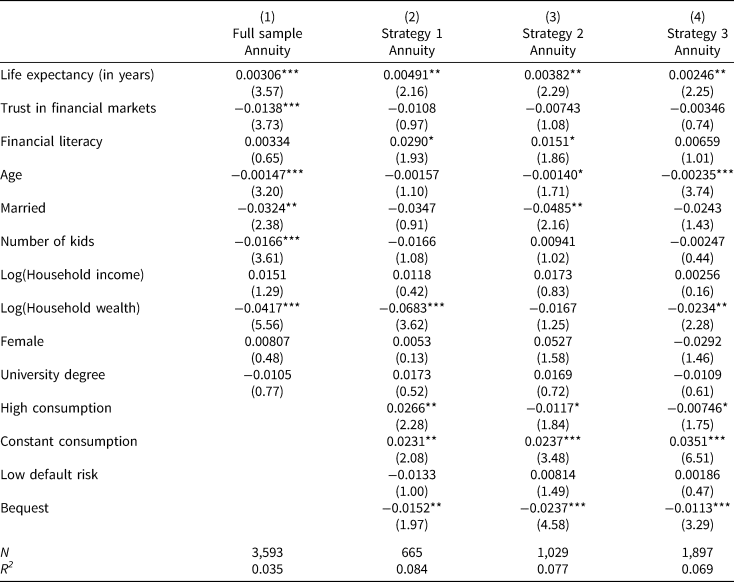
This table reports results of four OLS regressions. Dependent variable is Annuity, a dummy variable which equals one if a participant prefers an annuity over a phased withdrawal account. Column (1) looks at the full sample independent of the previously chosen phased withdrawal account, while columns (2)–(4) condition the analysis on the chosen phased withdrawal account. Trust in Financial Markets measures participants' self-reported trust in financial markets on a 1 (low trust) to 7 scale (high trust). Reported are coefficients and t-statistics (in parentheses). All standard errors are robust. ***, **, and * indicate significance at the 1%, 5% and 10%-level, respectively.
Source: Author's calculations.
Across all regressions, we collectively find that higher life expectancy is positively related to choosing an annuity over a phased withdrawal account. Given the fact that insurance against longevity risk is one of the primary benefits of annuities, this finding is not surprising and consistent with earlier studies (e.g., Beshears et al., Reference Beshears, Choi, Laibson, Madrian and Zeldes2014; Schreiber and Weber, Reference Schreiber and Weber2016). Relatedly, results in column (1) suggest that married individuals and the number of children are negative predictors of the annuitization decision. Looking at the individual differences between annuities and specific phased withdrawal strategies as reported in columns (2)–(4) provides further insights. First, we consistently find that bequest intentions are negatively related to the annuitization decision, independent of the phased withdrawal account participants have selected. The importance of bequest motives for the selection of wealth decumulation products does not come unexpectedly. Kotlikoff and Summers (Reference Kotlikoff and Summers1981) estimated that a large fraction of the US capital stock was attributable to intergenerational transfer. Similarly, Gale and Scholz (Reference Gale and Scholz1994) showed that both bequests and inter vivos transfers are common and can be sizeable. Second, we find that consumers who value constant income streams are significantly more likely to select an annuity despite having the option to choose a phased withdrawal account with constant withdrawals. Finally, and perhaps most interestingly, we find no effect of participants' desire for safe income streams on their product choice, independent of their preferred phased withdrawal account. In other words, even though ‘avoiding the risk of depleting the capital stock early’ ranks as the most important characteristic for phased withdrawals, investors seem to neglect that it is one of the primary benefits of annuities. While not entirely surprising for the first and the second phased withdrawal option, this is especially troublesome for the decumulation strategy with constant withdrawal amounts and risky asset allocation which exhibits a rather high risk of exhausting the withdrawal account before the end of life.
Finally, we also consider the possibility that investor sentiment might drive the low demand for annuities in our sample. Chalmers and Reuter (Reference Chalmers and Reuter2012) and Previtero (Reference Previtero2014) both document that past stock market returns have a strong effect on the demand for annuities, with high stock market returns generally reducing the demand for annuities. To account for the fact that past market conditions might drive the demand for equity investments, we investigate the 3-month and 12-month return of the DAX index prior to the release of our survey. Yet, even though both returns are positive (~1.6% and 4%, respectively), they are below their recent historic averages (2.1% and 8%, respectively). While we cannot fully rule out the possibility that participants falsely use recent market returns as a proxy for future returns, the mild economic conditions during our sample period would make the capital market investment appear rather less attractive instead of more attractive.
4.4 The wealth decumulation decision
In this section, we analyze respondents' general willingness to decumulate wealth. Figure 5 displays the average self-reported amount (in % of total liquid wealth) that participants would be willing to decumulate over the course of their retirement.
Willingness to decumulate retirement wealth. This figure displays participants' willingness about how much of their retirement wealth they would be willing to decumulate and how much they would keep as precautionary savings. Displayed are comparisons for the full sample and split by the product (phased withdrawal or annuity) they have previously chosen. *** indicates significance at the 1%-level.
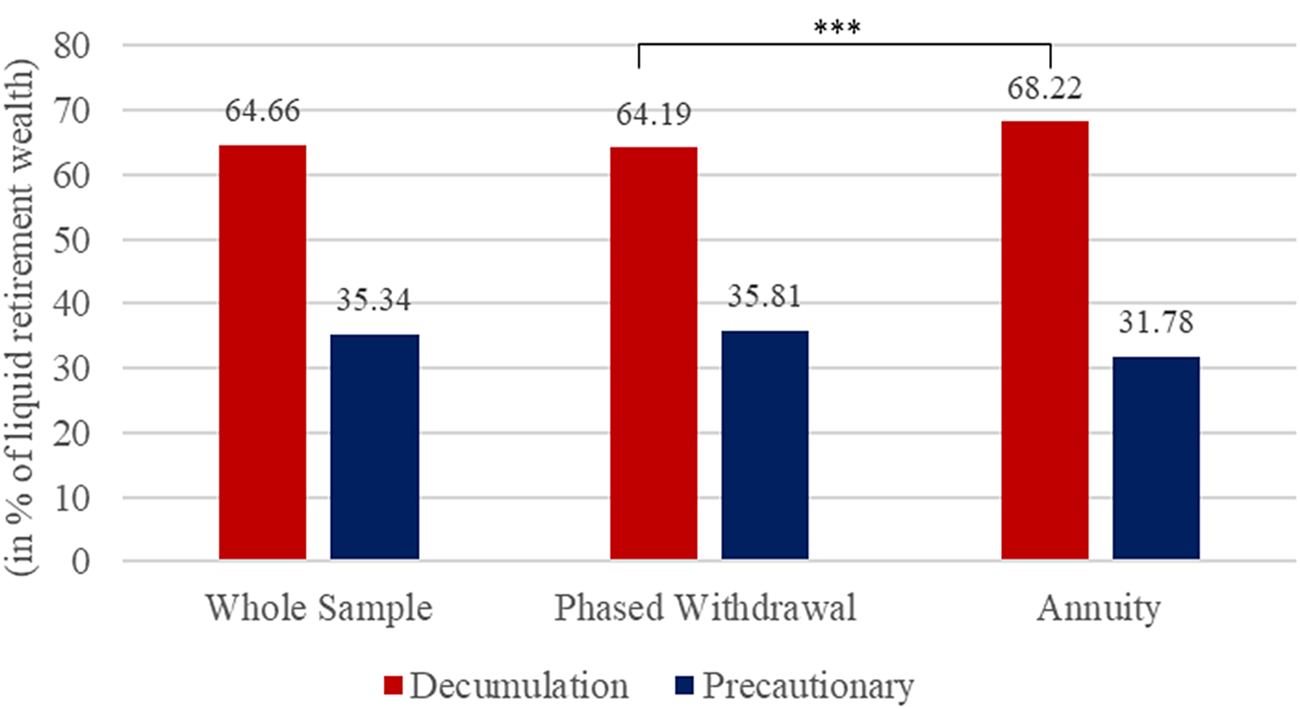
Overall, participants would be willing to draw down roughly 65% of their retirement savings while they would keep 35% as precautionary savings. Participants who prefer a lifelong annuity to a phased withdrawal would decumulate 68% of their savings, while those preferring a phased withdrawal account would decumulate 64% (t-statistic: 2.91, two-sided test). Yet, despite the rather high self-reported willingness to decumulate wealth, actual spending in retirement appears to be still moderately low (Olafsson and Pagel, Reference Olafsson and Pagel2018). Given that only 12% of the respondents in our sample would select an annuity to begin with, our results suggest that the difference between observed spending and self-reported willingness to spend is driven by the lack of demand for annuities and the desire for flexibility.
Next, we seek to obtain a more pronounced understanding of the factors that affect individuals' decision of how much wealth to decumulate. In analyzing this decision, we differentiate two sets of variables related to participants' retirement preparedness. First, we look at factors that are related so successful wealth accumulation (i.e., individuals' ‘financial’ preparedness). Second, we investigate factors which capture participants' attitude towards retirement (i.e., individuals' ‘emotional’ preparedness).
4.4.1 Financial preparedness and the wealth decumulation decision
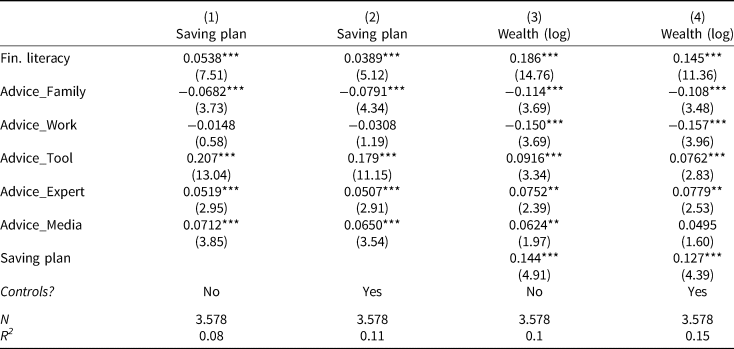
To identify factors related to successful wealth decumulation, we follow Lusardi and Mitchell (Reference Lusardi and Mitchell2007, Reference Lusardi and Mitchell2011). The authors find that both financial literacy and planning are strong predictors for financial wellbeing in retirement. In particular, it appears that those individuals who successfully develop and stick to a saving plan not only accumulate more wealth but also make better investment decisions. Additionally, the authors find that these individuals are also more likely to follow sound financial advice and less likely to follow investment recommendations from friends and family members. As such, we include a dummy variable that equals 1 if participants report sticking to a saving plan for their retirement, a measure of financial literacy, and dummy variables that indicate the source of financial advice participants use for their retirement planning.Footnote 12 Results of four OLS regressions with dissave as dependent variable are reported in Table 5.
Wealth decumulation: financial

This table reports results of four OLS regressions. Dependent variable is Dissave, which can take values between 0% and 100%. Main independent variables are Saving Plan (1 = participant follows a saving plan for retirement), Financial Literacy, and five dummy variables that indicate whether a participant follows financial advice of family members, work colleagues, planning tools, the media, or from financial planners. Reported are coefficients and t-statistics (in parentheses). All standard errors are robust. ***, **, and * indicate significance at the 1%, 5%, and 10%-level, respectively. We control for socio-demographic variables and household composition whenever indicated.
Source: Author's calculations.
Based on the results of Table 5, we can draw several conclusions. First, those participants who report sticking to a saving plan to save for retirement show a weak tendency to decumulate a greater fraction of their accumulated savings, even after control for wealth. However, the effect is both economically small and statistically only marginally significant. Looking at other indicators of successful wealth accumulation, this relation even appears to vanish entirely. While financial literacy is a highly significant and positive predictor of wealth accumulation (both in our sample and in previous studies; see for example Behrman et al., Reference Behrman, Mitchell, Soo and Bravo2012), it does not appear to be related to wealth decumulation. Similar results can be found by looking at the source of financial advice participants take. While we observe a weak negative effect for those people who take advice from their family and a weak positive effect for those who use spreadsheets and similar planning tools, none of the effects is statistically significant at the 10%-level. One potential reason for this seemingly non-existent relationship might be that wealth decumulation – in contrast to saving and investment decisions – is still a relatively new and unexplored topic for the broad population and even for most financial institutions besides insurance companies. As such, there is relatively little guidance for consumers about how (if at all) wealth should be decumulated.
4.4.2 Emotional preparedness and the wealth decumulation decision
To capture participants' attitudes towards retirement (i.e., their ‘emotional’ preparedness), we include both a measure of optimism and the planning horizon over which they would want to decumulate their wealth. With our measure of optimism, we seek to capture the fact that consumers cannot rely on their experience when evaluating how much of their wealth they would be willing to decumulate. According to Puri and Robinson (Reference Puri and Robinson2007), these are the decisions which are most affected by attitudes and emotional dispositions as there is no available data on which to base an opinion. Following Puri and Robinson (Reference Puri and Robinson2007), optimism was measured as the difference between participants' self-reported life expectancy and that implied by statistical tables, adjusted for gender. To differentiate moderate optimism from extreme optimism, we take the right-most 5% of optimists to be extreme optimists.Footnote 13 Including participants' planning horizon allows us to control for participants' outlook on their retirement, which is not caused by optimism (i.e., information about their health status, general longevity in their family, or aversion to the prospect of outliving their retirement resources). Yet, longer planning horizons are likely to have diverse implications for individuals who prefer phased withdrawals over annuities or vice versa. For individuals who prefer phased withdrawals, longer planning horizons should be associated with a decreased willingness to decumulate greater amounts, as there is no protection against longevity risk. Conversely, for those preferring annuities, one should expect that longer planning horizons increase the willingness to decumulate greater amounts, as predicted by Yaari (Reference Yaari1965) or Davidoff et al. (Reference Davidoff, Brown and Diamond2005). Additionally, both optimism and participants' planning horizon are likely correlated to their bequest motive (e.g., Ameriks et al., Reference Ameriks, Caplin, Laufer and Van Nieuwerburgh2011). Following this logic, we include both our regular measure of optimism, a dummy variable for extreme optimists, participants' bequest motive, their planning horizon, a dummy for preferring annuities over phased withdrawals and an interaction between the last two. Results are reported in Table 6.
Wealth decumulation: emotional
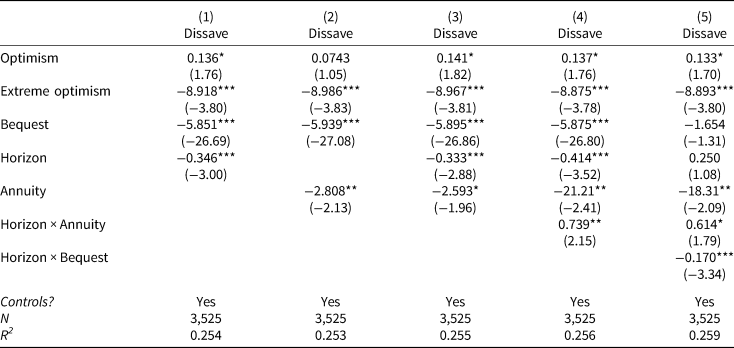
This table reports results of four OLS regressions. Dependent variable is Dissave, a categorical variable, which can take values between 0% and 100%. Main independent variables are optimism and extreme_optimism, which were constructed following Puri and Robinson (Reference Puri and Robinson2007). Reported are coefficients and t-statistics (in parentheses). All standard errors are robust. ***, **, and * indicate significance at the 1%, 5% and 10%-level, respectively. We control for socio-demographic variables and household composition whenever indicated.
Source: Author's calculations.
We find that the tendency to plan for a longer retirement is negatively related to the wealth decumulation decision for participants preferring phased withdrawals while having a positive impact for those preferring annuities. In the absence of a significant proportion of annuitized wealth, households must decide which fraction of their savings they decumulate and how much they keep as precautionary savings. The longer they expect to live (or the more averse they are to the prospect of outliving their resources), the more precautionary savings they should build. Conversely, participants interested in annuities have no incentive to keep large precautionary savings in response to longer planning horizons. In particular, the longer one expects to live, the higher are the benefits from livelong pension payments and the more beneficial it becomes to drawdown a greater fraction of one's savings (while keeping smaller precautionary savings as protection against adverse health shocks). Additionally, participants' self-reported bequest intentions are a strong negative predictor of the wealth they would be willing to decumulate. Interestingly however, this relation strongly depends on their planning horizon and is most pronounced for long horizons. While our survey does not allow us to strictly disentangle strategic bequest motives (e.g., caused by public care aversion) from intentional bequest motives, this interaction rather points towards the former explanation, supporting the findings of Ameriks et al. (Reference Ameriks, Caplin, Laufer and Van Nieuwerburgh2011).
Regarding the impact of optimism, we find that moderate optimism is positively related to wealth decumulation. This finding is in line with the view that optimism is generally correlated with positive beliefs about future economic conditions, as postulated by Puri and Robinson (Reference Puri and Robinson2007). As such, more optimistic individuals appear to be attracted by the prospect of a higher consumption during retirement without worrying too much about the state of their precautionary savings. In our sample, more optimistic individuals are willing to decumulate roughly 4% more of their savings compared to rather pessimistic individuals (as defined by being one standard deviation away from the mean). While this difference is hardly decisive for living retirement in luxury or in poverty, it might benefit those retirees who systematically overestimate their life expectancy (Heimer et al., Reference Heimer, Myrseth and Schoenle2019). Yet, similar to earlier findings on optimism, we report strikingly different results for individuals who are overly optimistic. In particular, instead of moderately increasing their consumption, extreme optimists decumulate between 2% and 5% less than the average participant. The implications of this finding might hint at an inherent misunderstanding of how to protect against longevity risk. Given that extremely optimistic individuals overestimate their life expectancy by roughly 20–30 years, a 2% to 5% increase in precautionary savings is barely relevant to sustain their financial needs until the age of 105 years. Instead, those individuals would benefit most by annuitizing an even greater fraction of their accumulated savings.
Taken together, our results on optimism are largely consistent with findings from Brunnermeier and Parker (Reference Brunnermeier and Parker2005). In their model, forward-looking agents who believe that better outcomes are more likely, are more inclined to take ex-post optimal actions that others might find too costly ex-ante. Overly optimistic agents, however, neglect the benefit of those actions and instead perceive future income as too certain. Similarly, our findings imply that moderately optimistic individuals decumulate a greater fraction of their wealth to either increase their wellbeing over a shorter horizon (through phased withdrawals or immediate consumption) or over a longer horizon (through annuities). Extreme optimists – however – decumulate a smaller fraction of their wealth possibly to protect against longevity risk and as such neglect the uncertainty in their life expectancy and overestimate their income from non-annuitized wealth.
5. Conclusion
The goal of this study has been to obtain a more holistic understanding of the wealth decumulation decision from the perspective of an individual who is averse to fully annuitizing her accumulated savings in retirement. Such an individual faces the following decision problem. Out of her non-annuitized wealth, she must decide how much to allocate to a savings account (i.e., as a protection against unexpected costs) and how much (if anything) to decumulate over the course of her retirement. As an alternative way to decumulate savings, we investigate preferences for phased withdrawal products by fielding a large online survey.
Our results have several implications for the design and the demand for complementary products. In our sample, annuity demand is still relatively low, as only 12% of respondents would prefer a lifelong annuity to decumulate savings, while 88% would prefer some form of phased withdrawal. Offering a wider array of phased withdrawal solutions would help retirees to decumulate more of their savings, without being forced to fully convert their wealth. As flexibility in the timing of spending is among the most important factors of the annuitization decision (Beshears et al., Reference Beshears, Choi, Laibson, Madrian and Zeldes2014), offering combined solutions of phased withdrawals and partial annuitization could help to increase overall retirement welfare while protecting retirees against longevity risk. Yet, finding the optimal mix of phased withdrawals and annuitization remains a significant challenge.
Regarding the concrete design of phased withdrawal products, our results suggest that even in retirement most people are willing to invest in equities to sustain higher withdrawal rates. Additionally, the majority of respondents would choose a product with dynamic withdrawal rates. Given the current standard of constant payout policies (e.g., as offered by most annuity contracts), our findings highlight once more the importance and the demand for more flexible retirement solutions. Although similar proposals exist in the variable annuity market (e.g., penalty-free early withdrawals, or flexible payout streams), annuities face much higher hurdles to implement such suggestions due to adverse selection, which eventually increases product complexity for consumers.
Appendix
Part A: simulation outcomes of phased withdrawal strategies
This figure displays the average withdrawal amount of all phased withdrawal strategies as percentage of initial capital for an exemplary planning horizon of 30 years.

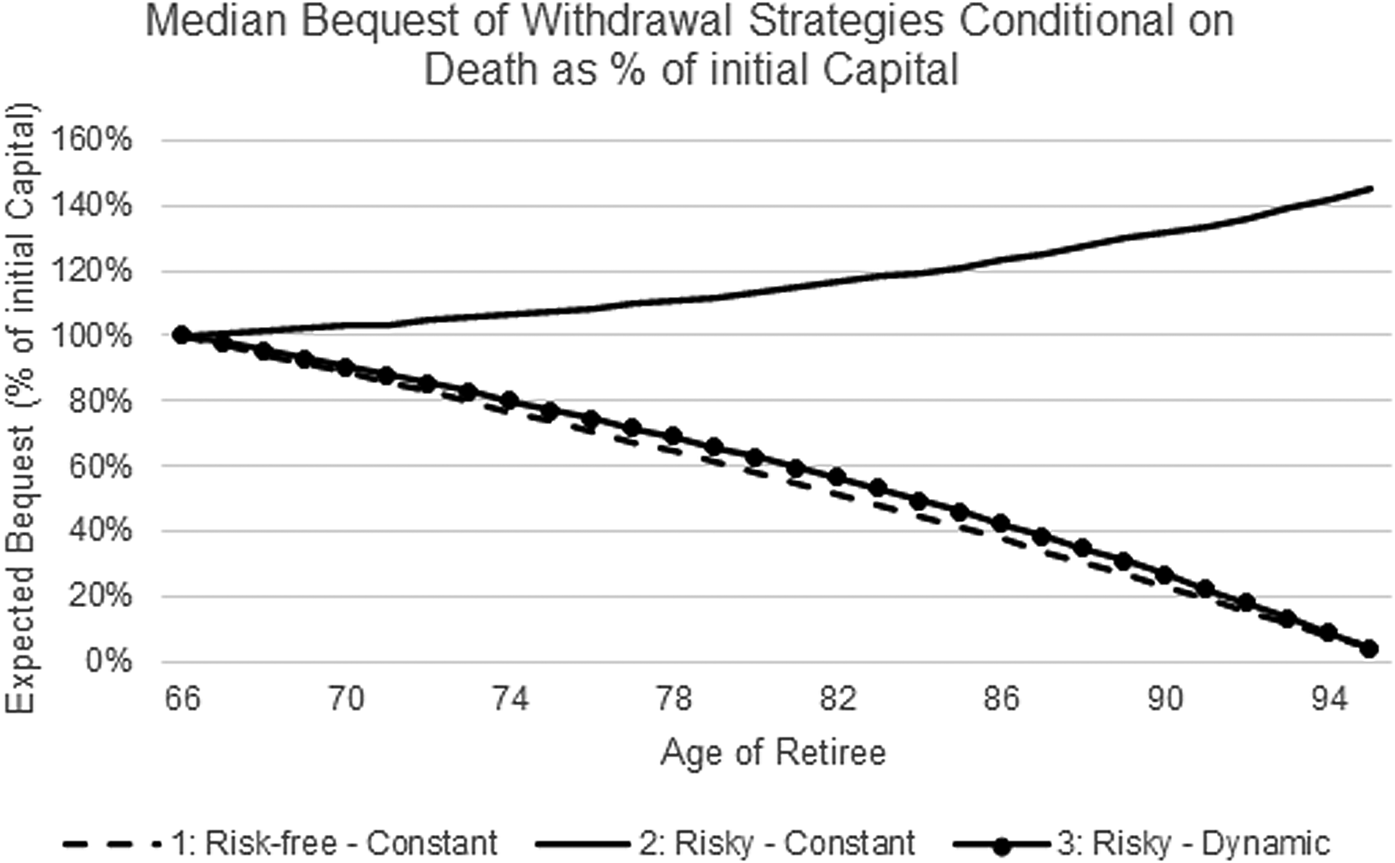
This figure displays the median bequest amount of all phased withdrawal strategies as percentage of initial capital conditional on survival for an exemplary planning horizon of 30 years.
Part B: survey instructions and screenshots
Welcome Instructions
Dear participant,
On the following pages, you will find a survey of the University of Mannheim in cooperation with FAZ.NET. The survey covers topics on retirement planning. In particular, it deals with the question of how to convert our savings into a steady stream of income once we enter retirement, in order to increase our standard of living.
Please note that the survey takes some time (approx. 15 minutes). Also, note that you might encounter questions that require some time to answer (just as your retirement planning!).
In return, we will present you different ways on how to convert your savings into a steady stream of income. Should you be interested in further results, we will gladly send you a summary of the main results after the completion of the study via email.
In addition, we are giving away ten Behavioral Finance volumes on the subject ‘Entsparen im Alter – Portfolioentnahmestrategien in der Rentenphase’ by Prof. Dr. Dr. h.c. Martin Weber from the University of Mannheim. All data collected here is anonymous and exclusively used for research purposes.
We are looking forward to your participation!
Financial Literacy Questions
(1) Do you think the following statement is true or false?
‘Buying a single company's stock usually provides a safer return than a stock mutual fund’.
(i) The statement is true
(ii) The statement is false
(iii) Do not know/Refuse to answer
(2) If the interest rate falls, what should happen to bond prices?
(i) Rise
(ii) Stay the same
(iii) Fall
(iv) None of the above
(v) Do not know/Refuse to answer
(3) Consider a call-option with a stock as underlying. Please judge the following statement:
‘The price of the call-option should increase if the volatility of the underlying stock increases.’
(i) The statement is true
(ii) The Statement is false
(iii) The statement can't be judged with the information given
(iv) Do not know/Refuse to answer
(4) Suppose you have 100€ in a savings account and the interest rate is 4% per year and you never withdraw money or interest payments. After 10 years, how much would you have in this account in total?
(i) More than 140€
(ii) Exactly 140€
(iii) Less than 140€
(iv) Do not know/Refuse to answer
(5) Suppose you owe 3,000€ on your credit card. You pay a minimum payment of 30€ each month. At an annual percentage rate of 12% (or 1% per month), how many years would it take to eliminate your credit card debt if you made no additional new charges?
(i) Less than 5 years
(ii) Between 5 and 10 years
(iii) Between 10 and 15 years
(iv) Never
(v) Do not know/Refuse to answer
(6) A very volatile asset either increases in value by 70% or decreases in value by 60% in every period, each growth rate realizing with a change of one half. If the investor buys the asset she must hold it for 12 periods. With an initial value of 10,000 what would the asset likely be worth at the end of period 12?
(i) Up to 6,400
(ii) Between 6,400 and 12,800
(iii) Between 12,800 and 19,200
(iv) Between 19,200 and 25,600
(v) Above 25,600
(vi) Do not know/Refuse to answer
Description and display of the phased withdrawal strategies

Description and display of the lifelong annuity

Self-reported importance of various retirement characteristics
Please rate the following statements on a scale from 1 (not very important) to 7 (very important)
(1) ‘How important are high withdrawal rates for you?’
(2) ‘How important is it for you that the withdrawal amount remains constant over time?’
(3) ‘How important are withdrawals which cannot deplete the capital stock early?’
(4) ‘How important are bequests for you?’
Which factors not previously mentioned affected your choice?
Would you say your current health status is…
(i) Very good; (ii) Good; (iii) Medium; (iv) Rather bad; (v) Very Bad
If you think about it, to what age do you expect to live?
Please tell us about the ways you tried to figure out how much your household would need for retirement.
(i) Did you talk to family and relatives?
(ii) Did you talk to co-workers or friends?
(iii) Did you use calculators or worksheets that are computer or Internet-based?
(iv) Did you consult a financial planner or advisor or an accountant?
(v) Did you follow advice received from the media?
Have you ever tried to figure out how much your household would need to save for retirement?
Do you work in the financial industry or do you have an education in a financial domain?
Part C: additional analyses
Utility analysis with self-reported measures
Financial planning and wealth accumulation


 Open access