


1. Introduction
According to standard macroeconomic models, consumers’ expectations are a key element of the monetary transmission mechanism. Especially in recent years, with nominal interest rates close to zero, the role of inflation expectations for the transmission of monetary policy has received a substantial amount of attention. According to this expected inflation channel, the expected real interest rate still responds to changes in expected inflation in line with the Fisher effect, even if nominal rates are close to the zero lower bound (ZLB). And if consumers’ spending decisions are influenced by the expected real interest rate, as suggested by the Euler equation, a monetary expansion that gives rise to an increase in expected inflation should be able to boost consumption spending.
Several empirical papers analyze the relationship between expected inflation and consumers’ consumption decisions. Bachmann et al. (Reference Bachmann, Berg and Sims2015) use data on inflation expectations and consumers’ readiness to spend from the Michigan Survey and find either an insignificant or a negative effect of higher inflation expectations on readiness to spend. Binder (Reference Binder2017) takes inflation uncertainty into account and reports similar results. Burke and Ozdagli (Reference Burke and Ozdagli2021) conclude that higher expected inflation is associated with higher spending on durables for some demographic groups, while nondurable spending remains unchanged. For Japan, Ichiue and Nishiguchi (Reference Ichiue and Nishiguchi2015) find that survey respondents with higher inflation expectations also indicate higher spending. Dräger and Nghiem (Reference Dräger and Nghiem2021) find a positive effect of expected inflation on spending of German households and conclude that consumption decisions are formed in line with an Euler equation. Duca-Radu et al. (Reference Duca-Radu, Kenny and Reuter2021) use survey data from euro area countries and find that the anticipation of higher inflation is associated with an increase in consumption, especially during the ZLB period. Using Italian survey data, Rondinelli and Zizza (Reference Rondinelli and Zizza2020) find that households increase spending in high-inflation environments and reduce spending in low-inflation environments, which characterized the Italian economy after the global financial crisis. Coibion et al. (Reference Coibion, Gorodnichenko and Weber2022b) use a randomized control trial with Dutch households and find that higher inflation expectations are associated with a negative effect on durable spending. Using a similar approach and US household data, Coibion et al. (Reference Coibion, Georgarakos, Gorodnichenko and van Rooij2022a) find that households with higher inflation expectations tend to raise the consumption of nondurable goods and reduce spending on durables. D’Acunto et al. (Reference D’Acunto, Hoang and Weber2021) find that although unconventional fiscal policy influences households’ inflation expectations and spending plans, forward guidance does not (see also D’Acunto et al. (Reference D’Acunto, Hoang and Weber2018)). Overall, the empirical evidence on how inflation expectations affect spending is mixed.
In this paper, we contribute to this debate by exploring how expected inflation and readiness to spend jointly respond to monetary policy shocks. In contrast to the existing literature, which mainly estimates the effect of expected inflation on consumption more generally, we study the role of inflation expectations specifically as an element of the monetary policy transmission mechanism.Footnote 1
We use Bayesian methods to estimate a structural vector-autoregressive (VAR) model with US macroeconomic data and measures of changes in consumers’ readiness to spend on durable consumption, conditional on inflation expectations, which we construct based on individual-level survey responses from the University of Michigan’s Surveys of Consumers (Michigan Survey). To identify exogenous monetary policy shocks, we use high-frequency interest rate changes around FOMC announcements as in Gertler and Karadi (Reference Gertler and Karadi2015).Footnote 2 Since these changes are measured within a narrow window around the announcements, they should only reflect the surprise element associated with the announcement (see e.g. Kuttner (Reference Kuttner2001); Gürkaynak et al. (Reference Gürkaynak, Sack and Swanson2005); Jarocinski and Karadi (Reference Jarocinski and Karadi2020)).
While most of the existing literature studies the unconditional relationship between readiness to spend and expected inflation, the dynamics of these two variables are jointly driven by the exogenous policy shock in our analysis. Thus, our focus on monetary policy is not only of particular relevance from a policy perspective but also allows for a structural interpretation. The unconditional relationship between consumers’ readiness to spend and expected inflation is plausibly driven by a number of different shocks, and since the relationship may vary across shocks, it is not clear to what extent results based on unconditional relationships are informative about the effects of monetary policy.Footnote 3 In addition, the VAR approach allows us to study dynamic effects, and we are therefore able to capture the potentially slow and non-monotonic adjustment of expectations in the aftermath of monetary policy shocks, which complements the existing microeconomic evidence.Footnote 4
Consumers may respond differently to unconventional policy measures, which were predominately used to implement monetary policy at the ZLB, and expected inflation may play a more prominent role in an environment with persistently low nominal interest rates. Therefore, we study to what degree the relationship between expected inflation and readiness to spend changed at the ZLB as in Bachmann et al. (Reference Bachmann, Berg and Sims2015) and Duca-Radu et al. (Reference Duca-Radu, Kenny and Reuter2021).
We find that outside the ZLB, an expansionary monetary policy shock induces survey respondents to indicate a higher readiness to spend conditional on higher expected inflation. Although qualitatively consistent with standard theoretical concepts such as the Euler equation and the Fisher equation, the effect is small. We also find that the share of survey respondents who expect lower inflation and indicate a lower readiness to spend increases in response to the expansionary shock. While the revision on readiness to spend is consistent with the revised inflation outlook in this case, these respondents do not update their inflation expectations in line with the expected inflation channel, which is based on the assumption that expansionary shocks increase expected inflation.
When the economy operates at the ZLB, survey respondents tend to reduce their readiness to spend, if they expect higher inflation. Although this effect is also small and less precisely estimated, it is at odds with the expected inflation channel. When we take into account respondents’ demographic characteristics, we find only small differences in how inflation expectations and readiness to spend are updated in response to policy shocks. Overall, our analysis suggests that the expected inflation channel is unlikely to play a prominent role for the transmission of monetary policy and may even give rise to counteracting effects at the ZLB.
The remainder of the paper is structured as follows: Section 2 describes the survey data and Section 3 discusses the empirical methodology. Section 4 presents the main results. In Section 5, we provide a number of robustness checks, and Section 6 concludes the paper.
2. Survey data
We use survey data from the Michigan Survey. As of 1978, the Survey Research Center at the University of Michigan conducts approximately 500 telephone interviews with randomly selected persons at a monthly frequency. While the majority of respondents is only interviewed once, approximately 40% of the respondents are interviewed a second time 6 months after the initial interview.Footnote 5 The random selection of households is designed so that the sample should be representative for the US population.
The Michigan Survey contains quantitative as well as qualitative questions. For expected inflation, we use answers to the following two questions:
(A12) “During the next 12 months, do you think that prices in general will go up, or go down, or stay where they are now? (A12b) By about what percent do you expect prices to go (up/down) on the average, during the next 12 months?”
And to infer respondents’ readiness to spend concerning durable consumption goods, we use the following question:
(A18) “About the big things people buy for their homes – such as furniture, a refrigerator, stove, television, and things like that. Generally speaking, do you think now is a good or bad time for people to buy major household items?”
To include the survey data in the VAR analysis, we aggregate the data in a way that allows us to characterize the joint behavior of inflation expectations and consumers’ readiness to spend. If higher expected inflation has a stimulating effect in line with the expected inflation channel, then for those survey respondents who expect higher inflation, the incidence of a higher readiness to spend should increase and the incidence of a lower readiness to spend should decline. In other words, the share of respondents who indicate that they expect inflation to rise and at the same time indicate a higher readiness to spend, which we denote by $\text{Share(INFEX+,RTS+)}$
, should increase relative to the share of respondents who expect higher inflation, but have a lower readiness to spend,
$\text{Share(INFEX+,RTS+)}$
, should increase relative to the share of respondents who expect higher inflation, but have a lower readiness to spend, $\text{Share(INFEX}+,\text{RTS}{-})$
. Using these shares, we construct the following measure of conditional readiness to spend (CRTS) conditional on higher expected inflation:Footnote
6
$\text{Share(INFEX}+,\text{RTS}{-})$
. Using these shares, we construct the following measure of conditional readiness to spend (CRTS) conditional on higher expected inflation:Footnote
6
 \begin{equation} \text{CRTS}({+})=\text{Share(INFEX+,RTS+)} - \text{Share(INFEX}+,\text{RTS}{-}). \end{equation}
Analogously to equation (1), we calculate a similar measure for respondents’ readiness to spend conditional on lower expected inflation:
 \begin{equation} \text{CRTS}({-})=\text{Share(INFEX}-,\text{RTS}{-}) - \text{Share(INFEX}-,\text{RTS+)}. \end{equation}
Increases in these measures in response to a policy shock, regardless of the sign of the shock, suggest that inflation expectations and readiness to spend are updated in a way that is consistent with standard theoretical predictions. In other words, higher (lower) expected inflation coincides with higher (lower) readiness to spend in the aftermath of the shock. In addition, the expected inflation channel holds that expansionary monetary policy stimulates consumption through an increase in expected inflation and contractionary shocks result in a downward revision of expected inflation. Thus, the expected inflation channel predicts that $\text{CRTS}({+})$
increases in response to an expansionary policy shock and that
$\text{CRTS}({+})$
increases in response to an expansionary policy shock and that $\text{CRTS}({-})$
declines.
$\text{CRTS}({-})$
declines.
Since survey respondents provide quantitative inflation forecasts, we transform the quantitative inflation expectation into an ordinal measure, which indicates whether the expected inflation rate goes down, remains constant, or goes up, before we calculate the shares and the CRTS measures. To do so, we subtract the past realized inflation rate of the consumer price index (CPI) from the inflation rate forecast, which is provided in integers. The past realized inflation rate is calculated as the 12-month backward-looking moving average up to period $t-1$
.Footnote
7
We round the resulting difference to the nearest integer, and the sign of the difference indicates the expected direction of change (see Carvalho and Nechio (Reference Carvalho and Nechio2014); Dräger et al. (Reference Dräger, Lamla and Pfajfar2016); Geiger and Scharler (Reference Geiger and Scharler2021)). If the rounded difference is equal to zero, the respondent is classified as expecting constant inflation.
$t-1$
.Footnote
7
We round the resulting difference to the nearest integer, and the sign of the difference indicates the expected direction of change (see Carvalho and Nechio (Reference Carvalho and Nechio2014); Dräger et al. (Reference Dräger, Lamla and Pfajfar2016); Geiger and Scharler (Reference Geiger and Scharler2021)). If the rounded difference is equal to zero, the respondent is classified as expecting constant inflation.
Time series plots of survey and conditional readiness to spend measures (1991M2-2019M6).
Notes: Shaded areas indicate economic downturns as classified by the NBER Business Cycle Dating Committee.
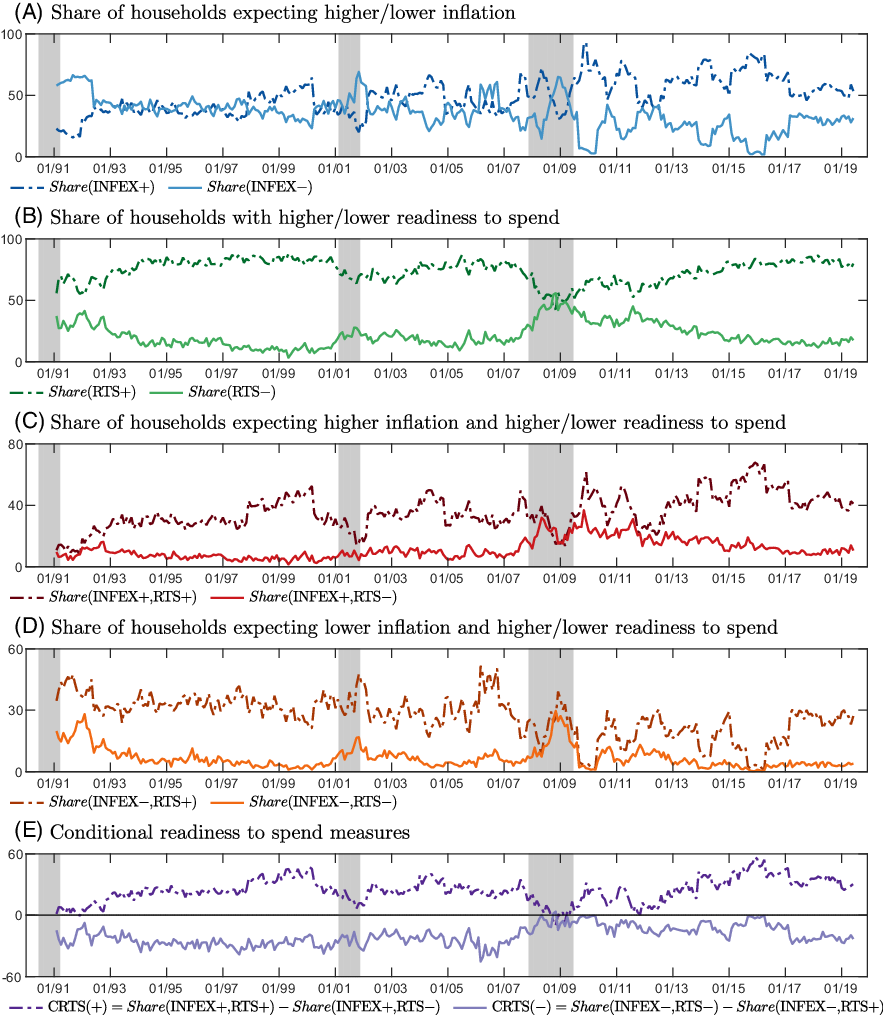
In Figure 1, we plot the shares of respondents grouped according to expected inflation and their readiness to spend in Panels (A) to (D), as well as the CRTS measures in Panel (E). Shaded areas indicate NBER recessions.
We see from Panel (C) that conditional on higher expected inflation, relatively more respondents indicate a higher readiness to spend, on average. While $\text{Share(INFEX+,RTS+)}$
is approximately 33% on average,
$\text{Share(INFEX+,RTS+)}$
is approximately 33% on average, $\text{Share(INFEX}+,\text{RTS}{-})$
is on average only about 11%.Footnote
8
Consequently,
$\text{Share(INFEX}+,\text{RTS}{-})$
is on average only about 11%.Footnote
8
Consequently, $\text{CRTS(+)}$
in Panel (D) is positive for most of the sample.
$\text{CRTS(+)}$
in Panel (D) is positive for most of the sample. $\text{Share(INFEX}-,\text{RTS+)}$
typically exceeds
$\text{Share(INFEX}-,\text{RTS+)}$
typically exceeds $\text{Share(INFEX}-,\text{RTS}{-})$
, 30% versus 9% on average, and
$\text{Share(INFEX}-,\text{RTS}{-})$
, 30% versus 9% on average, and $\text{CRTS}({-})$
is negative during most of the sample. Thus, lower inflation expectations are associated with a higher readiness to spend in general. We also see that
$\text{CRTS}({-})$
is negative during most of the sample. Thus, lower inflation expectations are associated with a higher readiness to spend in general. We also see that $\text{Share(INFEX+,RTS+)}$
tends to decline and
$\text{Share(INFEX+,RTS+)}$
tends to decline and $\text{Share(INFEX}-,\text{RTS}{-})$
tends to increase during the onset of recessions. Although the patterns are less clear for
$\text{Share(INFEX}-,\text{RTS}{-})$
tends to increase during the onset of recessions. Although the patterns are less clear for $\text{Share(INFEX+,RTS}{-})$
and
$\text{Share(INFEX+,RTS}{-})$
and $\text{Share(INFEX}-,\text{RTS+)}$
,
$\text{Share(INFEX}-,\text{RTS+)}$
, $\text{CRTS(+)}$
tends to drop during recessions while
$\text{CRTS(+)}$
tends to drop during recessions while $\text{CRTS}({-})$
rises.
$\text{CRTS}({-})$
rises.
While these observations suggest that inflation expectations may be related to how consumers update their readiness to spend in general, we now turn to the structural analysis to study how inflation expectations and readiness to spend respond jointly to monetary policy announcements.
3. Estimation
We estimate reduced-form VAR models of the type:
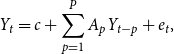 \begin{equation} Y_{t}=c+\sum _{p=1}^{P}A_{p}Y_{t-p} + e_{t}, \end{equation}
where $Y_t$
is the vector of endogenous variables,
$Y_t$
is the vector of endogenous variables, $A_p$
is the coefficient matrix at lag
$A_p$
is the coefficient matrix at lag $p$
,
$p$
, $c$
is a vector of constants, and
$c$
is a vector of constants, and $e_t\sim N(0,\Sigma )$
is a vector of white noise residuals. As it is standard when using monthly data, we set
$e_t\sim N(0,\Sigma )$
is a vector of white noise residuals. As it is standard when using monthly data, we set $P=12$
(see e.g. Jarocinski and Karadi (Reference Jarocinski and Karadi2020)).
$P=12$
(see e.g. Jarocinski and Karadi (Reference Jarocinski and Karadi2020)).
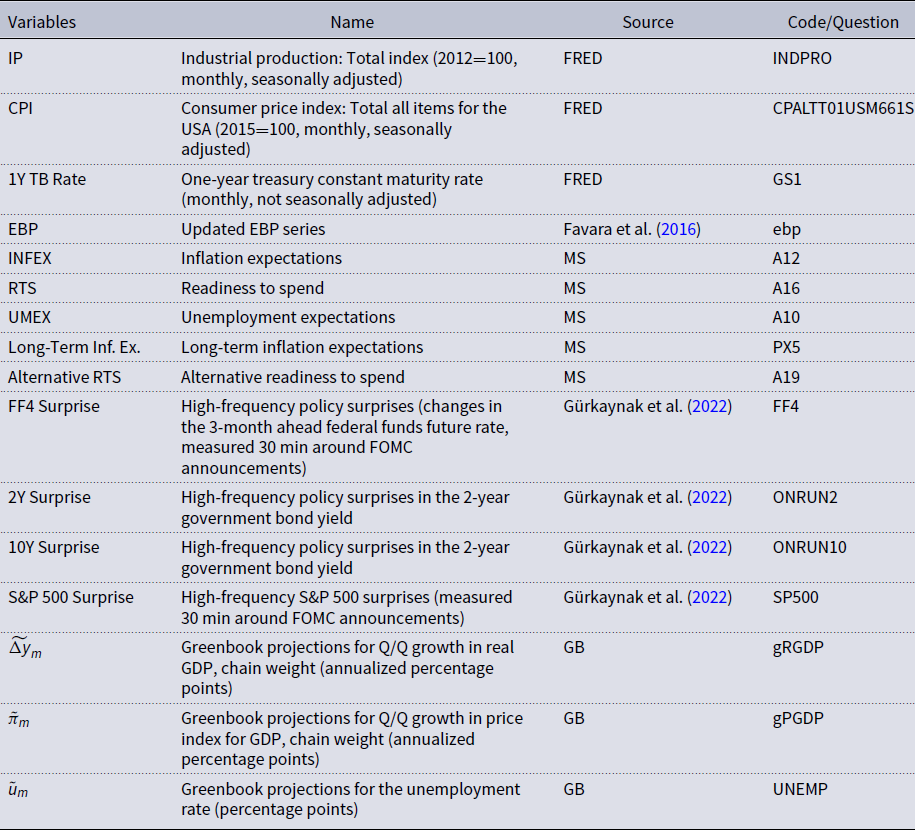
The vector of endogenous variables includes industrial production (IP), the CPI, the 1-year treasury bill rate (1Y TB Rate), which we obtain from the FRED database, the excess bond premium (EBP) from Gilchrist and Zakrajsek (Reference Gilchrist and Zakrajsek2012) as a proxy for financial market tensions (Caldara and Herbst (Reference Caldara and Herbst2019)), the high-frequency change in the 3-month ahead futures rate that occurs between 10 min before and 20 min after the FOMC announcement, as in Gertler and Karadi (Reference Gertler and Karadi2015), and the CRTS measures discussed in Section 2. IP and the CPI enter the VAR in log levels times 100 (see e.g. Ramey (Reference Ramey2016)). In our baseline, we use monthly data running from February 1990 to June 2019, where the sample period is determined by the availability of the interest rate surprises. Table A2 in the Appendix provides a detailed description of the data and lists the data sources.
Since the policy announcement should dominate financial markets within the tight window around the announcement, it is plausible that the change in the 3-month ahead futures rate is correlated with a monetary policy shock but uncorrelated with other macroeconomic shocks (see e.g. Gertler and Karadi (Reference Gertler and Karadi2015); Caldara and Herbst (Reference Caldara and Herbst2019)). Thus, we interpret this high-frequency change in the futures rate as a monetary policy-induced surprise that is exogenous and, following Plagborg-Møller and Wolf (Reference Plagborg-Møller and Wolf2021), we impose a recursive identification scheme where we order the surprise variable first in the vector of endogenous variables.Footnote 9 Thus, rather than imposing restrictions motivated by theoretical models, which is necessary when, for example, sign restrictions are used for identification, our identification approach relies on the assumption that the high-frequency change in the futures rate is exogenous.
FOMC announcements do not only reveal information about the implementation of monetary policy measures, but also information about the Fed’s economic outlook. To ensure that our results are not driven by these information effects, we replicate our estimations in the robustness analysis with policy surprise measures that are orthogonal to information effects (Jarocinski and Karadi (Reference Jarocinski and Karadi2020); Miranda-Agrippino and Ricco (Reference Miranda-Agrippino and Ricco2021)). Nevertheless, since orthogonalizing the surprise measures requires additional assumptions, we use surprises that incorporate information effects in our baseline specification.
We estimate the VAR with Bayesian methods to increase efficiency and to take into account that IP and consumer prices are nonstationary. Specifically, we use a standard Minnesota prior (see e.g. Litterman (Reference Litterman1986)), with the tightness and decay hyperparameters set to 0.05 and 0.5, respectively. The posterior distribution is simulated with 4500 Gibbs sample draws, where the first 500 draws are dropped as burn in and every fourth draw is saved.
4. Results
4.1 Main results
Figure 2 shows the responses to an expansionary monetary policy shock estimated with the full sample from February 1990 to June 2019. The first line shows the responses of the macroeconomic variables. The responses of the CRTS measures are presented in the second line.
Impulse response functions to an expansionary monetary policy shock estimated with the full sample (1990M2-2019M6).
Notes: The figure shows point-wise median responses (blue lines) as well as 68% and 90% credible sets (dark and light blue shaded areas) to an expansionary monetary policy shock. In the second line, the conditional readiness to spend measures are defined as CRTS $({+})=\text{Share}(\text{INFEX}+,\text{RTS}{+}) - \text{Share}(\text{INFEX}+,\text{RTS}{-})$
in the first column and as CRTS
$({+})=\text{Share}(\text{INFEX}+,\text{RTS}{+}) - \text{Share}(\text{INFEX}+,\text{RTS}{-})$
in the first column and as CRTS $({-})=\text{Share}(\text{INFEX}-,\text{RTS}{-}) - \text{Share}(\text{INFEX}-,\text{RTS}{+})$
in the second column, times 100 plus 100.
$({-})=\text{Share}(\text{INFEX}-,\text{RTS}{-}) - \text{Share}(\text{INFEX}-,\text{RTS}{+})$
in the second column, times 100 plus 100.
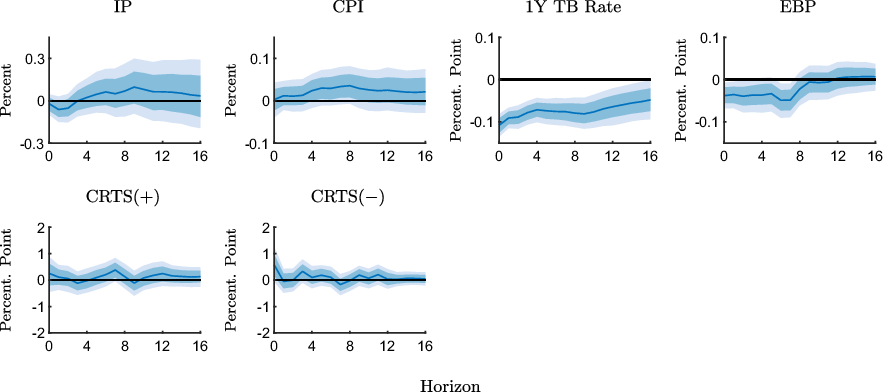
We see that an expansionary shock increases IP and prices over the medium run, where the CPI increases somewhat more rapidly and more persistently, though the credible sets associated with these two responses are relatively wide and generally include the zero line. The 1-year treasury bill rate and the EBP decline. These responses are in line with the existing literature (see e.g. Gertler and Karadi (Reference Gertler and Karadi2015)).
What we are mainly interested in is how readiness to spend and inflation expectations are jointly updated in response to the shock. The CRTS measure, $\text{CRTS(+)}$
, tends to increase in response to the shock. In other words, the share of respondents who expect inflation to increase and also indicate a higher readiness to spend increases relative to the share of respondents who expect higher inflation but indicate a lower readiness to spend. Although this increase in CRTS is qualitatively consistent with the expected inflation channel, the response is mostly insignificant.Footnote
10
$\text{CRTS(+)}$
, tends to increase in response to the shock. In other words, the share of respondents who expect inflation to increase and also indicate a higher readiness to spend increases relative to the share of respondents who expect higher inflation but indicate a lower readiness to spend. Although this increase in CRTS is qualitatively consistent with the expected inflation channel, the response is mostly insignificant.Footnote
10
We also see that $\text{CRTS}({-})$
increases on impact. Given the definition of this measure in the previous section, this suggests that the relative share of those respondents who expect lower inflation and indicate a lower readiness to spend increases. Although a lower readiness to spend conditional on lower expected inflation is in line with the interpretation that consumers respond consistently to a higher expected real interest rate, lower inflation expectations are at odds with the CPI response to an expansionary policy shock and, ultimately, with the expected inflation channel. Overall, these results suggest that the expected inflation channel should be weak at best.
$\text{CRTS}({-})$
increases on impact. Given the definition of this measure in the previous section, this suggests that the relative share of those respondents who expect lower inflation and indicate a lower readiness to spend increases. Although a lower readiness to spend conditional on lower expected inflation is in line with the interpretation that consumers respond consistently to a higher expected real interest rate, lower inflation expectations are at odds with the CPI response to an expansionary policy shock and, ultimately, with the expected inflation channel. Overall, these results suggest that the expected inflation channel should be weak at best.
Did consumers respond differently to policy shocks at the ZLB? To address this question, we re-estimate the VAR for two subsamples. The first subsample, that is, the pre-ZLB sample, ranges from the start of our sample in February 1990 to October 2008 and the second subsample, the ZLB sample, ranges from November 2008 to November 2015 when the federal funds rate was at zero.Footnote 11
Figure 3 shows the responses to an expansionary policy shock for the pre-ZLB sample. The macroeconomic responses are qualitatively in line with those obtained with the full sample, although somewhat more persistent and less precisely estimated. $\text{CRTS(+)}$
responds only weakly in the immediate aftermath of the shock but increases over the medium run. Despite the more pronounced medium-run effect, the response is still largely in line with the results for the full sample.
$\text{CRTS(+)}$
responds only weakly in the immediate aftermath of the shock but increases over the medium run. Despite the more pronounced medium-run effect, the response is still largely in line with the results for the full sample. $\text{CRTS}({-})$
tends to increase as well, and although the response is slightly more persistent than in the full sample, it is still rather unsystematic.
$\text{CRTS}({-})$
tends to increase as well, and although the response is slightly more persistent than in the full sample, it is still rather unsystematic.
Impulse response functions to an expansionary monetary policy shock estimated with the pre-ZLB sample (1990M2-2008M10).
Notes: The figure shows point-wise median responses (blue lines) as well as 68% and 90% credible sets (dark and light blue shaded areas) to an expansionary monetary policy shock. In the second line, the conditional readiness to spend measures are defined as CRTS $({+})=\text{Share}(\text{INFEX}+,\text{RTS}{+}) - \text{Share}(\text{INFEX}+,\text{RTS}{-})$
in the first column and as CRTS
$({+})=\text{Share}(\text{INFEX}+,\text{RTS}{+}) - \text{Share}(\text{INFEX}+,\text{RTS}{-})$
in the first column and as CRTS $({-})=\text{Share}(\text{INFEX}-,\text{RTS}{-}) - \text{Share}(\text{INFEX}-,\text{RTS}{+})$
in the second column, times 100 plus 100.
$({-})=\text{Share}(\text{INFEX}-,\text{RTS}{-}) - \text{Share}(\text{INFEX}-,\text{RTS}{+})$
in the second column, times 100 plus 100.
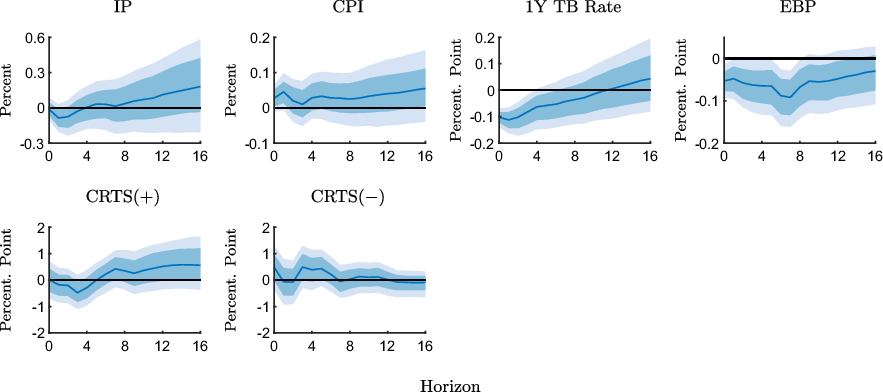
Figure 4 displays the results for the ZLB sample. When the ZLB binds, the CPI declines on impact in response to an expansionary shock, before it moves persistently in the expected direction. The interest rate response is less pronounced and also less persistent than in the full sample, which, given the low level of nominal interest rates during this period, is not surprising. The EBP is essentially unresponsive. While the responses of the macroeconomic variables resemble the results obtained with the full sample, the responses of the CRTS measures differ strongly. $\text{CRTS(+)}$
increases only slightly in the impact period before it falls persistently. The magnitude of the response, although less precisely estimated, is larger than in the pre-ZLB sample.
$\text{CRTS(+)}$
increases only slightly in the impact period before it falls persistently. The magnitude of the response, although less precisely estimated, is larger than in the pre-ZLB sample. $\text{CRTS}({-})$
declines persistently, which is in contrast to the results for the pre-ZLB sample. Thus, the rather weak responses of the CRTS measures, which we find for the full sample, appear to be due to offsetting effects before and at the ZLB.
$\text{CRTS}({-})$
declines persistently, which is in contrast to the results for the pre-ZLB sample. Thus, the rather weak responses of the CRTS measures, which we find for the full sample, appear to be due to offsetting effects before and at the ZLB.
Impulse response functions to an expansionary monetary policy shock estimated with the ZLB sample (2008M11-2015M11).
Notes: The figure shows point-wise median responses (blue lines) as well as 68% and 90% credible sets (dark and light blue shaded areas) to an expansionary monetary policy shock. In the second line, the conditional readiness to spend measures are defined as CRTS $({+})=\text{Share}(\text{INFEX}+,\text{RTS}{+}) - \text{Share}(\text{INFEX}+,\text{RTS}{-})$
in the first column and as CRTS
$({+})=\text{Share}(\text{INFEX}+,\text{RTS}{+}) - \text{Share}(\text{INFEX}+,\text{RTS}{-})$
in the first column and as CRTS $({-})=\text{Share}(\text{INFEX}-,\text{RTS}{-}) - \text{Share}(\text{INFEX}-,\text{RTS}{+})$
in the second column, times 100 plus 100.
$({-})=\text{Share}(\text{INFEX}-,\text{RTS}{-}) - \text{Share}(\text{INFEX}-,\text{RTS}{+})$
in the second column, times 100 plus 100.
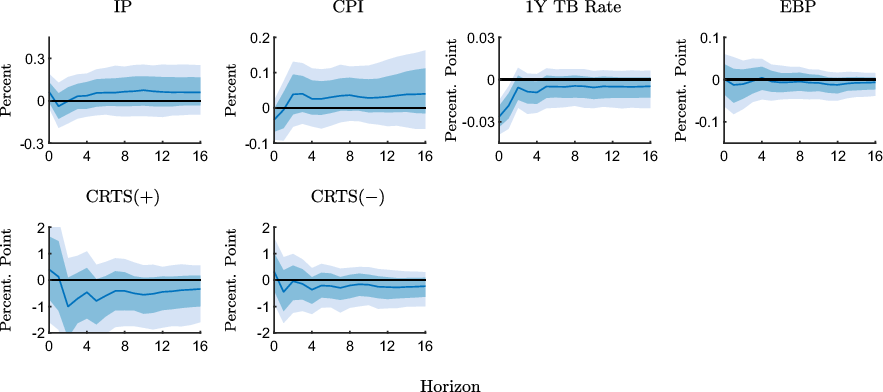
In short, we find only limited support in favor of the expected inflation channel. The effects are qualitatively in line with the expected inflation channel but generally weak in the period before the binding ZLB. During the ZLB period, the effects are more pronounced but survey respondents who expect higher inflation in response to an expansionary policy shock are now more likely to reduce their readiness to spend, which is at odds with the expected inflation channel.Footnote 12 One explanation is that at the ZLB, when the economy is operating under exceptional circumstances, households become increasingly concerned about the potentially adverse effects of higher inflation and pay less attention to the implications for the real interest rate. For instance, higher inflation may be interpreted as a signal for worsening economic conditions and lower future standards of living (Shiller (Reference Shiller1996)), which induces consumers to cut back on consumption out of a precautionary motive.
4.2 Results for groups of respondents
Expectation formation may depend on demographic characteristics such as education, income, age, and gender. Souleles (Reference Souleles2004) documents that consumers’ forecast errors can be explained, to some extent, by demographic characteristics. Easaw et al. (Reference Easaw, Golinelli and Malgarini2013) find that people with higher education levels tend to have lower inflation expectations and absorb new information faster indicating that education reduces informational rigidities. Malmendier and Nagel (Reference Malmendier and Nagel2016) find that the reaction to inflation surprises declines with age. Coibion et al. (Reference Coibion, Gorodnichenko and Kumar2018) show that inflation nowcast errors by firms are not systematically affected by demographic characteristics, once firm-specific variables are controlled for. Bachmann et al. (Reference Bachmann, Berg and Sims2015) find that the effect of expected inflation on readiness to spend is similar across demographic groups, while Burke and Ozdagli (Reference Burke and Ozdagli2021) observe expansionary effects only for certain groups of respondents.
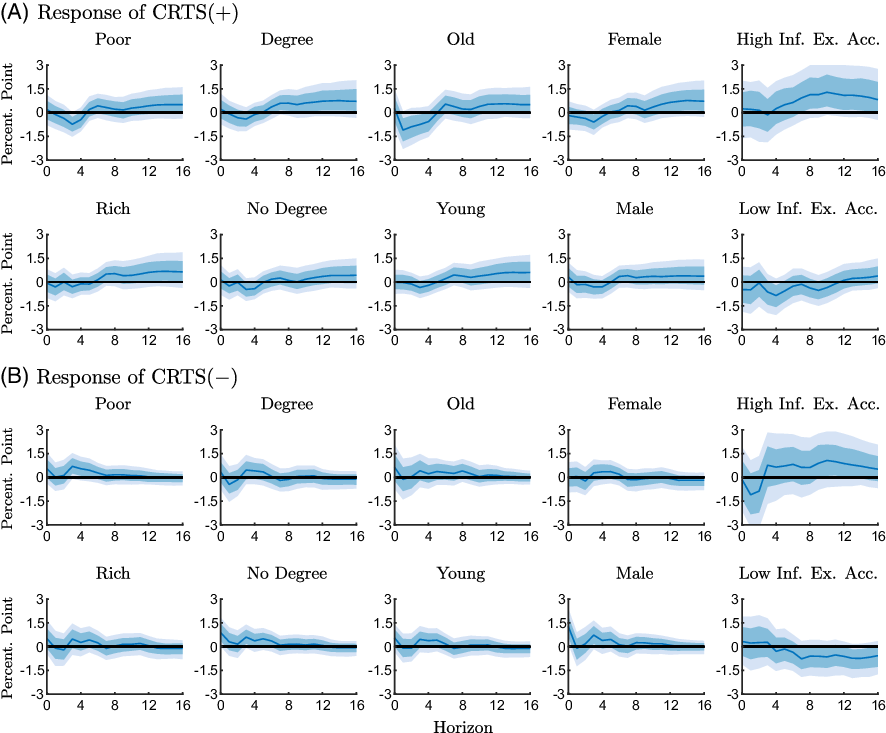
To explore how demographic characteristics influence the responses of our measures of CRTS, we aggregate the data according to demographic characteristics and include the aggregated series sequentially in the VAR. Specifically, we group respondents according to education (college degree), age (below or above 65 years), income (below or above the median), and gender. In addition, we follow Bachmann et al. (Reference Bachmann, Berg and Sims2015) and group respondents according to the accuracy of their inflation forecasts, since the reaction to inflation expectations may be related to a consumer’s understanding of macroeconomic developments and monetary policy. We include a respondent in the group of relatively accurate forecasters if the respondent’s absolute forecast error is below the cross-sectional median absolute forecast error.
Figures 5 and 6 show the group-specific responses of the CRTS measures for the pre-ZLB and the ZLB period.Footnote
13
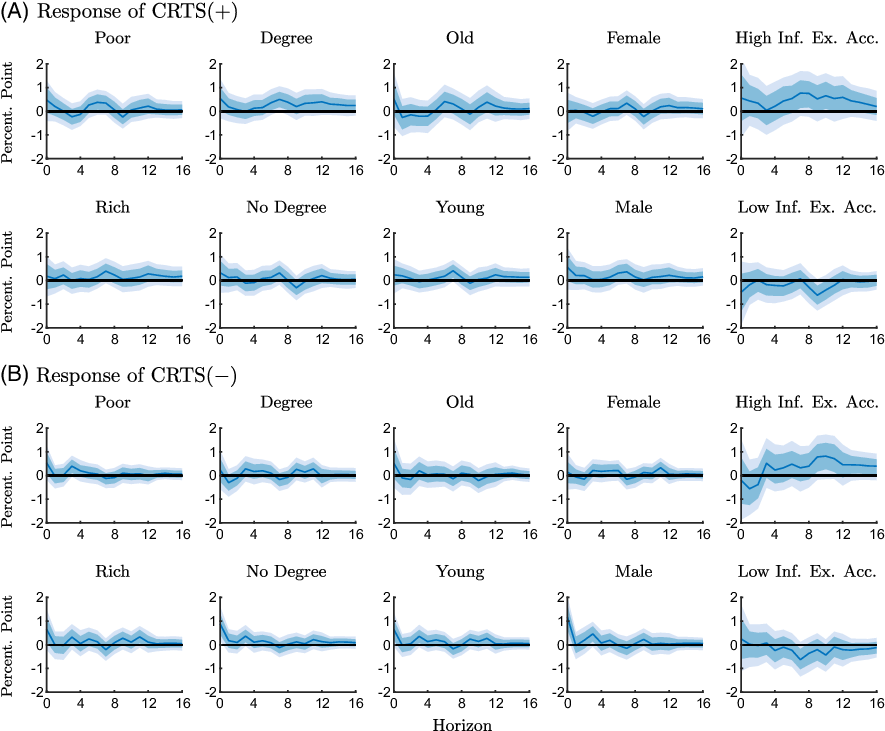
Overall, we only observe small differences across groups. In line with previous results, $\text{CRTS}({+})$
generally increases over the medium run in the pre-ZLB sample, albeit only weakly, and the responses
$\text{CRTS}({+})$
generally increases over the medium run in the pre-ZLB sample, albeit only weakly, and the responses $\text{CRTS}({-})$
are less systematic but tend to be positive. At the ZLB, as shown in Figure 6,
$\text{CRTS}({-})$
are less systematic but tend to be positive. At the ZLB, as shown in Figure 6, $\text{CRTS}({+})$
tends to decline and
$\text{CRTS}({+})$
tends to decline and $\text{CRTS}({-})$
responds relatively weakly.
$\text{CRTS}({-})$
responds relatively weakly.
Responses of the conditional readiness to spend measures to an expansionary monetary policy shock for different groups estimated with the pre-ZLB sample (1990M2-2008M10).
Notes: The figure shows point-wise median responses (blue lines) as well as 68% and 90% credible sets (dark and light blue shaded areas) to an expansionary monetary policy shock. The conditional readiness to spend measures are defined as CRTS $({+})=\text{Share}(\text{INFEX}+,\text{RTS}{+}) - \text{Share}(\text{INFEX}+,\text{RTS}{-})$
in the first and second line, and as CRTS
$({+})=\text{Share}(\text{INFEX}+,\text{RTS}{+}) - \text{Share}(\text{INFEX}+,\text{RTS}{-})$
in the first and second line, and as CRTS $({-})=\text{Share}(\text{INFEX}-,\text{RTS}{-}) - \text{Share}(\text{INFEX}-,\text{RTS}{+})$
in the third and fourth line, times 100 plus 100.
$({-})=\text{Share}(\text{INFEX}-,\text{RTS}{-}) - \text{Share}(\text{INFEX}-,\text{RTS}{+})$
in the third and fourth line, times 100 plus 100.
Responses of the conditional readiness to spend measures to an expansionary monetary policy shock for different groups estimated with the ZLB sample (2008M11-2015M11).
Notes: The figure shows point-wise median responses (blue lines) as well as 68% and 90% credible sets (dark and light blue shaded areas) to an expansionary monetary policy shock. The conditional readiness to spend measures are defined as CRTS $({+})=\text{Share}(\text{INFEX}+,\text{RTS}{+}) - \text{Share}(\text{INFEX}+,\text{RTS}{-})$
in the first and second line, and as CRTS
$({+})=\text{Share}(\text{INFEX}+,\text{RTS}{+}) - \text{Share}(\text{INFEX}+,\text{RTS}{-})$
in the first and second line, and as CRTS $({-})=\text{Share}(\text{INFEX}-,\text{RTS}{-}) - \text{Share}(\text{INFEX}-,\text{RTS}{+})$
in the third and fourth line, times 100 plus 100.
$({-})=\text{Share}(\text{INFEX}-,\text{RTS}{-}) - \text{Share}(\text{INFEX}-,\text{RTS}{+})$
in the third and fourth line, times 100 plus 100.
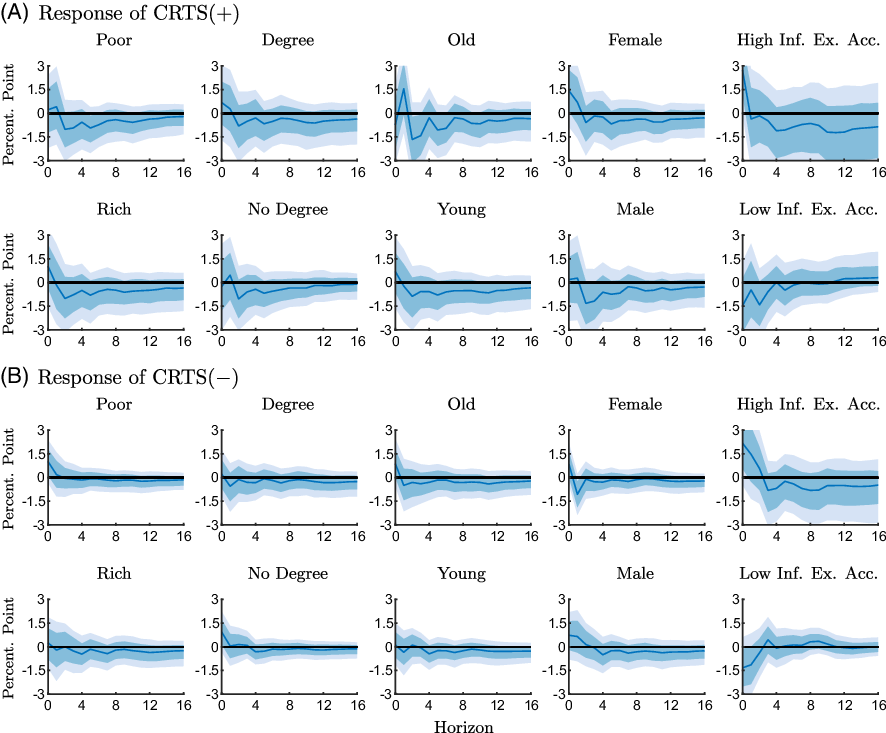
Overall, demographic factors appear to exert only modest effects on how consumers update inflation expectations and readiness to spend. When we group respondents according to how accurately they forecast inflation, the differences across groups are somewhat more pronounced, but the patterns remain the same.
4.3 Do unemployment expectations drive readiness to spend?
Although our measures of CRTS summarize the relationship between readiness to spend and inflation expectations, they may potentially pick up other factors that may be correlated with inflation expectations. For instance, survey respondents who expect inflation to increase may also expect unemployment to go down in line with a movement along the Phillips curve. If these respondents adjust their readiness to spend in response to a policy shock based on how they revise unemployment expectations, CRTS would still respond to the shock even if expected inflation has only a small or no effect on readiness to spend. To address this issue, we compare the dynamics of unemployment expectations in the groups of respondents that we use to calculate our CRTS measures. We focus on unemployment expectations, since they capture beliefs about the business cycle in a general way and can also be interpreted as an indicator for economic sentiment.
Since survey respondents provide qualitative information about their unemployment expectations (“more”, “stay the same”, and “less” unemployment), average unemployment expectations for single groups are calculated as balance scores, that is, the share of respondents expecting an increase in unemployment minus the share of respondents expecting a decline.
Consider first $\text{CRTS}({+})$
, which is calculated using the share of respondents who expect inflation to rise and at the same time indicate a higher readiness to spend,
$\text{CRTS}({+})$
, which is calculated using the share of respondents who expect inflation to rise and at the same time indicate a higher readiness to spend, $\text{Share(INFEX+,RTS+)}$
, and the share of respondents who expect increasing inflation but indicate a lower readiness to spend,
$\text{Share(INFEX+,RTS+)}$
, and the share of respondents who expect increasing inflation but indicate a lower readiness to spend, $\text{Share(INFEX+,RTS}{-})$
. For the first group of respondents, we calculate the average unemployment expectation, which we denote by
$\text{Share(INFEX+,RTS}{-})$
. For the first group of respondents, we calculate the average unemployment expectation, which we denote by $\overline{\text{UMEX}}|(\text{INFEX+,RTS+})$
. Similarly, for the second group of respondents, we calculate
$\overline{\text{UMEX}}|(\text{INFEX+,RTS+})$
. Similarly, for the second group of respondents, we calculate $\overline{\text{UMEX}}|(\text{INFEX+,RTS}{-})$
. And finally, we summarize these average unemployment expectations as
$\overline{\text{UMEX}}|(\text{INFEX+,RTS}{-})$
. And finally, we summarize these average unemployment expectations as $\overline{UMEX}|(\text{INFEX+,RTS+})-\overline{\text{UMEX}}|(\text{INFEX+,RTS}{-})$
. And analogously, we calculate
$\overline{UMEX}|(\text{INFEX+,RTS+})-\overline{\text{UMEX}}|(\text{INFEX+,RTS}{-})$
. And analogously, we calculate $\overline{\text{UMEX}}|(\text{INFEX}-,\text{RTS}{-})-\overline{\text{UMEX}}|(\text{INFEX}-,\text{RTS+})$
as the corresponding score for respondents who expect inflation to decrease. That is, those respondents whose answers are used to calculate
$\overline{\text{UMEX}}|(\text{INFEX}-,\text{RTS}{-})-\overline{\text{UMEX}}|(\text{INFEX}-,\text{RTS+})$
as the corresponding score for respondents who expect inflation to decrease. That is, those respondents whose answers are used to calculate $\text{CRTS}({-})$
. To see how unemployment expectations in the specific groups respond to policy shocks, we include the scores in the VAR models. Figures 7 and 8 show results for the pre-ZLB and ZLB samples.Footnote
14
$\text{CRTS}({-})$
. To see how unemployment expectations in the specific groups respond to policy shocks, we include the scores in the VAR models. Figures 7 and 8 show results for the pre-ZLB and ZLB samples.Footnote
14
Impulse response functions of expected unemployment scores to an expansionary monetary policy shock estimated with the pre-ZLB sample (1990M2-2008M10).
Notes: The figure shows point-wise median responses (blue lines) as well as 68% and 90% credible sets (dark and light blue shaded areas) to an expansionary monetary policy shock. In the second line, the conditional unemployment scores are defined as Unemp. Score $({+})=\overline{\text{UMEX}}|(\text{INFEX}+,\text{RTS}{+})-\overline{\text{UMEX}}|(\text{INFEX}+,\text{RTS}{-})$
in the first column and as Unemp. Score
$({+})=\overline{\text{UMEX}}|(\text{INFEX}+,\text{RTS}{+})-\overline{\text{UMEX}}|(\text{INFEX}+,\text{RTS}{-})$
in the first column and as Unemp. Score $({-})=\overline{\text{UMEX}}|(\text{INFEX}-,\text{RTS}{-})-\overline{\text{UMEX}}|(\text{INFEX}-,\text{RTS}{+})$
in the second column, times 100 plus 100, where
$({-})=\overline{\text{UMEX}}|(\text{INFEX}-,\text{RTS}{-})-\overline{\text{UMEX}}|(\text{INFEX}-,\text{RTS}{+})$
in the second column, times 100 plus 100, where $\overline{\text{UMEX}}$
stands for the group-specific average unemployment expectation.
$\overline{\text{UMEX}}$
stands for the group-specific average unemployment expectation.
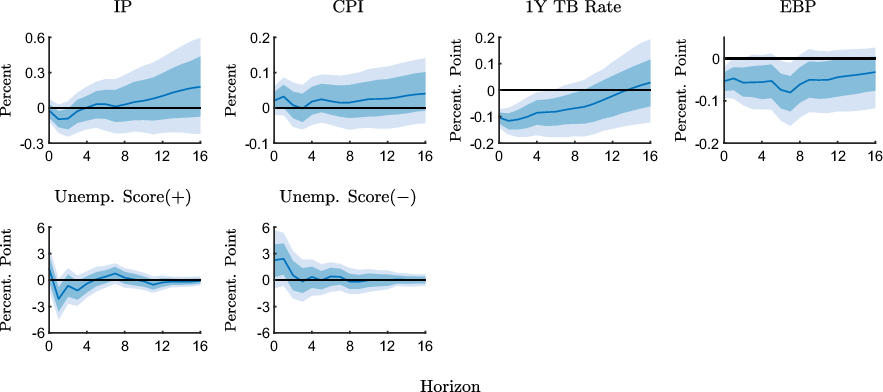
Impulse response functions of expected unemployment scores to an expansionary monetary policy shock estimated with the ZLB sample (2008M11-2015M11).
Notes: The figure shows point-wise median responses (blue lines) as well as 68% and 90% credible sets (dark and light blue shaded areas) to an expansionary monetary policy shock. In the second line, the conditional unemployment scores are defined as Unemp. Score $({+})=\overline{\text{UMEX}}|(\text{INFEX}+,\text{RTS}{+})-\overline{\text{UMEX}}|(\text{INFEX}+,\text{RTS}{-})$
in the first column and as Unemp. Score
$({+})=\overline{\text{UMEX}}|(\text{INFEX}+,\text{RTS}{+})-\overline{\text{UMEX}}|(\text{INFEX}+,\text{RTS}{-})$
in the first column and as Unemp. Score $({-})=\overline{\text{UMEX}}|(\text{INFEX}-,\text{RTS}{-})-\overline{\text{UMEX}}|(\text{INFEX}-,\text{RTS}{+})$
in the second column, times 100 plus 100, where
$({-})=\overline{\text{UMEX}}|(\text{INFEX}-,\text{RTS}{-})-\overline{\text{UMEX}}|(\text{INFEX}-,\text{RTS}{+})$
in the second column, times 100 plus 100, where $\overline{\text{UMEX}}$
stands for the group-specific average unemployment expectation.
$\overline{\text{UMEX}}$
stands for the group-specific average unemployment expectation.
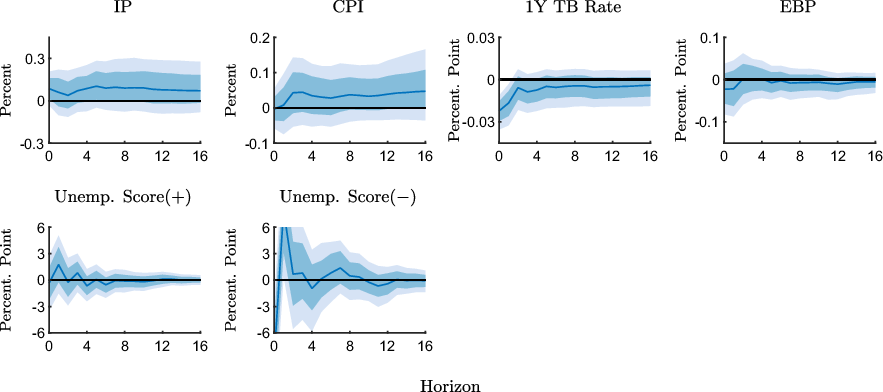
Figure 7 shows that the expected unemployment score associated with higher inflation expectations declines in response to an expansionary shock in the pre-ZLB sample. In other words, among the group of respondents who expect inflation to go up and indicate a higher readiness to spend, relatively more respondents expect unemployment to decrease in comparison with the respondents who expect inflation to go up and indicate a lower readiness to spend in the aftermath of the shock. Since it is plausible that respondents who expect unemployment to decline also have a higher readiness to spend, regardless of expected inflation, the increase in the CRTS measure in Figure 3 may indeed be the result of unemployment expectations rather than inflation expectations. However, the CRTS measure only increases over the medium run, while the expected unemployment score declines in the short run. Thus, it appears unlikely that the dynamics of the CRTS measure are primarily driven by unemployment expectations.
We also see that the expected unemployment score associated with $\text{CRTS}({-})$
increases, which suggests that more respondents who expect inflation to decrease and indicate a lower readiness to spend, expect higher unemployment compared to the group of respondents who have higher readiness to spend. This suggests that the slight increase in the
$\text{CRTS}({-})$
increases, which suggests that more respondents who expect inflation to decrease and indicate a lower readiness to spend, expect higher unemployment compared to the group of respondents who have higher readiness to spend. This suggests that the slight increase in the $\text{CRTS}({-})$
measure in this case, which is inconsistent with the expected inflation channel, may not even be related to inflation expectations, but result from revised unemployment expectations induced by the policy shock.
$\text{CRTS}({-})$
measure in this case, which is inconsistent with the expected inflation channel, may not even be related to inflation expectations, but result from revised unemployment expectations induced by the policy shock.
Responses of the expected unemployment score in the ZLB sample are shown in Figure 8. We see that the expected unemployment score associated with higher inflation expectations is essentially unresponsive following expansionary shocks. Thus, unemployment expectations do not appear to differ systematically across respondents that adjust their readiness to spend differently. Finally, the expected unemployment score associated with lower inflation expectations decreases on impact before increasing strongly, but transitorily, in response to the expansionary shock, at the ZLB. Thus, the decline in the CRTS measure in this case does not appear to be the result of a systematically less optimistic labor market outlook.
Overall, we conclude that although the dynamics of unemployment expectations may give rise to changes in the readiness to spend, they do not appear to dominate the dynamics of the CRTS measures in most cases.
5. Robustness analysis
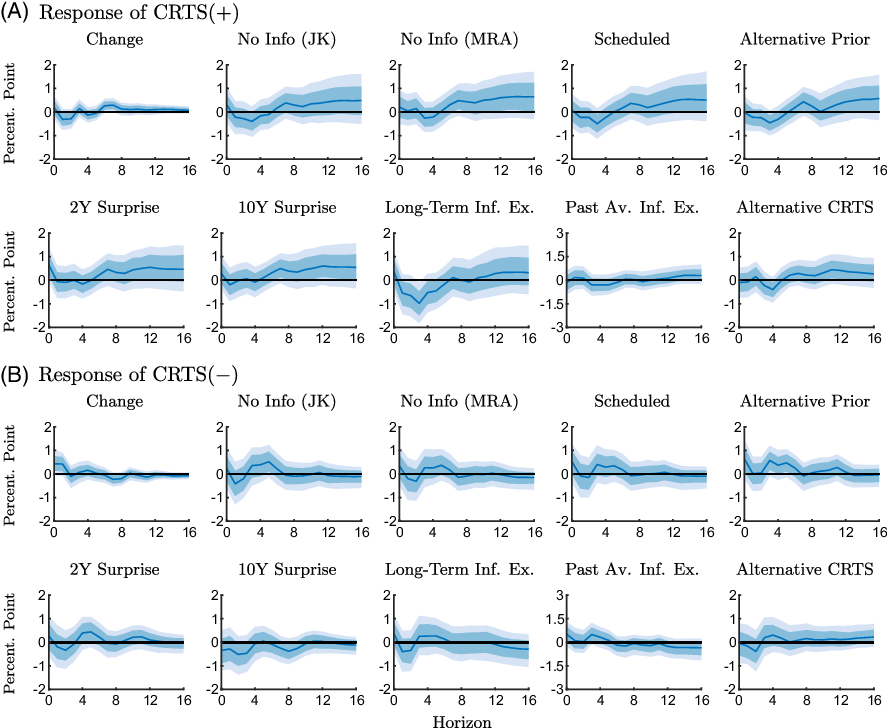
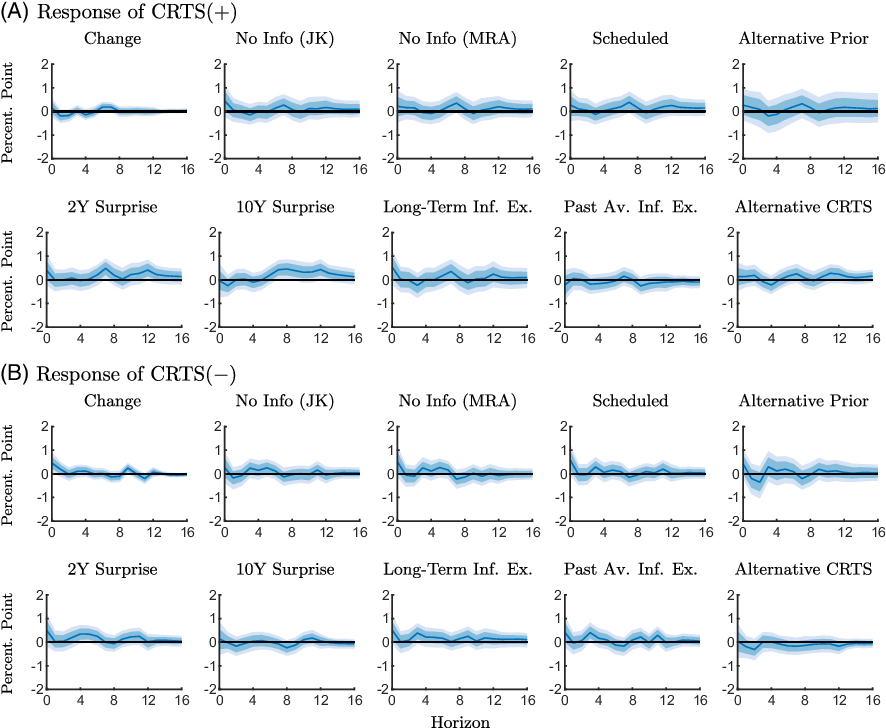
We present a series of robustness checks to evaluate potential sensitivities with respect to the construction of CRTS measures and the estimation approach. Figures 9 and 10 show the responses of CRTS measures for the various robustness checks for the two subsamples.Footnote 15
Robustness checks of the response of the conditional readiness to spend measures to an expansionary monetary policy shock estimated with the pre-ZLB sample (1990M2-2008M10).
Notes: The figure shows point-wise median responses (blue lines) as well as 68% and 90% credible sets (dark and light blue shaded areas) to an expansionary monetary policy shock. The conditional readiness to spend measures are defined as CRTS $({+})=\text{Share}(\text{INFEX}+,\text{RTS}{+}) - \text{Share}(\text{INFEX}+,\text{RTS}{-})$
in the first and second line, and as CRTS
$({+})=\text{Share}(\text{INFEX}+,\text{RTS}{+}) - \text{Share}(\text{INFEX}+,\text{RTS}{-})$
in the first and second line, and as CRTS $({-})=\text{Share}(\text{INFEX}-,\text{RTS}{-}) - \text{Share}(\text{INFEX}-,\text{RTS}{+})$
in the third and fourth line, times 100 plus 100. The various robustness checks are described in Section 5.
$({-})=\text{Share}(\text{INFEX}-,\text{RTS}{-}) - \text{Share}(\text{INFEX}-,\text{RTS}{+})$
in the third and fourth line, times 100 plus 100. The various robustness checks are described in Section 5.
Robustness checks of the response of the conditional readiness to spend measures to an expansionary monetary policy shock estimated with the ZLB sample (2008M11-2015M11).
Notes: The figure shows point-wise median responses (blue lines) as well as 68% and 90% credible sets (dark and light blue shaded areas) to an expansionary monetary policy shock. The conditional readiness to spend measures are defined as CRTS $({+})=\text{Share}(\text{INFEX}+,\text{RTS}{+}) - \text{Share}(\text{INFEX}+,\text{RTS}{-})$
in the first and second line, and as CRTS
$({+})=\text{Share}(\text{INFEX}+,\text{RTS}{+}) - \text{Share}(\text{INFEX}+,\text{RTS}{-})$
in the first and second line, and as CRTS $({-})=\text{Share}(\text{INFEX}-,\text{RTS}{-}) - \text{Share}(\text{INFEX}-,\text{RTS}{+})$
in the third and fourth line, times 100 plus 100. The various robustness checks are described in Section 5.
$({-})=\text{Share}(\text{INFEX}-,\text{RTS}{-}) - \text{Share}(\text{INFEX}-,\text{RTS}{+})$
in the third and fourth line, times 100 plus 100. The various robustness checks are described in Section 5.
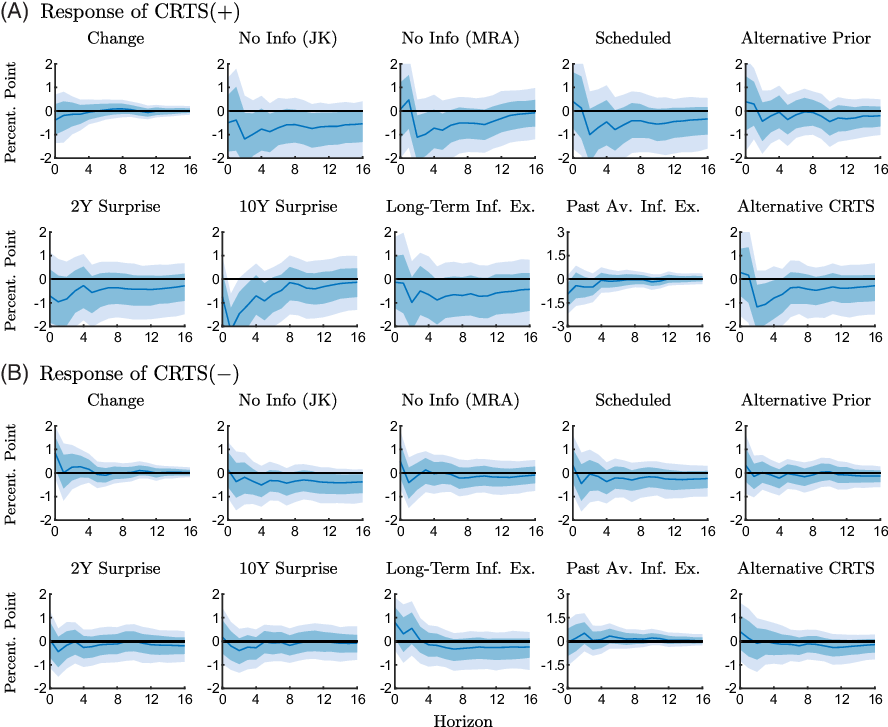
We first consider alternative CRTS measures that exploit the rotating panel dimension in the Michigan Survey. For the respondents who are interviewed a second time after 6 months, we use changes in inflation expectations and readiness to spend between the two interviews to construct the measures of CRTS. The responses are shown in the columns labeled “Change” in Figures 9 and 10. We see from Figure 9 that the responses of these alternative conditional measures in the pre-ZLB period are in line with the results reported in our baseline analysis. At the ZLB, $\text{CRTS}+$
declines, although less markedly than in the baseline, and
$\text{CRTS}+$
declines, although less markedly than in the baseline, and $\text{CRTS}-$
increases according to Figure 10, which confirms our baseline results.
$\text{CRTS}-$
increases according to Figure 10, which confirms our baseline results.
Next, we take into account that information conveyed about the state of the economy, which is disclosed when policy actions are announced, may confound the effects of policy shocks. We use the approaches suggested by Jarocinski and Karadi (Reference Jarocinski and Karadi2020) and Miranda-Agrippino and Ricco (Reference Miranda-Agrippino and Ricco2021) to obtain monetary policy surprises that are orthogonal to information effects, and, in addition, consider only a subset of FOMC meetings for which information effects are less likely to play a role (Nakamura and Steinsson, Reference Nakamura and Steinsson2018). The “No Info (JK)” columns in Figures 9 and 10 show responses of the conditional measures (as constructed in the baseline) obtained with Jarocinski and Karadi’s (Reference Jarocinski and Karadi2020) “poor man’s” approach, which uses stock market surprises in addition to interest rate surprises to disentangle policy shocks and information effects. Responses to policy surprises purged from information effects as suggested in Miranda-Agrippino and Ricco (Reference Miranda-Agrippino and Ricco2021) are shown in columns “No Info (MRA)” in Figures 9 and 10. Specifically, we purge the surprises in the 3-month ahead futures rate (i.e. surprises in the fourth federal funds futures; FF4 $_m$
) from the Federal Reserve’s internal Greenbook forecasts:
$_m$
) from the Federal Reserve’s internal Greenbook forecasts:
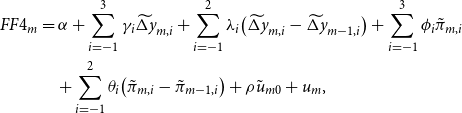 \begin{align} FF4_m & = \alpha + \sum _{i=-1}^3 \gamma _i \widetilde{\Delta y}_{m,i} + \sum _{i=-1}^2 \lambda _i\! \left(\widetilde{\Delta y}_{m,i}-\widetilde{\Delta y}_{m-1,i}\right) + \sum _{i=-1}^3 \phi _i \tilde{\pi }_{m,i} \nonumber \\ & \quad + \sum _{i=-1}^2 \theta _i \!\left(\tilde{\pi }_{m,i}-\tilde{\pi }_{m-1,i}\right) + \rho \tilde{u}_{m0} + u_m, \end{align}
where the index $m$
corresponds to the FOMC meetings, and
$m$
corresponds to the FOMC meetings, and $\widetilde{\Delta y_{m,i}}$
,
$\widetilde{\Delta y_{m,i}}$
, $\tilde{\pi }_{m,i}$
, and
$\tilde{\pi }_{m,i}$
, and $\tilde{u}_{m,i}$
are Greenbook forecasts of real output growth, inflation, and the unemployment rate for the previous (
$\tilde{u}_{m,i}$
are Greenbook forecasts of real output growth, inflation, and the unemployment rate for the previous ( $i=-1$
), current (
$i=-1$
), current ( $i=0$
), or subsequent (
$i=0$
), or subsequent ( $i=1,2,3$
) quarters at each FOMC meeting
$i=1,2,3$
) quarters at each FOMC meeting $m$
. The purged policy surprises
$m$
. The purged policy surprises $u_m$
are aggregated to a monthly frequency as suggested in Gertler and Karadi (Reference Gertler and Karadi2015). In columns “Scheduled” in Figures 9 and 10, we only consider scheduled FOMC meetings in the construction of the monetary policy surprise measure as in Nakamura and Steinsson (Reference Nakamura and Steinsson2018).Footnote
16
The intuition is that unscheduled meetings are usually due to abrupt macroeconomic developments. In these meetings, the monetary authority reveals information to the markets that pertain to signaling effects. Our main conclusions remain unchanged when we take information effects explicitly into account.
$u_m$
are aggregated to a monthly frequency as suggested in Gertler and Karadi (Reference Gertler and Karadi2015). In columns “Scheduled” in Figures 9 and 10, we only consider scheduled FOMC meetings in the construction of the monetary policy surprise measure as in Nakamura and Steinsson (Reference Nakamura and Steinsson2018).Footnote
16
The intuition is that unscheduled meetings are usually due to abrupt macroeconomic developments. In these meetings, the monetary authority reveals information to the markets that pertain to signaling effects. Our main conclusions remain unchanged when we take information effects explicitly into account.
Next, we evaluate the robustness of our results with respect to the specification of prior parameters. In the baseline, we set the tightness and decay hyperparameters to 0.05 and 0.5. We now consider alternative values of 0.2 and 2 (as in e.g. Jarocinski and Karadi, Reference Jarocinski and Karadi2020). The responses of conditional measures are shown in columns labeled “Alternative Prior” in Figures 9 and 10 and are largely unaffected by the choice of prior parameters.
To take unconventional policy measures that directly target the longer end of the yield curve more explicitly into account, we consider surprises in either the 2-year government bond yield (“2Y Surprise”) or the 10-year government bond yield (“10Y Surprise”).Footnote 17
We use long-term inflation expectations from the Michigan Survey to construct our measure of inflation expectations (“Long-Term Inf. Ex.”), and we calculate the ordinal measure of expected inflation using the average expected inflation from the previous month instead of the realized inflation rate (“Past Av. Inf. Ex.”).
Finally, we have re-estimated the model with CRTS measures constructed based on a spending question that considers a longer horizon (“Alternative CRTS”). Specifically, we use Question A19: “Speaking now of the automobile market—do you think the next 12 months or so will be a good time or a bad time to buy a new vehicle, such as a car, pickup, van or sport utility vehicle?.” Although this question is more specific about the automobile market, rather than durable consumption goods in general, it has a longer horizon than the question that we use in our baseline, which asks about current readiness to spend.
Overall, we obtain similar results as in our baseline analysis.
6. Conclusion
Standard macroeconomic models imply that monetary policy should be able to influence private consumption partly through inflation expectations. To test this prediction, we combine macroeconomic data with survey data and estimate how monetary policy shocks influence readiness to spend conditional on expected inflation.
We find that although survey respondents increasingly indicate a higher readiness to spend conditional on higher expected inflation in response to expansionary policy shock when the ZLB is not binding, the effect is small. And more importantly, the response turns negative at the ZLB.
Given the joint responses of expected inflation and readiness to spend to policy shocks, we conclude that the contribution of the expected inflation channel of monetary transmission is modest at best. Although the expected inflation channel is viewed as being particularly relevant when the ZLB is binding, caution seems to be in order as our results suggest that expected inflation may even give rise to counteracting effects in such an environment.
Financial support
This work was supported by the Austrian National Bank [grant number 18142].
Conflict of interest
The authors have no competing interests to declare.
Appendix: Additional Tables and Figures
Shares of respondents: inflation expectations (INFEX) and readiness to spend (RTS)

Notes: The table reports shares of respondents in percent who are characterized by either higher or lower inflation expectations in the first line and either higher or lower readiness to spend in the second line. The third line shows shares associated with combinations of higher or lower inflation expectations and higher or lower readiness to spend.
Variable description
Notes: Federal Reserve Economic Data (FRED); Michigan Survey (MS); Greenbook data (GB).
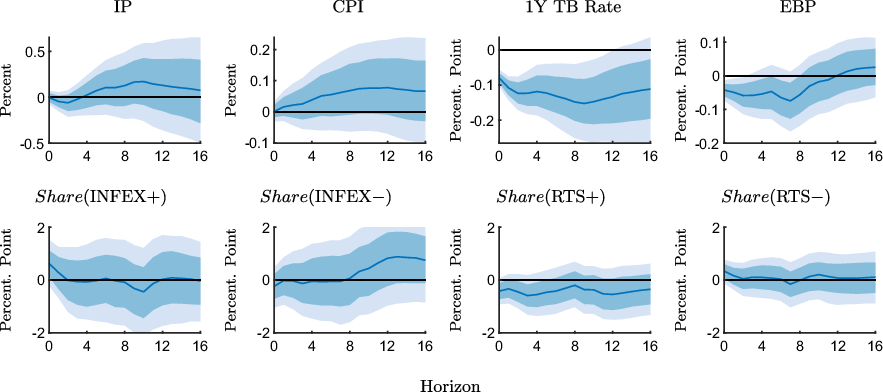
Impulse response functions of the underlying survey measures to an expansionary monetary policy shock estimated with the full sample (1990M2-2019M6).
Notes: The figure shows point-wise median responses (blue lines) as well as 68% and 90% credible sets (dark and light blue shaded areas) to an expansionary monetary policy shock.
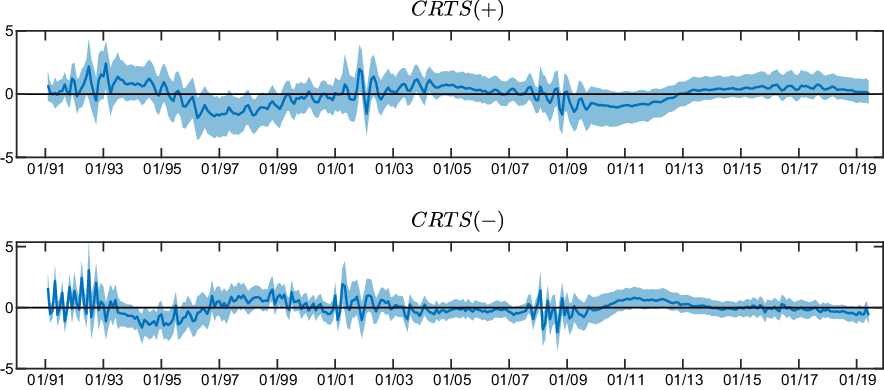
Historical contributions of monetary policy shocks to the conditional readiness to spend measures estimated with the full sample (1990M2-2019M6).
Notes: The figure shows point-wise median values (blue lines) as well as 68% of the sign-identified posterior distribution (blue shaded areas). The conditional readiness to spend measures are defined as CRTS $({+})=\text{Share}(\text{INFEX}+,\text{RTS}{+}) - \text{Share}(\text{INFEX}+,\text{RTS}{-})$
in the first line, and as CRTS
$({+})=\text{Share}(\text{INFEX}+,\text{RTS}{+}) - \text{Share}(\text{INFEX}+,\text{RTS}{-})$
in the first line, and as CRTS $({-})=\text{Share}(\text{INFEX}-,\text{RTS}{-}) - \text{Share}(\text{INFEX}-,\text{RTS}{+})$
in the second line, times 100 plus 100. All values are reported in percent.
$({-})=\text{Share}(\text{INFEX}-,\text{RTS}{-}) - \text{Share}(\text{INFEX}-,\text{RTS}{+})$
in the second line, times 100 plus 100. All values are reported in percent.
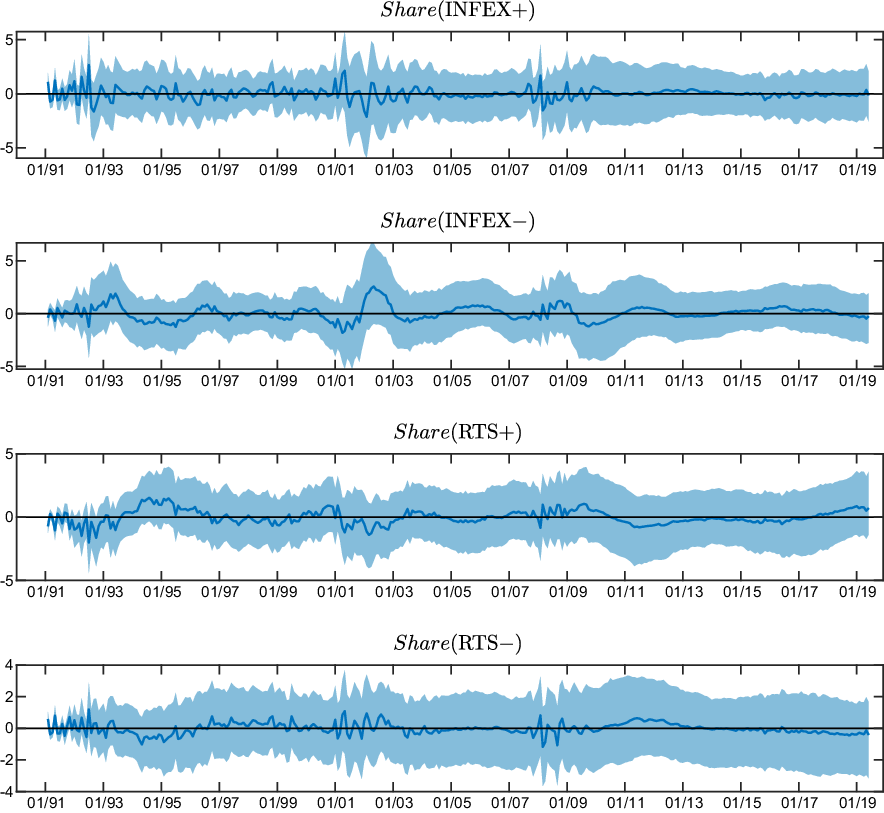
Historical contributions of monetary policy shocks to underlying survey measures estimated with the full sample (1990M2-2019M6).
Notes: The figure shows point-wise median values (blue lines) as well as 68% of the sign-identified posterior distribution (blue shaded areas). All values are reported in percent.
Responses of the conditional readiness to spend measures to an expansionary monetary policy shock for different groups estimated with the full sample (1990M2-2019M6).
Notes: The figure shows point-wise median responses (blue lines) as well as 68% and 90% credible sets (dark and light blue shaded areas) to an expansionary monetary policy shock. The conditional readiness to spend measures are defined as CRTS $({+})=\text{Share}(\text{INFEX}+,\text{RTS}{+}) - \text{Share}(\text{INFEX}+,\text{RTS}{-})$
in the first and second line, and as CRTS
$({+})=\text{Share}(\text{INFEX}+,\text{RTS}{+}) - \text{Share}(\text{INFEX}+,\text{RTS}{-})$
in the first and second line, and as CRTS $({-})=\text{Share}(\text{INFEX}-,\text{RTS}{-}) - \text{Share}(\text{INFEX}-,\text{RTS}{+})$
in the third and fourth line, times 100 plus 100.
$({-})=\text{Share}(\text{INFEX}-,\text{RTS}{-}) - \text{Share}(\text{INFEX}-,\text{RTS}{+})$
in the third and fourth line, times 100 plus 100.
Impulse response functions of expected unemployment scores to an expansionary monetary policy shock estimated with the full sample (1990M2-2019M6).
Notes: The figure shows point-wise median responses (blue lines) as well as 68% and 90% credible sets (dark and light blue shaded areas) to an expansionary monetary policy shock. In the second line, the conditional unemployment scores are defined as Unemp. Score $({+})=\overline{\text{UMEX}}|(\text{INFEX}+,\text{RTS}{+})-\overline{\text{UMEX}}|(\text{INFEX}+,\text{RTS}{-})$
in the first column and as Unemp. Score
$({+})=\overline{\text{UMEX}}|(\text{INFEX}+,\text{RTS}{+})-\overline{\text{UMEX}}|(\text{INFEX}+,\text{RTS}{-})$
in the first column and as Unemp. Score $({-})=\overline{\text{UMEX}}|(\text{INFEX}-,\text{RTS}{-})-\overline{\text{UMEX}}|(\text{INFEX}-,\text{RTS}{+})$
in the second column, times 100 plus 100, where
$({-})=\overline{\text{UMEX}}|(\text{INFEX}-,\text{RTS}{-})-\overline{\text{UMEX}}|(\text{INFEX}-,\text{RTS}{+})$
in the second column, times 100 plus 100, where $\overline{\text{UMEX}}$
stands for the group-specific average unemployment expectation.
$\overline{\text{UMEX}}$
stands for the group-specific average unemployment expectation.

Robustness checks of the response of the conditional readiness to spend measures to an expansionary monetary policy shock estimated with the full sample (1990M2-2019M6).
Notes: The figure shows point-wise median responses (blue lines) as well as 68% and 90% credible sets (dark and light blue shaded areas) to an expansionary monetary policy shock. The conditional readiness to spend measures are defined as CRTS $({+})=\text{Share}(\text{INFEX}+,\text{RTS}{+}) - \text{Share}(\text{INFEX}+,\text{RTS}{-})$
in the first and second line, and as CRTS
$({+})=\text{Share}(\text{INFEX}+,\text{RTS}{+}) - \text{Share}(\text{INFEX}+,\text{RTS}{-})$
in the first and second line, and as CRTS $({-})=\text{Share}(\text{INFEX}-,\text{RTS}{-}) - \text{Share}(\text{INFEX}-,\text{RTS}{+})$
in the third and fourth line, times 100 plus 100. The various robustness checks are described in Section 5.
$({-})=\text{Share}(\text{INFEX}-,\text{RTS}{-}) - \text{Share}(\text{INFEX}-,\text{RTS}{+})$
in the third and fourth line, times 100 plus 100. The various robustness checks are described in Section 5.
Identified monetary policy shocks.
Notes: The figure shows point-wise median values (blue bars) as well as 68% of the sign-identified posterior distribution (blue whiskers). The identified shocks are reported in standard deviations.


 Open access

