





Introduction
According to numerous studies, citizens who vote for a losing candidate tend to view democracy and its procedures as less legitimate than those who vote for an electoral winner (see, for instance, Anderson and Guillory Reference Anderson and Guillory1997; Anderson et al. Reference Anderson, Blais, Bowler, Donovan and Listhaug2005; Blais and Gélineau Reference Blais and Gélineau2007; Dahlberg and Linde Reference Dahlberg and Linde2017; Janssen Reference Janssen2023; Kern and Kölln Reference Kern and Kölln2022; Martini and Quaranta Reference Martini and Quaranta2019). Despite extensive documentation of this phenomenon, commonly referred to as the ‘winner–loser gap’, the temporal dynamics of its initial emergence have received limited theoretical attention and empirical scrutiny. This research gap is noteworthy, given the apparent interest in predicting the timing of the widespread implications that may follow substantive shifts in system support. For instance, increased dissatisfaction among losers can manifest in a reduced willingness to obey laws, a higher likelihood of participating in protests, increased mistrust in electoral integrity, and a heightened reluctance to accept defeat (Anderson et al. Reference Anderson, Blais, Bowler, Donovan and Listhaug2005; Esaiasson Reference Esaiasson2011; Garnett Reference Garnett2019; Nadeau and Blais Reference Nadeau and Blais1993). Conversely, excessive satisfaction among winners can undermine vertical accountability, allowing the government to act irresponsibly without repercussion.
The bulk of prior research has associated the ‘winner–loser gap’ with immediate responses to the election result (see, e.g. Anderson and Tverdova Reference Anderson and Tverdova2001; Blais and Gélineau Reference Blais and Gélineau2007; Halliez and Thornton Reference Halliez and Thornton2022; Janssen Reference Janssen2023; Singh et al. Reference Singh, Karakoç and Blais2012). Similar to a sore loser in a board game who questions the rules upon losing, electoral losers are expected to express more negative attitudes toward the political system than winners upon learning the election outcome. While this analogy offers a straightforward intuition to the emergence of the ‘winner–loser gap’, it may become overly simplistic in the political context. Recent notable events, such as the storming of the US Capitol in 2021 and the Brazilian Congress attack in 2023, reveal that voter reactions may unfold over an extended period, culminating months after the election result has been established. While low levels of satisfaction with democracy should not be conflated with contesting electoral integrity, these events highlight the need for closer scrutiny of the temporal dimension of voter responses (for a more detailed analysis of the relationship between electoral integrity, winners and losers, and satisfaction with democracy, see Fortin-Rittberger et al. Reference Fortin-Rittberger, Harfst and Dingler2017).
Addressing this topic, I introduce and test a new theoretical framework that distinguishes between short-term effects, stemming from voters’ immediate responses to election outcomes, and long-term effects, triggered by factors that come into play in the post-election period. The short-term effects refer to immediate attitudinal responses to the election result, arising from a combination of heuristic processing, like emotional responses, and motivated reasoning (see, for instance, Anderson et al. Reference Anderson, Blais, Bowler, Donovan and Listhaug2005; Curini et al. Reference Curini, Jou and Memoli2012; Han and Chang Reference Han and Chang2016; Janssen Reference Janssen2023, Taber and Lodge Reference Taber and Lodge2006). These mechanisms make losers associate the system with more negative feelings and greater imperfections than winners, pushing satisfaction levels among the two groups in different directions immediately when the outcome is established (Reller et al. Reference Reller, Anderson and Kousser2022). However, the impact of the outcome extends beyond these immediate reactions of voters. The long-term effects imply that the polarization between winners and losers continues to deepen over an extended period following the establishment of the election result, as voters subsequently encounter a wave of new information related to the outcome – from retrospective campaign analyses and expert commentators’ forecasts to elite statements and peer reactions. As voters continue to assess the implications of the election result in this information-rich environment, they draw cues from political elites, partisan media, and social networks, while succumbing to partisan information processing (Murakawa and Gilens Reference Murakawa and Gilens2022; Taber and Lodge Reference Taber and Lodge2006; Zaller Reference Zaller1992). These long-term effects shape and reinforce attitudes gradually, meaning that the ‘winner–loser gap’ continues to grow incrementally in the weeks following the establishment of the outcome.
The framework is subjected to testing using 21 samples from the European Social Survey (ESS) that happened to be gathered in periods during which election outcomes were announced. By mapping the dates that each respondent took part in the survey, I trace how attitudinal changes unfolded temporally once the election outcomes had been established. When studying these data, immediate short-term effects are expected to produce sharp shifts in system support observable between the announcement of the election outcome and the following day. In contrast, long-term effects should appear as gradual adjustments occurring thereafter, continuing until the ‘winner–loser gap’ fully develops and stabilizes at its equilibrium (Dahlberg and Linde Reference Dahlberg and Linde2017).
The empirical analysis reveals that, at least in the European context, long-term mechanisms play the primary role in shaping the initial development of the ‘winner–loser gap’. While a significant increase in system support was observed among politically interested winners the day after the election outcome was confirmed, this alone was insufficient to explain the gap’s emergence. In instances where a government transition occurred, it was not until a few weeks after the election result solidified that a fresh gap had fully evolved. In fact, during the initial weeks, traces of the old ‘winner–loser gap’ remained visible, reflecting the limited time voters had been given to adjust their attitudes.
These findings bring significant implications for comprehending and addressing challenges associated with system support during election periods. Rather than focusing solely on immediate effects stemming from spontaneous voter reactions, the findings underscore the significance of long-term factors, shaping winners’ and losers’ attitudes toward the political system differently in the aftermath of elections.
In the following, I provide a conceptual framework of the ‘winner–loser gap’. I then outline a theory of how the gap initially emerges. In the fourth section, I elaborate on the data and research design before presenting the results. Finally, I conclude with a brief discussion about the main takeaways.
Conceptualizing the ‘winner–loser gap’
In 1997, Anderson and Guillory showed that citizens who vote for a losing party tend to express lower levels of satisfaction with democracy than those who vote for a winner. Since the publication of this study, this phenomenon has consistently been observed across majoritarian and proportional systems, as well as in new and established democracies, making it one of the most robust empirical findings in political science (see, for instance, Anderson and Tverdova Reference Anderson and Tverdova2001; Anderson et al. Reference Anderson, Blais, Bowler, Donovan and Listhaug2005; Blais and Gélineau Reference Blais and Gélineau2007; Dahlberg and Linde Reference Dahlberg and Linde2017; Daoust et al. Reference Daoust, Plescia and Blais2023; Esaiasson Reference Esaiasson2011; Han and Chang Reference Han and Chang2016; Janssen Reference Janssen2023; Kern and Kölln Reference Kern and Kölln2022; Monsiváis-Carrillo Reference Monsiváis-Carrillo2022; Singh et al. Reference Singh, Karakoç and Blais2012; Singh Reference Singh2014; Toshkov and Mazepus Reference Toshkov and Honorata2022; Williams et al. Reference Williams, Snipes and Singh2021; Wu and Wu Reference Wu and Wu2022).
This satisfaction gap between winners and losers is problematic for several reasons. Notably, the diminished satisfaction with democracy among those on the losing side may cause electoral instability in the aftermath of elections, in the most extreme case, making losers unwilling to admit defeat (Esaiasson Reference Esaiasson2011; Nadeau and Blais Reference Nadeau and Blais1993). Dissatisfaction can also manifest in a reduced willingness to collaborate or compromise, thereby contributing to gridlocks and encouraging recourse to more unconventional forms of political participation, such as civil disobedience, boycotting, or rioting (Anderson et al. Reference Anderson, Blais, Bowler, Donovan and Listhaug2005; Ryan Reference Ryan2017). Conversely, an overly optimistic satisfaction with the democratic process among voters may give incumbents an unchecked mandate, potentially fostering irresponsible behavior without consequential accountability (Anderson et al. Reference Anderson, Blais, Bowler, Donovan and Listhaug2005; Lelkes Reference Lelkes2016).
Within the literature, winning is generally understood as voting for a party that ends up being part of the government (Anderson et al. Reference Anderson, Blais, Bowler, Donovan and Listhaug2005; Singh Reference Singh2014). However, some have suggested that voters could also be considered winners if they support a party that increases its vote share (e.g. Nemčok Reference Nemčok2020, Plescia Reference Plescia2019; Stiers et al. Reference Stiers, Daoust and Blais2018). An example of this might be the 2014 Swedish general election, where all other parties had pledged beforehand not to collaborate with the radical right party, the Sweden Democrats (SD). However, SD’s vote share surged from 5.7% to 12.9%, astonishing most onlookers with its robust performance (Olsson and Ekman Reference Olsson and Ekman2010). Clearly, their supporters did not perceive themselves as losers when the election results were announced. Yet, while increases in vote share have been shown to influence voters’ subjective sense of being on the winning side, there is no definitive evidence that this directly affects support for the political system (Daoust et al. Reference Daoust, Plescia and Blais2023; Nemčok Reference Nemčok2020, Stiers et al. Reference Stiers, Daoust and Blais2018).
Two causal mechanisms have mainly been proposed for explaining the ‘winner–loser gap’. First, there are psychological factors. In general, winning is associated with positive feelings, like euphoria and happiness, whereas losing is often linked to anger and disappointment. These emotional responses have been found in several settings, including competitive sports, where winners express more positive feelings and lower levels of stress than losers (Wilson and Kerr Reference Wilson and Kerr1999). Much like being attached to a sports team, students of politics show that partisan identities function as anchors for positive feelings towards the in-party and animosity towards out-parties (Iyengar et al. Reference Iyengar, Lelkes, Levendusky, Malhotra and Westwood2019; Wagner Reference Wagner2021). As voters identify themselves with their social in-groups, their performance is perceived as personal (Huddy et al. Reference Huddy, Mason and Aarøe2015). People might therefore get sad, angry, or disappointed when casting their ballot for a losing party, while happy and satisfied when voting for a winner (Janssen Reference Janssen2023). Emotional responses can also stem from out-group hostility, as voters who see their opponents as incompetent or dangerous may feel irritation or anxiety when losing and relief when winning (Hetherington and Rudolph Reference Hetherington and Rudolph2015; Valentino et al. Reference Valentino, Brader, Groenendyk, Gregorowicz and Hutchings2011). Since these emotions arise from political outcomes generated by the political system, winners are expected to associate the system with positive feelings, boosting support, while losers link it to negative emotions, reducing support.
The second mechanism concerns utility-maximizing. From this perspective, winning provides greater benefits than losing. In economics, the strive to minimize loss and maximize revenue has proven to be a strong predictor of human behavior (Tversky and Kahneman Reference Tversky and Kahneman1992). In the context of elections, revenue can be understood as the distance between a voter’s political preferences and the policy platform of the incumbent. Among the losers, the average distance is arguably larger, making their cost of supporting the political system greater (Anderson et al. Reference Anderson, Blais, Bowler, Donovan and Listhaug2005; Janssen Reference Janssen2023). Consequently, all else being equal, citizens who vote for a losing party are expected to be less supportive of the system than those who vote for a winner.
While these mechanisms offer important insights into the emergence of the ‘winner–loser gap’, they are not exhaustive for understanding why voter attitudes may change. Situating the mechanisms within a broader context, theories of social psychology identify two routes through which political attitudes may generally transform: systematic and heuristic processing (Chaiken and Ledgerwood Reference Chaiken and Ledgerwood2012; see also Petty et al. Reference Petty, Cacioppo and Goldman1981; Petty and Cacioppo Reference Petty and Cacioppo1986, distinguishing between central and peripheral processing). Systematic processing involves thoughtful consideration of new arguments and evidence, integrating it with existing knowledge, and forming a coherent position. For instance, a voter might come across information about the government violating democratic principles, resulting in less satisfaction with democracy. However, in this type of processing, research on ‘motivated reasoning’ demonstrates that people are inclined to seek out and evaluate new information in a way that allows them to maintain their pre-existing beliefs (Kunda Reference Kunda1990; Taber and Lodge Reference Taber and Lodge2006). Thus, an electoral loser predisposed to dislike the government might interpret its actions as undemocratic, not solely because of objective evidence, but also because they seek to validate their belief that the incumbent is unreliable.
Meanwhile, heuristic processing involves the use of mental shortcuts and cues from the environment, allowing individuals to make rapid judgments without elaborating on issues. For instance, when evaluating how well democracy functions, the mental shortcut ‘my own group can be trusted’, might make individuals rely on cues such as the government’s party affiliation to quickly form their opinions. In this framework, emotional responses are regarded as heuristic processing, quickly signaling whether specific information is associated with something positive or negative (Chaiken and Ledgerwood Reference Chaiken and Ledgerwood2012).
While these mechanisms suggest various implications for the temporal emergence of the ‘winner–loser gap’, the specific timing and conditions under which they are triggered remain underexplored. Several studies utilizing panel data collected before and after elections confirm that winners and (or) losers assess the political system differently before and after elections have been held (e.g. Blais and Gélineau Reference Blais and Gélineau2007; Esaiasson Reference Esaiasson2011; Halliez and Thornton Reference Halliez and Thornton2022; Janssen Reference Janssen2023; Reller et al. Reference Reller, Anderson and Kousser2022; Singh et al. Reference Singh, Karakoç and Blais2012). Dahlberg and Linde (Reference Dahlberg and Linde2017) demonstrate that these differences remain very stable over the electoral cycle, and Nemčok (Reference Nemčok2020) reports no immediate changes when elected governments enter office. While these findings bring important insights into the temporal dynamics of the ‘winner–loser gap’, they remain inconclusive in understanding the complete pattern of its initial emergence. In the following, I propose a theoretical framework for understanding how the ‘winner–loser gap’ unfolds in two stages: a short-term phase, marked by immediate attitudinal adjustments to the election outcome, and a long-term phase, characterized by prolonged polarization between winners and losers in the post-election period. While this paper does not directly test the causal mechanisms underlying these two stages, it advances the field by offering a structured approach to conceptualizing these hitherto underexplored dynamics.
Short-term effects: immediate responses to the outcome
The establishment of an election outcome signifies the culmination of a lengthy electoral process, concluding months of campaigning and determining who will assume power. This decisive moment not only identifies the winners and losers but also establishes the trajectory for political decision-making in the years ahead. Such a significant event is likely to attract widespread attention, triggering spontaneous reactions among voters through systematic and heuristic processing.
Systematic processing may contribute to immediate responses in two ways. First, prior to the solidification of the result, some voters may have carefully considered how each outcome might affect the state of democracy. However, since systematic processing tends to be influenced by motivated reasoning (Chaiken and Ledgerwood Reference Chaiken and Ledgerwood2012; Taber and Lodge Reference Taber and Lodge2006), voters are likely to have downplayed indications that their favored candidate could harm the proper functioning of democracy while remaining receptive to signs that the opponent might pose a threat (Kunda Reference Kunda1990). As a result, winners and losers are expected to enter election day with diverging perceptions, and once the outcome solidifies, adjust their satisfaction with democracy accordingly.
Second, even without candidate-specific biases, motivated reasoning may influence how voters respond to the outcome. Winners, perceiving the outcome as positive, are inclined to find justifications for its legitimacy, leading them to believe that the political system, in producing this result, functions as it should. Conversely, losers, dissatisfied with the outcome, become prone to question its output and, in turn, look for flaws in its functioning (Kunda Reference Kunda1990; Taber and Lodge Reference Taber and Lodge2006).
When responding to the result, voters may also rely on simplistic cues, such as their emotions and partisan identity. For instance, as winning and losing trigger distinct emotions, winners, feeling positive about the outcome, are inclined to appreciate the performance of the political system, boosting satisfaction with democracy. In contrast, losers, experiencing negative emotions, are inclined to feel more disturbed over their functioning, leading to more negative evaluations. Footnote 1 Additionally, by adopting heuristics such as ‘my own group can be trusted’, winners may infer that the political system will be managed by reliable in-group actors who respect democratic norms. Conversely, losers applying this same heuristic may see the political system as becoming controlled by less trustworthy out-group actors, heightening concerns about the state of democracy.
The timing at which the outcome solidifies and triggers these voter responses may vary from case to case. In non-competitive elections, the result may be foreseeable during the campaign, enabling voters to anticipate the result early on. Still, due to the many factors that may quickly change public opinion, it is likely unusual for voters to feel entirely certain about the outcome before the official announcement, even when polls indicate a favorite. Therefore, attitudinal responses should typically be expected on election night when preliminary results are reported. However, in situations without a clear winner – where parties must negotiate to form a coalition – the impact may not be visible until these negotiations conclude and an agreement is publicly announced. Footnote 2
The logic behind these mechanisms is equally applicable to individuals experiencing repeated victories or losses. For instance, current winners are expected to experience happiness and relief upon securing another electoral win, while also being prone to seeking justifications for the accuracy of the result. This discussion leads to the first hypothesis:
Short-Term Hypothesis: As soon as an election outcome is established, winners’ satisfaction with democracy increases, while losers experience a corresponding decline.
Long-term effects: navigating the post-election landscape
In the post-election period, immediate short-term effects are likely to be magnified by various long-term influences. Following the establishment of an election outcome, voters enter a complex political landscape, encountering an abundance of new information related to the election result – from retrospective campaign analyses and expert forecasts to elite statements and peer reactions. As voters learn more about the implications of the outcome, they continue to update their attitudes through systematic and heuristic processing. While some voters may have a clear sense of the outcome’s consequences from the start, leading to only minor attitude adjustments, many will likely gain a deeper understanding gradually, leading to an extended period of attitudinal polarization.
Motivated reasoning fosters biased information processing and selective exposure to arguments. Biased information processing implies that individuals subconsciously perceive arguments supporting their position as stronger and more convincing than counterarguments, while simultaneously investing more time and cognitive resources in opposing arguments that contradict their stance (Kunda Reference Kunda1990; Taber and Lodge Reference Taber and Lodge2006). As voters engage with elite statements, expert analyses, and peer reactions in the aftermath of an election, winners, optimistic about the outcome, are anticipated to be more easily convinced by positive interpretations and analyses. Conversely, when confronting incongruent information, winners are expected to be more critical and allocate more time and cognitive resources to counterargue it. This pattern also holds true for losers, leading to a gradual widening of attitudinal differences as new information is processed after the election (Taber and Lodge Reference Taber and Lodge2006).
Meanwhile, selective exposure implies that individuals are prone to actively seeking out information that aligns with their pre-existing views. Numerous studies illustrate how this behavior prompts voters to mainly seek out news and information that reinforces their existing values (e.g. Arceneaux and Johnson Reference Arceneaux and Johnson2013; Goldman and Mutz Reference Goldman and Mutz2011; Prior Reference Prior2007). Following an election, winners can be expected to turn to sources interpreting the outcome more positively, offering analyses that project a bright future. In contrast, losers likely resort to sources providing more critical interpretations, presenting negative coverage of the new political landscape. This information-seeking behavior leads winners to encounter and accumulate more positive interpretations than losers.
In addition to motivated reasoning, heuristic processing is likely to contribute to further winner–loser polarization following the establishment of the election results. For instance, as voters learn more about the new government’s policy platform, winners may experience additional positive emotions if policies align with their interests, while losers experience heightened frustration, anger, or anxiety. Cue-taking can also be expected to play a particularly prominent role at this stage. This route to attitude formation is especially common when individuals face new and complex situations, forcing them to rely on the judgment of others due to limited knowledge (Murakawa and Gilens Reference Murakawa and Gilens2022).
In the uncharted post-election landscape, voters are anticipated to receive cues from elites and peers regarding the implications of the outcome. When encountering elite cues, voters tend to place greater trust in signals originating from in-party candidates and party-affiliated media outlets (Clayton and Willer Reference Clayton and Willer2023; Daniller Reference Daniller2016; Lelkes Reference Lelkes2016). As signals and statements about future prospects typically are more encouraging and optimistic from winning elites compared to those of the losing camp, it is anticipated that elite cue-taking will contribute to the widening of the ‘winner–loser gap’. While potentially less pronounced, voters may also discern elite skepticism regarding electoral integrity. Senninger et al. (Reference Senninger, Bækgaard and Seeberg2023) find that even in Denmark, one of the world’s most robust democracies, losing candidates express greater concerns about electoral fairness than their winning counterparts. Although Fortin-Rittberger et al. (Reference Fortin-Rittberger, Harfst and Dingler2017) find that actual instances of electoral fraud do not widen the ‘winner–loser gap’ – and may even reduce it – the gap could deepen if defeated elites signal unfounded concerns about electoral integrity to their supporters.
Moreover, as social networks tend to form around shared values, beliefs, and political ideologies (Huber and Malhotra Reference Huber and Malhotra2017; McPherson et al. Reference McPherson, Smith-Lovin and Cook2001), it is likely that a greater proportion of winners’ closest peers are also winners, and vice versa for losers. Consequently, cue-taking from trusted peers in the post-election period is likely to reinforce initial winner–loser attitudes, contributing to further polarization (Levendusky et al. Reference Levendusky, Druckman and McLain2016). Footnote 3
In summary, the posited long-term effects are driven by voters’ engagement with new information after the election outcome is established. As voters navigate the information-rich post-election environment, they are inclined to biased information processing and partisan cue-taking from elites and peers. This is expected to gradually increase the ‘winner-loser gap’ in the post-election period, leading to the formulation of the second hypothesis:
Long-Term Hypothesis: The ‘winner-loser gap’ grows gradually following the establishment of the election outcome.
Data and methods
Data
The study relies on data from the ESS, rounds 1–10, covering 21 elections. Footnote 4 These are all listed in the online Appendix A, where each election is described and the date of the emergence of the final election result is also uniquely identified. To serve as an example, the first case is the Italian general election held in April 2006. The incumbent Prime Minister Silvio Berlusconi led the center–right coalition ‘House of Freedoms’, which lost against the center–left alliance ‘the Union’, led by Romano Prodi. With over 38 000 000 votes, only 24 000 separated the two blocks, making the winning margin less than 0.1%. On the 11th of April, Prodi claimed victory, but Berlusconi wanted a recount of some districts and therefore did not admit defeat. On the 19th of April, the Italian Supreme Court ruled that Prodi had won the election (BBC, 2006). Since the election result was settled by the court, and they are the ones who announced the final outcome, I use the 19th of April as the cut-off point.
Most of the elections included in the study are ‘least likely’ cases, in the sense that they were held in consolidated democracies with proportional systems for electing their executives. In such settings, the ‘winner–loser gaps’ are typically smaller (Anderson and Guillory Reference Anderson and Guillory1997). However, notable exceptions exist. For instance, Greece in 2009 used a system that awarded the winning party 50 ‘bonus’ seats in parliament, effectively resembling a majoritarian system. Footnote 5
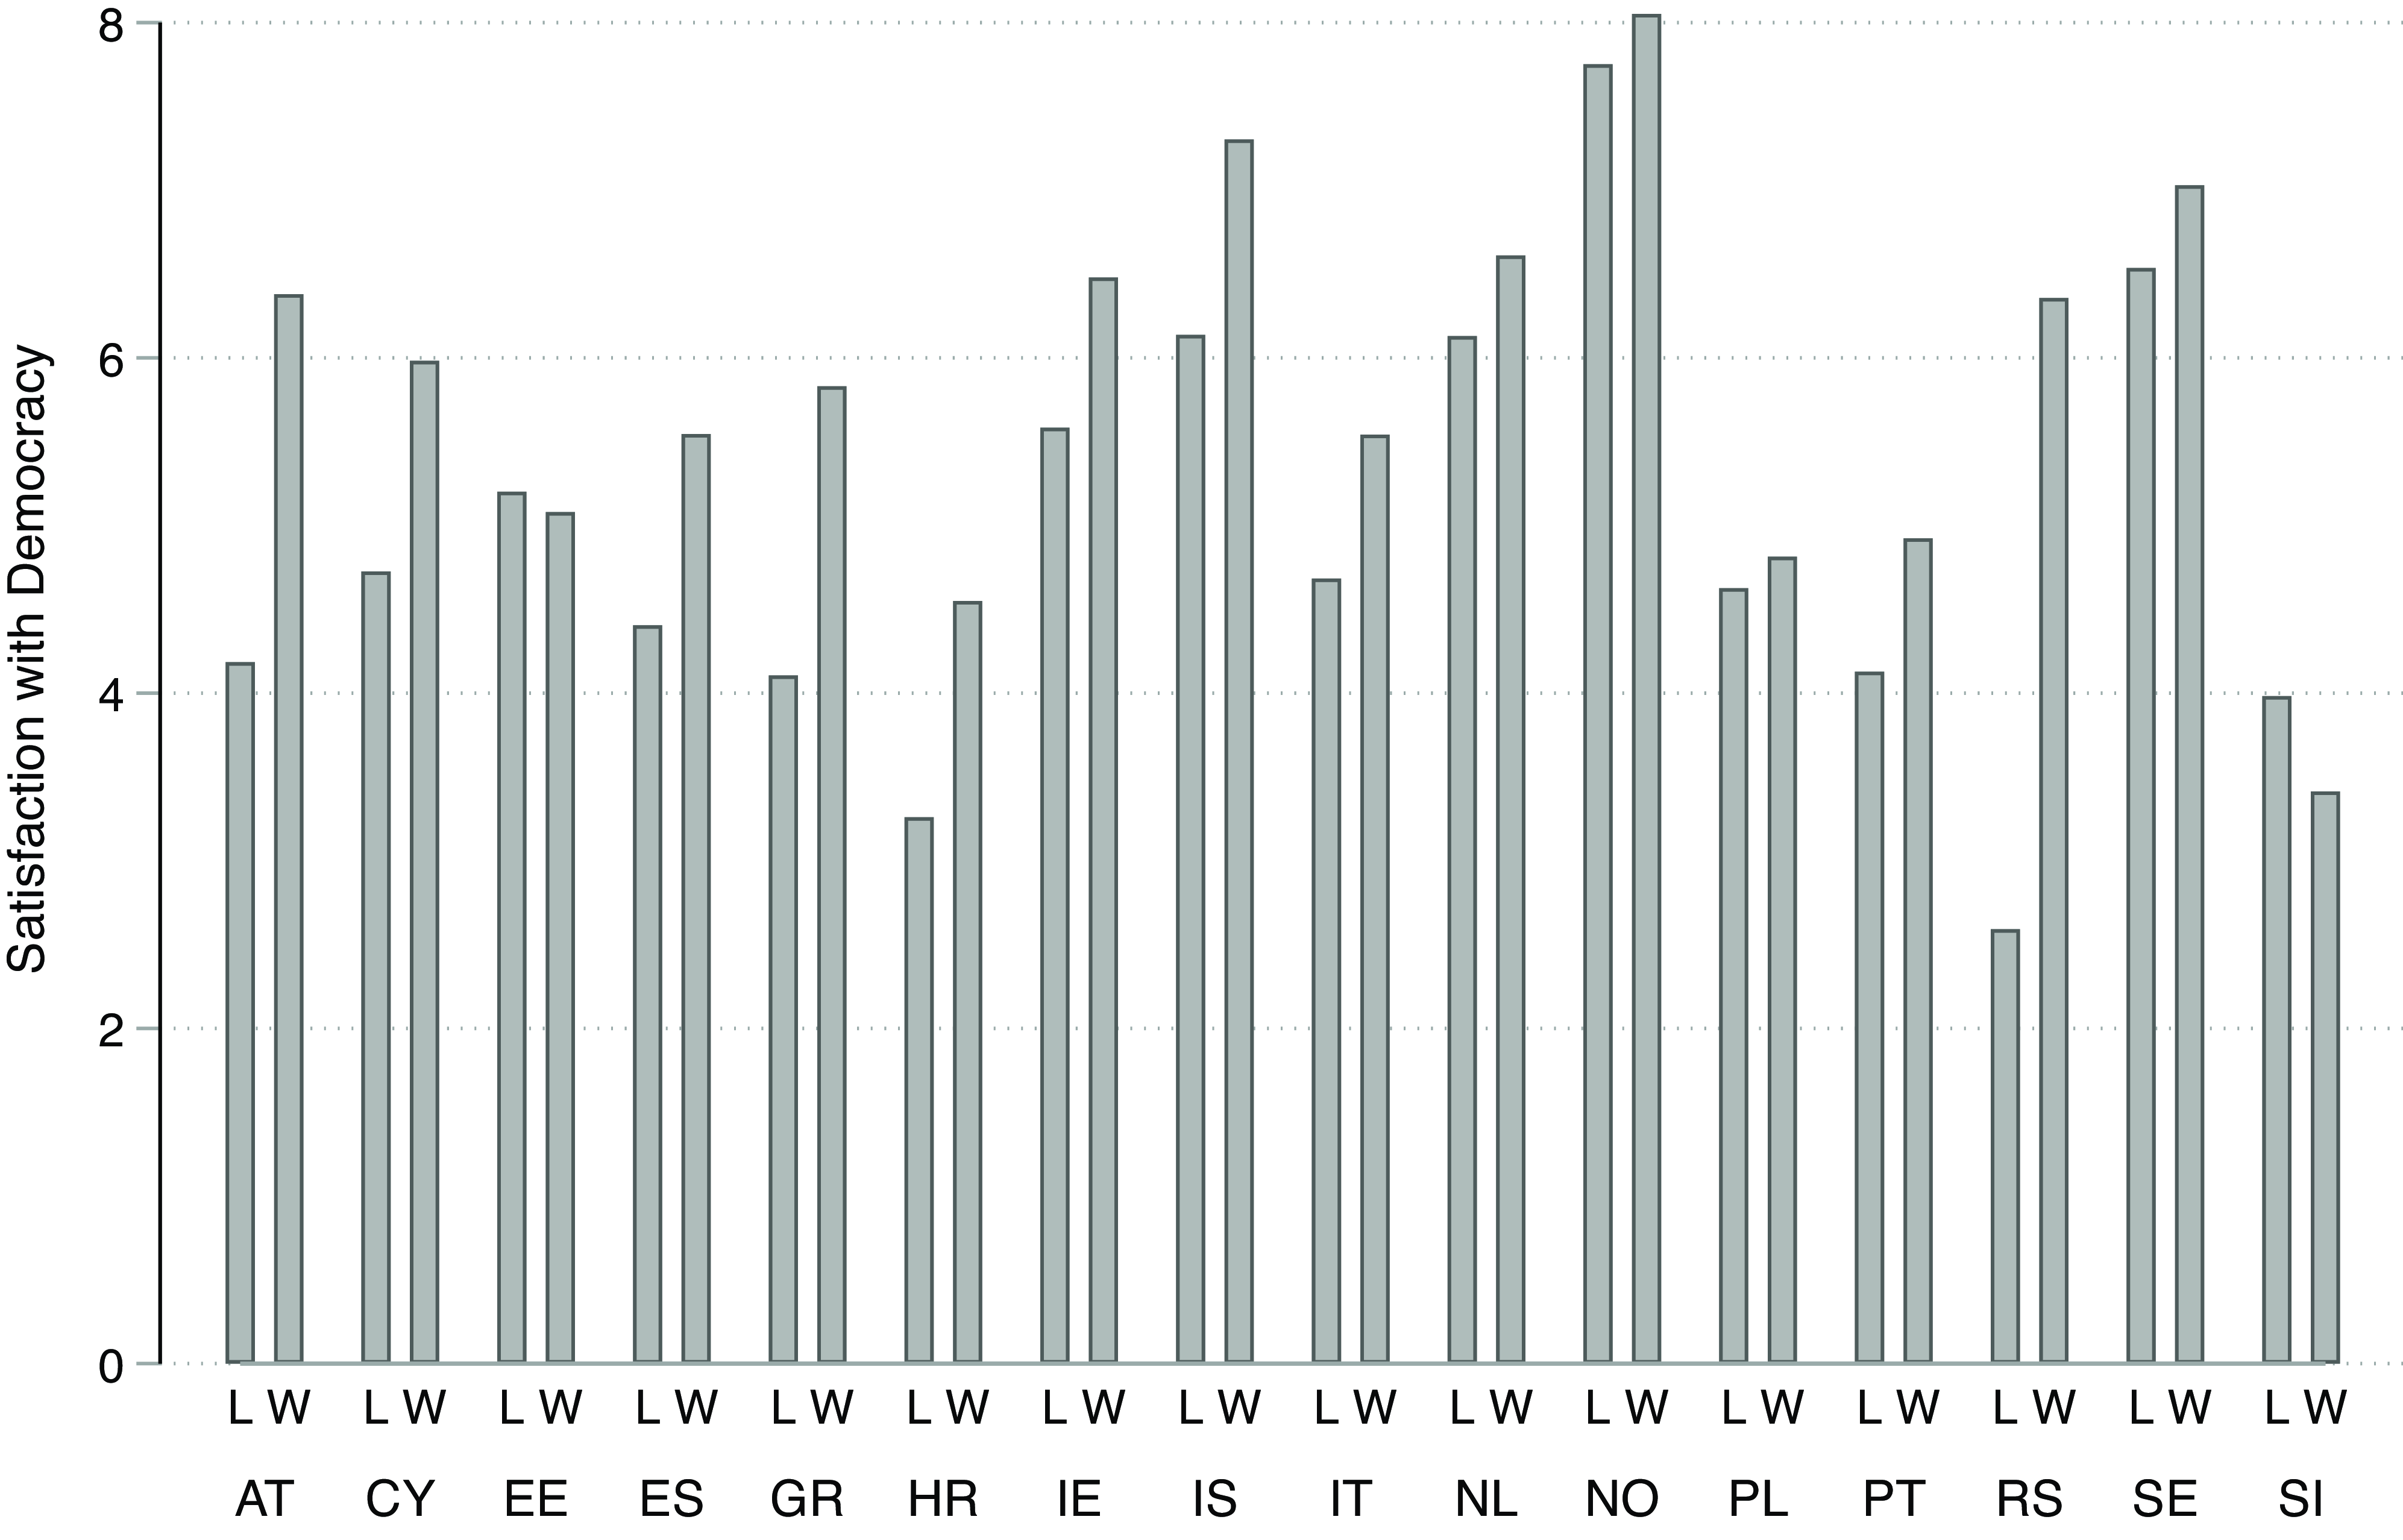
Figure 1 reveals that the correlation between supporting a party that is currently in opposition and feeling less satisfied with democracy is strongly present within the sample. Only in Estonia and Slovenia, the relationship is missing. The overall ‘winner–loser gap’ is highly statistically significant, and the estimate remains significant even when controlling for conventional confounders, such as age, gender, education, satisfaction with the state of the economy, political interest, and left-right self-placement (see Table B1, Appendix B). This is reassuring, as it suggests that if the short- and long-term mechanisms indeed explain the emergence of the gap, it should be evident in the sample.
Satisfaction with democracy among losers (L) and winners (W), by country. I follow the standard procedure and code those in support of the executive at the time as winners and those in support of the opposition as losers. Observations: 18162 (data retrieved from the European Social Survey).

Variables
The independent variable is whether a person voted for a winning or losing party. I follow the conventional approach and code those who state that they feel closer to a party that ended up in government as winners and those who ended up in the opposition as losers (e.g. Curini et al. Reference Curini, Jou and Memoli2012; Dahlberg and Linde Reference Dahlberg and Linde2017). Footnote 6 Those without a preference for any party are excluded from the sample.
The main dependent variable is satisfaction with democracy. This is measured by the question ‘And on the whole, how satisfied are you with the way democracy works in [country]?’ The respondents could position themselves on an 11-point scale, from 0 (extremely dissatisfied) to 10 (extremely satisfied). While this measure clearly omits several aspects of system support, it is commonly acknowledged to reflect voter approval of the democratic process (Anderson and Guillory Reference Anderson and Guillory1997). Consequently, it is expected to capture something more fundamental about voter system support than a mere evaluation of the incumbent. It is also the survey item most commonly used in the literature on the ‘winner–loser gap’ (see, for instance, Anderson et al. Reference Anderson, Blais, Bowler, Donovan and Listhaug2005, Han and Chang Reference Han and Chang2016).
To control for election-specific effects, the basic model includes dummy variables for country and survey round. At the individual level, I add the standard controls for age (years), gender (male/female), and education (years of education). I also include a range of controls which have been shown to impact people’s evaluation of the political system (Anderson et al. Reference Anderson, Blais, Bowler, Donovan and Listhaug2005). Respondents with missing values in a given analysis were excluded using listwise deletion.
Estimating the short-term effects
The short-term effects are examined using a regression discontinuity in time design (RDiT), which estimates the difference of a value immediately before and after a known temporal cut-off point (Best and Wolf Reference Best and Wolf2015; Hausman and Rapson Reference Hausman and Rapson2018). In this case, it is applied to estimate the difference in system support among winners and losers from the day the election outcome is established to the subsequent day.
As the running variable, I use the dates that the individual interviews were conducted. Aside from the election outcome becoming known, there is no reason to expect the winners’ and losers’ system support to be a discontinued function of the dates of the interviews. Assuming that all other factors relevant in explaining system support are continuous on the day that the election outcome is settled, any positive jump in system support among the winners (or negative among the losers) can be attributed to the causal effect of this event (Angrist and Pischke Reference Angrist and Pischke2009).
I expect the risk of treatment and self-selection bias to be marginal. While the ESS theoretically could make a biased allocation of the treatment (inviting different types of voters to participate in the survey before and after the election outcome becomes known), in practice, their fieldwork is conducted independently of these events, and they use random sampling to get a representative selection of respondents (ESS Sampling Guidelines, 2018). Therefore, there is no reason to suspect there to be a biased difference between the voters they approached before and after the cut-off points.
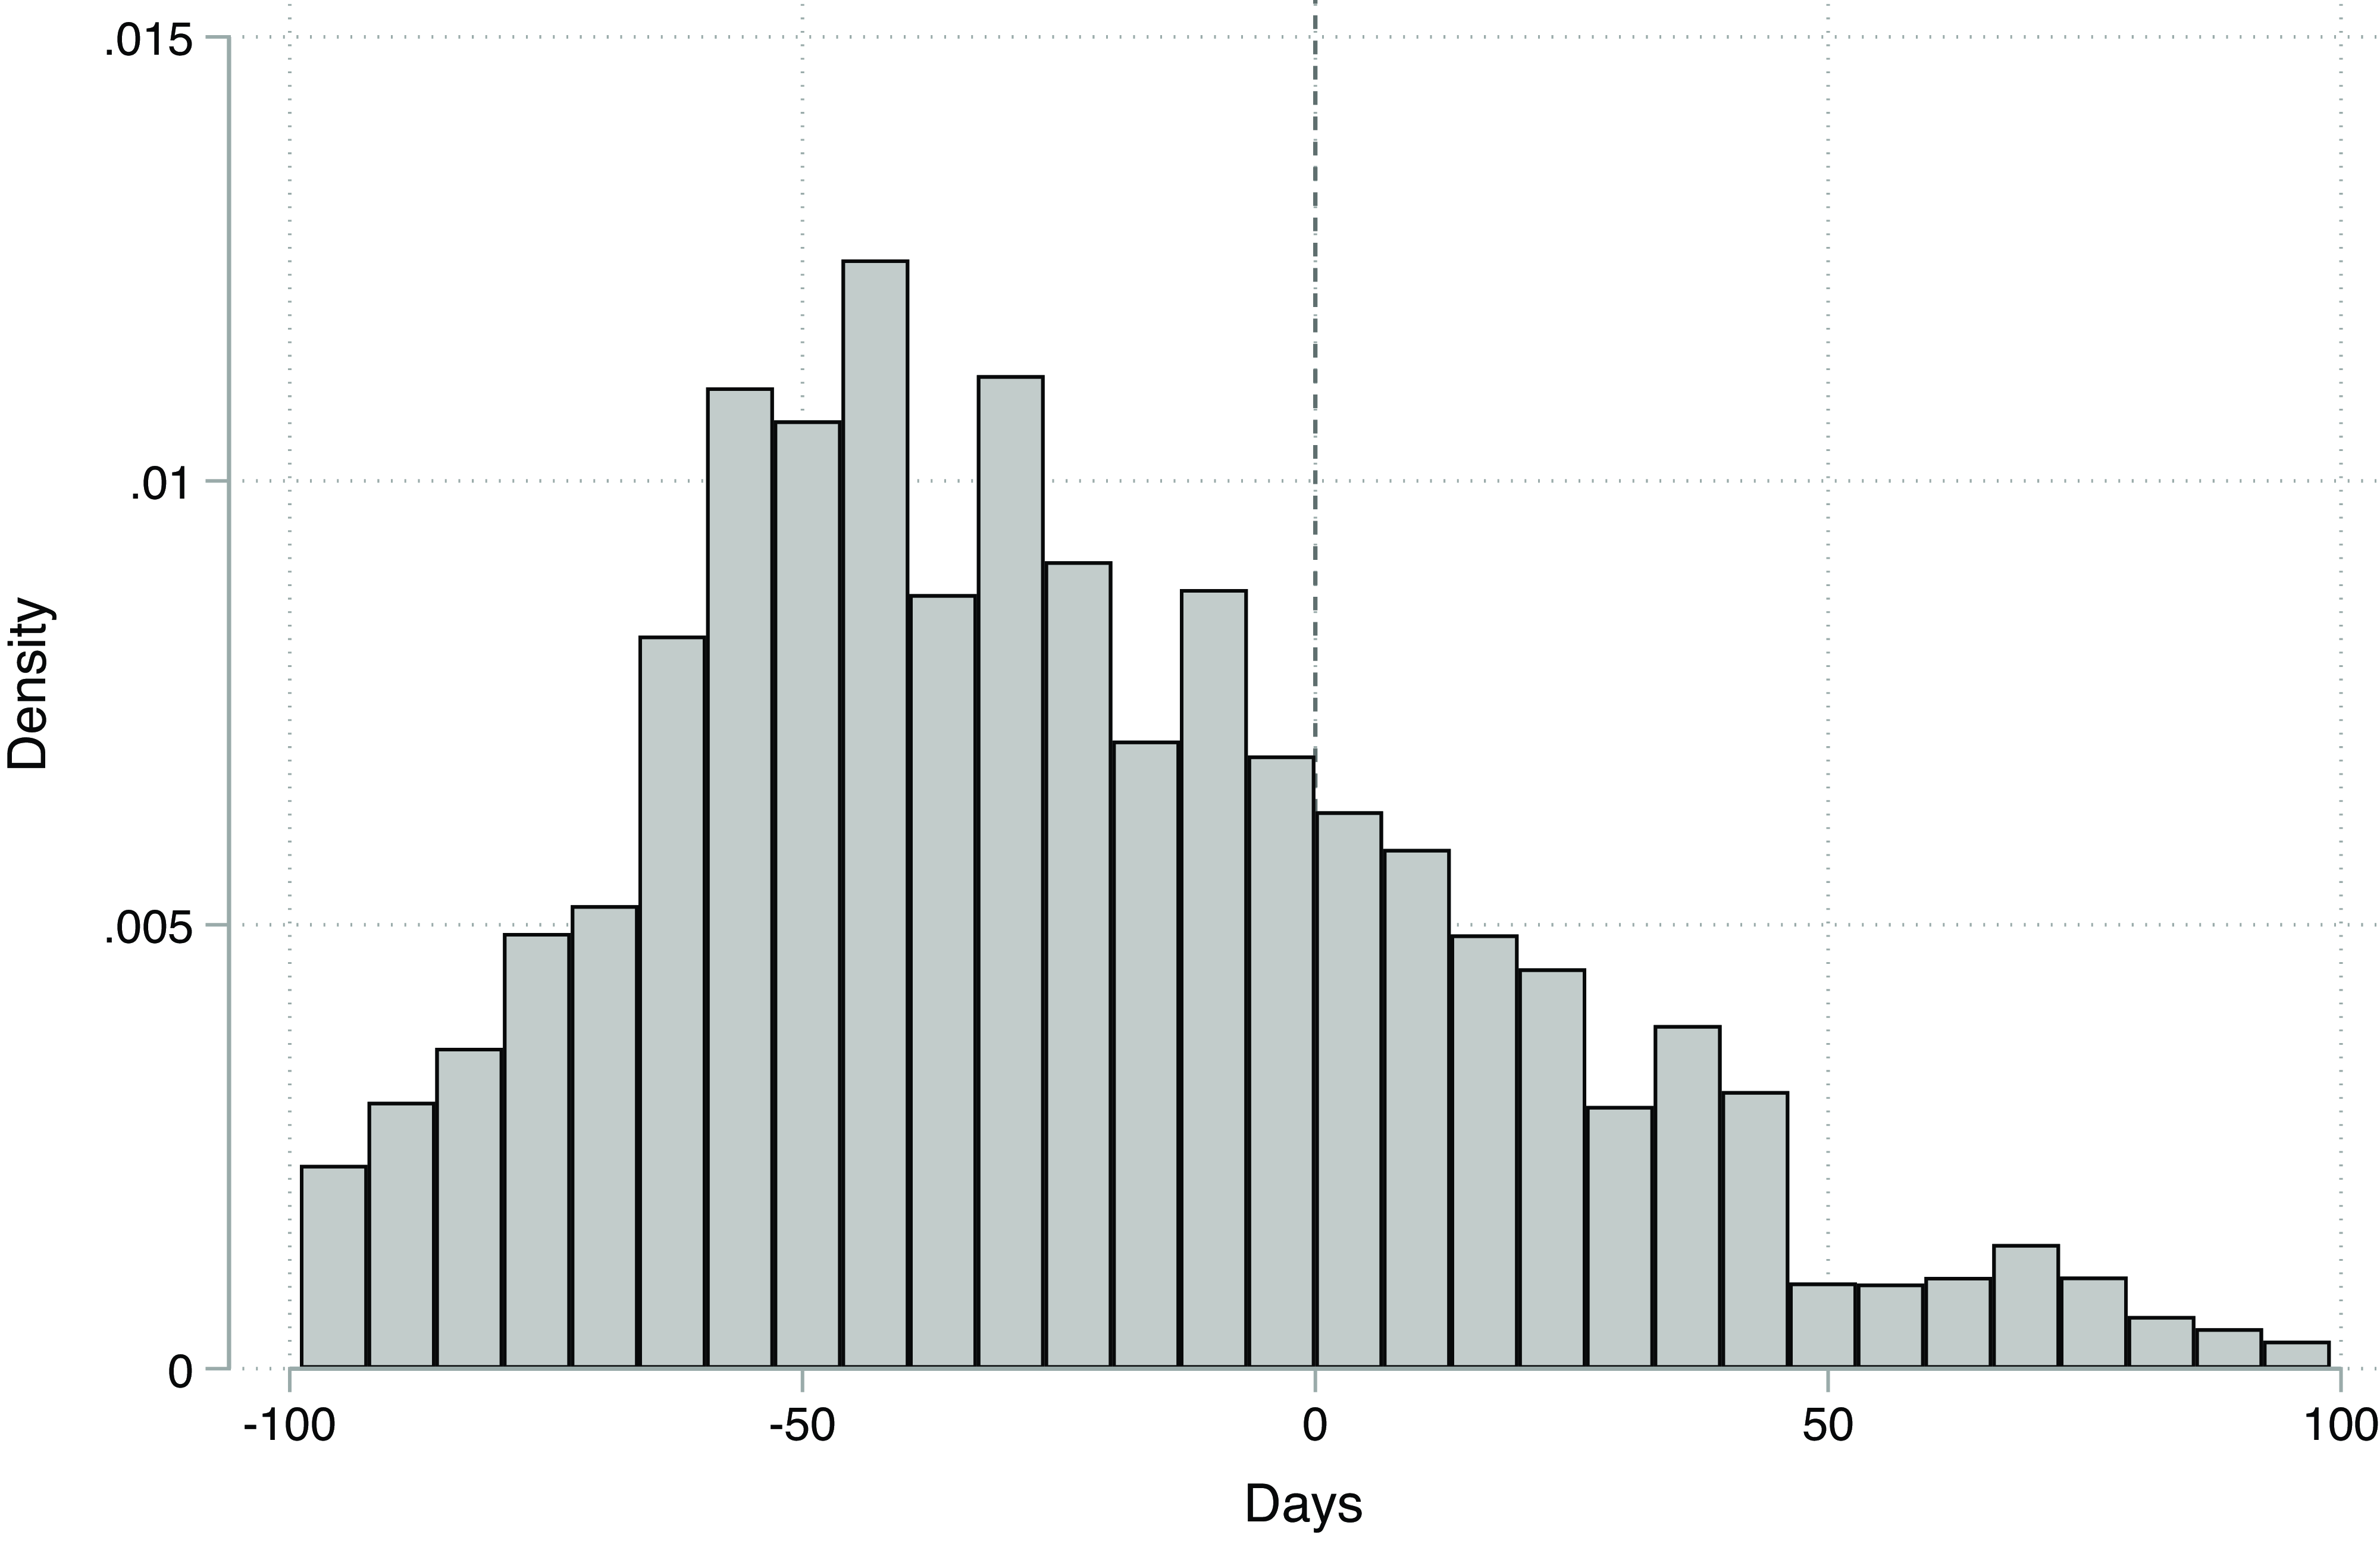
Perhaps of greater concern is the risk of self-selection bias. For instance, due to a lack of time, some groups of voters might abstain from participating in the survey while the election campaign is still running. Figure 2 illustrates the distribution of observations, indicating a relatively consistent pattern with no substantial evidence of sorting around the threshold. This is also confirmed when running a McCrary test, making a density plot before and after the cut-off (see Figure C1, online Appendix C). Footnote 7 To further ensure robustness, Figure 3 presents balance tests using multiple bandwidths. Footnote 8 These follow the recommendations by Muñoz et al. (Reference Muñoz, Falcó-Gimeno and Hernández2020), covering standard variables such as age, gender, education, and left-right self-placement, as well as ESS paradata on the number of contact attempts made before each interview was completed and the frequency of refusals to participate.
Histogram of 28 282 observations spread over the running variable (data retrieved from the European Social Survey).

Balance tests: covariate differences between treated and control using different bandwidths, with 95% confidence intervals.

With the largest bandwidth, some imbalances are observed among winners and losers. Notably, in both instances, respondents in the treatment group required more contact attempts to complete the survey while being less likely to refuse participation. However, these patterns do not seem to stem from a sharp discontinuity at the cut-off point. Rather, they appear to reflect a trend where later survey participants tend to require more contact attempts and show fewer refusals. When a lagged dependent variable is included to account for gradual temporal effects, as recommended by Hausman and Rapson (Reference Hausman and Rapson2018), these imbalances lose statistical significance (not reported). Moreover, as the bandwidth narrows, the observed imbalances diminish among winners and losers. At the 16-day bandwidth, the only imbalance remaining significant is that losers in the treated group are slightly more likely to report holding citizenship.
The analysis relies on the 16-day bandwidth, which is the most balanced and provides the most rigorous test for causal inference. Using the standard criteria of 80% power, power tests confirm that this bandwidth offers sufficient statistical power to detect shifts in system support of less than 0.4 standard deviations, closely following the criteria set by Muñoz et al. (Reference Muñoz, Falcó-Gimeno and Hernández2020). However, all bandwidths are tested, with the widest bandwidth offering over a 99% chance of detecting shifts as small as a quarter of a standard deviation (see Figures B1–B2, Appendix B). At each bandwidth, I also test including controls for any previously observed imbalances, but these adjustments do not impact the results.
To ensure that the results are not biased by losers being less inclined to participate in the surveys post-defeat, I also run models assessing the number of winners and losers participating before and after the threshold (see Table C2, Appendix C). Here, the groups appear well-balanced across all bandwidths.
To prevent gradual long-term effects from biasing the short-term estimates and to address potential autoregression, I follow the recommendations of Hausman and Rapson (Reference Hausman and Rapson2018). Specifically, I verify that the estimates remain robust both when including a lagged dependent variable from the previous day as control and clustering standard errors at the country/survey round level (Hausman and Rapson Reference Hausman and Rapson2018, pp. 19–22).
I examine the responses of winners and losers separately, letting winners who participated before the results were presented serve as a baseline for winners who participated when the results were known, and correspondingly for the losers. I do this employing the ‘RDrobust-package’ (Calonico, Cattaneo, and Titiunik Reference Calonico, Cattaneo and Titiunik2015), which makes data-driven statistical inferences, constructing two local linear regressions above and below the threshold, where the treatment effect is measured as the difference between the two intercepts. By default, I use robust confidence intervals for the average treatment effect at the cut-off point, unless alternative specifications are explicitly mentioned (Calonico et al. Reference Calonico, Cattaneo and Titiunik2015). Finally, I use the Epanechnikov kernel function, which is commonly applied in RDs, because it minimizes the least mean squared error at the cut-off (Al-Razzaq et al. Reference Al-Razzaq and Mohammad2023), though uniform and triangular are also tried with similar results.
To facilitate the interpretation of the interaction effect between being a winner/loser and knowing the election outcome, the results for the winners and losers are presented in separate figures. The RDiT design is thereby specified as:
 $${y_i}=\alpha+\beta 1\left( {{D_i}} \right)+\beta 2\left( {{D_i}\; \times Day{s_i}} \right)+{{X_i}^\prime}\gamma +{\epsilon_i},$$
where ${y_i}$
is the level of satisfaction with democracy for winner (or loser) i,
${y_i}$
is the level of satisfaction with democracy for winner (or loser) i, $\alpha $
is the intercept, representing the expected outcome when the running variable (Days) is zero,
$\alpha $
is the intercept, representing the expected outcome when the running variable (Days) is zero, $\beta 1\left( {{D_i}\;} \right)$
is the treatment effect, where D
i
is a dummy variable that takes the value 1 for winners (or losers) if the election outcome has been established, and 0 if it has not,
$\beta 1\left( {{D_i}\;} \right)$
is the treatment effect, where D
i
is a dummy variable that takes the value 1 for winners (or losers) if the election outcome has been established, and 0 if it has not, $\beta 2\left( {{D_i}\; \times Day{s_i}} \right)$
is the effect of the running variable, which measures how many days before or after the election results were presented that a respondent participated in the survey. The interaction term
$\beta 2\left( {{D_i}\; \times Day{s_i}} \right)$
is the effect of the running variable, which measures how many days before or after the election results were presented that a respondent participated in the survey. The interaction term ${D_i}\;$
allows for different slopes before and after the election outcome has been decided.
${D_i}\;$
allows for different slopes before and after the election outcome has been decided. ${{X_i}^\prime}\gamma $
is the effect of the covariates represented by
${{X_i}^\prime}\gamma $
is the effect of the covariates represented by ${{X_i}^\prime}$
, and
${{X_i}^\prime}$
, and $\gamma $
is the vector of coefficients associated with the covariates.
$\gamma $
is the vector of coefficients associated with the covariates. ${\epsilon_i}$
is the error term, representing unobserved factors affecting the outcome that are not included in the model.
${\epsilon_i}$
is the error term, representing unobserved factors affecting the outcome that are not included in the model.
Estimating the long-term effects
The long-term effects are anticipated to unfold gradually in the post-election period. Examining this pattern necessitates a model that captures changes in satisfaction with democracy over a continuous timeframe rather than at a single moment. Ideally, I would have been able to assess the development of the ‘winner–loser gap’ day by day. However, the daily number of observations is too few for such estimates. Instead, I organize observations within the same week and analyze the evolving attitudes of winners and losers week by week. Employing each week as a dummy variable enables me to plot the temporal progression of winner–loser attitudes with 95 per cent confidence intervals for each week. This analysis is conducted using the following interaction model:
 $${y_i}=\alpha+\beta 1Week+\beta 2Winner+\beta 3\left(Week\times Winner\right)+{{X_i}^\prime}\gamma +{\epsilon_i},$$
where ${y_i}$
is the level of satisfaction with democracy for individual i,
${y_i}$
is the level of satisfaction with democracy for individual i, $\alpha $
is the intercept,
$\alpha $
is the intercept, $Week$
and
$Week$
and $Winner$
are dummy variables representing the number of weeks before or after the outcome solidified and the winner–loser status,
$Winner$
are dummy variables representing the number of weeks before or after the outcome solidified and the winner–loser status, $\beta 1$
and
$\beta 1$
and $\beta 2$
are the coefficients for the main effects of
$\beta 2$
are the coefficients for the main effects of $Week$
and
$Week$
and $Winner$
, respectively.
$Winner$
, respectively. $\beta 3$
represents the coefficient for the interaction term
$\beta 3$
represents the coefficient for the interaction term $Week \times Winner$
.
$Week \times Winner$
. ${{X_i}^\prime}\gamma $
is the effect of the covariates represented by
${{X_i}^\prime}\gamma $
is the effect of the covariates represented by ${{X_i}^\prime}$
, and
${{X_i}^\prime}$
, and $\gamma $
is the vector of coefficients associated with the covariates.
$\gamma $
is the vector of coefficients associated with the covariates. ${\epsilon_i}$
is the error term, representing unobserved factors affecting the outcome that are not included in the model.
${\epsilon_i}$
is the error term, representing unobserved factors affecting the outcome that are not included in the model.
Results
Assessing the short-term effects
The results for losers are illustrated in Panel A in Figure 4. Counter to expectations, there is no negative jump in the losers’ satisfaction with democracy immediately after the election outcome is established. While the line suggests a weak downward trend after the cut-off, the model shows no significant difference between the intercepts. The results remain largely the same both when the controls are added (not reported) and the bandwidth is changed to only include observations 30, 20, and 16 days before and after the cut-off point (see Table B2, Appendix B). Moreover, using a subsample of respondents who self-report being politically interested does not change the findings. This finding is unexpected because it rejects the Short-Term Hypothesis, stating that the electoral losers should become less satisfied with the way democracy works immediately when the election outcome becomes clear.
Satisfaction with democracy among winners and losers before and after election outcomes across different bandwidths, including a lagged dependent variable. Politically interested voters include those reporting being ‘very’ or ‘quite’ interested in politics. Observations: Panel A – 9626 (246 bins); Panel B – 8291 (226 bins); Panel C – 4574 (142 bins); Panel D – 991 (44 bins). Data retrieved from the European Social Survey.

Still, the results do not necessarily suggest that there are no short-term effects in European elections. Drawing on findings by Blais and Gélineau (Reference Blais and Gélineau2007) and Singh et al. (Reference Singh, Karakoç and Blais2012), the relationship could mainly stem from an increase in satisfaction among winners. Panels B–D show the differences in satisfaction with democracy among electoral winners before and after the election outcome solidified. While the marginal increase observed in Panel B for the overall sample does not reach statistical significance, a focused analysis of winners who self-report being politically interested does reveal a significant increase in system support immediately following the result’s establishment (Panel C). This finding is robust across all tested bandwidths. Importantly, as depicted in Panel D, the effect of approximately 0.6 unit changes remains significant at the 16-day bandwidth, where balance tests confirm no imbalances in potential covariates.
Moreover, the observed increase is precisely confined to the specified cut-off point – shifting the threshold by one day in either direction within the range of − 10 to + 10 days around the establishment of the outcome yields statistically insignificant results (see Figure B3, Appendix B). Additionally, the results remain robust when incorporating relevant controls and applying Hausman & Rapson’s (Reference Hausman and Rapson2018) recommended adjustments for potential autoregression (see Table B4, Appendix B).
In partial support of the Short-Term Hypothesis, the results indicate a robust and immediate increase in system support among politically interested winners. Next, I examine whether this represents the complete emergence of the ‘winner–loser gap’, or if long-term effects continue to influence voter attitudes in the post-election period.
Assessing the long-term effects
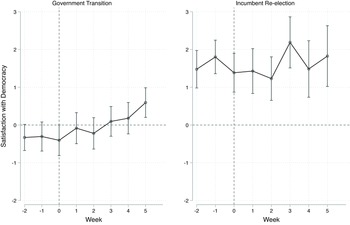
The long-term patterns are illustrated in Figure 5, where the solid line signifies the impact of winning an election on satisfaction with democracy, along with 95 per cent confidence intervals. Panel A displays this pattern in elections where a government transition occurred, while Panel B shows the pattern in cases of incumbent re-election. The vertical line at week zero indicates the point when the election outcome became definitive.
Panel A illustrates the emergence of the ‘winner–loser gap’ in elections where a government transition took place, with 95% confidence intervals. Observations: 3856. Panel B shows the ‘winner–loser gap’ in elections where the incumbent was re-elected. Observations: 1830. Both panels are constructed from pooled data across countries and account for country and year fixed effects, with controls for age, gender, education, political interest, left-right ideological placement, and household income.

In elections where a government transition occurred, traces of the former ‘winner–loser gap’ persist in the lead-up to the result’s establishment, with supporters of the outgoing government maintaining higher satisfaction with democracy than losers. Despite the immediate increase in system support among politically interested winners, as shown in Figure 4, no clear ‘winner–loser gap’ is present during the first week after the result is established. However, as the outcome becomes clear and the positions of winners and losers shift, a gradual change begins. Within the first two weeks, the old gap starts to diminish. In the subsequent weeks, voters continue to realign their positions, eventually giving rise to a new gap. These findings strongly support the long-term hypothesis, stating that the ‘winner–loser gap’ will evolve gradually in the weeks following the establishment of an election outcome.
Based on the premise that a prior ‘winner–loser gap’ persists throughout the campaign period, a different pattern is anticipated in elections featuring incumbent re-elections. In such instances, voters are presumed to be more closely aligned with their ‘correct’ positions before the election outcome solidifies, implying that their positions will remain relatively stable. To explore this, Panel B exclusively illustrates cases with incumbent re-elections. Footnote 9 In line with expectations, the pattern looks different in this context: the attitudes of winners and losers remain relatively stable, with a significant ‘winner–loser gap’ present throughout the period (for a more extensive time frame, see Figure B4, Appendix B).
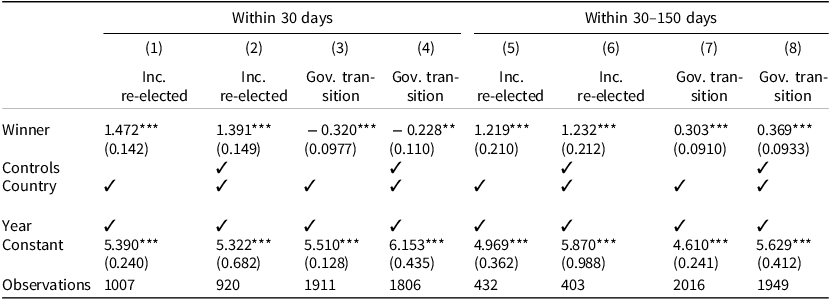
These findings are further corroborated in Table 1, where the relationships are tested in various models. Using a subsample exclusively containing observations from within 30 days following the establishment of the results, Model 1 confirms that in cases with incumbent re-elections, a traditional ‘winner–loser gap’ is present. Model 2 demonstrates the robustness of this relationship when including relevant controls. Meanwhile, in countries experiencing a government transition, Model 3 indicates the presence of a highly significant, reversed, ‘winner–loser gap’ during this period. The negative relationship persists even with the inclusion of controls, maintaining its robust significance. Exploring different time frames within the initial weeks following the solidification of the outcome yields similar results.
Comparing the ‘winner–loser gap’ in countries experiencing government transitions versus those with incumbent re-elections, within different periods after the election results were confirmed

Shifting the focus to a later period, models 5–8 reveal that regular ‘winner–loser gaps’ have become evident both when the incumbent was re-elected and when a government transition took place. In both instances, the gaps remain significant when accounting for relevant controls.
Elaborating on the long-term mechanisms
The long-term patterns are expected to arise from a combination of assessing new information, motivated reasoning, and cue-taking. These mechanisms offer distinct implications that may be further scrutinized. Taber and Lodge (Reference Taber and Lodge2006) demonstrate that motivated reasoning is more pronounced among individuals with stronger prior beliefs. In politics, this has been linked to ideological positioning, revealing a heightened bias among individuals identifying more with one side of a political spectrum compared to those who are neutral (Kahan Reference Kahan2013). While holding a radical ideological position may also influence satisfaction with democracy through mechanisms such as policy congruence, the effects of motivated reasoning are expected to be most pronounced among voters positioned at the ideological extremes compared to their more neutral counterparts.
Simultaneously, several studies report that individuals with less profound knowledge of a particular issue are more inclined to rely on cues when forming their opinions about it (Brader et al. Reference Brader, Tucker and Duell2013; Petty and Cacioppo Reference Petty, Cacioppo and Goldman1981; Reference Petty and Cacioppo1986). Therefore, individuals possessing less political knowledge are expected to depend more on picked-up cues when evaluating the political system compared to those with greater knowledge. To capture the extent to which voters possess relevant knowledge for evaluating the political system, I construct an index. This consists of items measuring time spent watching the news on TV and reading newspapers. Here, voters who stay less updated with the news are expected to possess less relevant knowledge for evaluating the functioning of democracy, making them more inclined to rely on cues.
To simplify the comparison of how the long-term effects unfold among the different sub-groups, the relationships are plotted linearly. The findings are presented in Figure 6.
The post-election dynamics among various sub-groups, with 95% confidence intervals. The dark line plots the satisfaction with democracy among losers, while the bright line denotes the winners. All panels are constructed from pooled data across countries and account for country and year fixed effects.

The top left-hand panel illustrates the pattern among moderate voters, situating themselves in the middle on the left–right scale, with the vertical line marking the solidification of the election outcome. Conversely, the top right panel depicts the same event among voters further out on either side of the left–right spectrum. In line with expectations, the changes are greater among voters with more distinct ideological positions. Among moderate voters, winners’ and losers’ attitudes evolve relatively similarly over time. In contrast, among more radical voters, the attitudes significantly diverge in the post-election phase. Although the observed difference does not reach conventional levels of statistical significance, these patterns strengthen the idea that motivated reasoning contributes to the long-term effects (see Table B6, Appendix B).
The second row distinguishes between large and small consumers of political news in traditional media. The left-hand panel illustrates the patterns among large consumers. Correspondingly, the right panel depicts the same event for voters staying less updated with the news. As anticipated, the effects are more vivid among the second group. Among heavy news consumers, only minor changes between winners and losers unfold over time. In contrast, among light consumers, the changes are substantial. This difference is highly statistically significant when testing it in an interaction model (see Table B7, Appendix B).
While this evidence is not conclusive for settling the causal mechanisms behind the long-term effects, it supports the idea that both motivated reasoning and cue-taking contribute to shaping the ‘winner–loser gap’ in the post-election period.
Summarizing the findings
In summary, the short-term hypothesis receives partial support: among winners with self-reported political interest, immediate short-term effects are observed directly following the establishment of election results. However, these attitudinal changes are insufficient to fully explain the emergence of the ‘winner–loser gap’. In line with the long-term hypothesis, the sample illustrates a gradual divergence in attitudes between winners and losers during the post-election period. Elections marked by incumbent re-elections reveal a significant gap throughout the election period. Conversely, in cases where government transitions took place, traces of the old ‘winner–loser gap’ remain observable immediately following the solidification of the results. However, as time goes by, a distinct gap gradually materializes. The long-term effects appear to be greater among voters identifying as more left or right, as well as among less politically knowledgeable voters, suggesting that both motivated reasoning and partisan cue-taking contribute to the unfolding of the gap.
Robustness checks
There is a discussion in the literature on the temporal dimension of the survey item ‘satisfaction with democracy’, where it has been argued that the word ‘satisfaction’ leads respondents to evaluate what has happened in the past (Kern and Kölln Reference Kern and Kölln2022). This could suggest that the null findings of short-term effects among losers do not exempt the possibility of an immediate effect, only that it is not captured with an item evaluating the past. Instead, it has been suggested to use items measuring political trust, because the word ‘trust’ contains a forward-looking element about future behavior. Therefore, I rerun all models using survey items that measure citizens’ trust in public officials, the police, and political parties. Still, the results do not change (see Table C1, Appendix C). I also run all the models using election day as the cut-off, and I experiment with a fuzzy cut-off point. However, both attempts yield similar results (see Table C3, Appendix C). Furthermore, I relax the linear assumption and try running the models as second- and third-degree polynomials, but this does not bring any changes (see Table C4, Appendix C). Moreover, social desirability could make voters in consolidated democracies unwilling to admit that their attitudes toward democracy are affected by election outcomes. This would mean that any attitudinal changes that occur get harder to capture when the average satisfaction levels are higher from the start. To test this, I rerun all models using a quadratic measure of the dependent variable. However, this does not affect the results (see Table C5, Appendix C).
Finally, winners’ and losers’ confidence in partisan state institutions is expected to mirror the patterns observed in their satisfaction with democracy. As a robustness test for the long-term effects, I conduct additional analyses by rerunning the long-term models using winners’ and losers’ trust in parliament. As illustrated by Figure 7, the results reveal similar patterns (for a more extensive discussion on the relationship between satisfaction with democracy and political trust, see Kern and Kölln Reference Kern and Kölln2022).
The left panel illustrates trust in parliament among winners compared to losers in elections that resulted in a government transition. Observations: 3758. The right panel displays the pattern in elections where the incumbent was re-elected. Observations: 1958. The vertical lines mark the establishment of the election outcome. Both panels are constructed from pooled data across countries and account for country and year fixed effects, with controls for age, gender, education, political interest, left-right ideological placement, and household income.

Discussion and conclusions
This study has examined the temporal emergence of the ‘winner–loser gap’ in system support. It brings two main contributions. Firstly, it provides a new theoretical framework, contending that the unfolding of the ‘winner–loser gap’ may be understood through short- and long-term effects. The short-term effects posit that voters may partly adjust their attitudes toward the democratic procedure already upon learning the election outcome. In contrast, long-term effects are triggered in the post-election period, contributing to an extended period of winner–loser polarization following the election.
Secondly, the empirical analysis reveals that, at least in the European context, it is the latter, long-term mechanisms that mainly explain how the ‘winner–loser gap’ originally takes form. While an immediate increase in satisfaction with democracy was visible among politically interested winners upon the establishment of the result, it was not sufficient to create a statistically significant ‘winner–loser gap’. In instances where a government transition occurred, it was not until a few weeks after the election outcome solidified that a fresh gap fully materialized. These gradual long-term effects seem more pronounced among voters with more distinct ideological positions and lower political knowledge, indicating that both motivated reasoning and partisan cue-taking play important roles in the post-election dynamics.
Unlike the sore loser in a traditional board game, the most pronounced voter responses do not seem to occur immediately and then cool off, but rather develop gradually and culminate later on. This finding has significant implications for understanding and addressing challenges related to system support during election times. Instead of focusing solely on immediate effects arising from spontaneous voter reactions, the results highlight the importance of considering long-term factors that shape winners’ and losers’ attitudes toward the political system in the post-election period.
However, it is crucial to bear in mind that the results are based on European elections between 2004 and 2021. The balance between short- and long-term effects may vary across different contexts. For instance, majoritarian systems may experience greater short-term effects due to higher-stakes elections, where only the winners gain representation. Moreover, the distribution between short- and long-term effects may fluctuate over time. For instance, Janssen (Reference Janssen2023) reports that political polarization amplifies the gap. This may be driven by increased short-term effects, due to elevated stakes in elections, as well as long-term effects, such as cue-taking from more polarized candidates and media platforms. Finally, the temporal dynamics of the gap’s emergence may also be influenced by election competitiveness. If voters are able to predict the outcome with a high degree of certainty, they may begin adjusting their attitudes in advance. As patterns may vary under different circumstances, similar investigations should be undertaken using a wider range of different cases.
Supplementary material
To view supplementary material for this article, please visit https://doi.org/10.1017/S1475676525100157
Data availability statement
A replication package, including the full syntax and instructions for accessing the publicly available datasets, is available in the Harvard Dataverse repository: https://doi.org/10.7910/DVN/67PGHQ
Acknowledgements
The author is grateful for invaluable feedback from Karl Loxbo and Sirus Håfström Dehdari, as well as from participants at the 2023 Swedish Political Science Association Conference and the 2024 European Social Survey Conference, where earlier versions of this paper were presented. Finally, I thank the four anonymous reviewers whose insightful comments substantially helped improve the quality of the paper.
Funding statement
This research received no specific grant from any funding agency in the public, commercial, or not-for-profit sectors.




 Open access

