

1 Introduction
Belief in conspiracy theories, alternative explanations for important events that assume the existence of secret plots by powerful and malicious groups (e.g., Reference GoertzelGoertzel, 1994), have been a common encounter in our social lives for quite some time. For instance, in 2013, it was found that over a third of Americans did not believe that global warming was real (Reference SwiftSwift, 2013). Yet, especially with the rise of the COVID-19 pandemic, discussions concerning conspiracy beliefs have become even more prevalent, among psychology researchers as well as laypeople. Growing effort has been put into trying to uncover the psychological mechanisms underlying such beliefs, and rightly so. Belief in conspiracy theories can have far reaching negative consequences for society as a whole as well as for the individual believer (Allington et al., 2020; Reference Douglas and SuttonDouglas & Sutton, 2015; Reference Jolley, Douglas, Leite and SchraderJolley et al., 2019; Reference Jolley, Meleady and DouglasJolley et al., 2020), such as reducing willingness to vaccinate against serious diseases and viruses (Reference Bertin, Nera and DelouvéeBertin et al., 2020; Reference Romer and JamiesonRomer & Jamieson, 2020).
Researchers have revealed several predictors of conspiracy beliefs (Reference van Mulukom, Pummerer, Alper, Bai, Čavojová, Farias and Žeželjvan Mulukom et al., 2022). From the personality literature, it is evident that demographic variables such as age (Reference Pizarro, Cakal, Méndez, Da Costa, Zumeta, Gracia Leiva and CavalliPizarro et al., 2020; Reference Juanchich, Sirota, Jolles and WhileyJuanchich et al., 2021), personality traits (Reference Bowes, Costello, Ma and LilienfeldBowes et al., 2020; Reference March and SpringerMarch & Springer, 2019), and how one reacts to threat and uncertainty (Reference Heiss, Gell, Röthlingshöfer and ZollerHeiss et al., 2021) influence conspiracy beliefs. From the social domain, although less attended to, research has pointed towards the importance of social context (Reference Alper, Bayrak and YilmazAlper, 2021; Reference van Prooijen, van Lange, Prooijen and van Langevan Prooijen & van Lange, 2014), normative influence (Reference Cookson, Jolley, Dempsey and PoveyCookson et al., 2021) and group membership (Reference Cookson, Jolley, Dempsey and PoveyCookson et al., 2021a,b; Reference Imhoff and BruderImhoff & Bruder, 2014). From the cognitive domain, and the focus of this meta-analysis, ample evidence now indicates that reasoning processes and biases such as an individual’s tendency to think reflectively can predict their tendency to believe in conspiracy theories (e.g., Reference Alper, Bayrak and YilmazAlper et al., 2021; Reference MikuškováMikušková, 2017; Reference Pytlik, Soll and MehlPytlik et al., 2020; Reference Ståhl and van ProoijenStåhl & van Prooijen, 2018; Reference Swami, Voracek, Stieger, Tran and FurnhamSwami et al., 2014). Many studies show that individuals who think reflectively (i.e., analytically, deliberately) are less inclined to believe in conspiracy theories compared to individuals who think intuitively (i.e., experientially), showing that cognitive reflection can act as a buffer against conspiracy beliefs (e.g., Reference Alper, Bayrak and YilmazAlper et el., 2021; Reference MikuškováMikušková, 2017; Reference Pytlik, Soll and MehlPytlik et al., 2020; Reference Ståhl and van ProoijenStåhl & Van Prooijen, 2018; Reference Swami, Voracek, Stieger, Tran and FurnhamSwami et al., 2014). However, to date, there has been no attempt to systematically review, meta-analyze or test the probability of publication bias in this body of work. The current meta-analysis aims to address this gap.
1.1 Testing The Link Between Cognitive Reflection And Conspiracy Beliefs
The link between reflective thinking and conspiracy beliefs has been tested in a variety of ways, though mainly via correlational methods. Regarding the assessment of conspiracy beliefs, researchers have applied both generic, such as the ‘Generic Conspiracy Beliefs Scale’ (GCBS; Reference Brotherton, French and PickeringBrotherton et al., 2013), which capture individuals’ generalized tendency toward conspiracy theorizing and more specific measures, such as the ‘Belief in Vaccine Conspiracy Theories Scale’ (VCBS; Reference Shapiro, Holding, Perez, Amsel and RosbergerShapiro et al., 2016), which capture belief in a specific set of conspiracy theories. Notably, this body of work has conceptualized reflective thinking in many different ways, typically addressing it as either reflective (Reference Sadeghiyeh, Khanahmadi, Farhadbeigi and KarimiSadeghiyeh et al., 2020), analytic thinking (Reference Swami and BarronSwami & Barron, 2021; Stanley et al., 2021), rational thinking (Reference Georgiou, Delfabbro and BalzanGeorgiou et al., 2019) or critical thinking (Reference Lantian, Bagneux, Delouvée and GauvritLantian et al., 2021). However, they all refer to the same sort of underlying construct, namely, the tendency to engage in reflective and deliberative thought processes as opposed to more automatic and intuitive thought processes (Reference FrederickFrederick, 2005; Reference Evans and StanovichEvans & Stanovich, 2013). For the purpose of uniformity, we refer to this construct as reflective thinking throughout this paper.
In terms of operationalizing reflective thinking, correlational studies have mainly preferred one of two ways – applying either performance-based or self-report measures. The most typical performance-based measures is the Cognitive Reflection Test (CRT; Reference FrederickFrederick, 2005). In this test individuals are presented with three different problems. Importantly, there is both an intuitive (low effort) and an analytic (high effort) answer to each problem. For example, for the problem “A bat and a ball cost $1.10. The bat costs $1.00 more than the ball. How much does the ball cost?”, the intuitive answer occurring to many people would be 10 cents. However, through reflection, it can be calculated that the correct answer is actually 5 cents. Thus, higher scores on the CRT capture an individual’s tendency toward reflection, whereas lower scores capture the tendency to think intuitively. Different variations of the CRT have been applied (Reference Thomson and OppenheimerThomson & Oppenheimer, 2016; Reference Primi, Morsanyi, Chiesi, Donati and HamiltonPrimi et al., 2016), but importantly, a recurring finding in the literature is that higher scores on the CRT are associated with lower conspiracy beliefs (Reference Adam‐Troian, Caroti, Arciszewski and StåhlAdam-Troian et al., 2019; Reference Alper, Bayrak and YilmazAlper et al., 2021; Sanchez & Dunning, 2021; Reference van Bavel, Cichocka, Capraro, Sjåstad, Nezlek, Pavlović, Alfano, Gelfand, Azevedo, Birtel, Cislak, Lockwood, Ross, Abts, Agadullina, Aruta, Besharati, Bor, Choma and Boggiovan Bavel et al., 2022; Reference Wagner-Egger, Delouvée, Gauvrit and DieguezWagner-Egger et al., 2018). This has been the case for both generic and specific conspiracy beliefs. For example, Reference Sire, Rateau and TrémolièreSire et al. (2018) found that participants who reported more correct responses on the CRT (i.e., thought reflectively) reported lower conspiracy mentality and Stanley et al. (2021) as well as Reference Erceg, Ružojčić and GalićErceg et a.l (2020) found that higher scores on the CRT were negatively associated with belief in COVID-19 conspiracy theories. Nevertheless, there are also some findings of no significant relationship between scores on the CRT and generic (Reference Ståhl and van ProoijenStåhl & van Prooijen, 2018) or specific (Reference van Prooijen, Cohen Rodrigues, Bunzel, Georgescu, Komáromy and Krouwelvan Proojen et al., 2022) conspiracy beliefs.
The most commonly used self-report measures consist of variations of the Rational-Experiential Inventory (REI; Reference Epstein, Pacini, Denes-Raj and HeierEpstein et al., 1996) such as the REIm (Reference Norris and EpsteinNorris & Epstein, 2011) or REI-40 (Reference Pacini and EpsteinPacini & Epstein, 1999). Typically, all versions of this scale contain two subscales that capture individuals’ preference for reflective (i.e., rational) and intuitive (i.e., experiential) thinking. Importantly, many studies report a significant negative relationship between scores on the reflective thinking subscale and conspiracy beliefs (Reference Swami, Voracek, Stieger, Tran and FurnhamSwami et al., 2014; Reference Gligorić, Većkalov and ŽeželjGligorić et al., 2018; Reference Gligorić, Silva, Eker, Hoek, Nieuwenhuijzen, Popova and Zeighami2021), and a positive relationship between scores on the intuitive thinking subscale and conspiracy beliefs (Reference Erceg, Ružojčić and GalićErceg et al., 2020; Reference Fuhrer and CovaFuhrer & Cova, 2020; Reference Gligorić, Većkalov and ŽeželjGligorić et al., 2018; Reference Gligorić, Silva, Eker, Hoek, Nieuwenhuijzen, Popova and Zeighami2021; Reference Swami, Voracek, Stieger, Tran and FurnhamSwami et al., 2014). These findings once again extend to both generic and specific conspiracy beliefs. For example, Reference Georgiou, Delfabbro and BalzanGeorgiou et al. (2019) found that scores on the reflective thinking subscale were significantly and negatively related to generic conspiracy beliefs and, compatibly, Reference AlperAlper et al. (2021) found that scores on the intuitive thinking subscale were positively related to generic conspiracy beliefs. Further, Reference Pytlik, Soll and MehlPytlik et al. (2020) and Reference Tomljenovic, Bubic and ErcegTomljenovic et al. (2020) reported findings of a positive relationship between specific sets of conspiracy theories, such as belief in vaccine conspiracy theories, and scores on the intuitive sub scale. Nevertheless, there are also reports of null findings in the literature, for instance Libretto et al. (2020) did not find any evidence for a significant relationship between generic conspiracy beliefs and the rational or intuitive subscale, though their sample size was low compared to other similar studies.
1.2 The Current Study
With growing interest in conspiracy beliefs, the number of studies and, consequently, the number of systematic reviews and meta-analyses in this field have risen in the last few years. Some researchers have systematically reviewed the conspiracy beliefs literature as a whole, attempting to provide a more general state of the art (Reference Douglas, Sutton and CichockaDouglas et al., 2017; Reference Douglas, Uscinski, Sutton, Cichocka, Nefes, Ang and Deravi2019; Reference Goreis and VoracekGoreis & Voracek, 2019; Reference van Prooijen and van Vugtvan Prooijen & van Vugt, 2018) or focused on findings regarding a specific set of conspiracy beliefs (Reference van Mulukom, Pummerer, Alper, Bai, Čavojová, Farias and Žeželjvan Mulukom et al., 2022). Others, such as Reference Stojanov and HalberstadtStojanov and Halberstadt (2020) who meta-analyzed the overall effect of lack of control on conspiracy beliefs, have taken more specific findings under the microscope. Yet we know of no effort to systematically review or meta-analyze the currently available evidence. Thus, we conducted a meta-analysis to address the following objectives: (1) identify correlational research that investigates conspiracy beliefs in relation to reflective thinking; (2) identify the different ways in which reflective thinking has been operationalized and measured with respect to conspiracy beliefs; (3) generate a narrative summary of the key findings; (4) assess the risk of publication bias in this work; and overall, (6) summarize findings on the correlational relationship between reflective thinking and conspiracy beliefs, while also providing directions for future research.
2 Method
2.1 Literature search and selection criteria
The literature search was conducted in February and March 2022. As previously recommended (Reference CardCard, 2015), both discipline-specific databases (Pubmed) and larger, cross-disciplinary databases (Web of Science, Scopus and Google Scholar) were screened. Notably, regarding our searches on Google Scholar, due to the excessive number of results (N = 101000), only the most relevant first 200 articles were screened as previously suggested by Reference Haddaway, Collins, Coughlin and KirkHaddaway et al. (2015). The following keywords were used in our search strategy: (conspirac*) AND (rational* OR reflecti* OR intuiti* OR deliberat* OR fast OR slow OR automatic OR system 1 OR system 2 OR thinking style OR bias). Additionally, in order to include unpublished work as well, we screened preprint databases (PsyArXiv and MedRxiv) and sent out an open call for unpublished data via email to all corresponding authors of articles that test the relationship between reflective thinking and conspiracy beliefs. The search log used to record and keep track of all database searches and can be found at OSF (https://osf.io/2jvc3/?view_only=113f7ab290a1415ba9991f65b8b87f1b). To be included in the meta-analysis articles had to contain (1) a quantitative design that statistically tested the correlational relationship between reflective thinking and conspiracy beliefs, (2) a measure and/or manipulation of reflective thinking, (3) a scale measure of conspiracy beliefs, (4) enough information to extract or calculate effect size (e.g., Pearson’s r) and (5) English as the language of publication.
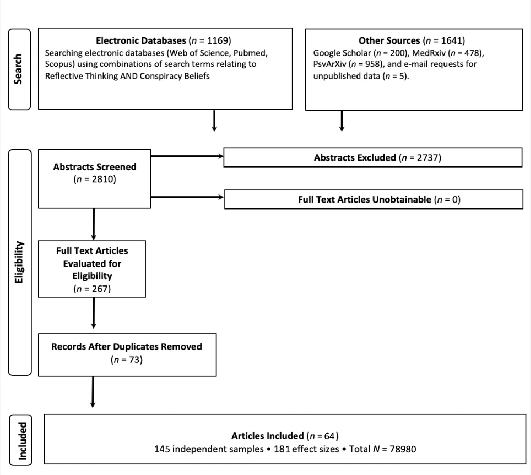
The search resulted in a total of 2810 records. Figure 1 shows a PRISMA flowchart of the selection process (Reference Moher, Liberati, Tetzlaff and AltmanMoher et al., 2009). Reviewers (first and second author) firstly screened the titles and abstracts of all collected records. If the article appeared to be relevant, we then assessed the full-text to ensure that it met the inclusion criteria outlined above. This resulted in a total of 267 articles, which then dropped down to 68 after the removal of duplicates. Further, 5 unpublished studies were sent in response to our open call, to which approximately 45% of the contacted authors responded to (regardless of whether they had available data or not). Thus, this left a total of 73 studies and 161 studies to be considered with more scrutiny for a final decision on inclusion in the meta-analysis. In cases where consensus could not be reached between the two reviewers about a paper’s eligibility, the third reviewer (senior author) made a final decision. For studies with overlapping data, to avoid using the same data multiple times, simply one study per data set was included in the analysis.
PRISMA flowchart of the selection process.
Based on this search strategy, in our final analysis, we included 64 articles (48 published, 16 unpublished), which contained 145 studies (122 published, 23 unpublished) and 181 effect sizes. The data points extracted from these articles were compiled onto a Google spreadsheet (including article characteristics, study characteristics, sample characteristics, analysis characteristics and findings), which can be found on OSF (https://osf.io/bxknp?view_only=113f7ab290a1415ba9991f65b8b87f1b).
2.2 Data Coding and Transformations
To prepare the data for analysis, certain modifications and categorizations were applied to the original dataset. Firstly, the studies were coded based on whether they were published or not (yes vs. no) and, where applicable, the samples’ corruption perceptions index (see Supplemental Materials) was added as a new variable to the data set. Secondly, the effect sizes of correlational studies which reported Spearman’s rank correlation coefficients were transformed to Pearson’s r correlation coefficients using the guidelines recommended by Reference Rupinski and DunlapRupinski and Dunlap (1996) in order to have a common metric. Next, all the available effect sizes were coded as belonging to one of four categories (where “CB” means “conspiracy beliefs” and “RT” means “rational thinking”): (1) Generic CB, Self-Report RT; (2) Generic CB, Performance-Based RT; (3) Specific CB, Self-Report RT; (4) Specific CB, Performance-Based RT. This was done so that, in addition to looking at the overall meta-analytic correlation, we could also meta-analyze the bulk of studies which used self-report RT measures separately from the ones that used performance-based RT measures, while also separating generic and specific conspiracy belief findings. Finally, two separate datasets were prepared: (1) A weaker estimates dataset and (2) a stronger estimates dataset. Namely, for articles which contained multiple effect sizes in a single study, with more than one effect size that fit into one of our four variable categories mentioned above, the weaker effect size was entered into the weaker estimates dataset (i.e., the main analyses dataset) while the stronger effect size was entered into the stronger estimates dataset. Here we report our meta-analysis findings with respect to the weaker estimates, however, data regarding the stronger estimates can be found in the Supplemental Materials.
2.3 Analysis Strategy
Jamovi’s meta-analysis module ‘MAJOR’ (Reference HamiltonHamilton, 2018; version 1.2.0), which is based on the metafor package designed for R (Reference ViechtbauerViechtbauer, 2010), was used for our random-effects meta-analysis. The model estimator was restricted maximum-likelihood and model measures were transformed using Fisher’s r-to-z transformation. Further, the risk of publication bias, the tendency to omit non-significant results and publish only positive results, was examined in two steps. Firstly, a visual assessment using the funnel plot method (Reference Egger, Smith, Schneider and MinderEgger et al. 1997) was conducted, which was followed by a rank correlation test (Reference Begg and MazumdarBegg & Mazumdar, 1994) and a regression test (Reference Egger, Smith, Schneider and MinderEgger et al., 1997). Secondly, p-curve analysis (Reference Simonsohn, Nelson and SimmonsSimonsohn et al., 2014) was carried out, using the built-in application available in MAJOR module (Reference HamiltonHamilton, 2018). Our study was pre-registered prior to data collection (https://osf.io/ngxyu/?view_only=fbcc0c15e89f4286bbb7cb469657fc3a).
3 Results
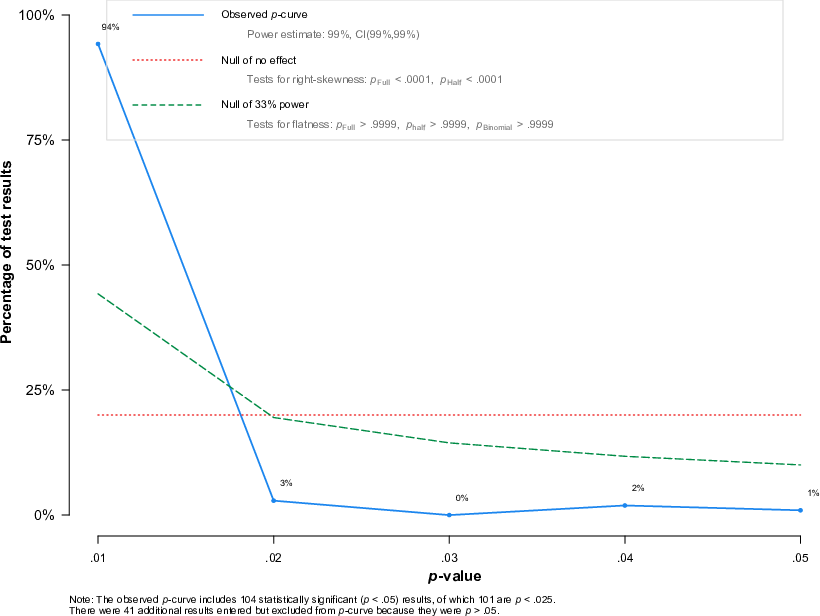
The meta-analysis of 145 independent samples yielded a meta-analytic correlation of r = –.189, SE = .008, z = –22.308, p < .001, 95% CI [–.206, –.172].Footnote 1 94% of all estimates were negative, indicating a clear negative correlation between reflective thinking and conspiracy beliefs (Figure 2). Egger’s regression test, value = 2.074, p = .038, but not the rank correlation test, value = .080 p = .155, indicated a funnel plot asymmetry (Figure 3). Note that the asymmetry is opposite to the direction implied by publication bias: the low-powered studies show reduced effects (i.e., lower or positive correlations). The p-curve analysis (Figure 4) provided strong support for a true effect with a right-skewed distribution of p values. When publication status (yes vs. no) was added to the meta-regression as a categorical moderator, it had no significant association, b = .022, SE = .023, p = .353, 95% CI [–.024, .067], which further suggests that there is no publication biasFootnote 2
Forest plot showing the observed correlations between reflective thinking and conspiracy beliefs. Bars represent 95% confidence intervals. Studies are ranked from the strongest negative to strongest positive correlation. A higher resolution version of the plot is available at https://osf.io/7ejba/?view_only=113f7ab290a1415ba9991f65b8b87f1b.

Funnel plot showing the distribution of associations between reflective thinking and conspiracy beliefs in correlational studies that were published.

p-curve plot showing the distribution of p-values in the published research on the correlation between reflective thinking and conspiracy beliefs. The right-skewed shape suggests that there is no publication bias.
3.1 Self-Report Measures of Reflective Thinking.
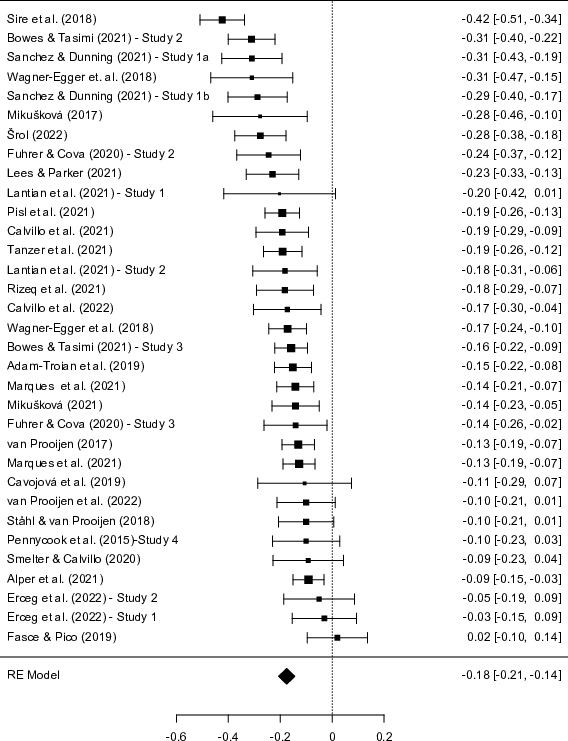
When only self-report measures were included, reflective thinking had a significant negative association with generic (k = 28), r = –.173, SE = .035, z = –4.986, p < .001, 95% CI [–.241, –.105] (Figure 5), and specific conspiracy beliefs (k = 23), r = –.146, SE = .025, z = –5.776, p < .001, 95% CI [–.196, –.097] (Figure 6).
Forest plot showing the observed correlations between self-report measures reflective thinking and generic conspiracy beliefs. Bars represent 95% confidence intervals. Studies are ranked from the strongest negative to strongest positive correlation.

Forest plot showing the observed correlations between self-report measures reflective thinking and specific conspiracy beliefs. Bars represent 95% confidence intervals. Studies are ranked from the strongest negative to strongest positive correlation.

3.2 Performance-Based Measures of Reflective Thinking.
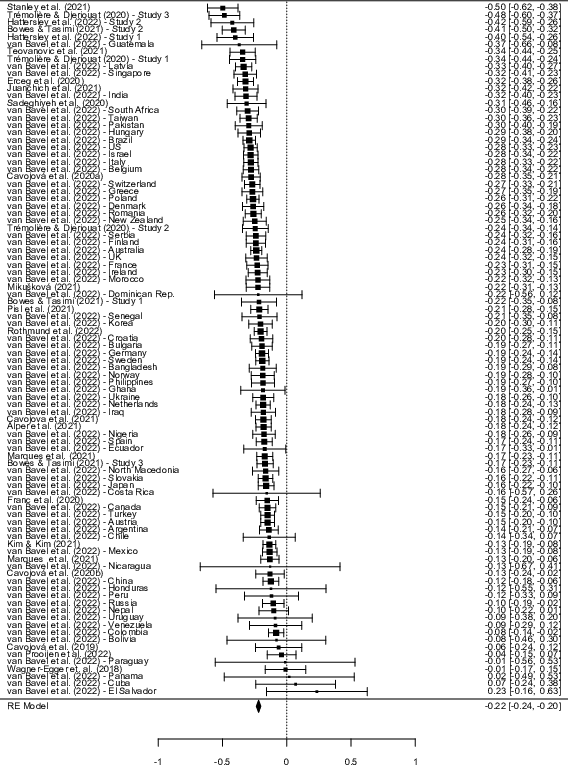
When only performance-based measures (e.g., CRT) were included, reflective thinking had a significant negative association with generic (k = 33), r = –.175, SE = .016, z = -10.943 p < .001, 95% CI [–.207, –.144] (Figure 7), and specific conspiracy beliefs (k = 94), r = –.219, SE = .009, z = -24.646, p < .001, 95% CI [–.236, –.201] (Figure 8).
Forest plot showing the observed correlations between performance-based measures reflective thinking and generic conspiracy beliefs. Bars represent 95% confidence intervals. Studies are ranked from the strongest negative to strongest positive correlation.
Forest plot showing the observed correlations between performance-based measures reflective thinking and specific conspiracy beliefs. Bars represent 95% confidence intervals. Studies are ranked from the strongest negative to strongest positive correlation.
3.3 Summary of Results
The meta-analysis of correlational research suggested a significant negative association between reflective thinking and conspiracy beliefs at r = –.189, which is close to the benchmark of medium effect size, r = .20, in psychological science (Reference Čavojová, Šrol and JurkovičFunder & Ozer, 2019). Thus, we conclude that reflective thinking negative predicts conspiracy beliefs and the size of this association is sufficient even for practical use in the short run (see Reference Čavojová, Šrol and JurkovičFunder & Ozer, 2019). Considering r = –.189, a two-tailed alpha of .05, and a power of 90%, future studies should aim to recruit a minimum of 290 participants to detect a significant correlation between reflective thinking and conspiracy beliefs (Reference Faul, Erdfelder, Buchner and LangFaul et al., 2009).
4 Discussion
This meta-analysis provides empirical and systematic insight to the question: What is the relationship between reflective thinking and conspiracy beliefs? Our analysis of correlational research conducted to date reveals a significant negative association between reflective thinking and conspiracy beliefs at r = –.189, not far from what is considered to be the benchmark of a medium effect size in psychological science (Reference Isler, Yilmaz and Dogruyolr = .20; Reference Čavojová, Šrol and JurkovičFunder & Ozer, 2019). Remarkably, risk of bias assessment via the funnel plot method (Reference Egger, Smith, Schneider and MinderEgger et al. 1997) and p-curve analysis (Reference Simonsohn, Nelson and SimmonsSimonsohn et al., 2014) jointly suggests that there is no publication bias in this body of work. Thus, there is sufficient evidence indicating that reflective thinking is a negative predictor of belief in conspiracy theories and that it can be put to practical use to protect individuals from the potentially detrimental outcomes of conspiracy beliefs (Reference Bertin, Nera and DelouvéeBertin et al., 2020).
4.1 Self-Report vs. Performance-Based Reflective Thinking Measures
Regarding the measurement of reflective thinking, despite previous research suggesting that the CRT is rather a cognitive ability test rather than a measure of reflective thinking disposition (Reference Otero, Salgado and MoscosoOtero et al., 2022), we find that both performance based measures (mainly consisting of the CRT) and self-report measures were significant predictors of individuals’ belief in conspiracy theories. Namely, we found that both performance-based (r = –.175) and self-report measures (r = –.173) were significantly and negatively associated with generic conspiracy beliefs. Regarding specific conspiracy beliefs, again, we found that both performance-based measures (r = –.219) and self-report measures (r = –.146) were significantly and negatively associated with such beliefs.
4.2 Theoretical Background
Why does reflective thinking predict conspiracy beliefs? It is possible that reflectively processing information inhibits individuals’ intuitions and biases that support the acceptance of conspiracy beliefs while also increasing attention to detect the logical fallacies inherent in most conspiracy theories (Reference Brotherton, French and PickeringBrotherton & French, 2013; Reference Swami, Voracek, Stieger, Tran and FurnhamSwami et al., 2014; Reference van Prooijen and van Vugtvan Prooijen & van Vugt, 2018). Further, reflective thinking may equip individuals with the space and skills to override and deliberately evaluate any pre-existing conspiracy beliefs (Reference Swami, Voracek, Stieger, Tran and FurnhamSwami et al., 2014; Reference Douglas, Uscinski, Sutton, Cichocka, Nefes, Ang and DeraviDouglas et al., 2019). It could also be the case that conspiracy theories attract an intuitive thinking style simply due to their nature of typically requiring lower cognitive effort and triggering affective feelings (Reference Swami, Voracek, Stieger, Tran and FurnhamSwami et al., 2014; Reference Swami, Voracek, Stieger, Tran and FurnhamSwami & Furnham, 2014; Reference van Prooijen and van Vugtvan Prooijen & van Vugt, 2018). Finally, it is possible that these findings demonstrate a broader function of reflective thinking, namely, that it fosters skepticism towards any sort of epistemically suspect beliefs (i.e., conspiracy, paranormal and pseudoscience beliefs; Reference Čavojová, Šrol and JurkovičČavojová et al., 2020; Reference Pennycook, Cheyne, Seli, Koehler and FugelsangPennycook et al., 2012; Reference ŠrolŠrol, 2022).
4.3 Future directions
Although the correlational relationship between thinking reflectively and conspiracy beliefs is quite well understood, an evident shortfall of this literature is the lack of high-powered experimental studies. To our knowledge, so far there only exists six studies (Reference Bago, Rand and PennycookBago et al., 2022; Reference Swami, Voracek, Stieger, Tran and FurnhamSwami et al., 2014; Spasovski et al., 2022). Thus, the number of experimental studies needs to increase before any informative meta-analytic effect sizes can be produced. Nevertheless, we have added a premature meta-analysis of the currently available studies, with reported Cohen’s d effect sizes (N = 4), to our supplemental materials (https://osf.io/2cxdg?view_only=113f7ab290a1415ba9991f65b8b87f1b). For future directions, we encourage researchers to engage in more experimental work that tests the effect of reflective thinking on conspiracy beliefs with enough power to detect a significant effect. Such work could include interventional methods such as training individuals to think more reflectively (Reference Isler, Yilmaz and DogruyolIsler et al., 2020) or, perhaps, teaching them to reason better (Reference PerkinsPerkins, 2019). By doing so, one could directly assess whether thinking reflectively does indeed combat against conspiracy beliefs. Further, up to this point only cross-sectional research has been employed and, to our knowledge, there have been no attempts to study this topic via longitudinal methods. Thus, we also encourage researchers to make use of this avenue of research and to study the formation of, or changes in, conspiracy beliefs over time, as a result of increased engagement in reflective thinking.
In regard to sample size, for future reference, we recommend that subsequent studies should aim to recruit at least 290 participants to detect a significant correlation between reflective thinking and conspiracy beliefs based on our finding of r = –.189, a two-tailed alpha of .05, and a power of 90% (Reference Faul, Erdfelder, Buchner and LangFaul et al., 2009). A limitation of the current meta-analyses is that no comparisons could be made regarding study quality characteristics (e.g., pre-registered vs. not pre-registered) due to the current state of the literature being unfit to do so. However, an interesting future direction could be to meta-analyze only pre-registered studies and compare the results with the findings of the current meta-analysis. Relatedly, another limitation of the current study is that no moderators could be assessed, because most studies in the literature simply reported findings on the relationship between cognitive reflection and conspiracy beliefs. The current meta-analysis supports the idea that this relationship is now well established. Thus, an important step forward would be to start testing the effects of relevant moderator variables, for example corruption (see Supplemental Materials for details), and to further investigate such relations through future meta-analyses, as the number of studies looking at moderators increases. A final potential limitation concerns the p-curve analysis used in the current study. Although popularly applied, the p-curve method has recently faced certain critiques and debates regarding its performance on assessing publication bias, and a new method of assessment, the ‘z-curve 2.0’, has been proposed (Bartos & Schimmack, 2020). Future studies could utilize this recently developed method to continue to investigate whether it indeed out-performs the more traditionally known p-curve analysis.
4.4 Conclusion
We find that reflective thinking is a significant predictor of conspiracy beliefs, such that individuals who think reflectively are less likely to believe in both generic and specific conspiracy theories. From a theoretical point of view, this paper contributes to the conspiracy beliefs literature by systematically confirming that reflective versus intuitive thinking constitutes one of the underlying psychological mechanisms that support such beliefs. More broadly, from a practical point of view this work suggests that, for policy-makers concerned about the negative outcomes of conspiracy beliefs, encouraging the development of reflective thinking skills can be a good step forward.


 Open access