


1. Introduction
The nuclear reaction between deuterium and tritium nuclei (DT reaction) is a well-known candidate for future nuclear fusion power plants and has been extensively studied in the last decades [Reference Freiberg1]. The main advantages of exploiting DT reactions are the low energy required to initiate the fusion process and the high reaction cross-section at center-of-mass energies below 200 keV [Reference Atzeni and Meyer-ter-Vehn2–Reference Nevins and Swain5]. However, DT reactions require the use of radioactive fuel (tritium) and produce neutrons. These can be used for tritium breeding and in hybrid fusion-fission reactors [Reference Brandenburg6, Reference Freidberg and Kadak7] but also have the drawback of having a low energy conversion efficiency and activating materials they interact with. For these reasons, the neutronless 11B (p, α)2α reaction [Reference Baccou, Depierreux and Yahia3–Reference Nevins and Swain5, Reference Kulcinski and Santarius8] has become a topic of research as an alternative to DT reactions for third-generation fusion reactors. The peak cross-section of this reaction is reached at about 600 keV center-of-mass energy [Reference Baccou, Depierreux and Yahia3]. This can be achieved in laboratory conditions with the interaction of high-power laser pulses and matter, which, in ad-hoc designed experiments, has been demonstrated to produce p+11B reactions [Reference Baccou, Depierreux and Yahia3, Reference Kimura, Anzalone and Bonasera9–Reference Margarone, Picciotto and Velyhan15]. These experiments exploit two main schemes: (i) irradiating specially designed targets (such as plastic targets doped with boron or silicon host targets enriched with hydrogen and boron [Reference Belyaev, Matafonov and Vinogradov10, Reference Giuffrida, Belloni and Margarone12, Reference Picciotto, Margarone and Velyhan14, Reference Margarone, Picciotto and Velyhan15]) with energetic nano- and picosecond laser pulses in order to trigger p+11B fusion reactions; (ii) generating a laser-driven proton beam (typically using pico- and femtosecond laser pulses) that is directed onto a boron secondary target where the fusion reactions are initiated [Reference Baccou, Depierreux and Yahia3, Reference Labaune, Baccou and Depierreux11, Reference Giulietti, Andreoli and Batani16–Reference Cipriani, Consoli and Andreoli18]. In these types of experiments, one of the main challenges is represented by the accurate characterization of the interaction conditions and, in particular, by the detection of the typical products of the p+11B fusion reactions, i.e., alpha particles with energies in the range of a few MeVs [Reference Baccou, Depierreux and Yahia3, Reference Consoli, De Angelis and Andreoli19]. Due to the low rate of the fusion reactions, the number of produced alpha particles is typically low, and the produced particle flux that can be collected by diagnostic devices is limited [Reference Giulietti, Andreoli and Batani16–Reference Consoli, De Angelis and Andreoli19]. Moreover, laser-plasma interactions at high intensity produce a wide spectrum of ionizing electromagnetic (UV, X, and γ) [Reference Kruer20] and particle radiation (electrons, ions) [Reference Macchi, Borghesi and Passoni21, Reference Umstadter22] and electromagnetic pulses (EMPs) up to the MV/m order in the frequency range from radiofrequency to terahertz [Reference Consoli, Andreoli and Cipriani23, Reference Consoli, Tikhonchuk and Bardon24]. These additional radiation types interact with the diagnostics and often generate a strong background “noise” that hinders the measurement of alpha particle spectra. Diagnostic devices placed at a close distance from the interaction point are often damaged by this radiation. Different types of diagnostic systems are commonly used for revealing energetic ions in laser-plasma experiments, such as time-of-flight diagnostics, solid-state nuclear track detectors (CR-39, PM355, etc.), and electric and/or magnetic spectrometers [Reference Bolton, Borghesi and Brenner25–Reference Muenzenberg27]. Among the latter category, Thomson spectrometers (TS) represent a well-known and popular solution, due to their combination of electric and magnetic fields [Reference Thomson28, Reference Olsen, Kuswa and Jones29], which allows deflecting ion species with different mass-to-charge ratios (A/Z, where A is the mass number and Z is the atomic number) on different trajectories. The particles then impinge on a detector and draw different parabolic curves according to their A/Z value.
In recent years, intensive research and development has been carried out at the Fusion Physics department of ENEA related to diagnostic devices for p+11B fusion reaction experiments, in particular Thomson spectrometers. Prototypes of TS have been developed at the ENEA Research Center in Frascati with the intent to optimize them for the detection of alpha particles. These devices are designed to be placed inside the vacuum chamber at close distances to the interaction point, in order to maximize the number of collected particles, due to their large intercepted solid angle [Reference Consoli, Angelis and Bonasera30, Reference Giorgio, Consoli and Angelis31]. Moreover, they feature compact dimensions, short-length bending dipoles (magnetic and electric) and ad-hoc shielding against EMPs. These characteristics allow to employ them close to the interaction point where the EMP intensity is maximum and is known to induce significant distortions to the TS signal [Reference Giuffrida, Belloni and Margarone12]. One of these devices has been recently tested at the PHELIX laser facility at GSI (Germany) during an experiment where strong EMPs (in the multiple hundreds of kV/m order) were produced, proving an excellent capability to work in such harsh conditions at a distance from the laser-plasma source of <1 m [Reference Scisciò, Consoli and Salvadori32]. In this work, we report about a further test of this device: the experimental results were obtained during an experiment of laser-plasma-induced p+11B fusion reactions, performed at the PALS laser facility (350 ps laser pulses with an energy of about 700 J). In this experiment, our goal was to test the performance of our diagnostic device in an environment of strong particle irradiation, EMP noise, and ionizing radiation: the typical harsh conditions of a p+11B fusion experiment. We aimed at efficiently separating and detecting protons and heavy ions, in particular those with A/Z = 2, where alpha particles are included, by placing our device at a distance of less than 367 mm from the interaction point. In the following sections, we will focus on the evaluation of the measurements obtained for protons and A/Z = 2 ions.
2. Materials and Methods
2.1. Thomson Spectrometer Parameters and Experimental Setup
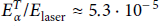
The magnetic field of the deflecting dipole of our TS is B = 0.405T and the voltage applied to the electrodes can reach a maximum value of
 (resulting in a maximum electric field
 ). The length of the dipole section of the TS is L = 25 mm. The particles collected by the TS are typically revealed by imaging plates (IPs), placed on the support on the back side of the device after a drift space of L
D
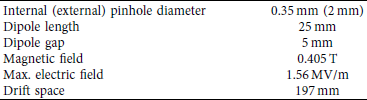
= 197 mm between the deflecting dipole and the detector. The implementation of CR-39 detectors is also possible with the use of a specially designed frame that can be put in place of the IP support. Further details of the TS parameters are reported in Refs. [Reference Consoli, Angelis and Bonasera30, Reference Giorgio, Consoli and Angelis31]. In Table 1, we summarize the most critical ones. In Figure 1(a), we show a schematic of the TS components. The black dashed line indicates the trajectory of the radiation that enters the device through the double pinhole assembly (a first pinhole with a diameter of 2 mm and a second one with a diameter of 0.35 mm) and generates the zeroth order signal on the IP: a x-ray pinhole image of the interaction. The red dashed line represents the trajectory of the ions, which are deflected along x by the magnetic field and along y by the electric field. The ions will then impinge on the detector, generating parabolic traces on the x − y plane, according to equation (1)
). The length of the dipole section of the TS is L = 25 mm. The particles collected by the TS are typically revealed by imaging plates (IPs), placed on the support on the back side of the device after a drift space of L
D
= 197 mm between the deflecting dipole and the detector. The implementation of CR-39 detectors is also possible with the use of a specially designed frame that can be put in place of the IP support. Further details of the TS parameters are reported in Refs. [Reference Consoli, Angelis and Bonasera30, Reference Giorgio, Consoli and Angelis31]. In Table 1, we summarize the most critical ones. In Figure 1(a), we show a schematic of the TS components. The black dashed line indicates the trajectory of the radiation that enters the device through the double pinhole assembly (a first pinhole with a diameter of 2 mm and a second one with a diameter of 0.35 mm) and generates the zeroth order signal on the IP: a x-ray pinhole image of the interaction. The red dashed line represents the trajectory of the ions, which are deflected along x by the magnetic field and along y by the electric field. The ions will then impinge on the detector, generating parabolic traces on the x − y plane, according to equation (1)
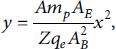
where
 and
and
 are the charge and the mass of the considered ions, respectively; AE and AB are coefficients related to the electric and magnetic field distribution along the dipole of the TS, which also consider the effects of fringe fields (see refs. [Reference Consoli, Angelis and Bonasera30, Reference Giorgio, Consoli and Angelis31] for further details).

(a) Schematic of the TS components. (b) Schematic view of the experimental setup. The TS is positioned at a distance of 367 mm from the front side of the laser-irradiated target.

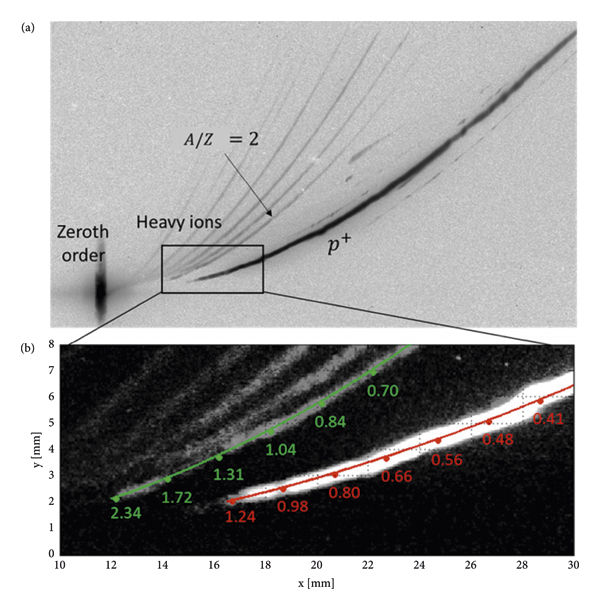
(a) IP scan of the shot #56027. (b) Zoomed frame of the retrieved parabolas for A/Z = 1 and A/Z = 2, in the region of the maximum energies. The coloured lines indicate the analytic curves and the numerical values of the associated energies (MeV) for protons (red) and alpha particles (green).

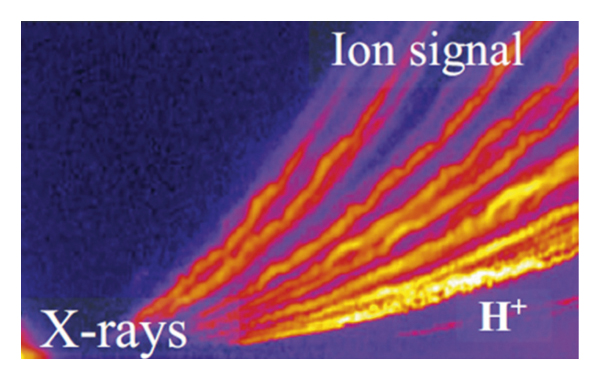
Signal retrieved from a TS implemented at the PALS facility during a p+11B fusion experiment with no special precautions regarding EMP shielding. Reprinted with permission from reference [Reference Giuffrida, Belloni and Margarone12] copyright 2020 by the American Physical Society.
We evaluated the quality of the retrieved signals from the traces for protons and A/Z = 2 ions in terms of signal-to-background ratio (SBR). We discretized the x-axis of Figure 2, i.e., the horizontal axis on the IP image, in order to consider the actual resolution of the device. This is limited by the pinhole diameter as it is projected on the detector plane and can be evaluated by the thickness of the proton trace (it is inconvenient to evaluate it from the zeroth order in our case since the signal is oversaturated in that region). Hence, we graphically estimated that the pinhole image for protons is about 0.8 mm and for the other ions is about 0.6 mm. This gives the actual energy resolution of the TS for each specific trace. The retrieved signal is therefore divided into energy bins that correspond to subsets of pixels that have the same dimension as the pinhole image. According to the relation between horizontal position on the IP and energy of the particles, it is possible to calculate the average energy of each subset of pixels by considering its central position along the x coordinate [Reference Consoli, Angelis and Bonasera30]. It is calculated as follows:
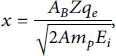
where
 ,
,
 , and Ei are the charge, the mass, and the energy of the considered ions, respectively; AB is the coefficient related to the magnetic field of the TS (see equation (1) and reference [Reference Consoli, Angelis and Bonasera30] for further details). We indicate the discretized energy bins with their mean energy
 . We then evaluated the signal
 within these bins by integrating the PSL values of the obtained subsets of pixels [Reference Consoli, Angelis and Bonasera30]. The values of the background signal
 were evaluated by integrating the PSL values taken from the region of the IP adjacent to the particle traces and this was performed for each position on the trace. So, the background is monitored and subtracted adaptively. We defined the signal-to-background ratio as
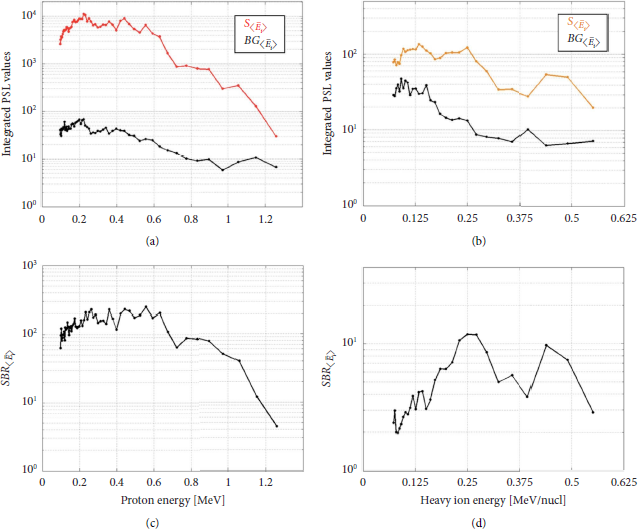
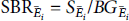 for each energy bin. In Figure 4, we report, for the shot #56027, the obtained values of
 and
and
 (protons and A/Z = 2 particles in panels (a) and (b), respectively; for the latter case, we indicate
 in terms of MeV/nucleon, in order to have an equivalent scale for the different ion species that might contribute to the signal of the trace). In the plots of Figures 4(c) and 4(d) (protons and A/Z = 2, respectively), the
 is reported. These plots clearly indicate that the signal of retrieved traces exceeds the background noise across the entire analysed energy range, for both cases of A/Z = 1 and A/Z = 2. In case of protons, the signal exceeds the background by a factor ∼100 in the range 0.1–0.7 MeV. At higher energies,
 for
for
 up to 1.1 MeV, i.e., in the spectral region where the collected particle charge diminishes (and, as a consequence, the values of the correspondent
 ). At the maximum energy of ∼1.2 MeV, the
 has still a value of about 4. For the A/Z = 2 trace (Figure 4(d)), which typically is harder to detect due to its weaker signal compared to the proton trace, we obtained
 for ion energies from 0.05 to 0.125 MeV/nucleon and
 from about 0.125 MeV/nucleon up to the maximum reached energy of ∼0.55 MeV/nucleon.
(a) Trace signal
 (red) and background signal
 (black) obtained for the proton trace. (b) Trace signal
 (orange) and background signal
 (black) obtained for the A/Z = 2 trace. (c) Signal-to-background ratio
 obtained for the proton trace. (d) Signal-to-background ratio
 obtained for the A/Z = 2 trace. All plots refer to shot #56027.

A schematic drawing of the experimental setup used in the experiment at the PALS facility is reported in Figure 1(b). The laser pulses, with a wavelength λ = 1315 nm and a duration of ∼350 ps, had an energy between 600 J and 700 J, depending on the case. They were focused down onto a solid target at an angle
 from the laser axis (see Figure 1(b)), yielding an intensity of
 . The types of targets that were used varied from shot to shot and will be indicated in the following sections. Our Thomson spectrometer was placed at an angle of
 from the laser axis, in line of sight with the target surface irradiated by the laser. The distance between the TS and the target was
 (measured from the target to the entrance pinhole of the TS). The maximum voltage applied to the electrodes of the TS was ΔV = 4 kV (resulting in an electric field E ≈ 0.78 MV/m). The nominal maximum voltage was not applied due to insufficient vacuum conditions. The deflected particles were detected by IPs of the type BAS-TR [Reference Bonnet, Comet and Denis-Petit33, Reference Boutoux, Batani and Burgy34]. In front of the TS, we placed an external lead slit (about 2 mm wide) as additional protection against incoming radiation.
2.2. Scanning of the Imaging Plate
The implemented IPs were of type BAS-TR, manufactured by Fujifilm. They were scanned after each shot with a Fujifilm IP Scanner BAS-1800II scanner (50 μm pixel size resolution, sensitivity S = 4000, latitude L = 5). This type of scanner produces 16 bit encoded images. In order to obtain the photo-stimulated luminescence (PSL) value of the pixels, which is necessary for the correct calibration of the signals/traces on the IP, we used the following formula [Reference Singh, Slavicek, Hodak, Versaci, Pridal and Kumar35]:
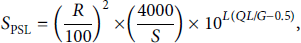
where R is the resolution (50 μm), S the sensitivity (4000), L the latitude (5), QL the encoded quantum level, and G the gradation (65335) of the original image. The IPs were scanned approximately 15 minutes after each shot. This time delay induces a slight fading of the trace signal on the IP, which will be about 90% of the original value [Reference Meadowcroft, Bentley and Stott36]. This effect is compensated by a correction factor that we included in the numerical script for the evaluation of the obtained particle spectra.
3. Results and Discussion
3.1. Assessment of the Thomson Spectrometer Sensitivity
We report in Figure 2(a) an IP scan as an example of what was typically retrieved from the performed shots. In this particular case (shot #56027), which we will analyse in detail in this section, the laser energy was 661 J, and the used target was made of a 10 μm thick plastic foil doped with 11B. The traces drawn by the different ion species collected by the TS are clearly visible on the IP scan (no digital contrast enhancement was used in the image of Figure 2(a)). The parabolas are separated one from the other for all detected energies, i.e., the signals do not overlap even at the high-energy tail of the traces. Due to the large solid angle intercepted by the device, which was enabled by the short distance of 367 mm to the target (see Figure 1(b)), we obtained a significant high flux of ions (a delicate parameter, especially for the signals of heavy species), which was revealed with accuracy by the high TS sensitivity. On the other hand, due to its proximity to the target, the TS is exposed to a strong flux of ionizing radiation and electrons generated by the laser-target interaction [Reference Kruer20], which generally causes a background noise. This is somehow recognizable from the intense signal of the zeroth order, where the high X-yield directly impinges on the IP and leads to a saturated signal (even after multiple scans of the detector). However, the implementation of a thick external lead slit (which confers the elongated vertical shape of the zeroth order), the tailored double pinhole assembly for internal electron deflection and collection, and the thick metallic shielding case (shown in ref. [Reference Giorgio, Consoli and Angelis31] for further details) effectively protected the region of the IP where the ions were revealed. Our TS also proved to have remarkable robustness to significant EMP fields (typically, at the PALS facility, in the order of a fraction of MV/m at ∼1 m distance from the target [Reference Consoli, Tikhonchuk and Bardon24, Reference Raczka, Cikhardt and Pfeifer37]). The traces do not feature the typical oscillations that are caused by the presence of EMPs when no special precautions are taken. In refs. [Reference Giuffrida, Belloni and Margarone12, Reference Grepl, Krasa and Velyhan38], pictures of the very oscillating traces are shown for experiments on the same PALS facility. In particular, the results of reference [Reference Giuffrida, Belloni and Margarone12], which we report here in Figure 3 for comparison, were obtained in an experiment of laser-driven p+11B fusion reactions using the same scheme as our experiment. Moreover, these results were achieved by placing the TS outside the chamber and at a distance of about 1.5–2 m from the interaction point. Hence, with EMPs intrinsically much lower (more than one order of magnitude) than those experienced by the TS that we implemented in our experiment. Near the A/Z = 1 trace generated by protons, weaker traces are visible in the region of lower energies. These are possibly induced by a fraction of the low-energy particles of the beam that are deflected on a different trajectory by the fringe fields of the dipole and/or part of the deflected particles, which interact with the deflector edge and then reach the detector. In the zoomed frame of Figure 2 (panel (b)), we indicated with colored lines the analytic parabolas that correspond to the particles with A/Z = 1 (protons) and A/Z = 2 (here, we used digital contrast enhancement for improving the image clarity for the reader). The numeric values on these lines indicate the particle energies in MeV that correspond to the different positions along the parabolas (for the A/Z = 2 parabola, we considered here the energies of alpha particles).
The analysis of the A/Z = 2 trace also allows estimating the minimum value of p+11B reactions that leads to a detectable quantity of alpha particles, in the case a TR type IP detector is used. In general, the signal level of the A/Z = 2 trace can be written as follows:
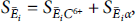
where
 and
and
 are the contributions of C6+ ions and alpha particles, respectively (note that, here, the energy values
 are in terms of MeV/nucleon). If we assume that—since the used target is made of plastic, which is a source of a large amount of fully ionized carbon ions—the signal level of the A/Z = 2 trace is entirely given by C6+ ions, it can be considered a reference threshold for the detection of alphas. We can define a “minimum detectable contribution” of alphas
 to the signal of the A/Z = 2 trace, with respect to the contribution given by C6+ ions. For instance, assuming that the presence of alpha particles can be detected if the signal of the A/Z = 2 trace has double intensity with respect to the reference case where only C6+ ions are present, the minimum detectable signal by alpha particles would be
 . In the following section of this study, where a quantitative analysis of the particle spectra is provided, we will use these definitions for estimating the minimum quantity of detectable alpha particles. Consequently, the minimum detectable gain of p+11B reactions—intended as the total energy of generated alpha particles with respect to the laser pulse energy—with the experimental parameters of the campaign at the PALS facility.
3.2. Spectra of Detected Ions with A/Z = 1 and A/Z = 2
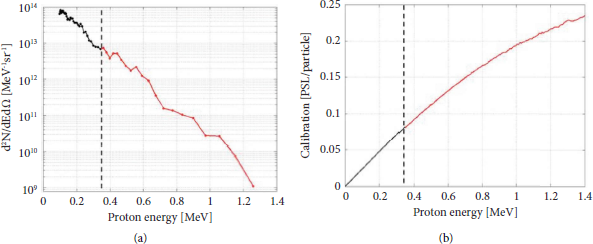
It is worth stressing out that the signal related to the A/Z = 2 parabola possibly contains the contributions of both alpha particles and C6+ ions, besides possible O and N ions that can be present in the contaminants on the target surface. These cannot be distinguished with the use of an IP as a detector. The distinction of alpha particles from C6+ ions, for example, may require the implementation of alternative techniques, such as, in some cases, the use of CR39 detectors and/or differential filters [Reference Alejo, Kar and Ahmed39, Reference Salvadori40]. In this preliminary study, our main goal was to test the sensitivity of TS and its ability to obtain separate signals for protons and A/Z = 2 ions using IPs. For this reason, in the following section, we will analyse the spectra obtained from the A/Z = 2 trace considering both cases separately, i.e., under the hypothesis that the retrieved signal is entirely due to alpha-particles or alternatively entirely due to C6+ ions. The proton spectrum obtained from the A/Z = 1 trace is displayed in Figure 5(a). The retrieved maximum energy is of ∼1.2 MeV, and the slope of the spectrum is exponentially decreasing, as is typical for laser-accelerated protons. This spectrum was obtained using the IP calibration curve that we report in Figure 5(b). For energies >350 keV, the calibration values are those reported in ref. [Reference Bonnet, Comet and Denis-Petit33] and are plotted in red. At lower energies, no calibration values for TR type IPs are available in literature, to the author’s knowledge. Therefore, we assumed a linear response of the detector in the range 0–350 keV, as it is indicated by the black part of the curve of Figure 5(b) (left from the dashed line). The low-energy part of the spectrum, separated by the dashed line on Figure 5(a), is hence obtained using this linear calibration curve, down to a minimum proton energy of ∼100 keV that our device was capable of detecting. To have a more precise spectrum estimation at E < 350 keV, we plan to perform suitable IP calibrations for proton expositions.
(a) Obtained proton spectrum for shot #56027. The number of particles at energies below 350 keV is evaluated using a linear response of the IP. (b) Calibration curve used for calculating the proton beam charge. The red part of the plot is from reference [Reference Bonnet, Comet and Denis-Petit33]. For the black part of the curve, for energies below 350 keV, a linear response of the IP is assumed.
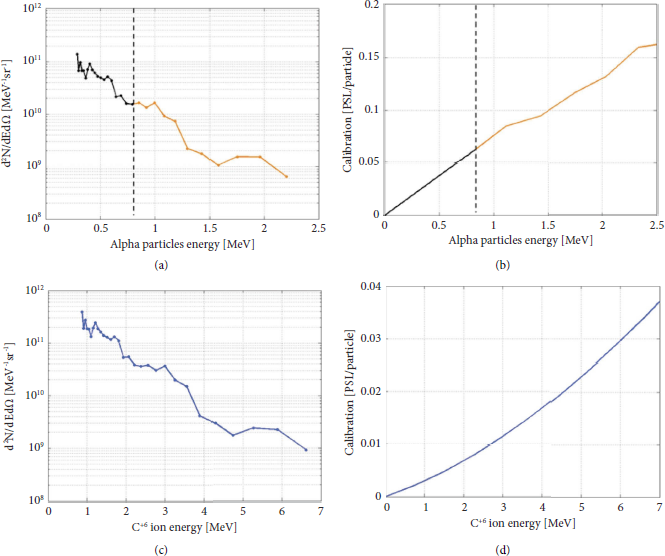
In Figures 6(a) and 6(c), we show the obtained spectra for the A/Z = 2 trace, assuming the two separate cases where the signal contribution on the IP comes either entirely from alpha particles (panel (a)) or entirely from C6+ ions (panel (c)). The alpha particle spectrum, obtained by using the calibration curve of Figure 6(b), has a cutoff energy of ∼2.2 MeV. This calibration is reported in reference [Reference Freeman, Fiksel and Stoeckl41] and similar to the case of protons does not provide calibration values for alpha particles below ∼800 keV. For this reason, we again used a linear response here for evaluating the charge of the obtained alpha spectrum, as indicated by the black part of the plot (left of the dashed line). The case where the A/Z = 2 signal is instead entirely generated by carbon ions is represented in Figure 6(c) and shows ions with a maximum energy of ∼6.6 MeV. For this analysis, we used the calibration curve reported in panel (d), obtained by using the methodology reported in reference [Reference Doria, Kar and Ahmed42], where experimental data of TR IP calibrations for carbon ions are fitted with a polynomial curve. Calibration data for C6+ ions from ref. [Reference Doria, Kar and Ahmed42], are for an ion energy of ∼12 MeV. Experimental calibration data for energies down to 3 MeV are also reported for C3+ ions, and since the stopping power of these accelerated ions is not influenced by their charge state, we assumed that the reported polynomial fit of ref. [Reference Doria, Kar and Ahmed42] extends to lower energies as well. For a more precise evaluation of the number of accelerated particles in both cases of alpha particles and carbon ions, a calibration of TR IPs at low energies is necessary and will be addressed in future studies. However, since the main goal of this work was to test the TS sensitivity in a proton-boron experiment and prove its capability of retrieving distinct signals for A/Z = 1 and A/Z = 2 traces, we believe that a preliminary evaluation of the beam charge, obtained with the linearized/fitted calibration curves of Figures 5(b), 6(b), and 6(d), serves well the purpose of our study.
(a) Obtained spectrum for the A/Z = 2 trace of shot #56027 in the case where the entire contribution to the retrieved signal is due to alpha particles. The number of particles at energies below ∼0.8 MeV is evaluated using a linear response of the IP. (b) Calibration curve used for calculating the alpha particle beam charge. The orange part of the plot is from ref. [Reference Freeman, Fiksel and Stoeckl41]. For the black part of the curve, with energies below 0.8 MeV, a linear response of the IP is assumed. (c) Obtained spectrum for the A/Z = 2 trace of shot #56027, in the case where the entire contribution to the retrieved signal is due to C6+ ions. (d) Calibration curve used for the number of C6+ ions obtained using the fitted calibration data in ref. [Reference Doria, Kar and Ahmed42].

From the spectra obtained from the A/Z = 2 trace, it is also possible to quantitatively estimate the minimum contribution of alpha particles that is detectable with the used IP detector, given our experimental conditions. As discussed in the previous section, we can assume that the signal level of the A/Z = 2 trace is entirely given by C6+ ions and can therefore, be used as a reference background level, above which the signal of the alpha particles needs to be detected. A reasonable scenario is represented by the case where the contribution of alpha particles leads to a minimum threshold value of
 that has double the intensity with respect to the case where only C6+ ions are present. Hence, the minimal contribution by alpha particles is equal to the reference one given by carbon ions, i.e.,
 . This case is represented by the spectra reported in Figure 6, where we obtain calibrated spectra of alphas and carbon ions using the same signal retrieved from the IP. Indeed, the spectrum of Figure 6(a) represents the minimum quantity of detectable alpha particles in the case that we are considering. By integrating the curve of this spectrum, assuming an isotropic emission of the particles from the target within an emission cone of 70∘ degrees (half-angle), the total number of particles and the total energy of the particle beam
 can be obtained. Note that the hypothesis of such an emission angle is due to the position of our TS from the target normal, i.e., 69∘ degrees. The total number of alpha particles, hence, is estimated to be
 . This value can be related to the number of C6+ ions obtaining
 . This value represents an estimation of the minimum number of generated alpha particles per accelerated C6+ ion, which leads to a detectable signal of alpha particles. In terms of total energy of the alpha particles, we obtain
 , which leads, with respect to the laser energy, to a minimum detectable gain of the p+11B reaction of
 .
.
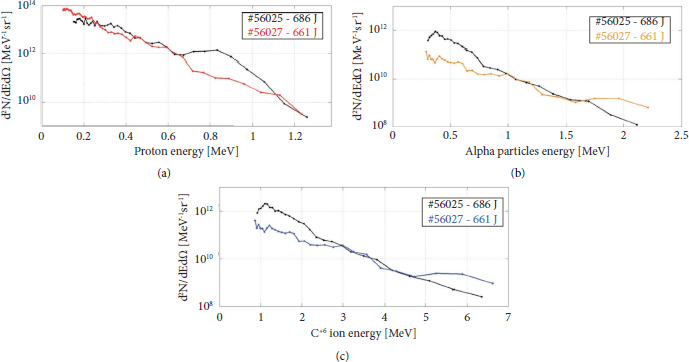
In Figure 7, we report the comparison between the spectra obtained in two different typical shots, which were evaluated with the methodology and the experimental setup that we discussed so far. For the A/Z = 2 traces, we report both the cases of alpha and C6+ ions. Also, here, the quantity of protons and alphas (or C6+ ions) in the energy range that is not covered by the IP calibrations that are available in the literature, is evaluated using a linear response of the detector. We observe that these shots yield similar spectra, for both protons and A/Z = 2 ions, in terms of maximum energy and estimated charge. For protons, the maximum energy is between 1.2 and 1.3 MeV for both shots. These results are consistent with the laser energy of the shots, which varies by less than 5% (it is 686 and 661 Joules for shots #56025 and #56027, respectively). This indicates that the TS is capable of providing reliable measurements of the laser-generated protons and ions. For the A/Z = 2 traces, we find a similar behaviour in terms of energies that are similar for the analysed shots (cut-off energies between ∼2.0 and ∼2.2 MeV in case of alpha particles and ∼6.4 and ∼6.6 MeV in case of C6+ ions, for both shots).
Spectra obtained for two typical shots (shot #56025 indicated by black curves and shot #56027 indicated by colored curves). (a) Proton traces. (b) A/Z = 2 traces assuming that the signal is generated by α particles. (c) A/Z = 2 traces assuming that the signal is generated by C6+ ions.

4. Conclusions
We tested and analysed the performance of an advanced Thomson spectrometer in an experiment of high-intensity laser-plasma interactions devoted to the initiation of p+11B reactions. The conditions of operation of the device were significantly harsh, as is typical for this type of experiment: the effects of strong irradiation by X, gamma, and EMP radiations emitted from plasma were amplified by the very close proximity of the device to the target, i.e., only 367 mm. Despite the placement close to the interaction point, the TS demonstrated a remarkable robustness against these types of radiations and the associated background noise. This allowed for the retrieval of particle signals with a high signal-to-background ratio using TR-type IPs without the necessity of using additional filters. In particular, for the A/Z = 1 trace, we obtained a SBR value of > 100 for the energy range up to 0.7 MeV, >10 up to 1.1 MeV, and >4 for even higher proton energies. For the A/Z = 2 trace, the SBR was ≥2 in the energy range 0.05–0.125 MeV/nucleon and ≥3 in the range 0.125–0.55 MeV/nucleon. This indicates that the shielding of the TS and the implementation of a double pinhole assembly protected the detector from the incoming X- and gamma-rays generated by the plasma and simultaneously allowed collecting a sufficiently high number of particles for a good-quality signal. Moreover, the traces did not exhibit the sinusoidal modulation that are typically induced (if no special precautions are taken) by the presence of EMPs in the RF spectrum, as it is reported in Ref. [Reference Giuffrida, Belloni and Margarone12] where very similar laser-plasma interaction conditions were exploited but the TS device was place outside the interaction chamber where the EMPs have significantly less intensity. This indicates that the shielding against this type of radiation provided good protection to our device despite the presence of EMP fields presumably in the order of magnitude of above 0.5 MV/m, as measured at the PALS facility [Reference Raczka, Cikhardt and Pfeifer37]. Our setup allowed to cover a large solid angle, more than one order of magnitude higher with respect to previous other setups where the TS was placed 1.5–2 m far from target. This increases the actual sensitivity of the TS and can actually qualify it as an effective diagnostic tool of alpha products from low-rate nuclear fusion reactions with unprecedented accuracy and SBR. In this preliminary campaign, we used TR IPs for a fast testing and an assessment of the TS features, especially the SBR, being these detectors very sensitive. The same TS is already equipped with a metallic frame for using CR39 detectors instead of IPs. This will be the main detector to use in the future for actual detection of alpha particles, due to its capability to discriminate incoming ions on the same trace,from the different track diameters left on the CR39 after etching. In this campaign, we evaluated the spectra of A/Z = 1 and A/Z = 2 traces for several shots. The maximum energy of protons varied in the range 1.2–1.3 MeV, and for the A/Z = 2 trace, considering the case fully stripped of alpha particles, we obtained maximum energies of 2.0–2.2 MeV (6.4–6.6 MeV in the case of C6+ ions). The quantitative analysis of the measured spectra of shot #56027 allowed us to estimate the minimum threshold of generated alpha particles that leads to a signal that is detectable above the background signal, generated by the C6+ ions, given the conditions of our experiment. Assuming that the presence of alpha particles is detectable if the signal of the A/Z = 2 trace is increased by a factor of two compared to the case where only C6+ ions are present, we obtained ∼0.14 generated alpha particles per accelerated C6+ ion as the minimum value. In terms of total alpha particle energy with respect to the laser energy, we obtained a minimum value of
 . It is worth mentioning that these threshold values can be significantly lowered by implementing filtering techniques that aim at reducing the quantity of detected C6+ ions in the energy ranges of alpha particles generated from laser-driven p+11B reactions [Reference Alejo, Kar and Ahmed39, Reference Salvadori40]. The results regarding the quantity of collected particles were obtained by using the linear response curves of the IPs for the energy ranges that are not covered by the calibration studies present in literature. Generally speaking, the calibration of IPs for low energy ions is still missing in literature, and we aim at addressing it in future works to extend the capability of our TS to provide full energy range calibrated spectra. In conclusion, we have successfully tested our TS in a p+11B reaction experiment with high energy laser, in a scheme and in experimental conditions that, so far, demonstrated the maximum number of alpha yield. The results of these tests clearly show that this diagnostic can be efficiently used for high-sensitivity detection, discrimination, and spectrometry of alpha particles produced in experiments of p+11B nuclear fusion reactions in environments with high-background values caused by high-energy and high-intensity laser pulses.
Data Availability
The experimental data used to support the findings of this study are available from the corresponding author upon reasonable request.
Conflicts of Interest
The authors declare that they have no conflicts of interest.
Acknowledgments
This work has been carried out within the framework of the EUROfusion Consortium, funded by the European Union via the Euratom Research and Training Programme (Grant Agreement no. 101052200—EUROfusion). This research was partially funded by the Ministry of Education, Youth and Sports of the Czech Republic by the project “Advanced Research Using High Intensity Laser Produced Photons and Particles” (CZ.02.1.01/0.0/0.0/16_019/0000789).


 Open access