


1. Introduction
Interethnic marriage is commonly employed in the African politics literature as an indicator of social cohesion (Bratton and Kimenyi, Reference Bratton and Kimenyi2008; Crespin-Boucaud, Reference Crespin-Boucaud2020; Bandyopadhyay and Green, Reference Bandyopadhyay and Green2021; Kim and Horowitz, Reference Kim and Horowitz2022; Kyei, Reference Kyei2022; Pengl et al., Reference Pengl, Roessler and Rueda2022) as well as an explanatory variable in analyses of ethnic voting (Dulani et al., Reference Dulani, Harris, Horowitz and Kayuni2022), conflict (Demarest and Haer, Reference Demarest and Haer2022), and trust in elected local officials (LeBas, Reference LeBas2020), among other outcomes.Footnote 1 Because marriage is an intimate relationship, the decision about whether to select a partner from a different ethnic group constitutes perhaps the quintessential behavioral indicator of intergroup social distance (Hechter, Reference Hechter1978). In settings where ethnic communities have historically spoken different languages, followed different cultural practices, and exhibited strong patterns of endogamy—as in much of Africa—increases in intermarriage rates over time are interpreted as indicators of weakening ethnic identification and the loosening of communal cleavages in society (Bandyopadhyay and Green, Reference Bandyopadhyay and Green2021; Pengl et al., Reference Pengl, Roessler and Rueda2022).
However, taking intermarriage rates at face value may be misleading. Intermarriage rates are a reflection of both preferences about who is acceptable to marry (providing insight into intergroup social distance) and also opportunities to interact with people from other groups, and thus be in a position to consider them as suitable marriage partners (Kalmijn, Reference Kalmijn1998).Footnote 2 If we are to interpret intermarriage rates as capturing the former—and thus as an indicator of social cohesion—we must find a way of controlling for the latter. A low rate of interethnic marriage has quite different implications in an ethnically homogeneous setting, where it would be challenging to even find a marriage partner from another ethnic group, and in an ethnically diverse environment, where it likely reflects conscious decisions by community members not to cross group boundaries. Controlling for opportunity is especially important for interpreting changes in intermarriage rates over time, as ongoing processes of urbanization and internal migration mean that changes in exposure to out-group members are occurring alongside the changes in preferences that researchers are hoping to capture.
Sophisticated analyses of interethnic marriage in Africa recognize this issue.Footnote 3 For example, Crespin-Boucaud (Reference Crespin-Boucaud2020) presents interethnic marriage rates in 15 African countries alongside measures of country-level ethnic diversity to benchmark the rates we would have expected to observe under random matching. While this is a step in the right direction, country-level diversity is not a good proxy for the exposure that individuals have to potential out-group spouses in the local marriage markets in which they actually select their partners.Footnote 4 Indirect approaches to conditioning on exposure, such as controlling for education, urban location, or country or group population size, are also imperfect strategies.
In this Note, I introduce a new approach for estimating intermarriage rates that controls for exposure to out-group members in local marriage markets, leveraging data from Zambia, one of the handful of African countries with publicly available census data that includes ethnic identifiers for household members. I define local marriage markets at the level of the country’s 150 electoral constituencies, the smallest administrative unit into which census respondents can be grouped. The large sample size that makes such disaggregation possible (N = 151,517 couples after censoring the sample as described below) represents a significant improvement over prior studies, which estimate interethnic marriage rates in African countries using data from Demographic and Health Surveys (DHS), whose country-level samples, even when stacked across multiple surveys, are much smaller, ranging from an average of 2,840 per country in Bandyopadhyay and Green (Reference Bandyopadhyay and Green2021) to an average of 6,474 per country in Crespin-Boucaud (Reference Crespin-Boucaud2020).Footnote 5 The findings reveal significant differences across estimates that do and do not control for exposure to out-group members and, among estimates that do control for exposure, across those that characterize the marriage market at the national versus local level. The findings also point to important substantive implications for understanding changes in African societies over time.
2. Why controlling for exposure is crucial
To illustrate the importance of controlling for exposure, consider the observed marriage pairings in the three hypothetical communities depicted in Table 1. All three communities contain six married couples and, in all three, 2 of the 6 couples are married to members of other ethnic groups, generating an identical observed intermarriage rate of 33 percent (see Table 2). However, community 1 is more diverse than communities 2 and 3, implying that the average individual seeking to marry within his/her own ethnic group in community 1 would need to look harder to find a co-ethnic partner than the average individual in the two other communities. If couples were paired at random, the likelihood of being matched to a partner from a different group would be 72 percent in community 1. In communities 2 and 3, it would be just 50 percent—roughly a third lower.
Patterns of interethnic marriage in three hypothetical communities

Intermarriage rates and ethnic diversity in the three communities

A straightforward way to account for these differences is to control for each community’s diversity when calculating the intermarriage rate. I do this in row 3 of Table 2 by dividing the observed intermarriage rate by the community’s ethnic heterogeneity (ELF), as shown here:
 \begin{equation}{I_{{{community}}\,{{diversity}}}} = \frac{{{r_c}}}{{1 - \mathop{\sum}\nolimits_{g}p_{gc}^2}},\end{equation}
where rc is the observed intermarriage rate in community c and pgc is the proportion of group g in community c.
By adjusting the intermarriage rate to account for opportunities to marry outside of one’s own ethnic group, this approach better captures the component of intermarriage that reflects intergroup social distance, the outcome that most researchers who invoke intermarriage rates are aiming to capture. In this particular example, the adjustment has the effect of up-weighting the observed intermarriage rate in communities 2 and 3 to reflect the fact that, given their greater homogeneity (and counterfactual lower intermarriage rate under random matching), achieving the same 33 percent observed rate of outmarriage implies a greater acceptance of out-group unions than in community 1.
Controlling for exposure in this way may still be misleading, however. To see why, consider the differences between communities 2 and 3. These two communities have identical levels of ethnic diversity but group-level patterns of intermarriage vary. In community 2, members of the largest group, group A, outmarry 25 percent of the time, slightly lower than the 33 percent rate we would have expected to observe if they had chosen marriage partners at random. By contrast, in community 3, members of group A do not outmarry at all, suggesting a conscious reluctance to select partners from other ethnic groups. This reluctance, combined with group A’s large size in the community, is reflected in community 3’s lower intermarriage rate, as reported in row 4 of Table 2, where the estimated intermarriage rates control for exposure at the group level by taking the sum of the ratio of observed and expected outmarriage rates of each group in the community, weighted by the group’s size:
 \begin{equation}{I_{{{group}}\,{{share}}}} = {\mathop{\sum}\limits_{g}} \left( {\frac{{{r_{gc}}}}{{\left( {1 - {p_{gc}}} \right)}} \cdot {p_{gc}}} \right),\end{equation}
where rgc is the observed intermarriage rate for ethnic group g in community c and pgc is the proportion of individuals from group g in community c. If we seek to use intermarriage rates to make inferences about people’s willingness to marry across group lines independent of their exposure to potential out-group marriage partners—and if we have the data to make it possible to use this group-level approach—this is the approach we should use.
3. Data and analysis
I illustrate this approach using pooled data from the publicly available 10% samples of the 2000 and 2010 Zambian censuses (Ruggles et al., Reference Ruggles, Cleveland, Lovaton, Surkar, Sobek, Burk, Uhrlich, Heimann and Lee2024).Footnote 6 I begin by identifying households containing married couples and then code each couple for whether the husband and wife are from different ethnic groups.Footnote 7 In the analysis that follows, I focus on the husband, estimating counterfactual outmarriage rates based on the size of the husband’s ethnic group in the local marriage market.
In recognition of the multi-dimensional nature of ethnic identity in Africa (Scarritt and Mozaffar, Reference Scarritt and Mozaffar1999; Posner, Reference Posner2004) and in keeping with other analyses of ethnic intermarriage in the region (Bandyopadhyay and Green, Reference Bandyopadhyay and Green2021), I code ethnic group membership in two different ways: in terms of the ethnic categories used in the Zambian census (N = 61) and in terms of the broader ethnic blocks into which these ethnic census categories nest (N = 5).Footnote 8 The former captures something close to what Posner (Reference Posner2005), in his account of ethnic politics in Zambia, terms “tribal” identities, whereas the latter captures membership in one of the country’s five main politically relevant linguistic/regional groups. Intermarriage across ethnic census categories is mechanically higher than across ethnic blocks because many intermarriages of the former kind are defined as within-group marriages under the latter categorization. More important, intermarriage across ethnic blocks indicates a much greater crossing of social boundaries, and thus carries more weight as an indicator of social cohesion.Footnote 9 Social cleavages defined by ethnic blocks have also been found to be more salient for outcomes like local public goods provision than cleavages defined by narrower ethnic census categories (Gershman and Rivera, Reference Gershman and Rivera2018). For these reasons, most studies in Africa that employ intermarriage rates as indicators of the rigidity of ethnic boundaries (Crespin-Boucaud, Reference Crespin-Boucaud2020; Demarest and Haer, Reference Demarest and Haer2022; Kyei, Reference Kyei2022) aggregate ethnic groups into broader categories before calculating rates of interethnic marriage.Footnote 10
As in other studies, I exploit the data to document variation in interethnic marriage across space and time. Estimating intermarriage rates at the subnational level, whether across regions or across urban and rural areas, is important because countrywide interethnic marriage rates mask substantial local variation. The countrywide intermarriage statistic that is claimed to summarize the character of intergroup relations in a country may not be particularly informative about the rigidity of ethnic boundaries in some areas, and these may be precisely the areas that are responsible for the outcome—conflict, ethnic voting, etc.—that the interethnic marriage rate is invoked to explain.Footnote 11
For the analyses of change over time, I calculate average intermarriage rates by decade based on the wife’s year of first marriage, taking advantage of a census question that collects this information.Footnote 12 Coding survey respondents as urban or rural is complicated by the fact that urban/rural designations were only recorded in the 2000 census. For 2010, I code as urban all respondents who were enumerated in a constituency whose population was more than 50 percent urban in the 2000 census, with all others coded as rural.Footnote 13 Creating aggregations by province is complicated by the fact that an additional province, Muchinga, was added between 2000 and 2010. Results for Muchinga are calculated for the 2000 census sample by building the new province from its component districts and subtracting those districts from the provinces from which they were shifted.
A significant departure from prior analyses of intermarriage in Africa is the calculation of intermarriage rates in local marriage markets, exploiting information about the demography of the areas (in the present analysis, constituencies) in which individuals find their marriage partners.Footnote 14 Because each individual has a counterfactual expectation for outmarriage based on their group’s population share in the constituency, all estimates reported in this Note are built up from individual-level estimates, weighted by the constituency’s proportion of the unit in question (the country as a whole, urban areas, the population of marriageable-aged people in the 1970s, etc.).
While constituencies are in some cases imperfect proxies for actual local marriage markets, they offer a much better approximation of the local environment in which people choose their partners than might be suggested by the demographics of the country as a whole (the approach adopted in Crespin-Boucaud (Reference Crespin-Boucaud2020)). It is well established that marriage likelihoods are inversely related to the distance between the residences of would-be partners (Peach and Mitchell, Reference Peach, Mitchell, Mascie-Taylor and Boyce1988). Reducing the size of the unit that defines the marriage market therefore increases the likelihood that it captures the ethnic demographics of the actual population of prospective partners.
Consider, for example, that while ethnic fractionalization in Zambia is 0.28 countrywide when measured in terms of ethnic blocks, it ranges from 0 in the most homogeneous quintile of constituencies to 0.76 in the most heterogeneous quintile.Footnote 15 This huge cross-constituency variation in ethnic diversity—which drives the “opportunity” component of interethnic marriage—is ignored if we take no account of the local conditions in which people select their marriage partners. Even if electoral constituencies do not perfectly map onto marriage markets, controlling for local demography defined at this level almost certainly improves our estimates of the component of marriage choice that reflects preferences about who is acceptable to marry rather than simply opportunities for marrying across group lines.Footnote 16
A challenge with using census data to estimate intermarriage rates in local marriage markets is that the location at which couples are enumerated may be different from the location in which they met one another and were married. To address this issue, I limit the analysis to couples whose estimated year of marriage occurred after they were first resident in their current location. Adopting this rule reduces the sample size by roughly half, but it raises confidence that the marriage market employed in the analysis reflects the marriage market that census respondents inhabited when they chose their spouses.Footnote 17
4. Intermarriage in Zambia
Estimates of intermarriage rates in Zambia based on the procedures just described are presented in Table 3. I report intermarriage rates for the country as a whole and broken down by decade, urban/rural location, and province. For each sub-sample, I present both the observed and exposure-adjusted intermarriage rates, with intermarriages across both ethnic census categories and ethnic blocks. As expected, intermarriage rates are increasing over time and are higher in urban areas and predominantly urban provinces like Lusaka and Copperbelt. Observed intermarriage rates are also higher, as anticipated, when groups are defined in terms of ethnic census categories versus ethnic blocks. Although the exposure-adjusted intermarriage rates are consistently higher than the observed intermarriage rates, this difference is not meaningful in and of itself: it is a mechanical artifact of dividing the observed rate by a value <1. This said, the exposure-adjusted rates, taken on their own, are highly informative, as they convey how much the observed intermarriage rate diverges from the expected intermarriage rate under random matching.Footnote 18 An exposure-adjusted estimate of 1 would indicate perfectly neutral preferences across marrying within versus outside of one’s group, whereas values increasingly less than 1 suggest greater reluctance to marry across group lines.Footnote 19
Intermarriage rates in Zambia

Note: Sample is restricted to couples where both the husband and wife were resident in their current location prior to their marriage. Intermarriage rates in columns 2 and 4 are calculated as described in equation 2. Sample sizes are from the ethnic census category analyses. Ethnic block analyses occasionally have slightly smaller sample sizes due to missingness of individuals whose ethnic groups do not map onto one of the five ethnic blocks.
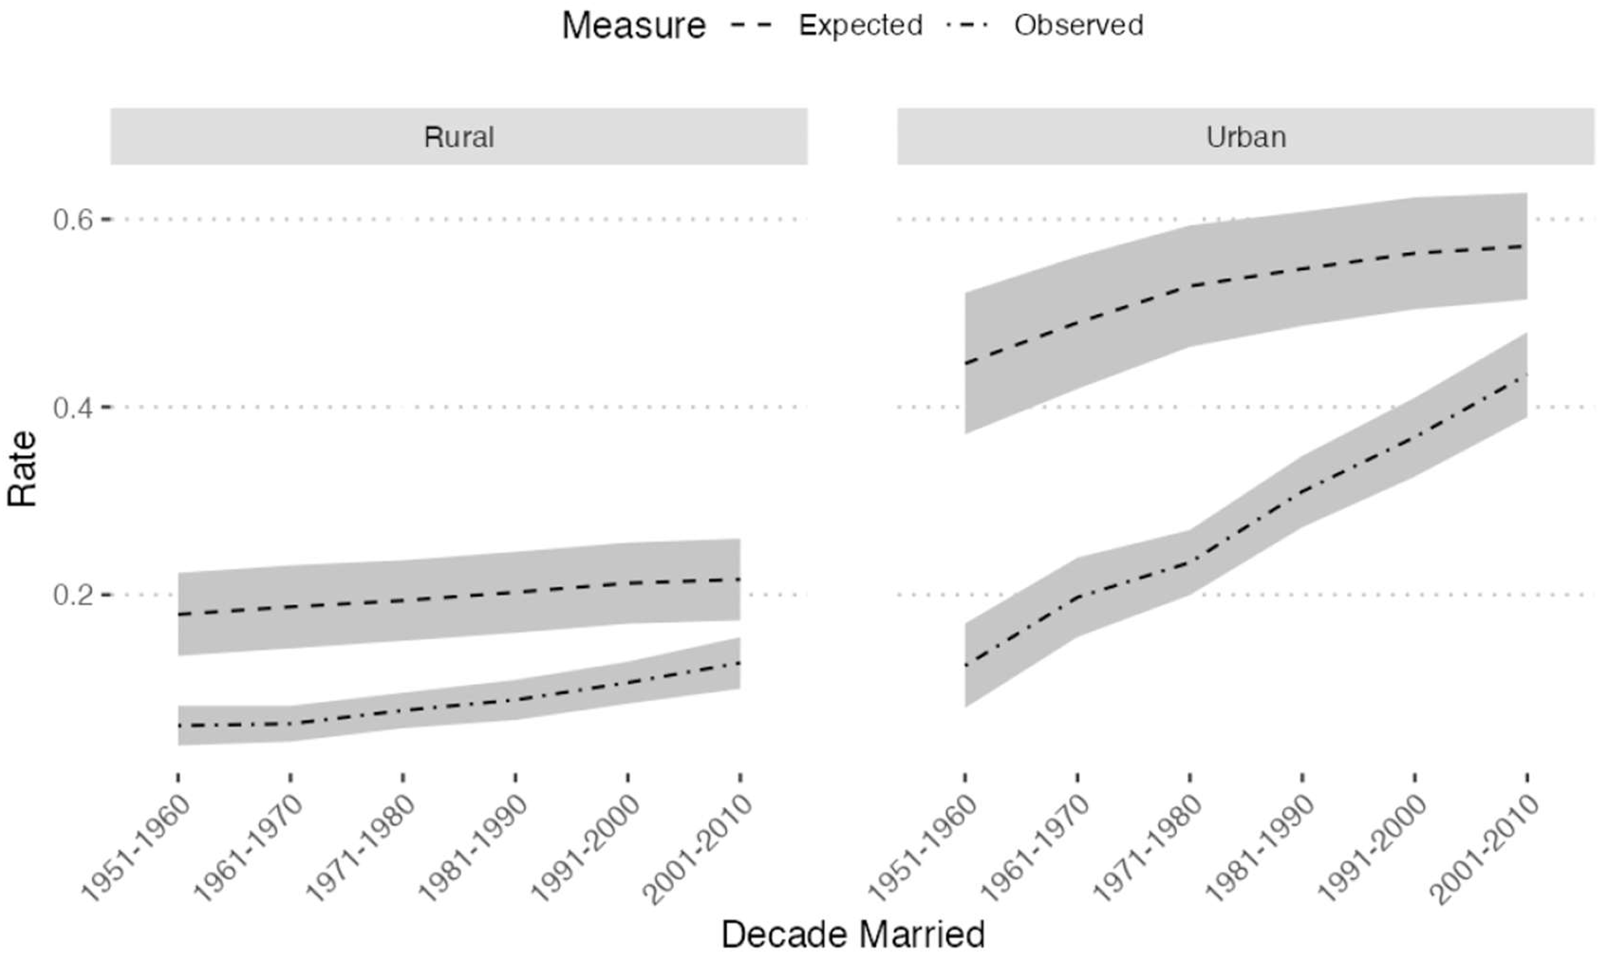
From a substantive standpoint, the real payoff from controlling for exposure comes when we explore the variation in interethnic marriage rates across time and space. The usual story about intermarriage in Africa is that it is rising over time and that this indicates an increasing porosity of ethnic boundaries (Bandyopadhyay and Green, Reference Bandyopadhyay and Green2021; Pengl et al., Reference Pengl, Roessler and Rueda2022). However, the patterns in Figure 1, which plots changes from the 1950s to the 2000s in observed and expected intermarriage rates across ethnic blocks, suggest a more nuanced account.Footnote 20 In urban areas (right panel), the observed and expected intermarriage rates increase roughly in parallel through the 1970s, suggesting that changes in intermarriage patterns during this period were driven primarily by changes in exposure: as more Zambians migrated from rural to urban areas, urban marriage markets offered greater opportunities for individuals to meet potential partners from other ethnic groups. However, beginning in the 1980s, the expected intermarriage rate flattens out while the observed rate begins climbing more steeply, indicating that something beyond increasing exposure to out-group members—changing preferences—is driving the increase in intermarriage. This shift in preferences is what most scholars take the increase in intermarriage rates to imply. But Figure 1 suggests that the change in preferences only began to emerge in urban areas in the 1980s.
Changes in observed and expected intermarriage rates, by urban/rural location (ethnic block).

When we look at rural Zambia (left panel), we see something different. The observed and expected intermarriage rates move closely in parallel through the entire time series, with the gap between the lines narrowing only slightly beginning in the 1990s. These patterns suggest that the (more modest) increase in intermarriage rates in rural Zambia has been driven mainly by exposure rather than by increasing openness to marrying outside of one’s group, with (modest) evidence for changing preferences appearing a full decade after it emerges in urban areas.
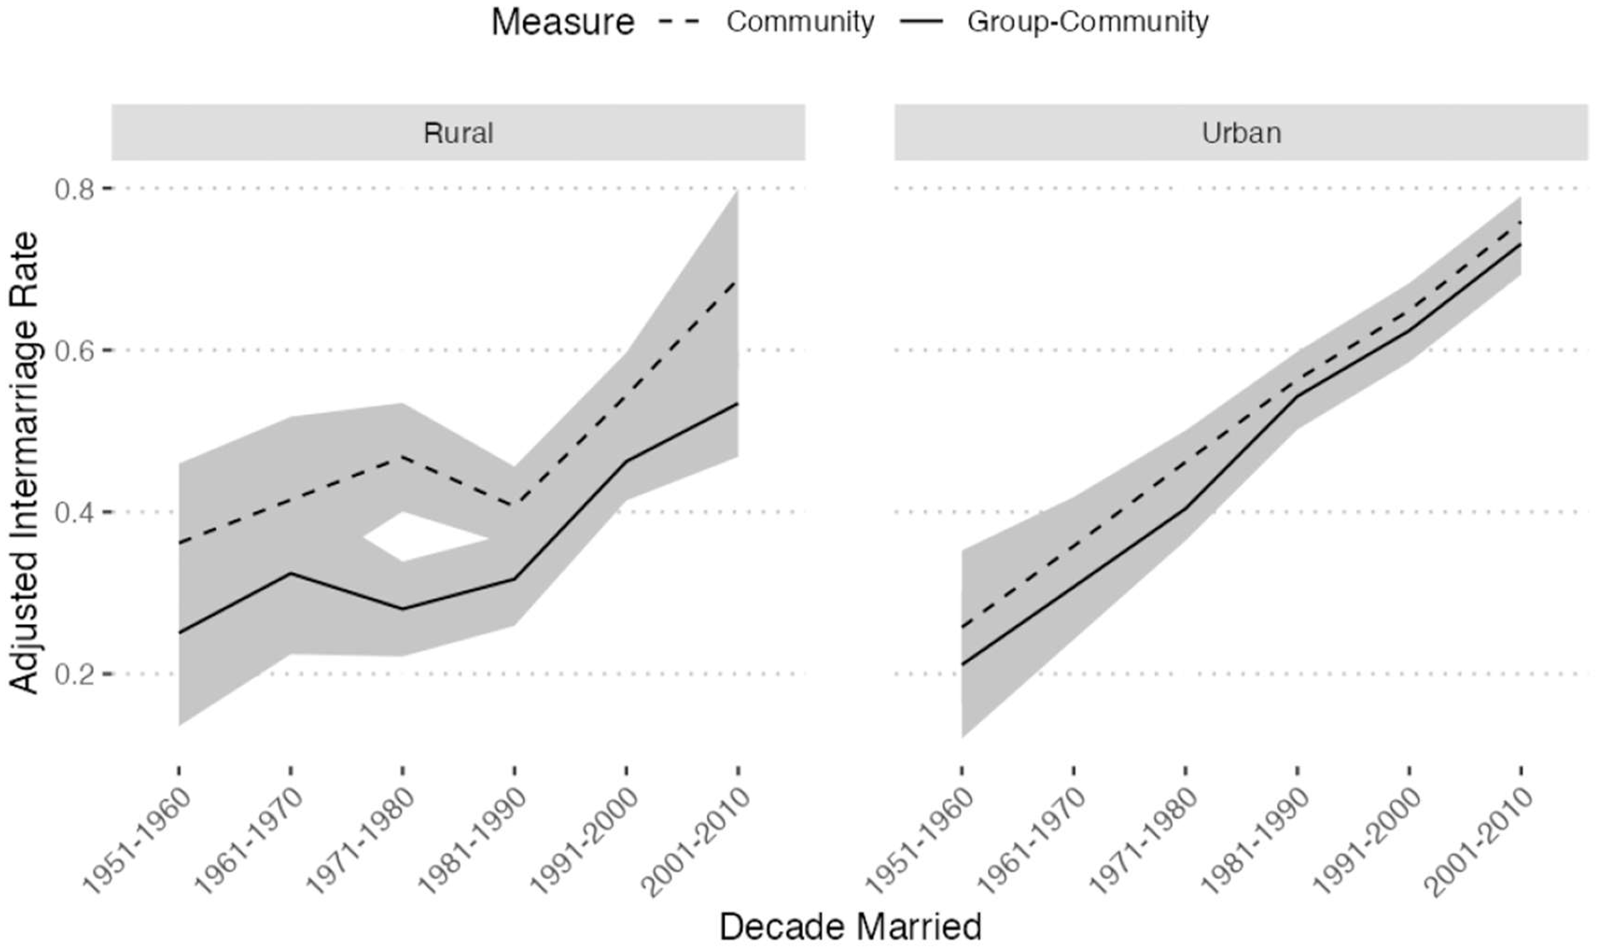
Figure 2 plots the change over time in the exposure-adjusted intermarriage rates by ethnic block, as introduced in this Note.Footnote 21 I calculate these rates both in terms of the diversity of the marriage market in which couples were located at the time they were married (as in equation 1, solid line) and in terms of the share of the marriage market belonging to ethnic groups other than the individual’s own (as in equation 2, dashed line). The trends capture changes in the component of intermarriage rooted in preferences about marrying outside of one’s group—theoretically, the net of the two curves presented in Figure 1. The steeper inflection points in the rural panel reflects the fact that marrying outside of one’s group is more challenging in rural than urban areas, so even small changes in outmarriage rates generate big effects once we control for exposure. The narrower gap between the two lines in the urban panel likely reflects the greater willingness of members of larger groups to cross ethnic boundaries in urban marriage markets (as illustrated in the difference between communities 2 and 3 in the example provided earlier)—something that the group-level exposure measure captures but the community-level measure does not.Footnote 22
Changes in exposure-adjusted intermarriage rates, by urban/rural location (ethnic block).

5. Conclusion
Intermarriage is a product of both preferences and opportunity, but it is often treated as indicating only the former. In this Note, I have introduced and applied a new methodology for calculating intermarriage rates that, by controlling for exposure to non-coethnics, allows for the disentangling of these two drivers of interethnic marriage. Beyond simply accounting for exposure, the approach makes three distinct advances over prior efforts to measure interethnic marriage in African countries: it controls for exposure to out-group members in local marriage markets rather than in the country as a whole; it estimates exposure at the group level, calculating the expected counterfactual outmarriage rate for each group in each marriage market; and it employs much richer data than prior studies, which makes the first two innovations possible. The contribution made by each of these advances is illustrated in Table 4, which presents intermarriage rates at the ethnic block level, estimated using different data sources and approaches.
Intermarriage rates in Zambia, by data source and approach (ethnic block)

Note: Intermarriage rates presented in column 1 are calculated from the pooled DHS samples from 1996, 2001, and 2013 using the same procedures as employed elsewhere in this Note. Figures in columns 2–4 are from the pooled 10% census samples from 2000 and 2010. N refers to the number of married couples included in the countrywide estimates presented in the first row.
A comparison between columns 1 and 2, which present observed (i.e., non-exposure-adjusted) intermarriage rates using different data sources, demonstrates the benefits of using stacked 10% census samples rather than data from DHS surveys. In addition to the nearly 20× larger sample size, the census data is truly representative, whereas DHS data, while designed to be nationally representative, is not necessarily representative of all ethnic groups or the demography of sub-national units. The shift to the more comprehensive, census-based data source is associated with quite different intermarriage estimates, especially in rural areas.
Column 3 repeats the analysis from column 2, but controls for out-group exposure at the country level by dividing the observed intermarriage rate by country-level ethnic diversity, akin to the strategy employed in Crespin-Boucaud (Reference Crespin-Boucaud2020). Column 4 does the same thing but controls for exposure at a level that more closely approximates local marriage markets, estimating exposure-adjusted intermarriage rates at the constituency-level by dividing observed intermarriage rates in each constituency by constituency-level diversity before aggregating upward to the desired unit (as in equation 1). The impact of defining the marriage market more locally is immediately apparent: the estimates in column 4 are quite different from those in column 3. The larger estimates in the analyses using the constituency-level exposure adjustments reflect the fact that exposure to out-group members in the actual locations where people live is significantly lower than might be suggested by the demography of the country as a whole, resulting in higher adjusted intermarriage rates once one accounts for this lower exposure.Footnote 23
Column 5 then recalculates the intermarriage rates presented in column 4, leveraging group-level rather than marriage market-level counterfactuals for outmarriage (as in equation 2). Once again, we see that changing how we control for exposure is associated with changes in the estimates we generate, with the slightly lower values in column 5 relative to column 4 reflecting the tendency for members of larger groups to outmarry less frequently than members of smaller groups.
Implementing the approach described in this Note requires more data than are often available to researchers. But where the appropriate data are available—for example, in countries with publicly accessible census data that includes information about ethnic group membership—employing the methodology outlined here will provide a superior measure of social cohesion than prior measures that rely on observed intermarriage rates, opening the door to new insights about how intergroup relations vary across space and change over time.
Supplementary material
The supplementary material for this article can be found at https://doi.org/10.1017/psrm.2026.10097. To obtain replication material for this article, https://doi.org/10.7910/DVN/OXLAQH.
Acknowledgements
The author thanks Riya Kadam, Galen Murray, and especially Branden Bohrnsen for his indispensable input and data analysis. Elliott Green, Noah Nathan, Volha Charnysh, and two anonymous reviewers provided helpful comments.


 Open access