





1. Introduction
Snowflakes fall to Earth and leave a message
Henri Bader (1907 Brugg, CH—1998 Miami, USA)
Glacier ice represents an invaluable natural archive, preserving ordered signals of past environmental and climatic conditions. The science of extracting such information began when, during an overwintering expedition in Greenland, Ernst Sorge realized that digging deep into the snow and firn layers was equivalent to accessing increasingly ancient information (Sorge, Reference Sorge1933). Since then, the paleoclimatic exploitation of glaciers has advanced enormously, supported by the development of drilling systems capable to probe the thickness of glaciers through ice cores. The latter have revolutionized our understanding of Late Pleistocene and Holocene climate history.
Ice-core science divides into two branches: one centered on polar ice sheets and the other on mountain glaciers. Polar ice sheets provide continuous archives over the last hundreds of thousands of years, offering insights into long-term hemispheric and global processes (EPICA Community Members, 2004). In contrast, mountain glaciers typically cover shorter intervals, from millennia to decades, but with high temporal resolution. They enable detailed reconstructions of regional climate variability (Kang and others, Reference Kang2002; Kozachek and others, Reference Kozachek2017). Moreover, mountain ice cores are especially suited to investigate anthropogenic pollution over the past centuries (Barbante and others, Reference Barbante2004; Eichler and others, Reference Eichler2023), linkages between climate, ecosystems and human societies (More and others, Reference More2017; Brugger and others, Reference Brugger2021), and high-frequency atmospheric processes (Knüsel and others, Reference Knüsel, Brütsch, Henderson, Palmer and Schwikowski2005; Lindau and others, Reference Lindau2021). Finally, low- and mid-latitude mountain glaciers are located closer to emission sources of many atmospheric species and inhabited regions. They are therefore sensitive to short-lived atmospheric tracers (Schwikowski and others, Reference Schwikowski, Brütsch, Gäggeler and Schotterer1999; Preunkert and others, Reference Preunkert, Wagenbach, Legrand and Vincent2000), while impacting downstream populations (Carey and others, Reference Carey, Molden, Rasmussen, Jackson, Nolin and Mark2017).
Most ice cores drilled so far, whether from polar or mountain glaciers, have been retrieved from the cold portions of glacier, where the ice is constantly below its pressure-melting point. By contrast, temperate ice exists at the pressure-melting point and contains liquid water. Because cold ice preserves stratigraphic signals more faithfully, ice-core science has historically focused on it. Today, however, interest in temperate ice cores is growing, as climate warming is driving many cold glaciers toward temperate conditions.
Global warming not only causes glacier retreat but also raises englacial temperatures, shifting cold ice toward temperate regimes (Gabrielli and others, Reference Gabrielli2010; Marshall, Reference Marshall2021). Temperate ice is subject to melting, water percolation and loss of annual snow deposition, all of which can attenuate, relocate or erase paleoclimatic signals (Moser and others, Reference Moser, Thomas, Nehrbass-ahles, Eichler and Wolff2024). Because of climate change, the number of cold mountain glaciers is thus declining (Gilbert and others, Reference Gilbert, Wagnon, Vincent, Ginot and Funk2010; Hoelzle and others, Reference Hoelzle, Darms, Lüthi and Suter2011).
In the era of climate change, it is essential to improve our ability to extract and interpret relict information preserved in temperate ice. This requires a better understanding of the physicochemical processes operating under temperate conditions in order to disentangle post-depositional alterations from climatic signals. Temperate ice cores have been sporadically studied in the past, but no comprehensive synthesis exists. The aim of this work is to fill this gap by providing an overview of temperate ice-core science, summarizing past research and outlining priorities for the future.
2. What is temperate ice? What are temperate glaciers?
A large fraction of glacier ice exists at the melting point where solid and liquid phases coexist (Lliboutry, Reference Lliboutry1971). Liquid water in temperate ice is unevenly distributed, filling a network of veins developed at the junctions between ice grains (i.e. ice crystals), in particular at junctions where three grains meet (triple junctions; Nye and Frank, Reference Nye and Frank1972; Mader, Reference Mader1992). Despite being micrometer-scale in thickness (Fig. 1), these interconnected veins make temperate ice weakly permeable (Fowler and Iverson, Reference Fowler and Iverson2022). Additional liquid inclusions also occur within ice grains as micrometer–millimeter features (Fig. 1).
Microscopic liquid inclusions in temperate ice. Panel a: an overview of the possible types of liquid inclusions, including intragrain inclusions (a), flat inclusions at the surface separating two ice grains (b), air bubbles surrounded by a film of liquid water (c) and inclusions at triple junctions (d); the figure is from Lliboutry (Reference Lliboutry1971). Panel b: the network of liquid water veins developed around ice grains in real temperate glacier ice (from Raymond and Harrison, Reference Raymond and Harrison1975). Panel c: a sketch representing the geometry of liquid-filled veins in temperate ice (from Nye and Frank, Reference Nye and Frank1972). Panel d: liquid water filling the veins found at grain junctions in artificial temperate ice (from Mader, Reference Mader1992). Panel e: air bubbles surrounded by liquid water pockets in temperate ice (from Raymond, Reference Raymond1976). Panel f: Tyndall’s figures in temperate ice: snowflake-shaped cavities filled with liquid water and presenting a central void bubble (from Nakaya, Reference Nakaya1956, figure 17, in the public domain).

The equilibrium temperature of temperate ice is not necessarily 0°C, as the melting point can be depressed by pressure and impurities present in the ice (Lliboutry, Reference Lliboutry1971; Harrison, Reference Harrison1972). The water content of temperate ice is controlled by vein and inclusion geometry. Field data indicate seasonal variability, which rarely exceeds 5% (Vallon and others, Reference Vallon, Petit and Fabre1976; Murray and others, Reference Murray, Stuart, Fry, Gamble and Crabtree2000). Above this threshold, ice becomes saturated and excess meltwater drains to form supra-, en- and subglacial channels (Shreve, Reference Shreve1972).
The thermal regime strongly controls glacier behavior. Ice at the melting point deforms more readily than cold ice (Homer and Glen, Reference Homer and Glen1978), making temperate glacier portions more easily deformable (Ryser and others, Reference Ryser2014). Temperature also influences basal processes: the occurrence of meltwater in temperate-based glaciers enhances basal sliding and erosion relative to cold-based glaciers (Alley and others, Reference Alley, Cuffey and Zoet2019).
For temperate glaciers, the occurrence of meltwater accelerates the transformation of firn into ice. During partial melting, ice grains round off, enhancing their packing (Cuffey and Paterson, Reference Cuffey and Paterson2010). Packing is also favored by the lubricating effect of water itself. The penetration of winter cold let water-soaked firn to freeze. Ice formed through this mechanism is defined as superimposed ice and typically contains little gas, as the porosity of firn had been occupied by liquid water before freezing. When superimposed ice forms, the density of firn increases rapidly, reaching the value distinguishing firn from ice (830 kg·m−3) in a single season (Koerner, Reference Koerner1970). Temperate ice does not entirely consist of superimposed ice; typically, layers rich in bubbles are also present, reflecting the alternation between warmer/wetter conditions and colder/drier ones (Coachman and others, Reference Coachman, Enns and Scholander1958; Vallon and others, Reference Vallon, Petit and Fabre1976; Fig. 2b).
Effects of meltwater infiltration in firn. (a) Ice lenses (IL) in cold firn with alternating sections of porous firn and more compact ice from refrozen meltwater (ice core from the Belukha glacier, Siberian Altai, Russia). (b) The resulting typical structure in temperate ice with bubbly ice alternated with bubble-free compact layers (ice core from the Adamello glacier, Alps, Italy).

Glaciologists have been discussing for a long time about the classification of glaciers in relation to their thermal properties. The first of such classifications was independently proposed in the 1930s by Lagally (Reference Lagally1932) and Ahlmann (Reference Ahlmann1935), and, given their partial overlap, they are now referred to as the Lagally–Ahlmann classification, which identifies:
(1) cold (or high-polar) glaciers, which never reach the melting temperature and whose ice is formed through the slow recrystallization of firn;
(2) transitional (or subpolar) glaciers, which are basically cold but with some surface melting during summer; and
(3) temperate (or warm) glaciers, which consist of ice at the melting point apart from a surface layer which can be cold in winter and temperate in summer. At such glaciers, ice is formed by the recrystallization of the annual surplus of precipitation through thaw/freeze cycles.
The elegance of this classification lies in its simplicity. However, its oversimplification fails to describe the variable thermal structure of glaciers. More complete classifications were proposed in the 1950s (Court, Reference Court1957). Later, as it became clear that a single glacier can hardly be described by a single thermal regime, a new approach emerged. It was based on the fact that most glaciers are characterized by portions with different thermal characteristics. Some portions can lie in a temperate state while others can be cold. Glaciers responding to these features, and they are the majority, are defined as polythermal (Miller, Reference Miller1976).
3. Ice temperature, ice cores and climate change
Considering ice cores, the temperature of the glacier at the drilling site is of outmost importance. Until now, most ice cores, including the ones from mountain glaciers, have been retrieved at sites where the ice is cold. The absence of melting guarantees the preservation of paleoclimatic records embedded in glacier ice. As such, a fundamental parameter to assess the feasibility of a potential drilling site is the vertical distribution of temperature within the glacier (Schwikowski and others, Reference Schwikowski, Schläppi, Santibañez, Rivera and Casassa2013; Kutuzov and others, Reference Kutuzov2016).
Figure 3 provides representative borehole temperature profiles from a range of glaciers, highlighting the continuum between cold and temperate conditions. The plotted examples span from clearly cold drilling sites to fully temperate settings (Blue Glacier), showing a flat 0°C temperature profile. Alto dell’Ortles glacier is an instructive intermediate case: the upper 30 m are temperate, while deeper ice is cold. This composite structure reflects recent atmospheric warming, which has driven the shallow layers from cold to temperate (Gabrielli and others, Reference Gabrielli2016).
Borehole temperature profiles measured at ice-core drilling sites. Data from Cerro Mercedario, Argentinean Andes (Schwerzmann, Reference Schwerzmann2006; Vimeux and others, Reference Vimeux2009); Belukha, Siberian Altai (Olivier and others, Reference Olivier2003); Colle Gnifetti, Alps (Schwerzmann, Reference Schwerzmann2006); Col du Dome, Alps (Vincent, Reference Vincent2020); Illimani, Bolivia (Vimeux and others, Reference Vimeux2009); Fiescherhorn, Alps (Schwerzmann and others, Reference Schwerzmann, Funk, Blatter, Lüthi, Schwikowski and Palmer2006); Ortles, Alps (Gabrielli and others, Reference Gabrielli2016); and Blue Glacier, Olympic Mountains (Harrison, Reference Harrison1972). For the Col du Dome site, two temperature profiles (1994 and 2017) are shown.

Figure 3 Long description
The plot shows ice temperature profiles for various borehole sites. The x-axis is labeled ′Ice Temperature (degrees Celsius)′ ranging from -20 to 0. The y-axis is labeled ′Depth (m)′ ranging from 0 to -160. Profiles include Cerro Mercedario, Belukha, Colle Gnifetti, Col du Dome (1994 and 2017), Illimani, Fiescherhorn, Ortles and Blue Glacier. Cold sites like Cerro Mercedario and Belukha show temperatures below -15 degrees Celsius, while temperate sites like Blue Glacier are near 0 degrees Celsius. Depth increases downward, with cold conditions on the left and temperate on the right. Notable regions include near-isothermal sections at Blue Glacier and colder gradients at Cerro Mercedario. The plot highlights the transition from cold to temperate conditions across different sites.
Ice temperature in glaciers is strictly controlled by atmospheric temperature. Glaciers present a cold portion where the mean annual air temperature is below −15°C. At this condition, air and ice temperatures are nearly identical a few meters below the surface (Zagorodnov and others, Reference Zagorodnov, Nagornov and Thompson2006). At warmer sites, even sporadic summer melt allows water to percolate into the firn and refreeze (Fig. 2a), releasing latent heat. This process significantly warms the ice. Where mean annual air temperature exceeds −15°C, ice can be up to 15°C warmer than the mean air temperature, leading to temperate conditions despite a negative annual mean (Zagorodnov and others, Reference Zagorodnov, Nagornov and Thompson2006).
Climate change is altering the thermal state of glaciers. It could be argued that this translates into higher ice temperatures, but this is not always observed. Paradoxically, small glaciers now lying below the equilibrium line are cooling because the loss of the snow/firn cover, an effective winter insulator, exposes them to the penetration of winter cold waves (Huss and Fischer, Reference Huss and Fischer2016). By contrast, the upper parts of large mountain glaciers, situated above the equilibrium line, are undergoing marked warming. Cold sectors of glaciers are particularly vulnerable: they warm through direct atmospheric heat exchanges and through latent heat from refreezing of infiltrating meltwater (Ochwat and others, Reference Ochwat, Marshall, Moorman, Criscitiello and Copland2021). Temperate glaciers respond differently: they are primarily sensitive to mass loss, since any additional energy input is directly available to melt ice.
Among the borehole profiles reported in Fig. 3, two refer to the same glacier (Col du Dôme, Mont Blanc, Alps) but to different years (1994 and 2017). Comparing the two curves, it is evident that at this site the ice has warmed from the surface down to 100 m depth (Vincent and others, Reference Vincent2020). Similar trends are reported from Monte Rosa (Alps), where temperatures at 20 m depth rose by 6–7°C between 1991 and 2008 (Hoelzle and others, Reference Hoelzle, Darms, Lüthi and Suter2011). These rates are an order of magnitude higher than concurrent atmospheric warming due to latent heat effects (Gastaldello and others, Reference Gastaldello, Mattea, Hoelzle and Machguth2025). At Alto dell’Ortles (Alps), a site formerly characterized by cold ice, the upper 40 m have already transitioned to temperate conditions (Gabrielli and others, Reference Gabrielli2016).
4. Chemical and physical processes in temperate ice
Glacier ice forms from atmospheric precipitation, and its composition reflects atmospheric conditions and constituents. Yet signals preserved in ice are not completely stable and undergo post-depositional alteration, from polar ice sheets to temperate mountain glaciers. Documented processes include: (1) snow redistribution by wind and partial loss of precipitation (Fisher and others, Reference Fisher1983); (2) snow/firn sublimation (Ginot and others, Reference Ginot, Kull, Schotterer, Schwikowski and Gäggeler2006); (3) re-emission of volatile species (Wagnon and others, Reference Wagnon, Delmas and Legrand1999); (4) gas fractionation in firn (Huber and others, Reference Huber2006); (5) impurity mobilization during recrystallization or meltwater percolation (Moser and others, Reference Moser, Thomas, Nehrbass-ahles, Eichler and Wolff2024); (6) chemical diffusion (Cuffey and Steig, Reference Cuffey and Steig1998); (7) layer thinning from ice flow; and (8) englacial geochemical reactions (Baccolo and others, Reference Baccolo2021). Some of these processes occur regardless of thermal regime (e.g. wind redistribution, layer thinning), others are typical of cold polar contexts (volatile re-emission, gas fractionation, englacial reactions), while several are enhanced under temperate conditions due to liquid water. Here we summarize the main results on post-depositional processes occurring in temperate ice.
4.1. Salts, ionic species and self-purification of temperate ice
In his pioneering work, Renaud (Reference Renaud1949) researched the distribution of impurities into glacier ice exploiting fractional melting, with the first fraction corresponding to the outer layer of ice grains (crystals) and the last one to their central portions (Fig. 4a). He utilized conductivity as a proxy for the concentration of ionic salts. These are his main results: (1) ‘Whatever its origin the glacier grain is always composed of a crystal of pure ice surrounded by a saline skin’; (2) ‘The salinity of the skin is greater in the ice of the névé [the accumulation area of glaciers] than in that of the glacier proper [intended as the glacier tongue]’; and (3) ‘The purity of the ice constituting the nucleus of the crystal is greater in the ice of the terminal region than in that of the névé’. The glaciologist first observed that the distribution of salts into glacier ice grains is not uniform. They are concentrated in the outer layer. This is visible in Fig. 4a, where for the two ice specimens (cold and temperate ice) the highest conductivity is observed in the first melting fraction, corresponding to the outer part of grains. Although the trend is similar for cold and temperate ice, in temperate ice the conductivity is lower, revealing that temperate ice is purer than cold ice (Renaud, Reference Renaud1949).
Temperate ice self-purification. Panel a (redrawn from Renaud, Reference Renaud1949): the conductivity of meltwater fractions produced from different portions of glacier ice grains (in blue, a sample of cold ice, in red, a sample of temperate ice). Panel b (redrawn from Harrison and Raymond, Reference Harrison and Raymond1976): conductivity and ice-grain size vs depth in a temperate glacier; the dotted line is the moving average (sampling window: 5). Panel c (redrawn from Johannessen and Henriksen, Reference Johannessen and Henriksen1978): impurities in fractions of meltwater from melting snow; data are expressed as the ratio between the concentration observed in meltwater and in the bulk snow sample. Panel d (redrawn from Davies and others, Reference Davies, Vincent and Brimblecombe1982): ionic species in a temperate ice core; on the right, information about the firn/ice structure (I, snow and low-density firn; II, consolidated porous firn; III, ice with vertically connected bubble systems; and IV, bubbly compact ice); the red area highlights section III of the core.

Figure 4 Long description
Panel a shows conductivity versus position in ice grains, with the x-axis labeled ′Position in ice grains′ and the y-axis labeled ′Conductivity (μS/cm)′. Conductivity is highest at the grain surface and decreases towards the center. Panel b plots conductivity against depth in a temperate glacier. The x-axis is ′Conductivity (μS/cm)′ and the y-axis is ′Depth (m)′. Conductivity decreases with depth, with a moving average line. Panel c displays concentration versus meltwater volume percent. The x-axis is ′Meltwater volume %′ and the y-axis is ′Concentration′. Concentration decreases as meltwater volume increases. Panel d shows ionic species versus depth. The x-axis has multiple units for different ions and the y-axis is ′Depth (m)′. It includes sulfate, nitrate, magnesium, sodium and chloride ions, with distinct profiles for each. The panels together illustrate the distribution of conductivity and ionic species in glacier ice and meltwater, highlighting variations with depth and meltwater volume.
Temperate ice is not only purer than cold ice but also purer than the snow from which it forms, as first evidenced by Gorham (Reference Gorham1958). Moreover, temperate ice is not always pure in the same way: the deeper (and the older) the temperate ice, the purer it is (Harrison and Raymond, Reference Harrison and Raymond1976; Bouard, Reference Bouard1977). Harrison & Raymond (Reference Harrison and Raymond1976) reported that ‘Blue Glacier ice may contain substantially less salt than ice from the polar regions, even though it is located within 60 km of the Pacific Ocean.’ The two authors also found an inverse correlation between salt concentration and ice grain size (Fig. 4b).
During recrystallization, ionic impurities incompatible with the ice lattice are expelled to grain boundaries (Wolff, Reference Wolff, Wolff and Bales1996). In cold ice, these impurities remain immobile and can be preserved for hundreds to thousands of years, enabling a correct reading of paleoclimatic signals (Stoll and others, Reference Stoll2023). In temperate ice, however, grain boundaries host water-filled veins (Fig. 1a–d). Expelled impurities dissolve and are transported with liquid water (Harrison & Raymond Reference Harrison and Raymond1976). Meltwater present in junction veins thus becomes enriched in solutes and eventually flushes into the macroscopic drainage system of channels and cavities of the glacier, leading to large-scale impurity removal and purification (Glen and others, Reference Glen, Homer and Paren1977; Davies and others, Reference Davies, Vincent and Brimblecombe1982).
Since liquid water is constantly present in temperate ice, the purification is continuous: the older and deeper the ice, the purer it is (Harrison & Raymond Reference Harrison and Raymond1976). The process is also rapid. Most salts are removed before the firn turns into ice. This is because at temperate glaciers, the deep part of firn is saturated with meltwater accumulating above the transition to ice (water table). Within soaked firn, solid–liquid exchanges are enhanced, accelerating impurity removal and the formation of extremely pure solid ice (Harrison & Raymond Reference Harrison and Raymond1976; Davies and others, Reference Davies, Vincent and Brimblecombe1982). The process can be observed in Fig. 4d: below the transition to ice, ionic species rapidly reach a stable and extremely low concentration.
The firn/ice transition is critical in controlling the distribution of ionic impurities. At this depth, their concentration can locally increase, as illustrated in Fig. 4d (area highlighted in red). The concentration of ions increases between 12 and 15 m depth, reaching its maximum values for sulfate, nitrate, Mg2+, pH and Cl−. This enrichment results from the accumulation of liquid water and eluted impurities within the water table developed above the transition. Below this depth, liquid water drastically decreases, accompanied by a corresponding decrease in the concentration of impurities (Davies and others, Reference Davies, Vincent and Brimblecombe1982).
The removal of ionic impurities during melting has implications for hydrology and ecosystems. In the 1970s, anthropogenic acidification led to snowfall enriched in sulfuric and nitric acids (Likens and others, Reference Likens, Wright, Galloway and Butler1979). Studies showed that more than 60% of the acidity (H⁺) stored in snow was released within the first 30% of meltwater, with significant ecological impacts (Johannessen and Henriksen, Reference Johannessen and Henriksen1978). Alongside H⁺, nitrate, sulfate and some heavy metals were also concentrated in the early melt fractions (Fig. 4c). This phenomenon, known as the ionic pulse or acid shock (Bales and others, Reference Bales, Davis and Stanley1989), is strictly related to the self-purification of temperate ice: both involve the preferential removal of soluble species during melt. The acid shock does not only relate to polluted snow but also to natural ionic species present in the snowpack (Li and others, Reference Li2006).
Over the past 40 years, research on the distribution and mobility of ionic species in melting glacier ice has greatly advanced, with particular focus on the differential behavior of individual ions. During melting and recrystallization, some ions are preferentially eluted, depending on their solubility in ice. Numerous elution sequences have been proposed to describe the preferential order of ionic release under temperate conditions (Moser and others, Reference Moser, Thomas, Nehrbass-ahles, Eichler and Wolff2024 and references therein). Highly soluble, ice-incompatible ions such as sulfate, nitrate and Ca2⁺ are eluted first, while more compatible ions like chloride and ammonium are only marginally fractionated (Eichler and others, Reference Eichler, Schwikowski and Gäggeler2001; Vega and others, Reference Vega2016; Avak and others, Reference Avak2019; Trachsel and others, Reference Trachsel2019). Most studies on elution sequences have been carried out on seasonal snow (Avak and others, Reference Avak2019) or on sporadic melt/refreeze events which occur in cold glacier firn/ice (Eichler and others, Reference Eichler, Schwikowski and Gäggeler2001). Yet the few investigations on temperate ice show broadly similar patterns, though with continuous rather than episodic fractionation (Davies and others, Reference Davies, Vincent and Brimblecombe1982). By normalizing sequences compiled by Moser and others (Reference Moser, Thomas, Nehrbass-ahles, Eichler and Wolff2024), a mean elution order can be expressed as:
 \begin{equation}{\text{SO}}_4^{2 - } \gt {\text{NO}}_3^ - \gt {\text{C}}{{\text{a}}^{2 + }} \gt {\text{M}}{{\text{g}}^{2 + }} \gt {{\text{K}}^ + },{\text{N}}{{\text{a}}^ + } \gt {\text{C}}{{\text{l}}^ - } \gt {\text{NH}}_4^ + \end{equation}
Only ions previously reported in at least ten sequences are included in Eqn (1); others have been less frequently studied, including the anion of methane sulfonic acid, behaving between NO₃− and Ca2⁺ (Moore and others, Reference Moore, Grinsted, Kekonen and Pohjola2005; Spolaor and others, Reference Spolaor2021); I−, between Ca2⁺ and Mg2⁺ (Spolaor and others, Reference Spolaor2021); Br− and H⁺, between Na⁺ and Cl− (Brimblecombe and others, Reference Brimblecombe, Tranter, Abrahams, Blackwood, Davies and Vincent1985; Herreros and others, Reference Herreros2009; Spolaor and others, Reference Spolaor2021); and F−, typically the least fractionated ion (Eichler and others, Reference Eichler, Schwikowski and Gäggeler2001; Ginot and others, Reference Ginot, Schotterer, Stichler, Godoi, Francous and Schwikowski2010). Equation (1) should be regarded as indicative, since local conditions strongly affect mobility: for example, at maritime sites Na⁺, owing to its abundance, is often the first ion to be eluted (Spolaor and others, Reference Spolaor2021).
The differential mobility of ions during melting enables the use of concentration ratios as melt indicators in ice cores. If one species elutes before another, its residual concentration decreases faster, altering the original ratios characteristic of fresh snow. Two ratios are commonly used: Cl−/Na⁺ in non-maritime contexts, where melting increases the ratio by preferentially removing Na⁺ (Eichler and others, Reference Eichler, Schwikowski and Gäggeler2001), and Mg2⁺/Na⁺ in maritime contexts, where melting decreases the ratio by preferentially removing Mg2⁺ (Iizuka and others, Reference Iizuka, Igarashi, Kamiyama, Motoyama and Watanabe2002). An additional index was proposed by Grinsted and others (Reference Grinsted, Moore, Pohjola, Martma and Isaksson2006): log(Na+/Mg2+).
Analyses of meltwater from temperate glaciers show a fraction of meltwater being highly enriched in solutes relative to snow, ice or bulk runoff (Tranter and others, Reference Tranter, Sharp, Lamb, Brown, Hubbard and Willis2002). The enrichment is attributed to englacial mineral weathering but may also result from impurities expelled into the microscopic vein network during self-purification. Such a mechanism would explain the chemical anomalies of basal temperate ice, where salt concentrations are elevated and dominated by ice-incompatible ions (Hubbard and Sharp, Reference Hubbard and Sharp1989 and references therein). Progressive enrichment of percolating meltwater with these impurities may therefore contribute to the distinct chemistry of basal ice.
4.2. Radionuclides
Beginning in the 1960s, newly developed techniques to measure natural and artificial fallout of radionuclides in glacier ice were first applied in polar regions and soon extended to mountain glaciers. A first study carried out on a temperate glacier revealed that radionuclide concentrations in temperate firn did not match those in fresh precipitation (Picciotto and others, Reference Picciotto, Crozaz, Ambach and Eisner1967). Specifically, levels of ⁹⁰Sr (an artificial fission product, half-life 28.8 years) in firn were one tenth of those measured in snowfall, whereas 210Pb (a natural fallout product, half-life 22.3 years) showed comparable concentrations. At the time, the authors could not explain these differences, though they suspected meltwater played a role.
The contrasting behaviors are now understood as a consequence of differing chemical mobility, analogous to ionic species. Strontium, present as the soluble Sr2⁺ cation and poorly soluble in ice, readily segregates into meltwater and shows little affinity for solid substrates (Kaplan and others, Reference Kaplan, Miller, Diprete and Powell2014). In contrast, Pb is far less mobile. Atmospheric 210Pb, produced from 222Rn decay, attaches to aerosols—especially mineral dust—before being scavenged by precipitation (Baskaran, Reference Baskaran2011). Once deposited with snow, it is already bound to particulate matter, making it less susceptible to post-depositional remobilization induced by meltwater (Gäggeler and others, Reference Gäggeler, Tobler, Schwikowski and Jenk2020).
Early studies on the vertical distribution of fallout radionuclides in temperate glaciers showed that radioactive peaks linked to specific events, such as the 1986 Chernobyl accident, broadened and decreased in intensity over time (Ambach and others, Reference Ambach, Rehwald, Blumthaler, Eisner and Brunner1989). On Austrian temperate glaciers, gross beta activity measurements revealed that a few months after the accident, the fallout was confined to a snow layer less than 1 m thick. Two years later, the peak extended across 5 m of firn and, considering radioactive decay, had lost ∼35% of the originally deposited inventory (Ambach and others, Reference Ambach, Rehwald, Blumthaler, Eisner and Brunner1988, Reference Ambach, Rehwald, Blumthaler, Eisner and Brunner1989; Fig. 5a–e).
The distribution of artificial radionuclides in temperate glaciers. Panels a and b show gross beta activity measured in multiple snow/firn vertical profiles at Kesselwandferner (Oetztal Alps, Austria) in 1986, a few months after the Chernobyl accident (a), and in May 1987 (b, redrawn from Ambach and others, Reference Ambach, Rehwald, Blumthaler, Eisner and Brunner1988). For panels a and b, dotted lines refer to mean values observed in the 2 years; data are expressed in terms of inventories. In panels c–e, the vertical distribution of gross beta activity concentration in the ice is determined at three sites on the same glacier in summer 1986, 1987 and 1988 (redrawn from Ambach and others, Reference Ambach, Rehwald, Blumthaler, Eisner and Brunner1989).

Figure 5 Long description
The image A showing a vertical bar graph labeled a. The y-axis label is Gross beta activity (Bq kg superscript negative 1). The y-axis ranges from 0 to 30. A dotted horizontal line crosses the plot. Text below the bars reads 14 profiles (1986). The bars vary in height, with several bars above 10 and one bar above 20 and several bars below 10. The image B showing a vertical bar graph labeled b. The y-axis label is Gross beta activity (Bq kg superscript negative 1). The y-axis ranges from 0 to 30. A dotted horizontal line crosses the plot. Text below the bars reads 9 profiles (1987). The first bar is above 20, several bars are between 0 and 10 and one bar near the end is below 10. The image C showing a horizontal bar graph labeled c with the title 1986. The y-axis shows values 0, minus 2, minus 4, minus 6, minus 8, minus 10. The x-axis label is activity (Bq kg superscript negative 1). The x-axis tick labels are 0.1, 1, 10, 100. The x-axis uses a logarithmic scale based on the tick progression 0.1 to 1 to 10 to 100. Horizontal bars are concentrated between y equals 0 and about y equals minus 1, with bar lengths extending from near 0.1 up to near 100. The image D showing a horizontal bar graph labeled d with the title 1987. The y-axis shows values 0, minus 2, minus 4, minus 6, minus 8, minus 10. The x-axis label is activity (Bq kg superscript negative 1). The x-axis tick labels are 0.1, 1, 10, 100. The x-axis uses a logarithmic scale based on the tick progression 0.1 to 1 to 10 to 100. Horizontal bars are concentrated between about y equals minus 3 and y equals minus 6, with bar lengths extending from near 0.1 up to near 10. The image E showing a horizontal bar graph labeled e with the title 1988. The y-axis shows values 0, minus 2, minus 4, minus 6, minus 8, minus 10. The x-axis label is activity (Bq kg superscript negative 1). The x-axis tick labels are 0.1, 1, 10, 100. The x-axis uses a logarithmic scale based on the tick progression 0.1 to 1 to 10 to 100. Horizontal bars are spread from about y equals minus 4 down to about y equals minus 9, with several short bars near 0.1 to 1 and a few longer bars reaching toward 10. Across the five sub-images, the two vertical bar graphs show gross beta activity values for sets of profiles in 1986 and 1987 and the three horizontal bar graphs show activity distributions for 1986, 1987 and 1988 across the y-axis range 0 to minus 10 on a logarithmic x-axis from 0.1 to 100.
Such broadening and partial loss reflect the influence of meltwater, which mobilizes soluble and ice-incompatible radionuclides. By contrast, in cold glaciers, fallout nuclides stay in their depositional layers and are usable for ice-core chronologies (Eichler and others, Reference Eichler2000). Dating temperate ice with fallout radionuclides remains possible but requires a careful selection of species of interest (Pavlova and others, Reference Pavlova2014; Festi and others, Reference Festi, Schwikowski, Maggi, Oeggl and Jenk2021; Di Stefano and others, Reference Di Stefano2024). Among these, tritium (3H) and 210Pb are the most promising. Tritium, incorporated into water molecules, is unaffected by chemical fractionation. Although snow loss and meltwater percolation reduce its inventories and partly redistribute it into deeper ice (Oerter and Rauert, Reference Oerter and Rauert1982), its partial mobility has repeatedly allowed its application as a dating tool for temperate ice (Pinglot and others, Reference Pinglot2003; Wel and others, Reference Wel2011; Di Stefano and others, Reference Di Stefano2024). 210Pb, strongly associated with insoluble particulate matter, is also well preserved due to its low solubility and association with insoluble impurities (Von Gunten and others, Reference Von Gunten, Rössler and Gäggeler1982; Gäggeler and others, Reference Gäggeler, Tobler, Schwikowski and Jenk2020). In addition, evidence suggests that 36Cl and anthropogenic trans-uranic elements, including Pu and U, may be also relatively stable in temperate ice (Cecil and Vogt, Reference Cecil and Vogt1997; Wendel and others, Reference Wendel2013).
Other artificial radionuclides—primarily fission products such as 137Cs, often applied in cold ice-core dating (Eichler and others, Reference Eichler2000)—are unsuitable in temperate contexts. Their distribution does not reflect original atmospheric deposition but instead mirrors the abundance of insoluble impurities. Meltwater remobilizes these nuclides and promotes their attachment to dust particles, producing concentration peaks unrelated to the true depositional signal (Von Gunten and others, Reference Von Gunten, Rössler and Gäggeler1982; Di Stefano and others, Reference Di Stefano, Clemenza, Baccolo, Delmonte and Maggi2019).
4.3. Trace elements
While dozens of studies have examined the behavior of ionic species in glaciers when meltwater is present, far fewer have focused on trace elements. Yet several works demonstrate that certain elements—particularly Pb and Hg—can be preserved under temperate conditions and used them as paleoclimatic proxies and for refining ice-core chronologies (Schuster and others, Reference Schuster2002; Neff and others, Reference Neff, Steig, Clark, McConnell, Pettit and Menounos2012; Kang and others, Reference Kang2015). Their relative immobility is attributed to low solubility and strong association with particulate matter, which prevents relocation by meltwater.
Most studies, however, have addressed only individual elements. Broader comparisons are rare, with the most comprehensive insights coming from an ice core from a cold glacier, but presenting a section affected by severe meltwater infiltration and refreezing through a crevasse (Avak and others, Reference Avak, Schwikowski and Eichler2018). By comparing 35 trace elements in pristine and melt-affected sections (see Fig. 6), the authors found strong mobilization for alkali and alkaline earth metals (Ba, Mg, Sr, Ca, Na) and some transition metals (Cd, Mn, Ni, Co, Zn). These elements are characterized by moderate water solubility and/or incompatibility with the ice lattice. In contrast, elements preserved in melt-affected ice included crustal markers (Rare Earth Elements (REEs), Al, U, Fe, Cs) and volatile pollution-related elements (Sb, Pb, Cu, Mo). Their low mobility is explained considering that while in the atmosphere, these elements are adsorbed on mineral dust; once deposited on glaciers, they are thus associated with insoluble impurities (Marx and others, Reference Marx, Kamber and McGowan2008).
Fractionation of trace elements in melt-affected snow/ice. For each element, the ratio between the median concentration in melt-affected snow/ice and in pristine snow/ice is reported. Pink dots represent data from the Grenzgletscher ice core, which include a section affected by meltwater infiltration from a crevasse (Avak and others, Reference Avak, Schwikowski and Eichler2018); dark red dots refer to trace element concentrations in melting snow compared to the same snowpack prior to melting (Avak and others, Reference Avak2019).

Figure 6 Long description
The scatter plot displays the concentration ratio on the horizontal axis, ranging from 0.1 to 2 and the rank of preservation on the vertical axis, ranging from 0 to 35. The plot includes data points representing trace elements in different conditions: melt-influenced ice, melting snowpack and pristine snowpack. Pink dots indicate data from melt-influenced ice, while dark red dots represent melting snowpack. The plot shows a general trend where higher concentration ratios correspond to higher ranks of preservation. Notable elements with high preservation ranks include Ag, Sb and Bi, while elements like Mn, Cd and Ca have lower ranks. The plot highlights clusters of elements with similar preservation ranks and concentration ratios, with some outliers visible. The legend explains the color coding and references the studies by Avak et al. from 2018 and 2019.
From these results, three factors were identified as key to trace element preservation under melting: (1) low water solubility, (2) binding to insoluble particles and (3) low initial concentrations. The latter effect is especially important for ultra-trace elements, which tend to be uniformly distributed within the ice lattice and thus less prone to remobilization. Unlike ionic species, where charge density and solubility in ice largely determine elution, these properties appear less critical for trace elements, except in the case of alkali and alkaline earth metals, whose high charge density and water solubility make them especially mobile (Fig. 6).
Follow-up work by the same authors on melting seasonal snow (Avak and others, Reference Avak2019) revealed similar patterns but with systematically stronger elemental depletion compared to melt-affected glacier ice. For example, in the melt-affected ice-core section, 72% of Sr was lost compared to the unaffected sections, while in the melting snowpack, the loss was limited to 63%. The difference likely reflects the one-off nature of seasonal snowmelt, compared to repeated percolation events through a glacier crevasse (Avak and others, Reference Avak, Schwikowski and Eichler2018). In truly temperate ice, where interaction between solid and liquid phases is continuous, elemental fractionation could be even more pronounced, though a dedicated study is still lacking.
Other investigations confirm that elements associated with mineral dust and pollution sources, being related to insoluble particles, are better preserved in melt-affected ice compared to more mobile elements (Wong and others, Reference Wong, Hawley, Lutz and Osterberg2013; Clifford and others, Reference Clifford2023; Potocki and others, Reference Potocki2025).
4.4. Organics
The occurrence, distribution and fate of organic compounds in glacier ice remain one of the least explored areas of ice-core research, particularly in temperate glaciers. This is a major gap, since glaciers play a key role in the environmental cycling of organics through the cold-trapping mechanism (Wania and others, Reference Wania, Hoff, Jia and Mackay1998).
Pioneering studies, inspired by the discovery of the ionic pulse, showed that organochlorine pesticides (OCPs) and polycyclic aromatic hydrocarbons (PAHs) undergo fractionation during snowmelt, with polar, water-soluble compounds enriched in the first meltwater fractions and insoluble, particle-bound species concentrated later (Simmleit and others, Reference Simmleit, Herrmann and Thomas1986; Schöndorf and Herrmann, Reference Schöndorf and Herrmann1987). Further studies revealed that, contrary to ionic species, whose elution is simply controlled by compatibility with the ice lattice, for organics, more factors are involved. They include water solubility (often described by log K ow), molecular properties such as functional groups and weight, content of insoluble impurities in snow/ice and ice-grain properties. As summarized by Grannas and others (Reference Grannas2013), five elution profiles are recognized for organics (Fig. 7): (a) polar, water-soluble compounds eluted rapidly and enriched in early meltwater fractions; (b) insoluble, particle-bound species retained and concentrated in late fractions; and (c–e) intermediate behaviors reflecting differences in functional groups, pH, molecular weight and affinity for insoluble impurities and snow grains.
Different behaviors of organic species observed in laboratory experiments during snowpack melting. Redrawn from Grannas and others (Reference Grannas2013).

Figure 7 Long description
Two-column layout with five rows. Left column heading: Release profile. Right column heading: Contaminant characteristics. A vertical label along the left side reads: Concentration in meltwater a.u. A horizontal label at the bottom reads: time. Row a: Left: A curve starts high at the left edge and decreases steeply, then continues downward more gradually toward the right. Right: Soluble in water. Row b: Left: A line runs near the bottom from left to near the right edge, then rises sharply at the far right. Right: Strongly sorbed to particulate matter or snow grain surface. Row c: Left: A curve starts low at the left edge and rises upward toward the right, with increasing height near the right side. Right: Soluble in water but also affine for snow grain surface. Row d: Left: A curve starts high at the left edge and decreases toward the middle, then rises sharply at the far right. Right: Part ially dissolved in meltwater but also sorbed to particulate matter. Row e: Left: A single hump-shaped curve rises from low values, reaches a peak near the middle, then falls back toward low values by the right edge. Right: Sorption to snow grain surface decreases during melt.
In general, lighter molecules within the same compound class tend to be more mobile than heavier congeners (Grannas and others, Reference Grannas2013; Steinlin and others, Reference Steinlin2015). Modeling and observations show that less soluble molecules can behave like water-soluble compounds (Fig. 7a) in snow with low particle content (Meyer and Wania, Reference Meyer and Wania2011). When the particulate matter is low, the bulk of the hydrophobic species dissolves in the liquid phase. In impurity-rich snow, even moderately water-soluble compounds can sorb to particles and elute later than expected, resembling the behaviors displayed in Fig. 7b. Snow microstructure also influences elution (Meyer and Wania, Reference Meyer and Wania2011). In aged, coarse-grained snow/firn with reduced internal surface area, compounds with strong affinity for the snow grain surface elute early. In contrast, in fresh, fine-grained snow with a larger surface area, these compounds can show a more delayed release (Fig. 7c).
For temperate glaciers, where ice is in continuous equilibrium with liquid water rather than undergoing discrete melt events, only part of the elution patterns shown in Fig. 7 apply. Mobile, soluble species are progressively depleted from the ice phase, while insoluble, particle-bound species are more effectively retained. The ‘final-fraction’ enrichments typical of seasonal snowmelt (Fig. 7b–e) are less relevant for temperate ice.
The first study to target organics in temperate ice (Donald and others, Reference Donald1999) analyzed OCPs in ice samples from a crevasse in the Canadian Rockies, demonstrating that temperate ice can preserve deposition records, though the impact of meltwater-related postdepositional processes remained unclear (Gregor and Peters, Reference Gregor and Peters2000). Similar results were then obtained from Svalbard ice cores, heavily impacted by summer melt and percolation (Hermanson and others, Reference Hermanson2005; Ruggirello and others, Reference Ruggirello2010). A study on a Swiss temperate ice core revealed that ∼75% of the original polychlorinated biphenyls (PCB) burden had been lost, primarily via revolatilization of lighter congeners and runoff of heavier ones; yet heavy congeners were comparatively well preserved owing to their adsorption on insoluble impurities (Pavlova and others, Reference Pavlova2014; Steinlin and others, Reference Steinlin2015). Together with observations of contaminated meltwater from retreating glaciers, these findings show that temperate glaciers can act as both a sink and secondary source of persistent pollutants to downstream environments (Bogdal and others, Reference Bogdal, Schmid, Zennegg, Anselmetti, Scheringer and Hungerbühler2009; Pavlova and others, Reference Pavlova2016; Ferrario and others, Reference Ferrario, Finizio and Villa2017; Li and others, Reference Li, Yan, Wu, Sun, Huan and Wang2017).
Other classes of persistent organic pollutants show similarly variable behaviors. PAHs, with high log K ow values (>5), are strongly particle-bound and poorly mobile, while compounds such as gamma-hexachlorocyclohexane (γ-HCH) (log K ow ≈ 3.7) display mixed elution between early and late meltwater fractions (Simmleit and others, Reference Simmleit, Herrmann and Thomas1986). For per- and polyfluoroalkyl substances (PFAS), mobility depends on chain length: short-to-medium chain PFAS (≤9 C atoms) are more water-soluble and readily relocated by meltwater, while longer-chain PFAS are comparatively less mobile (Plassmann and others, Reference Plassmann, Meyer, Lei, Wania, McLachlan and Berger2011; Kirchgeorg and others, Reference Kirchgeorg2016; Hartz and others, Reference Hartz, Björnsdotter and Yeung2023; Zhou and others, Reference Zhou2024). However, differences in dust content can alter expected patterns, allowing relatively hydrophobic PFAS to behave like soluble compounds (Hartz and others, Reference Hartz, Björnsdotter and Yeung2023).
Among PFAS, trifluoroacetic acid (TFA) is receiving particular attention. Owing to its short-chain structure, high polarity and solubility, TFA is highly mobile in the environment with liquid water and has been identified as an emerging contaminant of concern. Its presence in glacier ice and meltwater is being increasingly investigated, with recent studies focusing on its release from melting glaciers and subsequent downstream transport (Wu and others, Reference Wu2024; Zhou and others, Reference Zhou2025). Studying TFA in temperate ice cores would surely contribute to a better understanding of its behavior and partitioning in glacial environments.
Far fewer studies have examined naturally occurring organic compounds in temperate ice. One investigation reported that 12 targeted secondary organic aerosols, being soluble and mobile, were rapidly lost during meltwater percolation (Müller-Tautges and others, Reference Müller-Tautges2016). Yet, these compounds represent a tiny fraction of the tens of thousands of organic molecules expected in atmospheric aerosols and glacier ice. Recent developments allow the detection of hundreds of organic aerosol tracers in snow and ice samples without any a priori knowledge of their molecular composition (Burgay and others, Reference Burgay2023). This nontargeted approach has been applied to an ice core strongly influenced by melting, yielding ∼250 identified molecules (Huber and others, Reference Huber2025). Of these, ∼170 were completely eluted from the ice layers most affected by meltwater percolation, predominantly small, polar and water-soluble species. In contrast, a suite of larger, less soluble molecules remained preserved. Despite strong meltwater alteration, temperate ice can retain some stratigraphic information for specific organic tracers.
Both natural and anthropogenic organics in ice are strongly affected by post-depositional processes including revolatilization, photochemical and microbial degradation, particle deposition, and meltwater-driven fractionation (Grannas and others, Reference Grannas2013). Even in cold ice, the concentration of organic species decreases, mostly because of ultraviolet-mediated reactions (Jaffrezo and others, Reference Jaffrezo, Clain and Masclet1994; Hermanson and others, Reference Hermanson, Isaksson, Hann, Teixeira and Muir2020).
4.5. Insoluble impurities
Glacier ice contains solid particles such as mineral dust, pollen, algae, black carbon and organic fragments. Unlike dissolved species, these particles do not directly interact with the ice molecular lattice and are largely unaffected by meltwater fractionation or grain-boundary processes, making them comparatively stable under temperate conditions.
This stability has enabled their use as environmental and climatic proxies in temperate ice cores (Uetake and others, Reference Uetake2006; Neff and others, Reference Neff, Steig, Clark, McConnell, Pettit and Menounos2012; Kaspari and others, Reference Kaspari2020; Mangili and others, Reference Mangili2025). Many insoluble impurities are deposited seasonally on glaciers, and their stratigraphy remains well preserved regardless of the ice thermal regime. Summer surface melt further enhances these signals by concentrating impurities in the residual layers, especially in regions with little or no summer accumulation, such as the Andes (Thompson and others, Reference Thompson, Hastenrath and Arnao1979; Reis and others, Reference dos Reis2022). According to this, seasonal variations in the concentrations of algae (Kohshima and others, Reference Kohshima2007), pollen (Nakazawa and others, Reference Nakazawa2004; Festi and others, Reference Festi2017; Takeuchi and others, Reference Takeuchi, Sera, Fujita, Aizen and Kubota2019), dust (Neff and others, Reference Neff, Steig, Clark, McConnell, Pettit and Menounos2012; Reis and others, Reference dos Reis2022), black carbon (Pavlova and others, Reference Pavlova2014; Festi and others, Reference Festi, Schwikowski, Maggi, Oeggl and Jenk2021) and organic fragments (Uetake and others, Reference Uetake2006) have been used to identify annual layers and refine temperate ice-core chronologies. Multi-proxy approaches have also been successfully applied to identify a seasonal signal in temperate ice cores (Mangili and others, Reference Mangili2025).
4.6. Water stable isotopes
Ratios of water stable isotopes δ-oxygen and δ-hydrogen isotopes (δ18O, δD) are key ice-core proxies linked to temperature and climate changes (Jouzel and others, Reference Jouzel1997). While their post-depositional alteration is minor in cold glaciers, temperate contexts strongly modify the original signal, hampering their paleoclimatic application. Despite this, the earliest investigations into the hydrogen and oxygen isotopic composition of glacier ice were actually conducted on temperate glaciers.
Early studies on temperate ice carried out in the late 1950s and 1960s (Epstein and Sharp, Reference Epstein and Sharp1959; Sharp and others, Reference Sharp, Epstein and Vidziunas1960; Deutsch and others, Reference Deutsch, Ambach and Eisner1966) showed enrichment in heavy isotopes in ice and firn relative to fresh snow. This was attributed to spring melt and summer rain, which introduced isotopically heavier water into the glacier. Smoothing of seasonal variability was also observed and interpreted as a consequence of repeated melt–refreeze cycles (Epstein and Sharp, Reference Epstein and Sharp1959; Deutsch and others, Reference Deutsch, Ambach and Eisner1966). Isotopic seasonality persisted only in the upper firn, disappearing a few meters below the surface (Sharp and others, Reference Sharp, Epstein and Vidziunas1960; Deutsch and others, Reference Deutsch, Ambach and Eisner1966). Figure 8b shows the marked difference between the records from cold and temperate glaciers in the same region. While the cold site presents a well-expressed seasonality, the two temperate sites display a much more smoothed record (Schotterer and others, Reference Schotterer, Stichler, Ginot and DeWayne Cecil2004).
Distribution and alteration of water stable isotopes in temperate ice. Panel a: changes in δD of meltwater and residual snow during a melting experiment (redrawn from Herrmann and others, Reference Herrmann, Lehrer and Stichler1981). Panel b: vertical distribution of δ18O in firn and ice from different Alpine glaciological contexts: Fiescherhorn (cold conditions), Jungfraujoch saddle and Plaine Morte (temperate conditions with varying degrees of meltwater percolation). For the Fiescherhorn record, black dots mark isotopic minima corresponding to winter snowfall (redrawn from Schotterer and others (Reference Schotterer, Stichler, Ginot and DeWayne Cecil2004). Panel c: typical δ18O distribution in shallow temperate firn (data from a core drilled at the Northern Patagonia Icefield), showing a seasonal signal near the surface and homogeneous composition below a few meters (data from Yamada, Reference Yamada1987).

Figure 8 Long description
The image A showing a line graph with two diagonal lines and scattered points. The x-axis is labeled Melted snow vs. total snow (percent), ranging from 0 to 100. The y-axis is labeled delta D relative to standard mean ocean water (per mil), ranging from minus 120 to minus 80. One diagonal line is labeled Initial snow minus 103. A second diagonal line is labeled Residual snow. A third slanted line at the left is labeled Meltwater. A set of points forms an upward trend from near (0, about minus 112) to near (100, about minus 88). The image B showing three side-by-side depth style profiles with a shared vertical axis. The vertical axis at left shows years labeled 1954 at the bottom, 1963 near the middle and 1974 at the top. The horizontal axis at the bottom is labeled delta 18 O relative to standard mean ocean water (per mil), with tick labels at minus 20, minus 10 and 0. The left profile is titled Fiescherhorn 3900 m. It shows a wavy line varying across the range, with many filled circular markers plotted along the profile. The middle profile is titled Jungfraujoch saddle 3500 m and shows a narrower, smoother line variation. The right profile is titled Plaine Morte 2800 m and shows an even more step-like, smoothed profile with small horizontal shifts. The image C showing a depth profile with points connected by a line. The x-axis is labeled delta 18 O relative to standard mean ocean water (per mil), ranging from minus 16 to minus 8 with tick labels at minus 16, minus 14, minus 12, minus 10 and minus 8. The y-axis is labeled Depth (m), ranging from 0 at the top to 12 at the bottom with tick labels at 0, 2, 4, 6, 8, 10 and 12. The plotted series starts near depth 0 around minus 12 to minus 10, shows repeated left and right swings between about minus 15 and about minus 10 from roughly 0 to 6 m, then becomes more clustered near about minus 12 from roughly 8 to 12 m.
A major step forward came with Árnason (Reference Árnason1969), who showed that percolation alone could not explain the enrichment in heavy isotopes observed in temperate ice. The author observed that temperate ice can present an isotopic composition heavier (less depleted using the δ notation) than the isotopically heavy summer precipitation. He concluded that in temperate firn and ice, isotopic fractionation must also take place in addition to smoothing and homogenization. Experiments confirmed that early meltwater released by melting snow/ice is depleted in heavy isotopes and late fractions enriched (Árnason, Reference Árnason1969; Herrmann and others, Reference Herrmann, Lehrer and Stichler1981; see Fig. 8a). Árnason (Reference Árnason1969) proposed a balance equation (Eqn (2)) to estimate annual melt losses from the difference in terms of isotopic composition between fresh snow precipitation and firn/ice.
 \begin{equation}{R_i}q\, + \,{R_w}\left( {1 - q} \right)\, = \,{R_p}\end{equation}
In Eqn (2), the mean concentration of a heavy isotope (18O or 2H) in total annual precipitation is represented by Rp; q is the fraction of annual precipitation remaining on the glacier as firn and ice; 1 − q is the fraction of precipitation lost through melting; and Ri and Rw are the concentrations of heavy isotopes in the remaining and lost fractions, respectively. The equation is highly simplified and has limited utility when applied to real-world data. This is primarily due to the assumption that the isotopic composition of melting firn and ice is homogeneous, a condition that may hold only in highly maritime environments, where the seasonal variability in snowfall isotopic composition is minimal. A more advanced approach was proposed by Búason (Reference Búason1972), who developed a set of equations to describe more comprehensively the isotopic evolution of temperate firn and ice affected by exchanges with liquid water.
Árnason (Reference Árnason, Gat and Gonfiantini1981) added a process to the discussion: persistent isotopic exchange within the saturated basal firn layer above the firn–ice transition (see Fig. 8c). In this zone, firn is permanently saturated with meltwater, promoting continuous exchanges between the solid and liquid phases. Unlike in the shallow firn, where melting and infiltration of rain are limited to summer, the basal firn layers experience persistent isotopic exchanges and homogenization (Fig. 8c).
Studies at Vernagtferner (Stichler and others, Reference Stichler, Baker, Oerter and Trimborn1982; Oerter and others, Reference Oerter, Baker, Stichler and Rauert1985) first considered deuterium excess (d = δ2H − 8δ18O), a second-order parameter influenced by nonequilibrium fractionation during phase changes. Oscillations in d were found to be more clearly expressed than those in the individual isotope ratios. This made the deuterium excess a useful parameter for identifying seasonal cycles and for providing dating constraints (Stichler and others, Reference Stichler, Baker, Oerter and Trimborn1982). A difference between oscillations of δ-variables and d in temperate ice concerns their origin. Smoothed and degraded variations in δ18O and δ2H reflect the isotopic seasonality of precipitation. Variations in d arise as a result of post-depositional processes (Stichler and others, Reference Stichler, Baker, Oerter and Trimborn1982). This is because during melting, the d value of the residual solid fraction decreases due to ongoing isotopic fractionation (Martinec and others, Reference Martinec, Moser, De Quervain, Ravert and Stichler1977), producing a seasonal post-depositional signal characterized by summer minima and winter maxima (Stichler and others, Reference Stichler, Baker, Oerter and Trimborn1982). Research on variations in d in temperate ice has remained stagnant. Only recently were the results obtained at Vernagtferner replicated and confirmed in other contexts (Zhou and others, Reference Zhou, Wang and Joswiak2014).
In addition to meltwater-driven processes, isotopic signals of water molecules are also affected by diffusion, which progressively smooths δ1⁸O and δ2H variations within firn and ice. Diffusion is temperature dependent and proceeds faster at higher temperatures, making it more effective in temperate than in cold ice (Souchez and Lorrain, Reference Souchez and Lorrain1991; Cuffey and Paterson, Reference Cuffey and Paterson2010). However, in temperate glaciers, the impact of diffusion is generally minor compared to the much stronger alterations induced by meltwater percolation and refreezing.
Subsequent work (e.g. Yamada, Reference Yamada1987; Koerner, Reference Koerner1997; Yuanqing and others, Reference Yuanqing, Tandong, Guodong and Meixue2001) largely confirmed previous findings. An aspect that emerged is that the degree of degradation of isotopic signals in temperate glaciers is not always the same. Limited melt can allow annual layers to remain identifiable below the firn–ice transition (Neff and others, Reference Neff, Steig, Clark, McConnell, Pettit and Menounos2012; Schwikowski and others, Reference Schwikowski, Schläppi, Santibañez, Rivera and Casassa2013), whereas strong melt obliterates signals within a few years. Another emerging trend is that glaciers once considered cold show isotopic alteration due to warming and melt, both in polar (Spolaor and others, Reference Spolaor2024) and alpine contexts (Clifford and others, Reference Clifford2023).
Recent advances have shifted toward hydrology. Water stable isotope analyses of river discharge are used to distinguish contributions from snow, rainfall and groundwater. However, isotopic fractionation during melt prevents a direct comparison between the signature of the melting snowpack/ice and that of the resulting meltwater. To account for this, experimental and theoretical approaches have been developed (Taylor and others, Reference Taylor, Feng, Kirchner, Osterhuber and Björn2001; Zhou and others, Reference Zhou, Wang and Joswiak2014; Ham and others, Reference Ham, Hur, Lee, Han, Jung and Lee2019; Noor and others, Reference Noor, Marttila, Klöve and Welker2023; Nyamgerel and others, Reference Nyamgerel, Han and Lee2024). A novelty of these works is the consideration of factors such as melting rate—where lower rates enhance isotopic fractionation (Taylor and others, Reference Taylor, Feng, Kirchner, Osterhuber and Björn2001; Noor and others, Reference Noor, Marttila, Klöve and Welker2023)—and firn saturation, with the maximum efficiency of fractionation observed in non-saturated firn (Ham and others, Reference Ham, Hur, Lee, Han, Jung and Lee2019). But while such studies have advanced our understanding of isotopic processes during melting, they have not yet been systematically applied to temperate ice cores for enhancing the interpretation of isotopic records.
4.7. Gas content
In cold glaciers, snow and firn contain air that is trapped in bubbles without significant gas fractionation, so their composition reflects the atmosphere at the time of entrapment, making them reliable archives. In temperate glaciers, however, ice forms mainly through the refreezing of meltwater-saturated firn, producing superimposed ice. Because prior to ice formation, firn pores are filled with water rather than air, in temperate ice, the air content is much lower than in cold ice. Ice cores from temperate glaciers typically show compact, bubble-free layers alternating with strata containing variable bubble concentrations (Coachman and others, Reference Coachman, Enns and Scholander1958; Vallon and others, Reference Vallon, Petit and Fabre1976; Fig. 2). The total air content of temperate glaciers is therefore linked to the frequency of melt events: the more frequent the events, the smaller the fraction of air entrapped within the ice. The relationship has been applied to reconstruct past summer temperatures in an ice core from the Himalaya, with encouraging results (Hou and others, Reference Hou2007). Scarce information about the vertical distribution of gases in temperate glaciers confirm that the deeper the ice, the lower the air content due to the increasing degree of metamorphism and interaction with meltwater (Hubbard and others, Reference Hubbard, Tison, Janssens and Spiro2000).
After the initial descriptive studies on gas content in temperate ice (Bader, Reference Bader1950), it became clear that, differently from cold glaciers, gas composition in temperate ice does not reflect atmospheric air. Because atmospheric gases differ in solubility, refreezing in the presence of liquid water fractionates them, altering bubble composition (Coachman and others, Reference Coachman, Enns and Scholander1958). Such deviations can be used to distinguish ice not impacted by melting from pristine ice (Hou and others, Reference Hou2025). Additionally, the presence of liquid water enables englacial chemical reactions that consume and/or produce specific gases (Coachman and others, Reference Coachman, Hemmingsen and Scholander1956). Gas composition in temperate ice shows depleted O2, N2 and Ar but elevated CO2 (Coachman and others, Reference Coachman, Hemmingsen and Scholander1956; Weiss and others, Reference Weiss, Bucher, Oeschger and Craig1972) and CH4 (Burns and others, Reference Burns2018). CO2 is particularly affected due to its high solubility in water and to the dissolution of carbonate mineral particles present in the ice (Stauffer and Berner, Reference Stauffer and Berner1978; Tranter and others, Reference Tranter, Sharp, Lamb, Brown, Hubbard and Willis2002). The decrease in gas content observed at temperate glaciers over depth is linked to the expulsion of gases at the bottom of the glacier, mostly via meltwater, with implications on subglacial weathering processes (Hubbard and others, Reference Hubbard, Tison, Janssens and Spiro2000).
Research on gases in temperate ice is not very active now, likely because they cannot be used for paleoclimatic purposes. Nonetheless, renewed interest in englacial biogeochemistry highlights the potential of gas analyses in temperate glaciers to shed light on englacial microbial activity and weathering processes (Hubbard and others, Reference Hubbard, Tison, Janssens and Spiro2000; Sharp and Tranter, Reference Sharp and Tranter2017).
5. What have temperate glaciers been telling us in 75 years of research?
This section reviews the main projects that, from the 1950s onward, focused on ice coring in temperate glaciers (see also Fig. 9 and Supplementary Material). While interest in the properties of temperate ice predates this period, earlier efforts were largely limited to surface studies using snow pits or shallow trenches and are not considered.
Geographic distribution of the temperate ice-core drilling projects discussed in this work. Sites in Svalbard, as well as in the Canadian and Russian Arctic, are also shown despite not being fully temperate, given their importance for understanding the impact of melt-related processes on ice-core records. Further details are provided in the Supplementary Material.

Figure 9 Long description
The composite image consists of several maps highlighting temperate ice-core drilling sites globally and regionally. A) A world map marks various drilling sites with red dots across continents, including North America, South America, Europe, Africa and Asia. B) A map of Africa shows sites in Uganda (UGA), Kenya (KEN) and Tanzania (TZA), with notable locations like Mount Kenya and Kilimanjaro. C) A map of Iceland highlights sites such as Hofsjökull, Langjökull and Vatnajökull. D) A map of South America shows sites in Argentina (ARG) and Chile (CHI), including Northern Patagonia Icefield and Southern Patagonia Icefield. E) A map of the Andes region marks sites in Colombia (COL), Venezuela (VEN), Ecuador (ECU), Peru (PER) and Bolivia (BOL), with locations like Coropuna and Quelccaya. F) A map of North America highlights sites in the USA and Canada (CAN), including Taku Glacier and South Cascade Glacier. G) A map of Europe shows sites in France (FRA), Germany (DEU), Austria (AUT) and Italy (ITA), with locations like Vernagtferner and Silvretta. Each map uses red dots to indicate specific drilling sites, providing a visual representation of the geographic distribution of these projects.
5.1. The pioneering epoch
The first three successful deep ice cores were drilled between 1950 and 1951 (Langway, Reference Langway2008), one of them at Taku Glacier in Alaska, the thickest temperate glacier on Earth (Nolan and others, Reference Nolan, Motyka, Echelmeyer and Trabant1995). In summer 1950, as part of the Juneau Icefield Research Project, a core was retrieved from the glacier’s accumulation basin. At the time, little was known about the preservation of paleoclimatic signals in glacier ice, and the main objective of these efforts was to test drilling methods. Even so, the Taku core provided valuable results. Technically, it offered the first lessons on drilling temperate ice, while scientifically, it yielded early data on the vertical evolution of ice texture and englacial temperature (Miller, Reference Miller1954). Despite these promising beginnings, research soon shifted toward cold glaciers, recognized as more suitable for paleoclimate reconstructions.
Interest in temperate sites resurfaced nearly 20 years later, when shallow cores from Icelandic glaciers were analyzed to explore the behavior of water stable isotopes in temperate glaciers (Árnason, Reference Árnason1969). A few years later, two landmark drilling campaigns advanced the study of temperate glaciers. In 1971, an 180 m core was extracted from the Vallée Blanche plateau (Alps, France), followed in 1972 by a 65 m core from Blue Glacier (Rocky Mountains, USA).
At Vallée Blanche, research focused on the transformation of snow to temperate ice. The stratigraphy described by Vallon and others (Reference Vallon, Petit and Fabre1976) offered the first comprehensive view of this transition, from cold winter snow to fully temperate firn and ice. A novel outcome was the identification of an internal water table: by measuring borehole water levels, the authors tracked its seasonal rise and fall in relation to surface melt and meteorological variability, providing a pioneering understanding of temperate glacier hydrology.
The Blue Glacier project provided key insights into the microscale structure of temperate ice, describing grain size evolution, impurity and bubble distributions, and the geometry of liquid veins (Raymond and Harrison, Reference Raymond and Harrison1975; Raymond, Reference Raymond1976; Harrison and Raymond, Reference Harrison and Raymond1976). These studies showed that recrystallization and continuous meltwater interactions modify physical and chemical properties with depth (see Fig. 4b), laying the groundwork for conceptual and theoretical models about the physics of temperate glaciers.
5.2. Tropics
From the late 1970s, the lack of low-latitude ice-core records spurred drilling efforts on tropical glaciers. Cold glaciers in these regions are confined to the highest peaks, where logistics are challenging, while most tropical glaciers are fully temperate, even in their accumulation zones. As a result, tropical temperate glaciers have received more and earlier attention than in other regions.
Since 1974, a series of campaigns has been launched atop Quelccaya Ice Cap in the Peruvian Andes. Several ice cores have been extracted since then to bedrock, drilling ∼160 m of ice. Initially, the glacier was polythermal, being temperate in the upper tens of meters and cold below, allowing the preservation of seasonal markers such as dust, radioactive tracers and stable isotopes. This enabled the reconstruction of ∼1800 years of Andean climate variability (Thompson and others, Reference Thompson, Hastenrath and Arnao1979, Reference Thompson, Mosley-Thompson, Brecher and Mountain2006) and trace element pollution (Uglietti and others, Reference Uglietti, Gabrielli, Cooke, Vallelonga and Thompson2015). Today, however, enhanced percolation and ice warming are threatening Quelccaya ice as a paleoclimatic archive (Thompson and others, Reference Thompson1993; Clifford and others, Reference Clifford2023).
In 1999–2000, two cores from Chimborazo (Ecuador) reached 54 m. The 1999 ice was likely cold but close to temperate, whereas by 2000 volcanic ash from the Tungurahua eruption starting in October 1999 had darkened the glacier surface, warming the firn and increasing meltwater percolation (Schotterer and others, Reference Schotterer and Diaz2003). Comparing the 1999 and 2000 ice-core records, it was possible to investigate the migration and redistribution of ionic species (mostly volcanic-derived mineral acids) within the ice column, providing an unrepeatable opportunity to observe live meltwater-related post-depositional processes (Ginot and others, Reference Ginot, Schotterer, Stichler, Godoi, Francous and Schwikowski2010). At Nevado Coropuna (Peru), cores up to 163 m were recovered in 2003. Heavy melting severely degraded most proxies, though impurity-rich layers still recorded the impact of positive El Niño-Southern Oscillation (ENSO) phases, and some signals from pollen and diatoms were preserved (Herreros and others, Reference Herreros2009; Weide and others, Reference Weide, Fritz, Brinson, Thompson and Billups2017). Shallow cores were also drilled at Pomerape (Bolivia), Pucahirca (Peru), Hualcan (Peru), Copap (Peru) and Caullaraju (Peru). For most of them, attention was given to water stable isotopes, revealing the severe impact of melting and signal homogenization, especially in the upper part of the cores (Vimeux and others, Reference Vimeux2009; Thompson and others, Reference Thompson2021).
The first attempt on African glaciers dates to 1977, when a shallow core (<10 m) was drilled on Kilimanjaro (Tanzania). Aside from noting successful drilling (Davies and others, Reference Davies, Brimblecombe and Vincent1977), no results were published. The glaciers were revisited in 2000, yielding Holocene-spanning records (∼12 000 years; Thompson and others, Reference Thompson2002). Radiocarbon ages for organic fragments allowed to establish the ice-core chronology. While early reports suggested temperate conditions (Davies and others, Reference Davies, Brimblecombe and Vincent1977), no meltwater was found during the 2000 drilling (Thompson and others, Reference Thompson2002). Later work confirmed temperate conditions (Kaser and others, Reference Kaser, Mölg, Cullen, Hardy and Winkler2010; Yoshikawa and others, Reference Yoshikawa, Hardy, Narita, Bolton, Stanilovskaya and Sparrow2021), with discrepancies likely reflecting cooling and thermal instability in small, thin ice bodies once firn cover is lost (Huss and Fischer, Reference Huss and Fischer2016). Attempts on Mount Kenya (Kenya) produced no usable records due to massive percolation and loss of annual accumulation (Thompson and Hastenrath, Reference Thompson and Hastenrath1981). Elsewhere, a 2010 core from Puncak Jaya (Indonesia) provided evidence that in recent years climatic signals present in tropical temperate ice cores are irreparably degrading (Permana and others, Reference Permana2019).
Overall, tropical glaciers contributed significantly to the early development of temperate ice-core science. Yet rising equilibrium-line altitudes and intensified meltwater percolation are rapidly erasing seasonal stratigraphy. Within only a few decades, several once-promising sites have become largely unsuitable for paleoclimate reconstruction (Thompson and others, Reference Thompson2021).
5.3. Mid-latitudes
Unlike the tropics, many mid-latitude mountain ranges still harbor cold accumulation zones, allowing extraction of cold ice cores. Temperate ice coring has therefore focused mainly on regions lacking cold glaciers (e.g. Patagonia, nonpolar North America), though other areas such as the Alps and maritime subpolar regions have also been targeted for reasons of accessibility or local scarcity of cold ice.
5.3.1. Patagonia
The Northern and Southern Patagonian Icefields form the largest mid-latitude ice masses. Both are fully temperate (Lliboutry, Reference Lliboutry1956; Warren and Sugden, Reference Warren and Sugden1993). Early drilling on San Rafael Glacier in 1985 (Northern Icefield, 1300 m a.s.l.) confirmed the temperate regime, with most seasonal signals erased and only shallow residual features usable for chronology (Yamada, Reference Yamada1987). Density discontinuities, possibly marking former summer surfaces, were the only stratigraphic features usable to derive a tentative chronology. Later work showed that although firn at ∼1500 m a.s.l. was temperate, the highest plateaus above 2000 m still preserve paleoclimatic signals (Matsuoka and Naruse, Reference Matsuoka and Naruse1999; Vimeux and others, Reference Vimeux2008). In the Southern Icefield, shallow cores collected in 1986 and 1999 revealed partial preservation of water stable isotope records and seasonal distribution of snow algae, enabling the identification of annual layers and revealing extremely high accumulation rates (∼15 m yr−1; Aristarain and Delmas, Reference Aristarain and Delmas1993; Shiraiwa and others, Reference Shiraiwa2002; Kohshima and others, Reference Kohshima2007). Additional cores from Pio XI Glacier showed that isotopic stratigraphy could survive under near-temperate conditions, provided no water table developed (Schwikowski and others, Reference Schwikowski, Schläppi, Santibañez, Rivera and Casassa2013). Overall, results indicate that the highest sectors of both fields may still preserve (or might have preserved) readable paleoclimatic information, though no deep drilling has yet been carried out.
5.3.2. Nonpolar North America
In nonpolar North America, Upper Fremont Glacier (Wyoming, USA) yielded a 160 m temperate ice core in 1991 that provided a chronology from ∼1770 to 1991 CE, capturing the water stable isotope signal of the Little Ice Age and recent warming trends (Naftz and others, Reference Naftz1996, Reference Naftz2002). A second core drilled in 1998 preserved mercury records, enabling the reconstruction of detailed atmospheric deposition histories for this anthropogenic-related species (Schuster and others, Reference Schuster2002). Later work refined the age model using local tree-ring chronologies (Chellman and others, Reference Chellman, McConnell, Arienzo, Pederson, Aarons and Csank2017). A 141 m core extracted from Combatant Col in the Canadian Rockies in 2011 revealed high accumulation (>4 m w.e. yr−1), with limited meltwater percolation to the depth of the annual firn layer and preserved seasonal signals of metals, dust and black carbon back to the early 1970s (Neff and others, Reference Neff, Steig, Clark, McConnell, Pettit and Menounos2012). In 1994, a 158 m core was extracted from the temperate South Cascade Glacier (Washington, USA) to focus on the role of light-absorbing particles in melt processes and mass balance (Kaspari and others, Reference Kaspari2020). The core was dated using multiple proxies, including 210Pb and 3H peaks, annual layer counting, volcanic tephra and mass-balance records. The resulting chronology spans from 1840 to 1991 CE (Kaspari and others, Reference Kaspari2020).
5.3.3. Alps
The Alps have hosted several important temperate ice-core projects. After Vallon and others (Reference Vallon, Petit and Fabre1976) drilled on Mont Blanc, attention focused on Vernagtferner in Austria, where cores extracted between 1976 and 1984 (up to 81 m) advanced the understanding of water stable isotopes and radionuclide behavior in temperate ice (Drost and Hofreiter, Reference Drost and Hofreiter1982; Oerter and Rauert, Reference Oerter and Rauert1982; Stichler and others, Reference Stichler, Baker, Oerter and Trimborn1982; Von Gunten and others, Reference Von Gunten, Rössler and Gäggeler1982; Baker and others, Reference Baker, Moser, Oerter, Stichler and Reinwarth1985; Oerter and others, Reference Oerter, Baker, Stichler and Rauert1985). At Silvretta Glacier (Switzerland), a 101 m temperate core retrieved in 2011 provided first direct evidence of secondary release of organic pollutants by temperate glaciers (Pavlova and others, Reference Pavlova2014, Reference Pavlova2016). The ice core was dated through nuclear dating (210Pb and 3H), annual layer counting (black carbon) and glaciological data (annual mass balance). At Alto dell’Ortles glacier (Italy), coring in 2011 to 75 m revealed polythermal conditions: cold deeper layers (below 30 m) yielded a 7000 year record (dated by radiocarbon), while the upper temperate portion was dated by means of Fukushima radioactive fallout, pollen and glaciological modeling (Festi and others, Reference Festi2015; Gabrielli and others, Reference Gabrielli2016; Carturan and others, Reference Carturan2025).
More recently, Corbassière Glacier (Switzerland) and Adamello Glacier (Italy) showed how fast signal degradation can occur at high altitudes. At Corbassière, shallow cores collected in 2018 and 2020 revealed a surprising transition to temperate conditions above 4000 m in a few years (Huber and others, Reference Huber2024, Reference Huber2025). At the Adamello glacier, several cores were obtained in the former accumulation basin of the glacier, where the mass balance has been negative since the 2010s. The deepest core reached 224 m. Results confirmed the deterioration of paleoclimatic signals due to the complete removal of firn and pervasive meltwater percolation, though proxies such as pollen, black carbon, 3H and environmental DNA survived at least partially and allowed a chronology to be developed for the upper ∼50 m of the core (Festi and others, Reference Festi, Schwikowski, Maggi, Oeggl and Jenk2021; Varotto and others, Reference Varotto2021; Maggi and others, Reference Maggi2023; Di Stefano and others, Reference Di Stefano2024). The Adamello glacier is an interesting site for testing the preservation of paleoclimatic records in conditions particularly adverse to the preservation of stratigraphic signals, where the most recent record has already been lost. The Alps also remain unique in utilizing temperate ice cores for structural and rheological studies. Drilling at Tsanfleuron Glacier in the 1990s and Rhône Glacier more recently has provided insights into ice fabrics, debris content and flow properties under temperate conditions (Hubbard and others, Reference Hubbard, Tison, Janssens and Spiro2000; Tison and Hubbard, Reference Tison and Hubbard2000; Hubbard and others, Reference Hubbard2003; Hellmann and others, Reference Hellmann2021).
5.3.4. Central Asia
In Central Asia, efforts began later, largely because cold glaciers dominate the region. The Djantugan Ice Plateau in the Caucasus was cored in the 1980s, with the deepest ice core (93 m) allowing mass-balance reconstructions since the 1930s despite the temperate regime (Popovnin, Reference Popovnin1999). In China’s Yulong glaciers (the southernmost glacierized region of Eurasia), shallow cores showed smoothing of the water stable isotope signal owing to the occurrence of a water table, preventing further drilling (Yuanqing and others, Reference Yuanqing, Tandong, Guodong and Meixue2001). Despite not being fully temperate, some drilling activities were carried out on Sofiyskiy glacier (Russian Altai), heavily impacted by summer melting. Pollen and algae provided seasonal signals despite melt, highlighting the potential of coarse biological markers to date melt-affected ice (Nakazawa and others, Reference Nakazawa2004; Uetake and others, Reference Uetake2006). Finally, Grigoriev Ice Cap in the Tien Shan, long considered cold, now shows increasing melt effects, with water stable isotopes and ion-related signals degraded but dust and biological proxies still informative (Machguth and others, Reference Machguth2024).
5.4. Subpolar and polar regions
5.4.1. Scandinavia
To investigate the early‐melt ‘ionic pulse’, a 61 m temperate ice core was drilled in 1980 at Folgefonna Ice Cap (southern Norway). The core clarified how ions partition between solid and liquid phases in temperate ice, underpinning elution sequences (Davies and others, Reference Davies, Vincent and Brimblecombe1982). In 1996, an exploratory core (34 m) from the small polythermal Riukojietna Ice Cap (Sweden; bedrock ∼105 m) assessed the potential of subpolar glaciers for paleoclimatic constructions. Stratigraphy showed sharp discontinuities between facies, attributed to intervals of negative mass balance: bubble-poor firn/superimposed ice overlying bubble-richer ice likely formed under colder, drier conditions (Pohjola and others, Reference Pohjola, Cole-dai, Rosqvist, Stroeven and Thompson2005). Records of major ions and water stable isotopes helped to develop an interpretation according to which ice formed during the 20th century overlies ice dated to the Little Ice Age with a stratigraphic gap, but chronological control was limited.
5.4.2. Iceland
Despite hosting Europe’s largest ice masses, Iceland has seen relatively few ice-core studies due to the absence of cold glaciers and proximity to Svalbard/Greenland. After early work by Árnason (Reference Árnason1969), a 415 m core on western Vatnajökull primarily served drill development (Árnason and others, Reference Árnason, Björnsson and Theodórsson1974). On Hofsjökull, at least two cores were recovered (longest 101 m), where dust-rich (summer melt) layers enabled dating of the shallow section and offered preliminary insight into signal preservation (Thorsteinsson and others, Reference Thorsteinsson, Sigurdsson, Johanneson, Larsen, Druecker and Wilhelms2002 and references therein).
5.4.3. Svalbard
The thermal structure of Svalbard glaciers is complex and predominantly polythermal. Most glaciers exhibit a shallow surface layer of cold firn/ice that thins (or disappears) toward the accumulation zones and thickens toward the terminus, while the largest glaciers are thought to present a basal layer of temperate ice (Sevestre and others, Reference Sevestre, Benn, Hulton and Bælum2015). Seasonal surface melt promotes percolation and refreezing, substantially modifying the ice stratigraphy (Pohjola and others, Reference Pohjola2002). From the 1960s to the late 1990s, Soviet and Japanese teams drilled multiple sites (e.g. Lomonosovfonna, Austfonna, Vestfonna, Høghetta Ice Dome, Grønfjord), retrieving cores up to 565 m deep (Koerner, Reference Koerner1997; Zagorodnov, Reference Zagorodnov1998 and references therein). Visual stratigraphy showed substantial superimposed ice (≈34% at Lomonosovfonna to near-100% at lower-elevation Austfonna/Vestfonna; Fujii and others, Reference Fujii1990; Zagorodnov, Reference Zagorodnov1998), consistent with temperate/polythermal regimes, though direct temperature profiles are lacking. Early cores yielded multimillennial records (Fujii and others, Reference Fujii1990; Koerner, Reference Koerner1997; Zagorodnov, Reference Zagorodnov1998), but their reliability was questioned due to strong melt and unrecognized negative mass-balance periods (Vaykmyae and others, Reference Vaykmyae, Martma, Punning and Tyugu1985; Koerner, Reference Koerner1997; Iizuka and others, Reference Iizuka, Igarashi, Kamiyama, Motoyama and Watanabe2002). Despite heavy melting, low-elevation sites have shown that regional climatic and environmental records for the last few centuries can still be recovered (Isaksson and others, Reference Isaksson2005; Hicks and Isaksson, Reference Hicks and Isaksson2006; Beaudon and others, Reference Beaudon2013). Nevertheless, work at the highest, coldest sites demonstrated better preservation of many glaciochemical signals, shifting attention toward cold-regime targets (Pohjola and others, Reference Pohjola2002; Pinglot and others, Reference Pinglot2003; Moore and others, Reference Moore, Grinsted, Kekonen and Pohjola2005; Wel and others, Reference Wel2011; Wendl and others, Reference Wendl, Eichler, Isaksson, Martma and Schwikowski2015; Osmont and others, Reference Osmont2018). Svalbard ice cores have also been key to evaluate the preservation of organic pollutants under near-temperate conditions (Hermanson and others, Reference Hermanson2005; Ruggirello and others, Reference Ruggirello2010). Ongoing atmospheric warming and percolation is now bringing many drilling sites close to temperate conditions, at least in the top part of the ice column (van de Wal and others, Reference van de Wal2002; Beaudon and others, Reference Beaudon2016; Marcheno and others, Reference Marcheno2017). A recent study documented that the rapid degradation of water isotopic records at one such site: clear seasonal cycles observed in 2012 became undetectable by 2019 due to intensified summer melt (Spolaor and others, Reference Spolaor2024), consistent with expanding firn water tables across major Svalbard glaciers (van den Akker and others, Reference van den Akker, van Pelt, Pettersson and Pohjola2025). Although most Svalbard glaciers cannot be formally classified as temperate, the pervasive impact of melting and meltwater percolation has made ice cores from this region a valuable test bench for investigating the behavior of ice-core proxies under nonideal glaciological conditions, serving as a key reference for interpreting records from melt-affected glaciers.
5.4.4. Russian Arctic
Glaciers in Franz Josef Land and Severnaya Zemlya share Svalbard-like thermal structures. Drilling campaigns recovered several long (>100 m) cores and multimillennial records from these regions (Kotlyakov and others, Reference Kotlyakov, Arkhipov, Henderson and Nagornov2004; Opel and others, Reference Opel, Fritzsche and Meyer2013 and references therein). Although in these ice cores, summer melt has been identified to deteriorate paleoclimatic signals; analyses of water stable isotopes, major ions, heavy metals and radionuclides suggest that the impact is moderate, allowing the partial preservation of records (Koerner, Reference Koerner1997; Pinglot and others, Reference Pinglot2003; Fritzsche and others, Reference Fritzsche2005; McConnell and others, Reference McConnell2019). In Severnaya Zemlya, redistribution of mobile ions was leveraged as a dating tool: seasonal melt–refreeze cycles produced ion oscillations that, combined with density and visual stratigraphy, resolved annual layers (Weiler and others, Reference Weiler2005). Unlike Svalbard, recent assessments of how ongoing warming is transforming Russian Arctic firn/ice archives remain scarce.
5.4.5. Canada
On Baffin Island, Penny Ice Cap is a key site for melt-affected archives. Although still glaciologically cold, its firn is warming toward the melting point, and summer surface melt has been pervasive throughout the Holocene. Consequently, numerous cores from Penny Ice Cap have served as benchmarks for reconstructing multimillennial records from melt-impacted ice (Zdanowicz and others, Reference Zdanowicz2012 and references therein). Similar trends toward temperate conditions are emerging across Canadian Arctic ice caps, at least in shallow layers (Fisher and others, Reference Fisher2012), threatening archives that in many cases extend to the last glacial period.
5.4.6. Southern ocean
South Georgia is largely glacierized by temperate ice. In 2015, the first ice-core drilling attempt was conducted on a glaciated plateau of the main island, at ∼850 m a.s.l. A 15 m long firn core was retrieved to assess the preservation of glaciochemical signals (Potocki and others, Reference Potocki2025). Stable water isotopes showed a few seasonal oscillations in the upper ∼6 m but became homogeneous below. Trace elements likewise declined to near-constant values at the same depth. The site was thus deemed unsuitable for deeper drilling. Higher, colder plateaus might preserve signals better but remain unexplored.
6. Temperate ice-core drilling techniques
Drilling temperate glaciers and recovering ice cores differs substantially from drilling cold glaciers. Over the past 75 years, it has become increasingly clear that the extraction of temperate ice cores requires dedicated tools and specialized drilling systems (Watanabe, Reference Watanabe1994). This section briefly summarizes the technical evolution of drilling approaches used on temperate glaciers and their implications.
One of the earliest ice cores ever drilled was extracted from a temperate glacier in 1950 (Miller, Reference Miller1954). That first attempt immediately revealed the main challenge of coring temperate ice: the presence of liquid water. The drilling relied on a rotary mechanical system adapted from geological prospecting, equipped with diamond blades that produced 5.4 cm diameter cores. The small barrel size made it difficult to recover intact firn sections, as the fragile material was often crushed, preventing the retrieval of stratigraphically continuous samples.
A key issue was the interaction of drill cuttings with liquid water. In cold ice, residues remain unconsolidated and can be removed between runs, but in temperate conditions, they form a sticky slurry that can clamp the drill. At Taku Glacier, researchers attempted to flush cuttings by supplying water to the drill head. Although partially effective, this required casing the firn section and pumping large volumes of water from crevasses to maintain a stable borehole water level. Most drilling still had to proceed under dry conditions, resulting in slow progress and fractured cores. Despite these limitations, several cores were retrieved, the deepest reaching 90 m (Miller, Reference Miller1954).
To overcome these issues, thermal drills were developed. Instead of cutting, they melt a ring of ice around the core using a heated metallic ring powered by electric resistance. These systems have since yielded high-quality, unfractured cores from temperate glaciers (Taylor, Reference Taylor and Splettstoesser1976; Schwikowski and others, Reference Schwikowski, Jenk, Stampfli and Stampfli2014; Zagorodnov and Thompson, Reference Zagorodnov and Thompson2014 and references therein). Their main drawback is the high power demand of the melting heads, which almost always requires combustion-based generators. Unlike electromechanical drills, which can be relatively easily powered by portable solar arrays, thermal drills cannot realistically rely on solar energy. This has major logistical implications, since transporting solar panels is considerably easier than moving large amounts of fuel and heavy generators. Only a few experimental tests with solar-powered thermal drills have been attempted (Naftz and others, Reference Naftz1996).
Although thermal drills are now recognized as the most suitable technology for temperate glaciers, there remain contexts where electromechanical systems perform better. This is the case for glaciers with high concentrations of solid impurities, such as mineral dust or volcanic ash. In such layers, particles act as thermal insulators, hindering heat transfer and blocking thermal drill operations, a problem documented in Iceland (Árnason and others, Reference Árnason, Björnsson and Theodórsson1974) and on Kilimanjaro (Zagorodnov and others, Reference Zagorodnov, Thompson, Mosley-thompson and Kelley2002). Another situation in which electromechanical drills remain advantageous on temperate glaciers is during spring or early summer. At this time of the year, a layer of cold, low-density snow and firn overlies temperate ice. Thermal systems can struggle to penetrate this material because their weight is insufficient to ensure a steady downward progress of the instrument. A practical solution is the use of modular drilling tools, which allow to begin with an electromechanical head and then switch to a thermal drill once temperate ice is reached (Zagorodnov and others, Reference Zagorodnov, Thompson, Mosley-thompson and Kelley2002; Schwikowski and others, Reference Schwikowski, Jenk, Stampfli and Stampfli2014).
7. Conclusions and perspectives
At the dawn of ice-core science, temperate and cold glaciers received similar attention, with several projects launched in the 1950s. It soon became clear, however, that cold glaciers offered far more reliable paleoclimatic archives. Two melt-related processes make temperate glaciers especially challenging: (1) part of the annual snow accumulation is lost to melt, introducing stratigraphic discontinuities; and (2) the production, persistence and percolation of meltwater deteriorate most proxies. Virtually all proxies in temperate ice are subject to smoothing, fractionation and remobilization, with insoluble impurities being the least affected.
Once the impairment of glaciochemical records in temperate ice was recognized, interest in ice cores from temperate glaciers declined. The few studies conducted on temperate ice cores between the 1960s and 1980s focused primarily on improving our understanding of the chemical and physical processes typical of temperate glaciers rather than on palaeoclimatic reconstruction. In recent decades, however, climate change has renewed interest in them. Many cold glaciers are increasingly affected by melting events, and their temperature is approaching the transition threshold to a temperate regime, threatening the integrity of the records they have preserved until now. To keep exploiting glaciers as paleoclimatic archives, we need to improve our ability to read deteriorated proxies in ice cores drilled at temperate glaciers.
This review is intended to offer a synthesis of processes affecting temperate ice cores. This will hopefully serve as a starting point for future research. While qualitative knowledge of meltwater impacts is already substantial, quantitative approaches to reconstruct residual paleoclimatic signals from temperate glaciers and disentangle them from postdepositional effects remain limited. Melting and meltwater percolation cause loss of information. To enable the best possible utilization of the residual signals of temperate ice, it is necessary to complete the missing information by drawing from other sources. Available examples have used meteorological data, data from other paleoclimate archives (such as tree rings) and glaciological mass-balance data. The combination of information from multiple sources allow to calibrate the impact of post-depositional processes on proxies and to consider periods with negative mass balance, otherwise hardly detectable.
Future efforts should thus focus on refining quantitative methods for integrating the impact of melt-related post-depositional processes into the analysis and interpretation of signals from temperate ice cores. As glaciers progressively warm, temperate ice will become in many regions the primary, if imperfect, repositories of glaciological climate information, making their understanding essential for the future of ice-core science.
Supplementary material
The supplementary material for this article can be found at https://doi.org/10.1017/jog.2026.10182.
Acknowledgements
The authors thank the Editor and the anonymous reviewers for their constructive comments and suggestions, which helped improve the quality of this review. Figures presented in the panels a–e of Fig. 1 are reprinted with permission of the International Glaciological Society.
Author contributions
G.B. conceived the idea of this work and wrote the manuscript with contributions from all the authors.
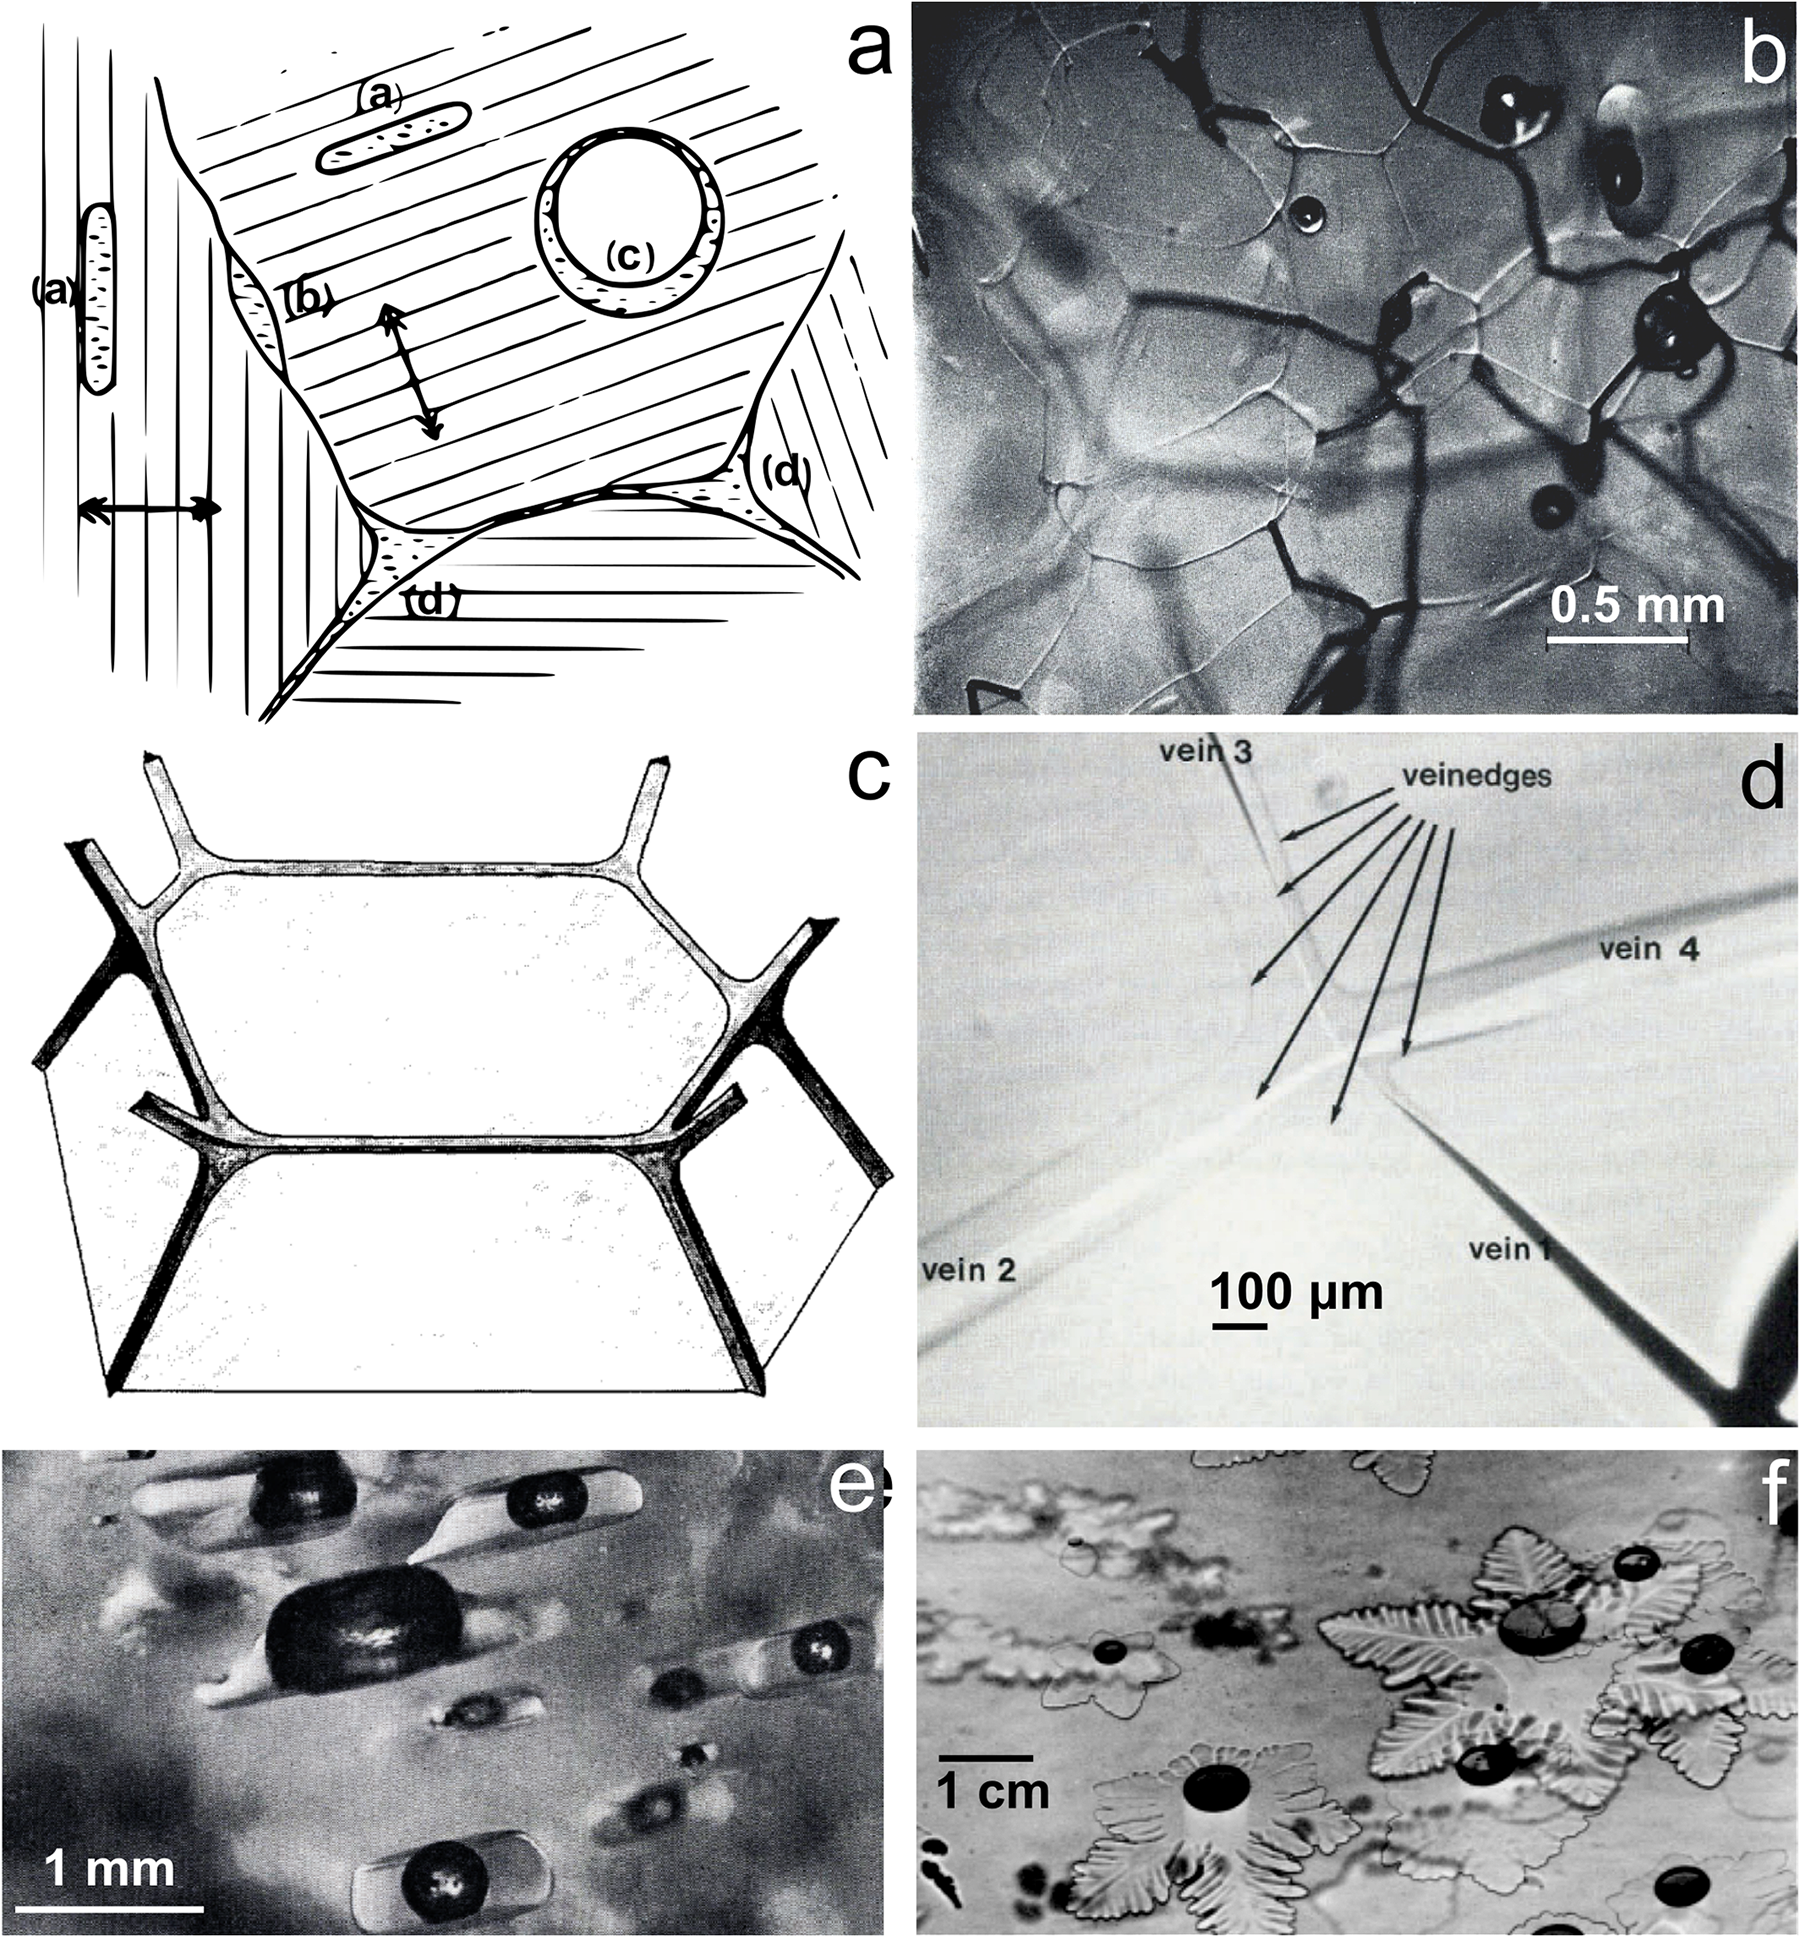
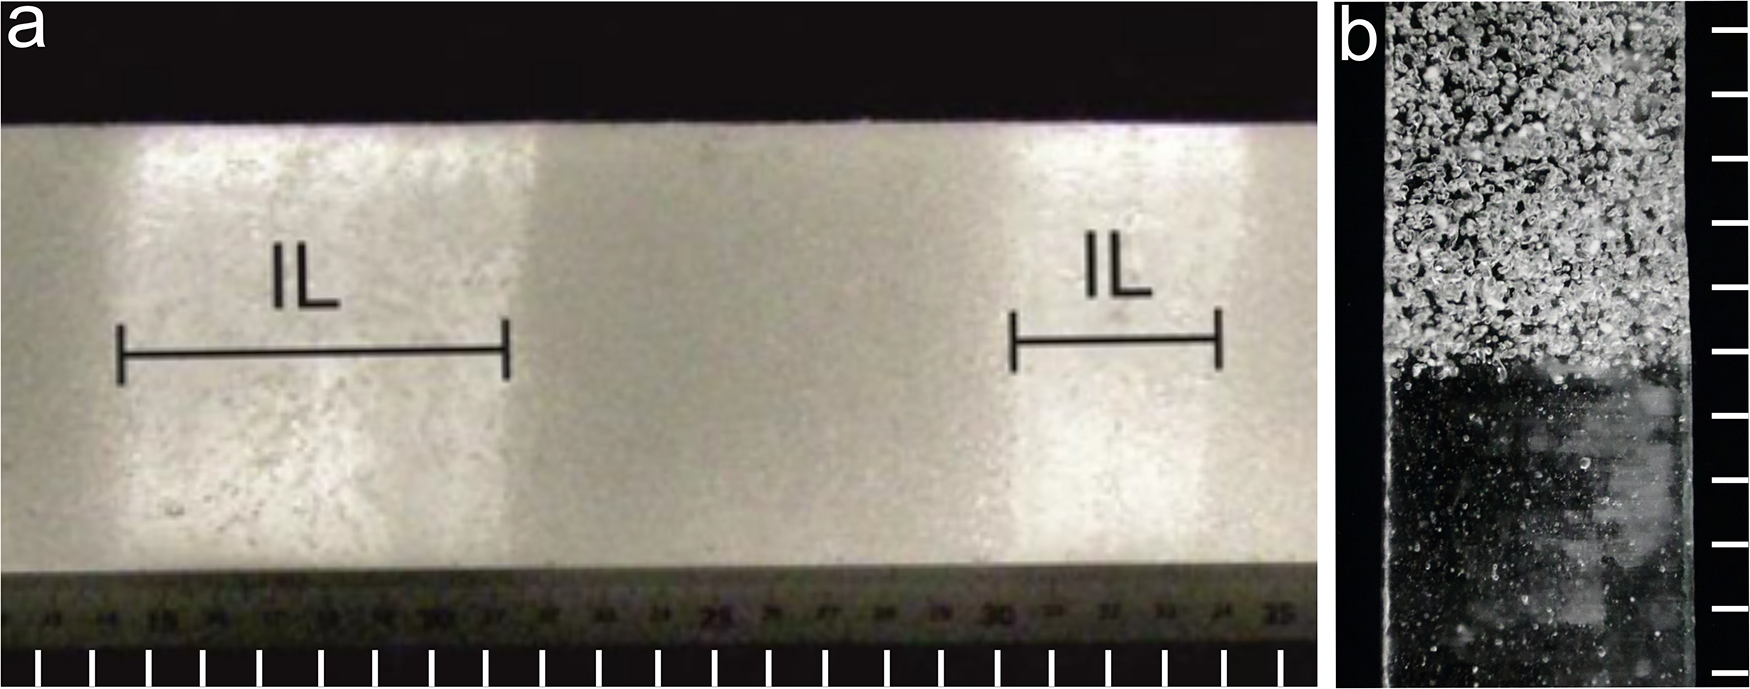
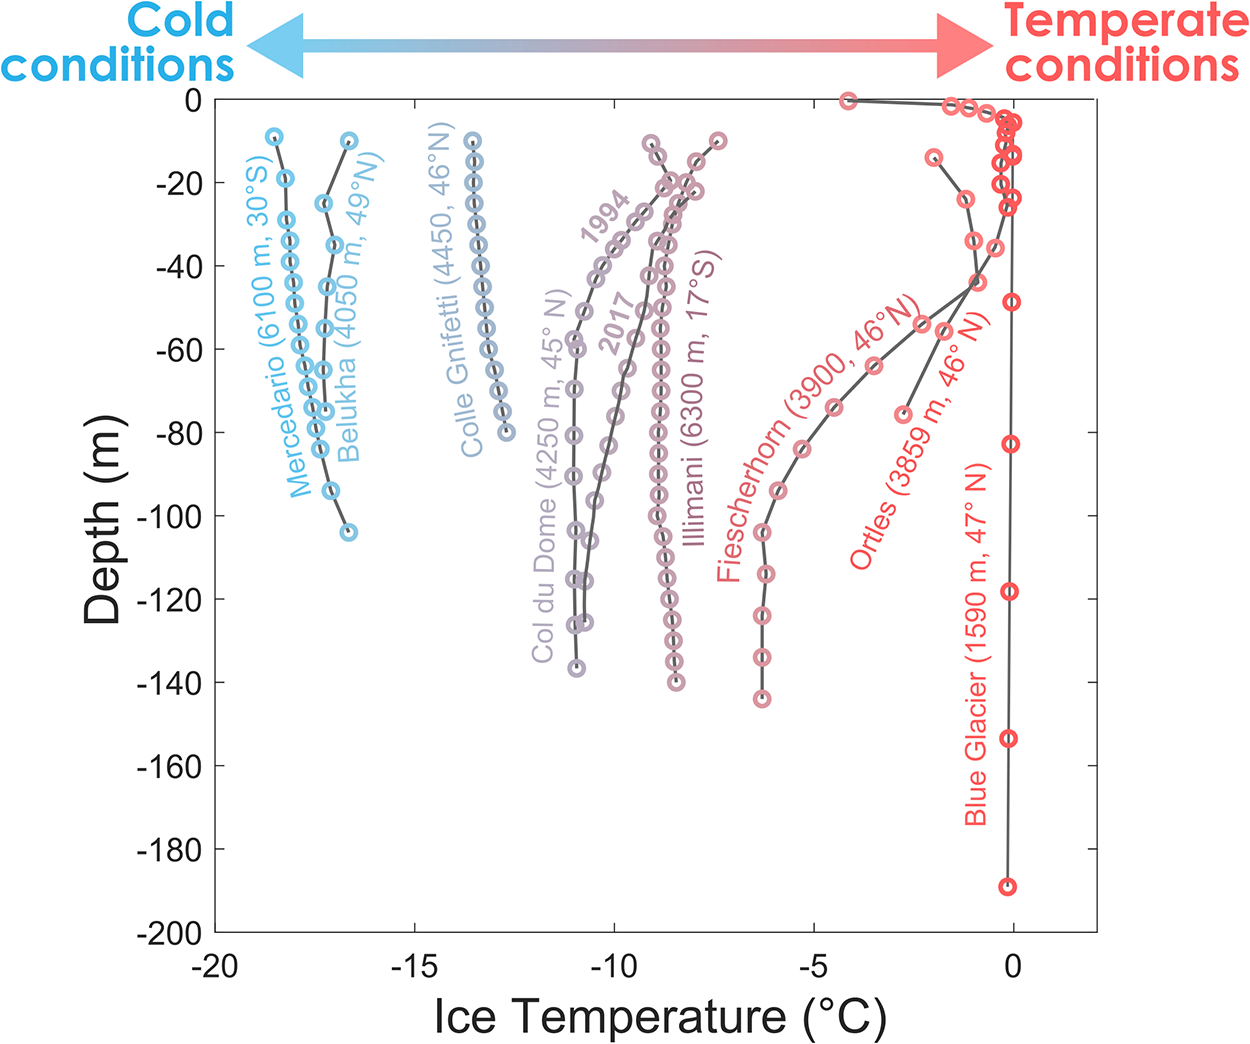
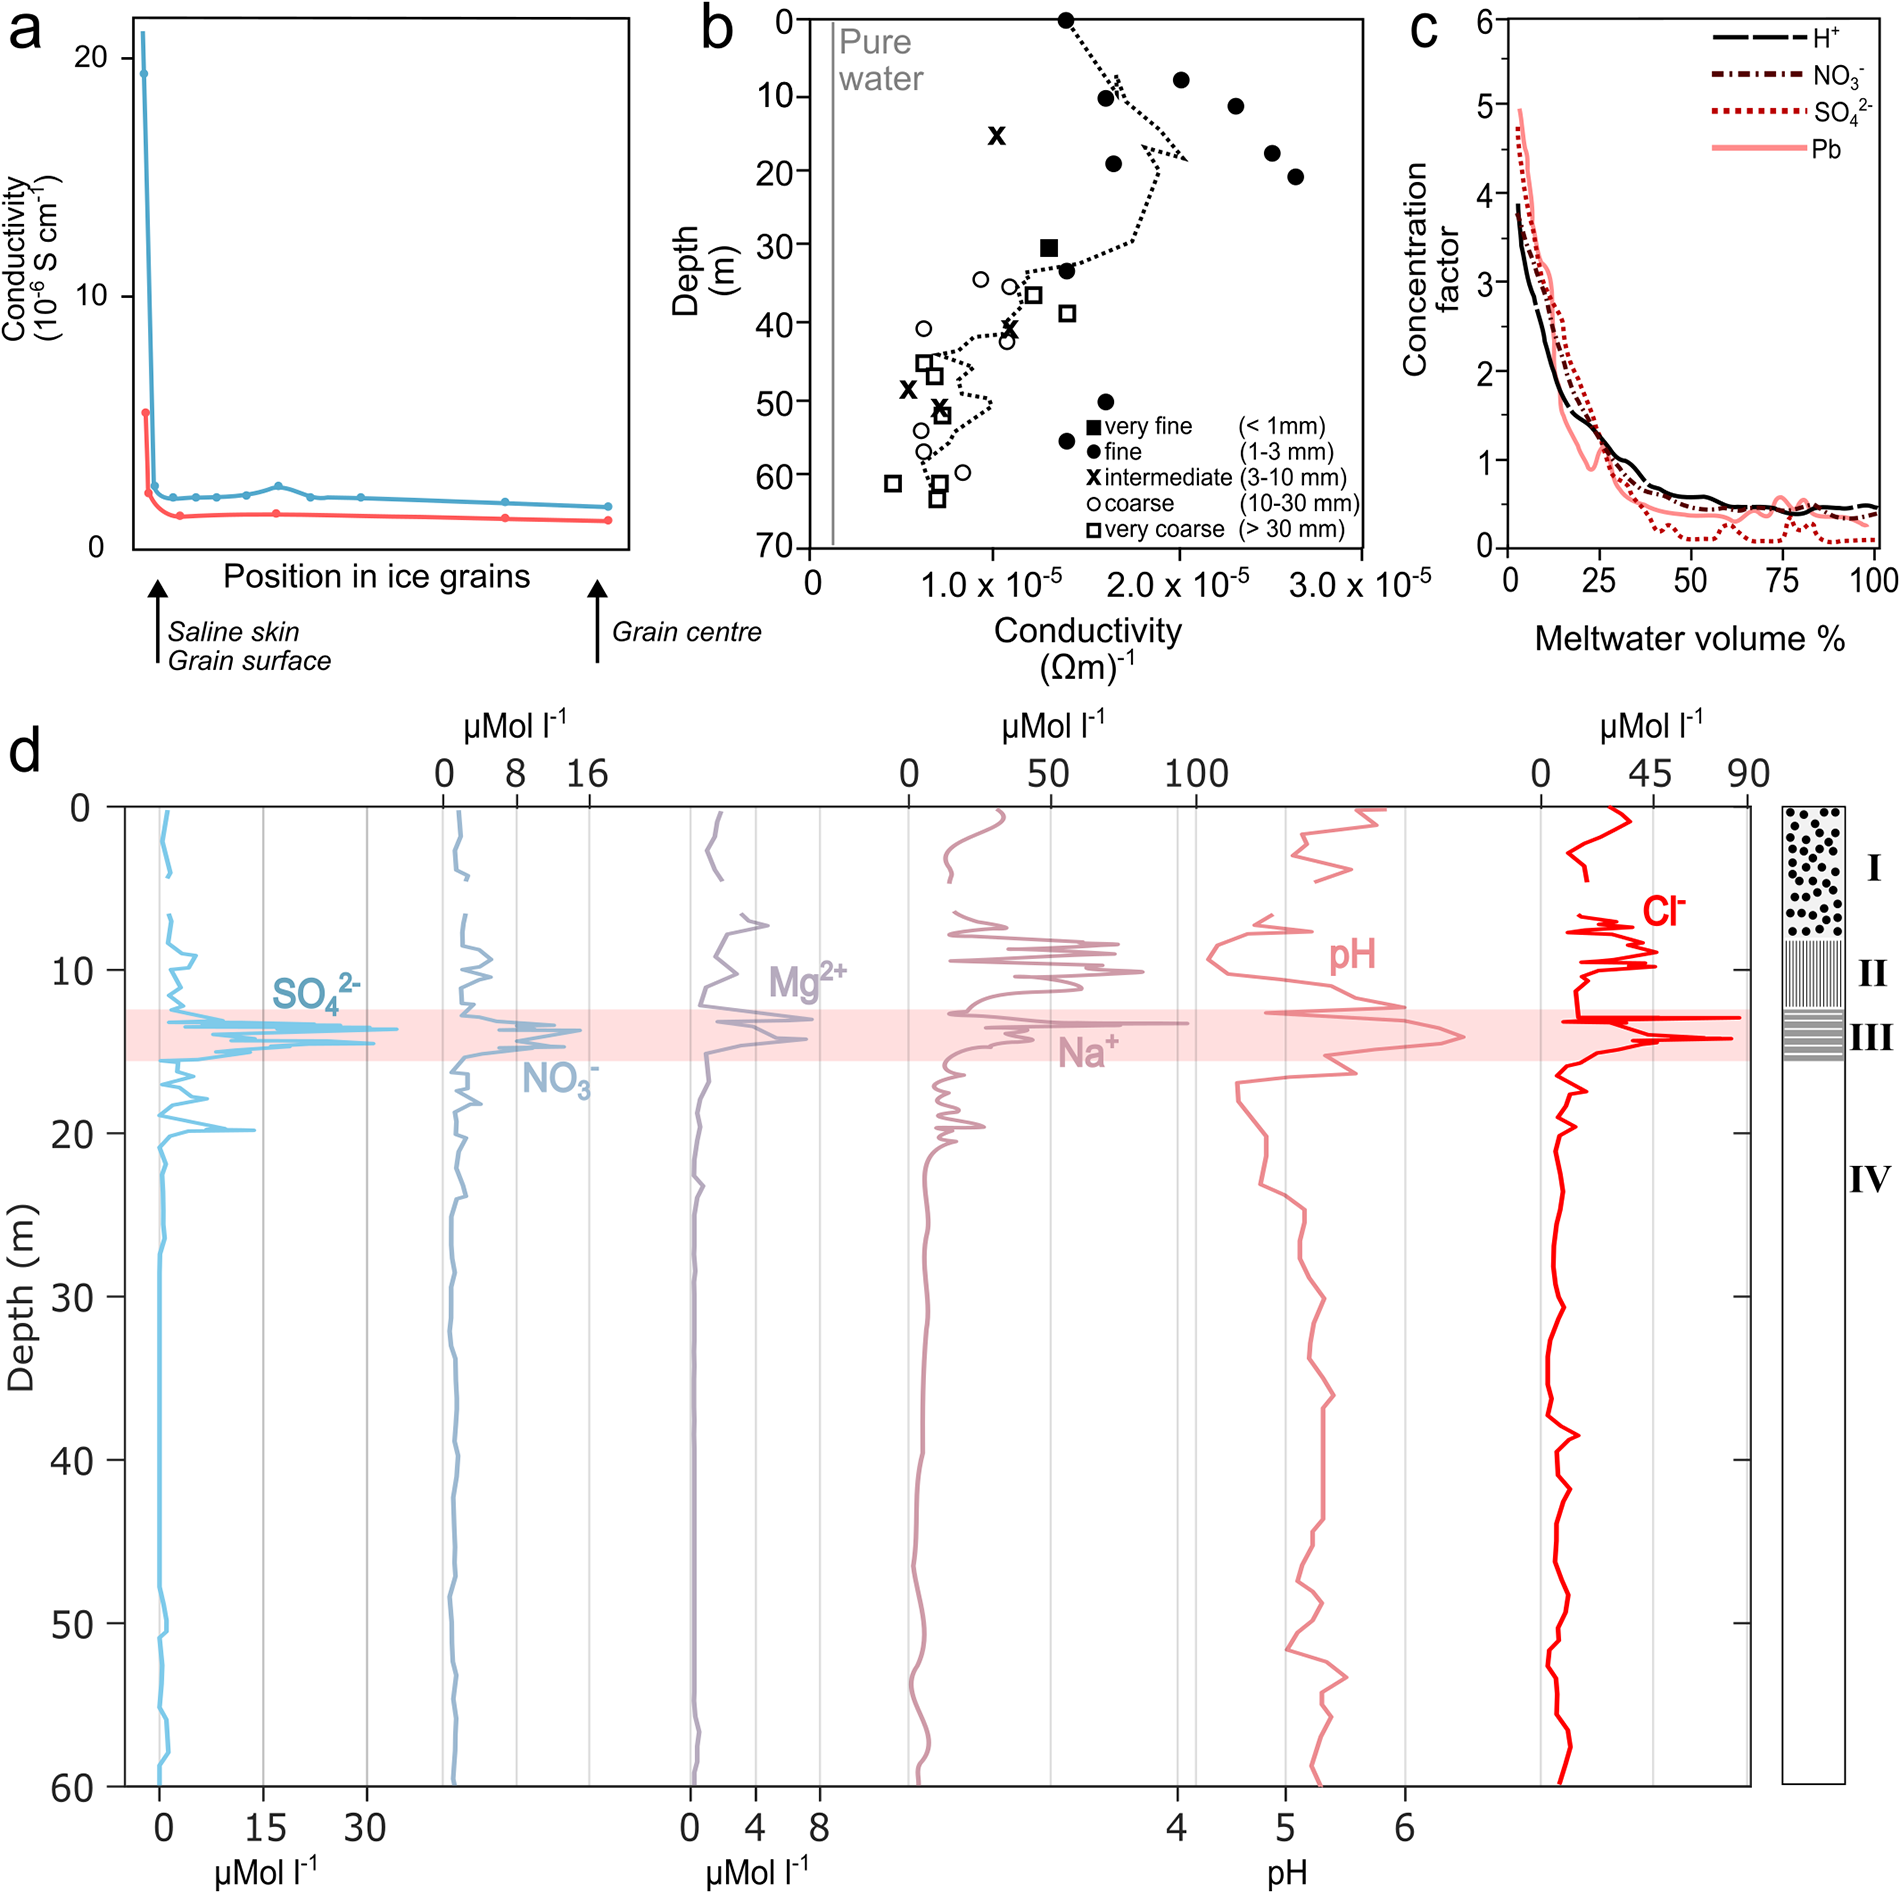
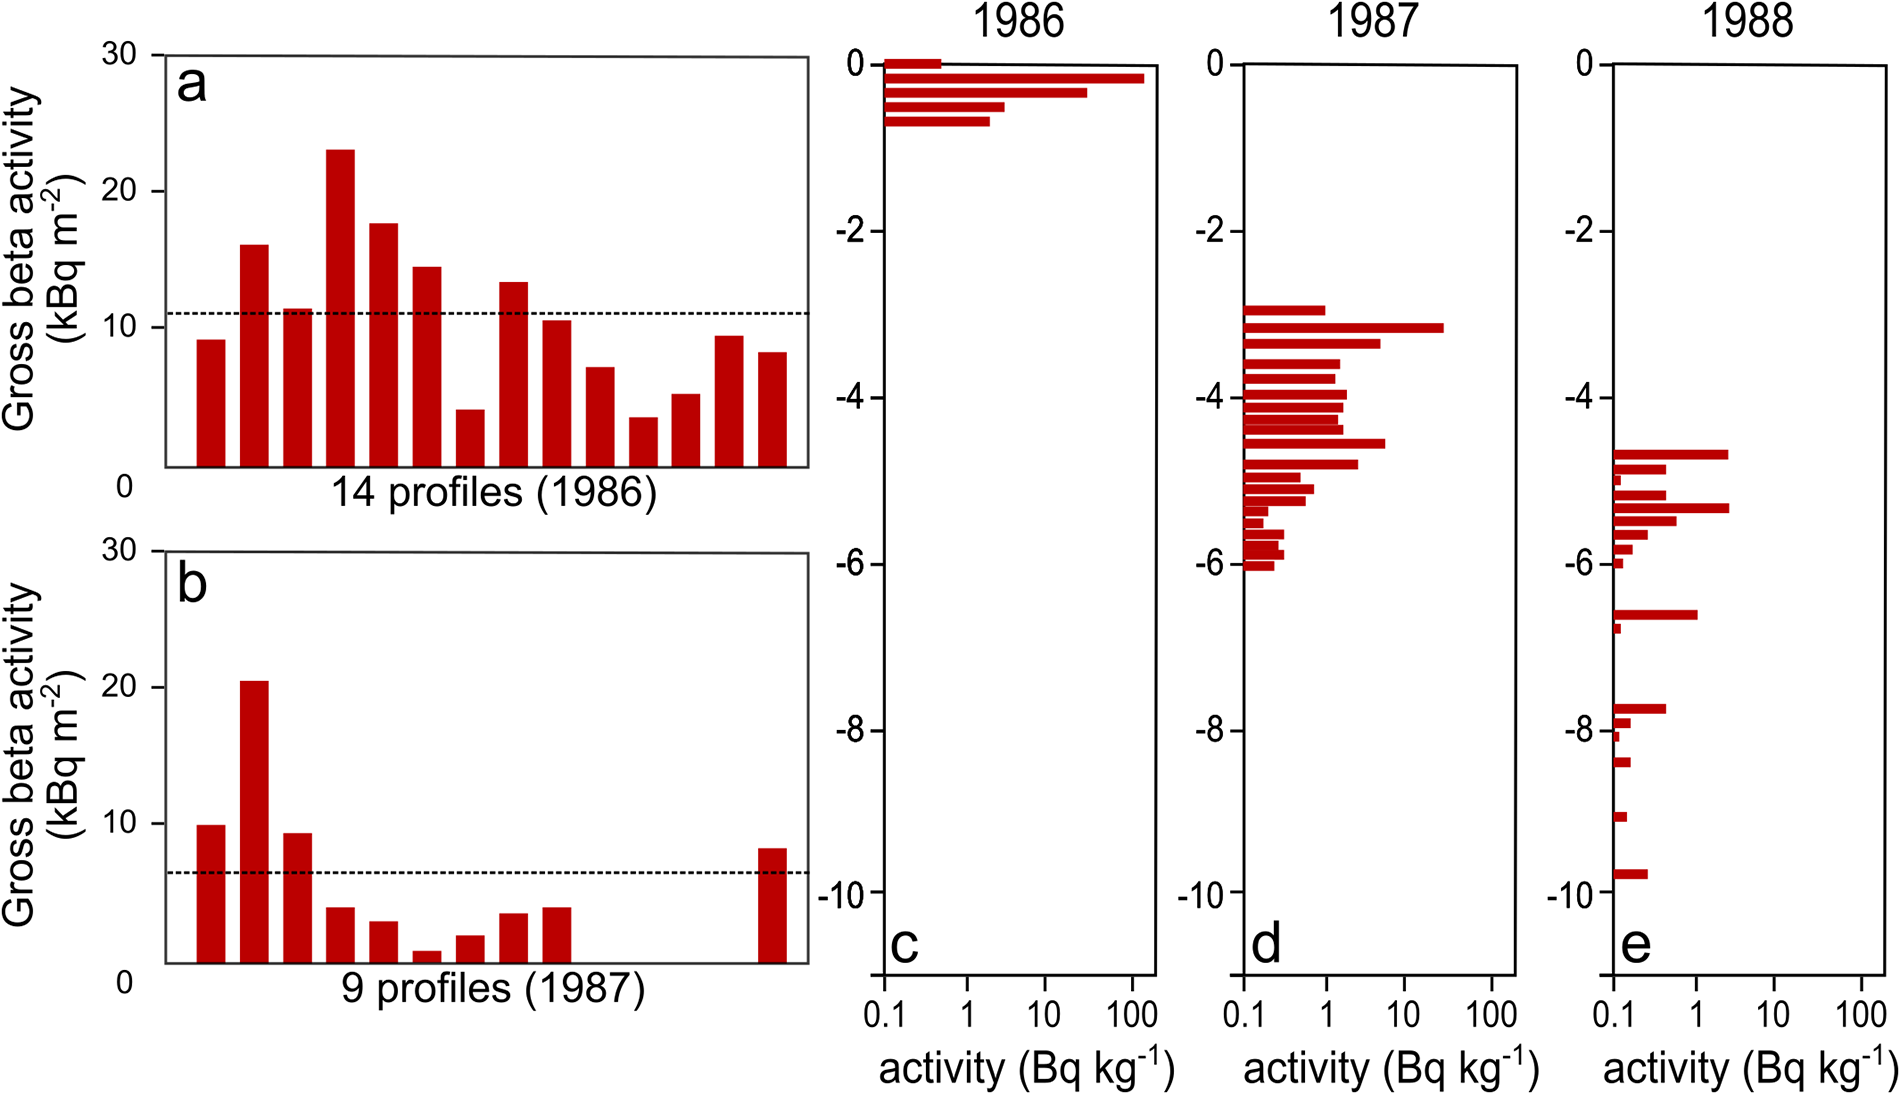
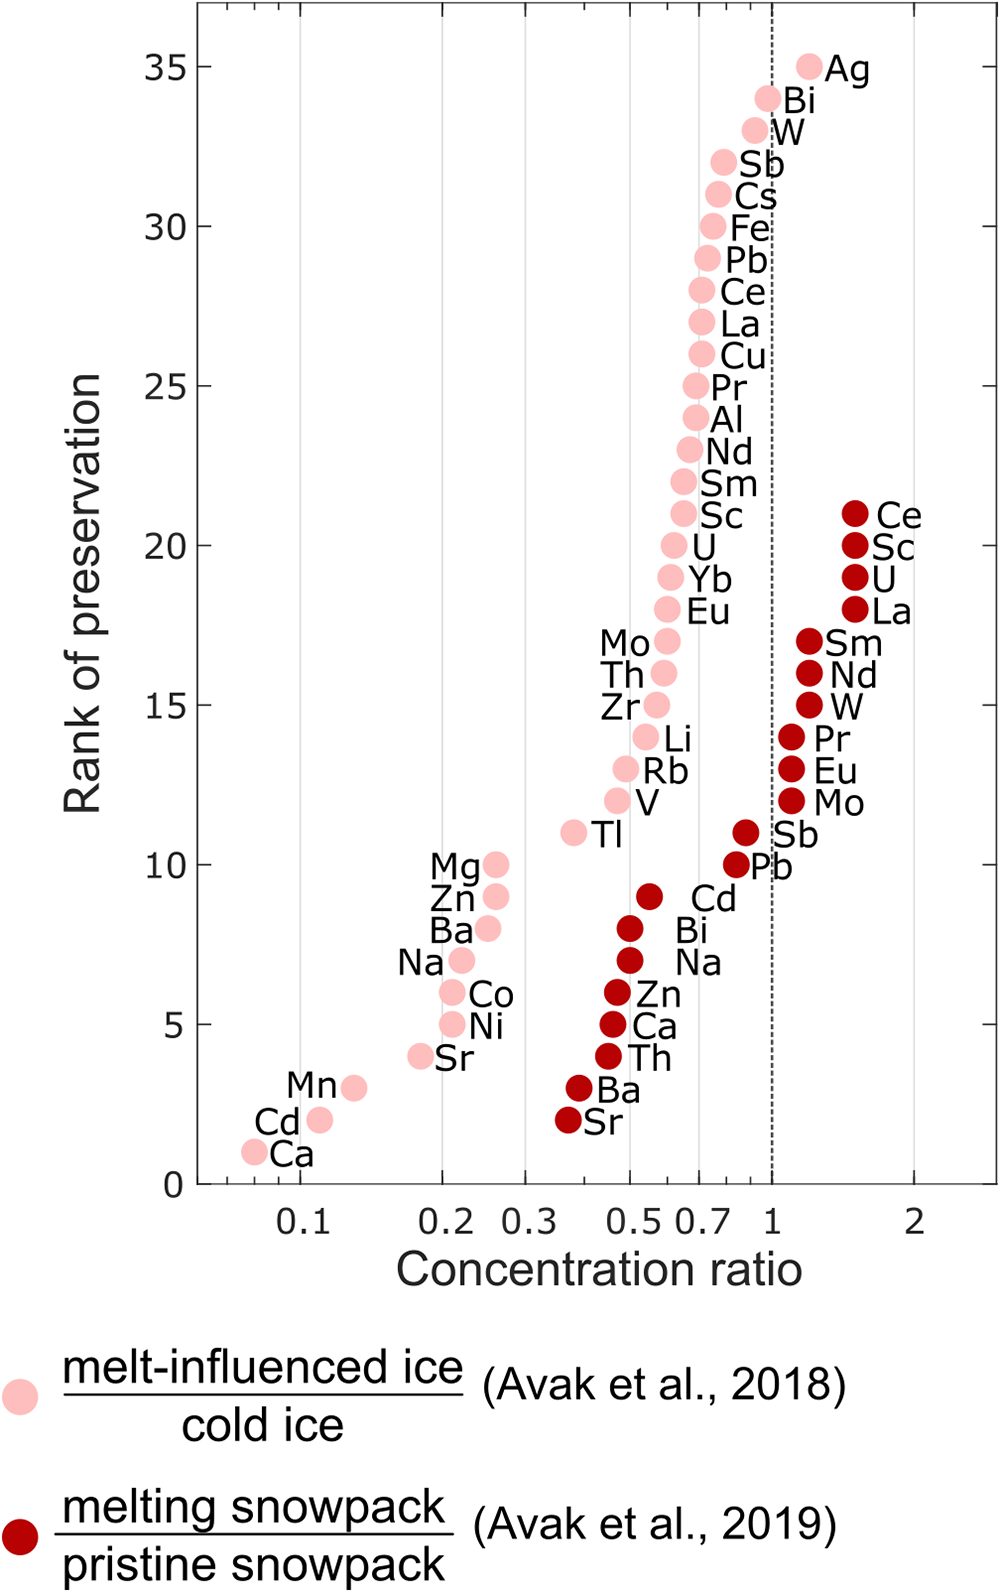
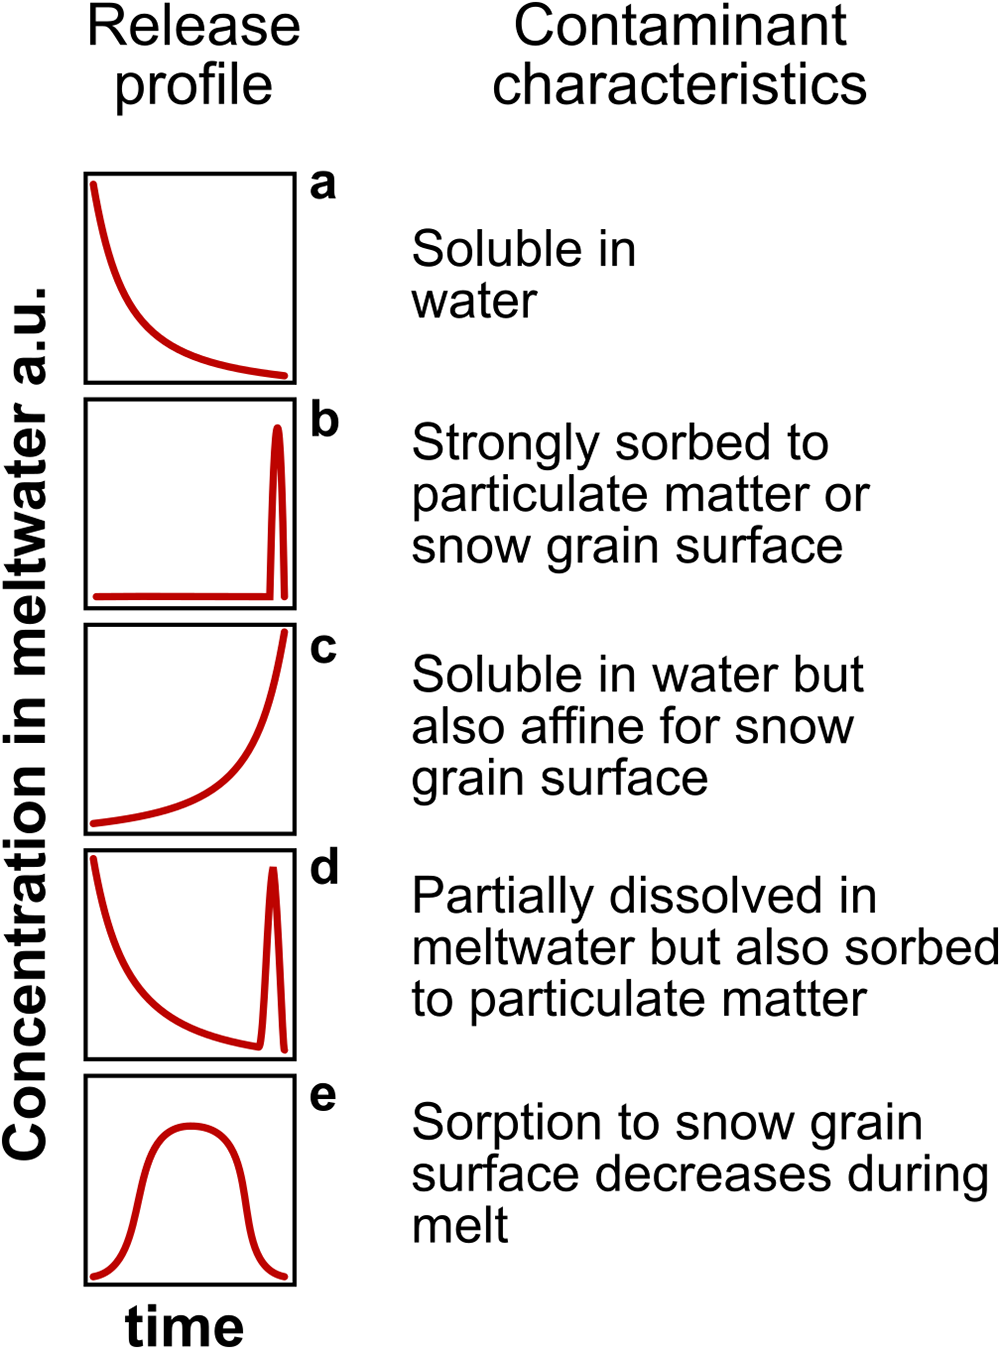
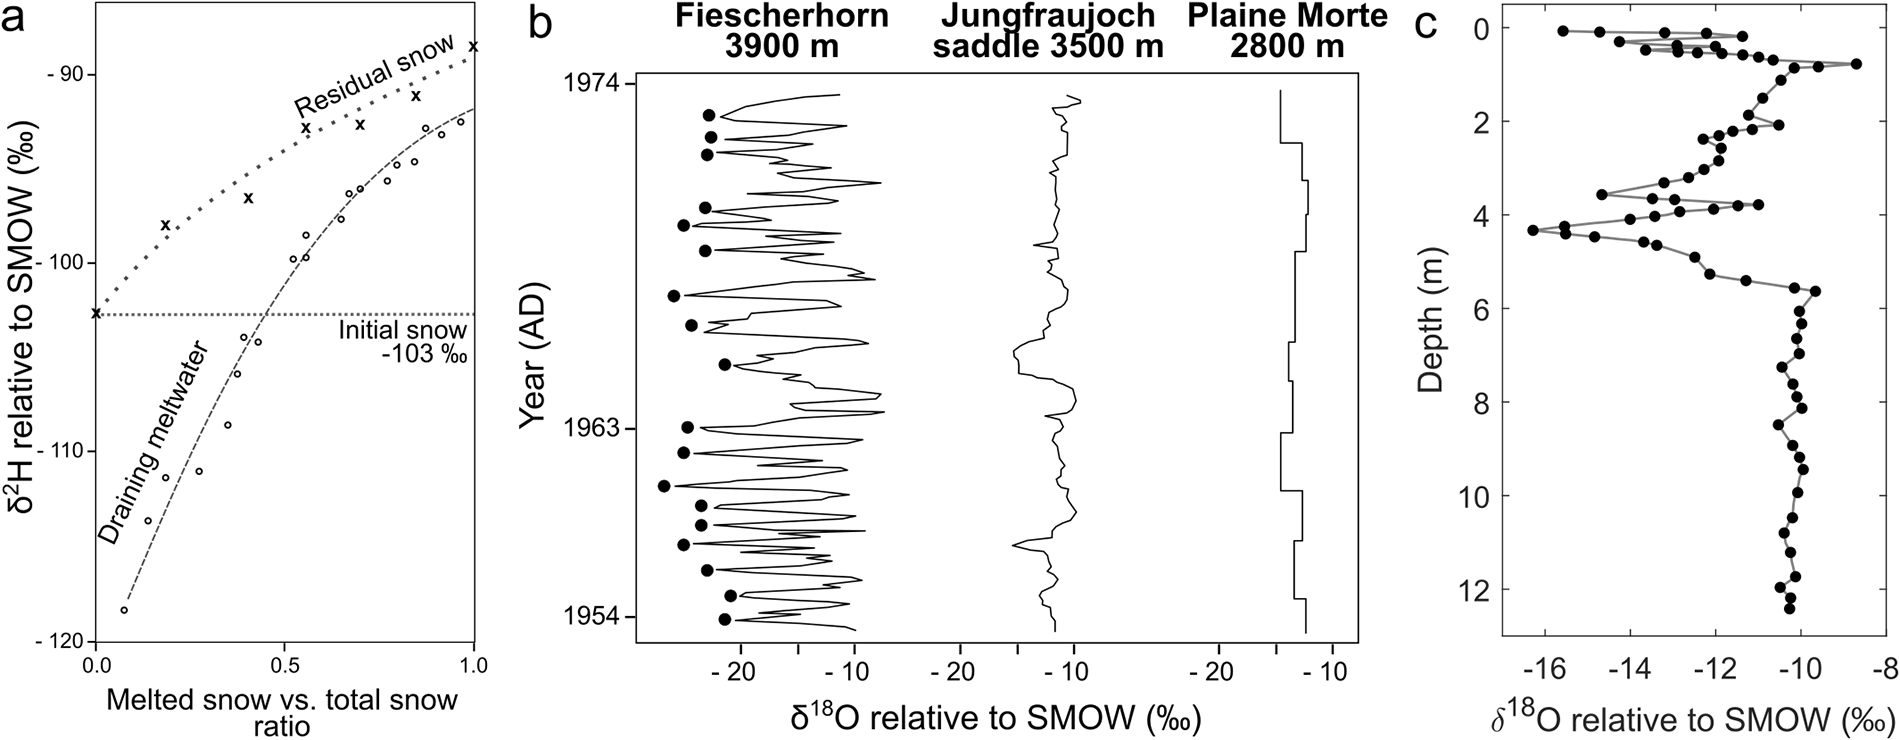
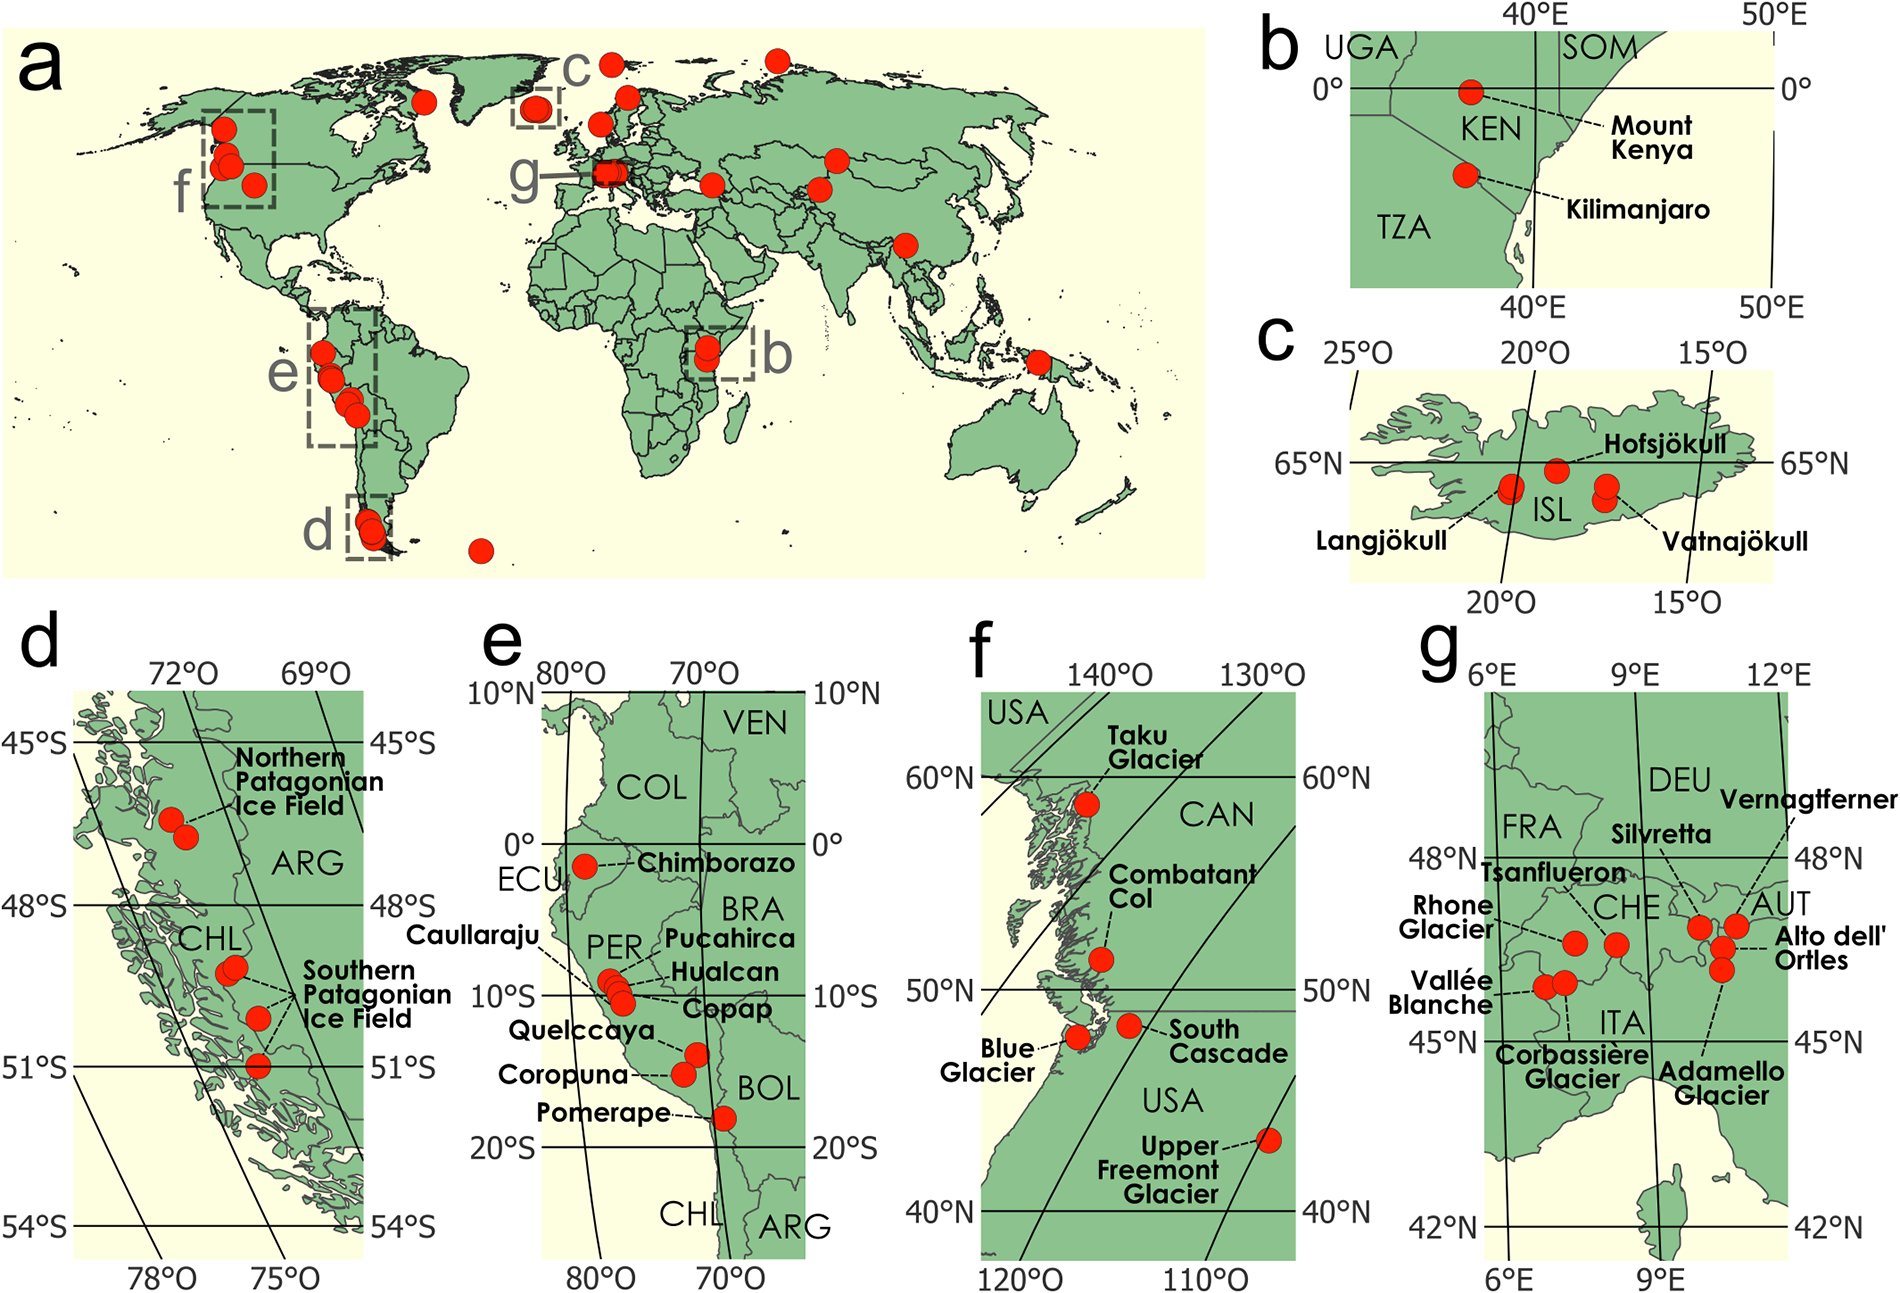


 Open access

