


1. Introduction
Terror attacks are a problem in many countries.Footnote 1 The attacks might persist if violence helps radical groups gain concessions from governments (Pape, Reference Pape2003, Reference Pape2005), and there are worrying signs for the future. On the one hand, evidence shows violence can be effective provided that it is aimed primarily at military—rather than civilian—targets (Abrahms, Reference Abrahms2006, Reference Abrahms2012). On the other hand, security forces are indeed one of the main targets in terrorist and guerrilla campaigns (Gibbs, Reference Gibbs2018). How does the public react to the political violence against their security forces? If voters are sensitive to this specific type of violence, their electoral behavior might affect the way governments approach violent groups. However, despite the existing evidence with regard to political violence against security forces, we know very little about its electoral consequences.
State funerals might be one reason why security force casualties are remarkably effective at gaining concessions from governments. In contrast to the private nature of funerals for civilian victims, combatant casualties are accorded public ceremonies, characterized by the national flag draping over the coffin. Designed to honor those who die while serving the nation, these spectacles nevertheless create physical and therefore emotional proximity to terror victims, indirectly exposing the locals to political violence. Similar exposures lead individuals to develop psychological distress and a perception of threat (Canetti et al., Reference Canetti, Hall, Rapaport and Wayne2013), which in turn influence their political attitudes (Canetti-Nisim et al., Reference Canetti-Nisim, Halperin, Sharvit and Hobfoll2009; Hirsch-Hoefler et al., Reference Hirsch-Hoefler, Canetti, Rapaport and Hobfoll2016). Therefore, terror attacks might affect political behavior not only with the death of security forces but also with their funeral. This paper examines the effect that security force casualties in terror attacks have on vote choice in elections. Specifically, it analyzes whether and how government vote share differs in districts that receive casualties of local townsmen from the Turkish security forces. Its design makes use of the facts that (a) Turkey had two general elections within a short period of time in 2015, (b) terror resumed in between these elections, leaving 153 members of the Turkish security forces dead, and (c) their funeral places varied across the districts of Turkey as a result of compulsory random assignment to and rotation of workplaces among the security personnel. Conditional on the number of personnel in service from each district, the resulting as-if random assignment of casualties to districts is crucial to address the potentially endogenous relationship between terror attacks and vote choice—“a fundamental problem that arises in any attempt to quantify the effect of terrorism on the electorate's preferences” (Berrebi and Klor, Reference Berrebi and Klor2008, 280; see also Getmansky and Zeitzoff, Reference Getmansky and Zeitzoff2014).
The results contradict one of the major premises in the literature. I find that government vote share increases in the hometowns of terror casualties. This challenges the understanding that incumbents are punished for casualties of political violence (see, e.g., Gassebner et al., Reference Gassebner, Jong-A-Pin and Mierau2008; Kibris, Reference Kibris2011). It is only when districts receive multiple casualties that government vote share decreases. Overall, these results are in line with the “rally ’round the flag” effect—a temporary surge in support for the heads of state or government in reaction to a national crisis (Mueller, Reference Mueller1973; Brody, Reference Brody1991).
This paper extends the existing knowledge in at least two ways. Theoretically, it contributes to the efforts to develop an understanding of security forces as a distinct target of political violence. While they have been one of the main targets for much of the known history of terror attacks, civilians and civilian casualties remain the focus of the public and academic debate. Empirically, with a clear identification strategy, this paper provides strong evidence for the rally theory, demonstrating how the electoral effects of casualties are different between the initial and repeated failures of governments to prevent the killing of security force members.
2. Casualties and elections
Casualties are the most important information cue about an armed conflict. For the majority of people away from conflict zones, loss of livesFootnote 2 are “salient, visible, and accountable measures of cost” (Gartner and Segura, Reference Gartner and Segura2008, 95). As such, the public evaluates the success or failure of a country's involvement in a conflict, first and foremost, with the number of its casualties (Burk, Reference Burk1999). There is also a proximity effect below the national level: people might personally know the casualties (Moody, Reference Moody2005), hear about local elites reacting to them (Brody, Reference Brody1991), or learn about them in the local, in addition to national, media (Gartner and Segura, Reference Gartner and Segura2008)—the likelihood of all these increases, the closer the proximity of casualties to people.
As an easily quantifiable measure, casualties are also a subject for an influential literature on political behavior, most notably in wars but also in terror attacks. With regard to wars, studies find that as the military deaths of a nation increase, the public support for involvement in a conflict decreases (Mueller, Reference Mueller1973; Gartner and Segura, Reference Gartner and Segura1998; Gartner, Reference Gartner2008), especially when the involvement is not perceived as successful or justified (Boettcher and Cobb, Reference Boettcher and Cobb2006; Gelpi et al., Reference Gelpi, Feaver and Reifler2006). It stands to reason, then, if voters punish those in charge or in favor of these costly involvements in the ballot box. For example, Karol and Miguel (Reference Karol and Miguel2007) show that the former US President George W. Bush, seeking re-election in 2004, significantly underperformed in states that experienced higher shares of casualties in the Iraq War.
There are similar reports from the Congressional elections in the USA—a major focus of this strand of literature. Senators (Kriner and Shen, Reference Kriner and Shen2007) and congressmen (Grose and Oppenheimer, Reference Grose and Oppenheimer2007) from the Republican party, which was in control of the government during the Iraq War, suffered electoral losses for casualties among their constituents. In contrast, the vote shares of Democrats remained unaffected (Grose and Oppenheimer, Reference Grose and Oppenheimer2007). In the Vietnam War, there was a similar relationship between state-level casualties and the electoral fate of incumbent senators irrespective of their party (Gartner et al., Reference Gartner, Segura and Barratt2004).Footnote 3
With regard to terrorism, there is more evidence that casualties affect electoral outcomes. Public support for right-wing parties increases as a result of civilian casualties in Israel (Berrebi and Klor, Reference Berrebi and Klor2006), a finding that replicates in localities with casualties (Berrebi and Klor, Reference Berrebi and Klor2008; Gould and Klor, Reference Gould and Klor2010) or an increased threat thereof (Getmansky and Zeitzoff, Reference Getmansky and Zeitzoff2014). However, Israeli governments seem unaffected by casualties (Berrebi and Klor, Reference Berrebi and Klor2006, Reference Berrebi and Klor2008), and their vote share might even increase as a result of terror threat (Getmansky and Zeitzoff, Reference Getmansky and Zeitzoff2014). Then again, both Bali (Reference Bali2007) and Montalvo (Reference Montalvo2011) find that the 2004 Madrid train bombings led to a significant decrease in the government vote share in the Spanish general election of that year. Similarly, cross-national analyses show that terror casualties decrease the probability of incumbent parties to stay in power (Gassebner et al., Reference Gassebner, Jong-A-Pin and Mierau2008), especially if they are on the left-wing of the ideological spectrum (Williams et al., Reference Williams, Koch and Smith2013).
These terrorism studies either focus on civilian casualties or look at casualties in general, leaving the security force casualties under-researched. Despite all we know about casualties and elections, it is puzzling how little of the existing evidence comes specifically from security force casualties in terror attacks. One exception is Kibris (Reference Kibris2011), which is an analysis of Turkish security force casualties itself, in the first half of 1990s. It reports that province-level casualties correlate negatively with the vote share of the governing parties but positively with that of the right-wing parties.
A second dimension of the research gap emerges as the literature “cannot, at least in many instances, account for the presence or absence of a public opinion rally at the outset of a military conflict, before the public observes either the ultimate costs or outcome” (Groeling and Baum, Reference Groeling and Baum2008, 1065). Indeed, studies time and again rely on typically high aggregation levels and/or lengthy periods between elections, making it impossible to differentiate how the public reacts to initial and repeated casualties. This is especially problematic as the theory suggests a non-linear public behavior, known as the rally effect.
This study helps fill these two dimensions of the research gap. On the one hand, like Kibris (Reference Kibris2011), it focuses on security force casualties and uses the rotation of workplaces among the security personnel as an identification strategy. On the other hand, it provides a rigorous test for the main assumptions of the “rally ’round the flag effect,” including the assumption of non-linear public behavior, with data from towns at elections held less than five months apart.
3. Rally effect
Public perception of casualties may not be consistent over the course of a conflict. Studies particularly differentiate between the initial reaction to emerging conflicts and the political mood that follows in the later stages (Waltz, Reference Waltz and Rosenau1967; Mueller, Reference Mueller1973; Brody, Reference Brody1991; Chowanietz, Reference Chowanietz2011). Specifically, Mueller (Reference Mueller1973, 209) defines a “rally ’round the flag effect,” which causes a temporary surge in public support for US Presidents who involve in international conflicts. Some explain this surge in terms of a patriotic reflex, where the public unites behind the leader against a common enemy (Mueller, Reference Mueller1973). This might be one of the reasons why the immediate reaction to casualties is, if anything, a hardened determination among the public to fight back (Schwartz, Reference Schwartz1994; Kull and Destler, Reference Kull and Destler1999).
Others argue that rallies start among the political elite before spreading to the public through the media. Elites might avoid criticizing the government if they lack the necessary information about what is happening (Brody, Reference Brody1991) or what the public thinks (Hetherington and Nelson, Reference Hetherington and Nelson2003). In the aftermath of crises, when this lack of information is most severe, opinion leaders refrain from taking the risk of being wrong or sounding controversial (Zaller, Reference Zaller, Bennett and Paletz1994; Zaller and Chiu, Reference Zaller and Chiu1996). In the absence of their criticism, there appears to be an unusual level of support for the government on the media, to where the public turns to form their opinion about a conflict in general and especially about their governments’ handling of that conflict (Russett, Reference Russett1990).
Although the rally theory is developed over the observations of public support for US Presidents in times of war, the rally effect is a phenomenon that also applies to other executives in other crises, such as governments under terror attacks (see, e.g., Chowanietz, Reference Chowanietz2011). Accordingly, be it as a result of a patriotic reflex or elite behavior, I expect that public support for government would increase in localities that experience a casualty.
Hypothesis 1: Government vote share increases in localities with a security force casualty.
Rally effects are sensitive to repetition. On the one hand, the patriotic reflex weakens with new casualties (Mueller, Reference Mueller1973). On the other, elites become more confident to openly criticize the government. For example, Chowanietz (Reference Chowanietz2011) finds that opposition parties hold back their criticism of the government for three consecutive terror attacks, after which the rally effects start to fade away. Therefore, I expect that when localities experience multiple security force casualties, public opinion would change direction.
Hypothesis 2: Government vote share decreases in localities with multiple security force casualties.
4. Data and design
This study provides evidence from Turkey—one of the hardest-hit countries in the recent history of terror attacks. In fact, it has long been a target of Kurdish groups among others, and in about three decades, almost 8000 members of the Turkish security forces died in terror attacks (TGNA, 2013). Figure 1 visualizes the monthly number of security force casualties in the last decade.
Recent trends in security force casualties in Turkey, 2010–2020. Political violence resumed in between the two elections in 2015. Source: UCDP Georeferenced Event Dataset (Pettersson and Öberg, Reference Pettersson and Öberg2020).
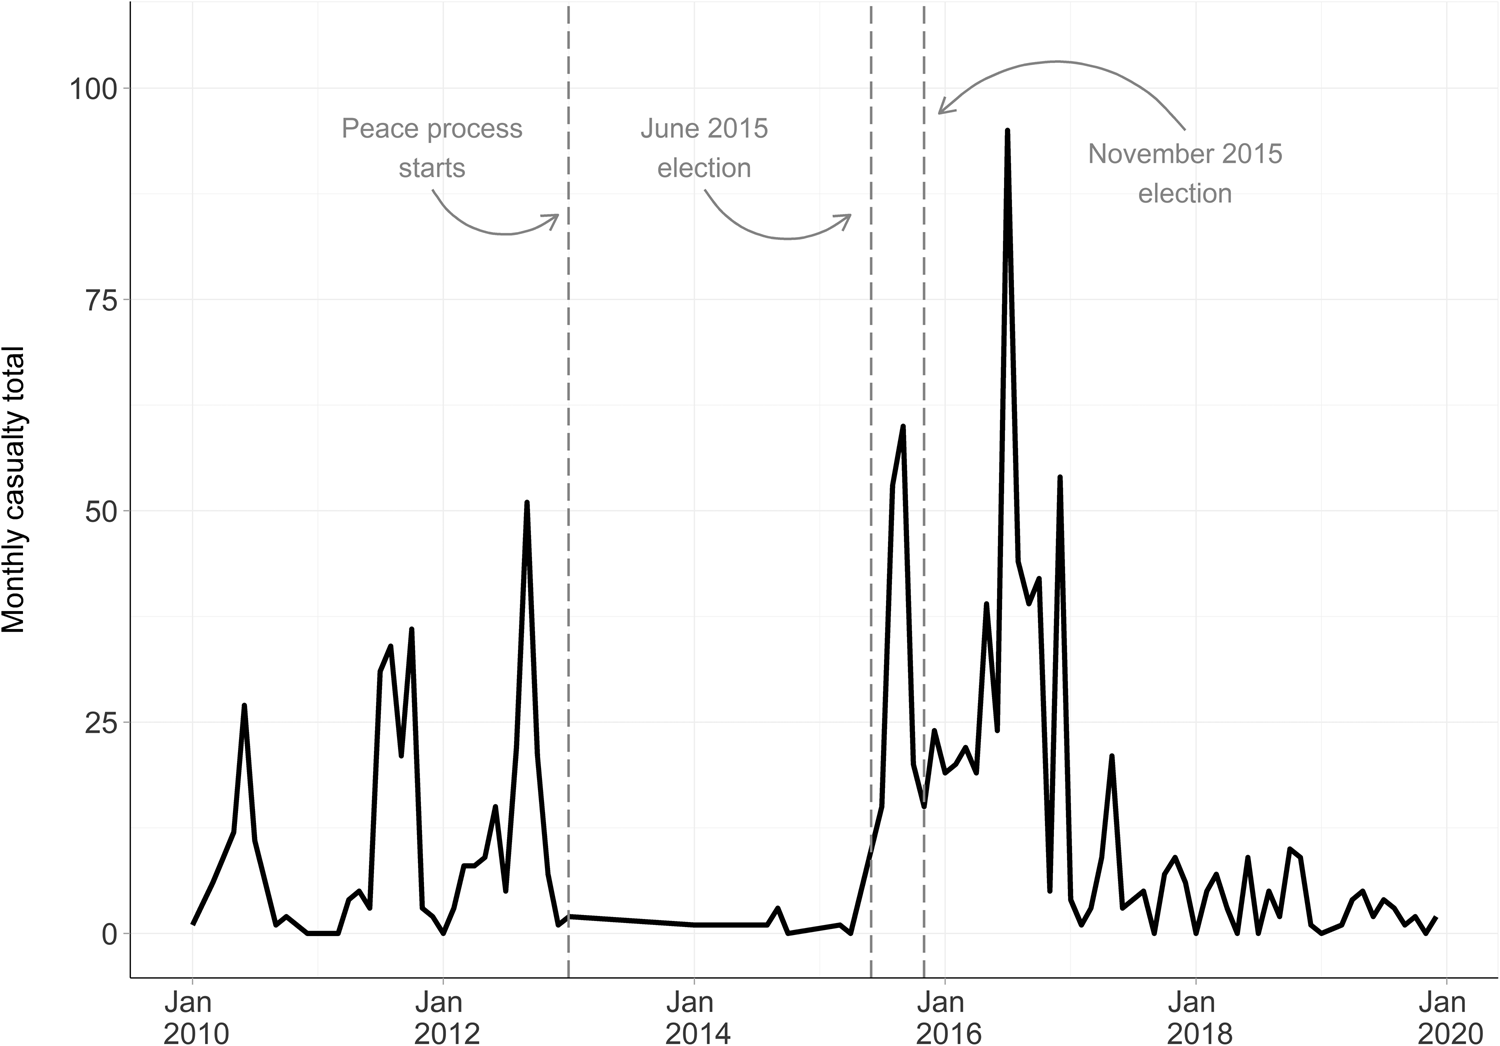
The 7 June 2015 general election took place amid a strained but nevertheless ongoing peace process, when the governing Justice and Development Party (AKP) fell short of controlling a majority of the parliamentary seats for the first time in 13 years. With the Syrian Civil War spilling in through south-east Turkey—where the majority of the Kurdish population live—the country came under a double terrorist threat by both Kurdish and jihadist groups soon after the indecisive results.Footnote 4 By the time the election was repeated on 1 November 2015, a further 153 security personnel had been killed in rapidly escalating terror attacks. Kemahlıoğlu (Reference Kemahlıoğlu2015) and Sayarı (Reference Sayarı2016) provide detailed accounts of this series of events.
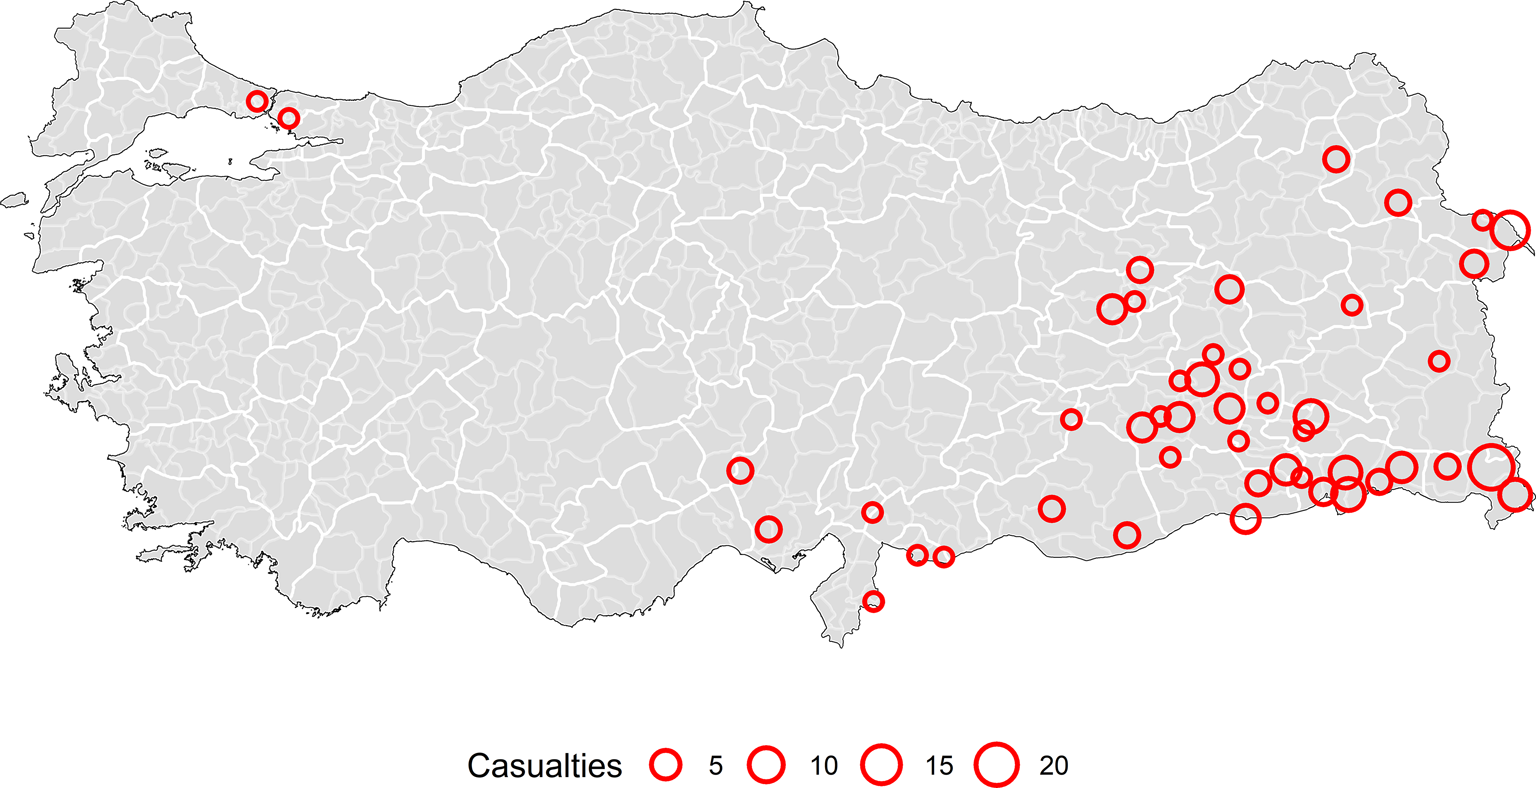
Figure 2 marks the 47 districtsFootnote 5 where these terror casualties occurred, systematically pointing to the south-eastern region of the country. Whenever there are reports of a terror attack on security forces, districts across Turkey, no matter how far from the south-eastern region, brace themselves for receiving a casualty. Within a day or so after deadly attacks, flag-draped coffins arrive in home districts, where state funerals take place. Fellow townspeople, typically in their thousands, attend these ceremonies with high-level representatives from the political parties, the bureaucracy, and the government alike. Security forces killed in the line of duty are given similar state ceremonies elsewhere in the world as well. Yet, what makes the Turkish case special is the compulsory system of random assignment and workplace rotation for the security forces.
Districts of terror attacks with one or more security force casualties. The death places were concentrated in south-east Turkey.
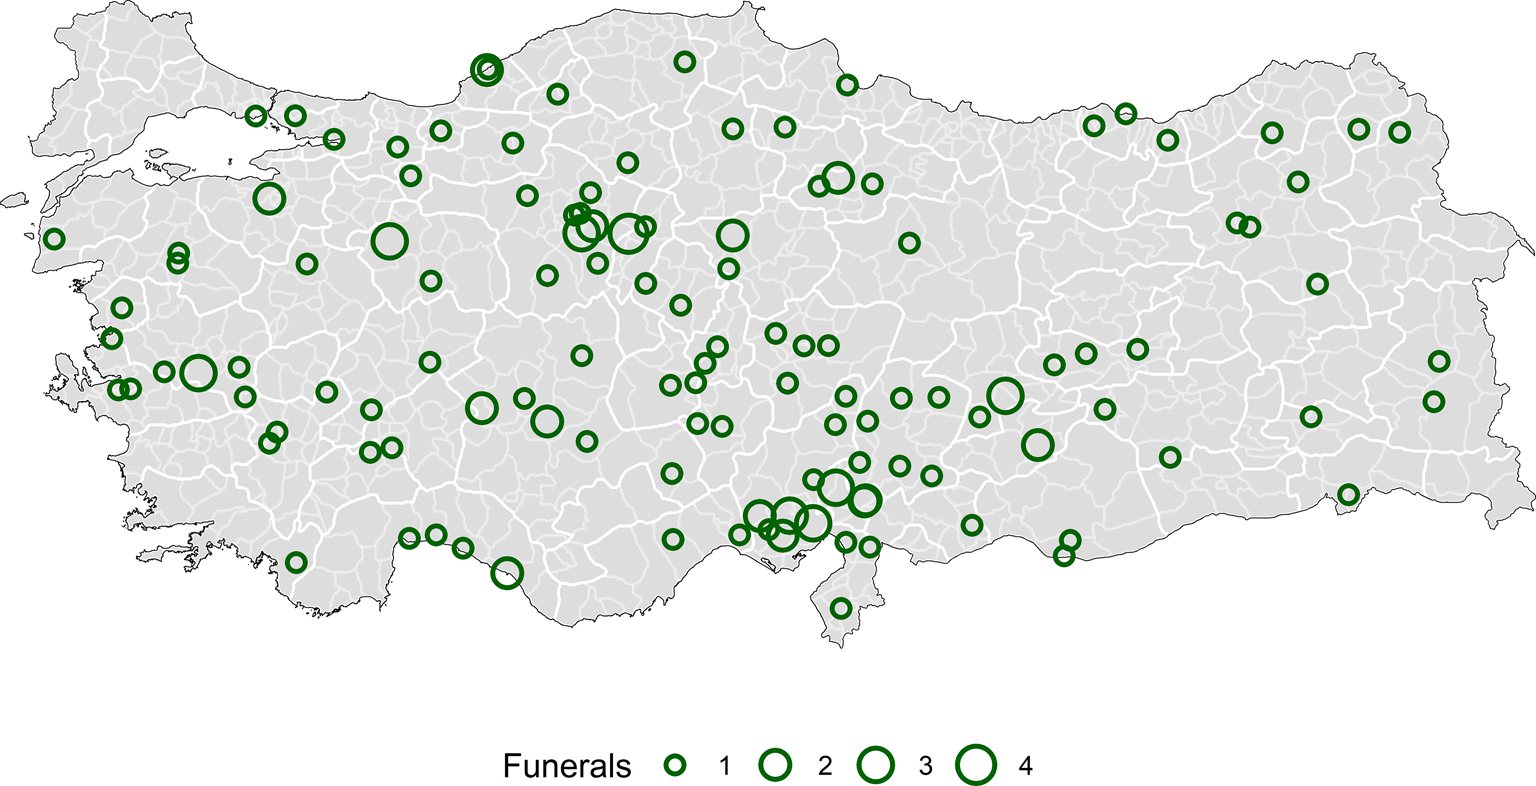
As Figure 3 shows, the funeral places of these casualties were scattered across the whole country. This is because the Turkish security force personnel serve anywhere except in their own hometown, randomly assigned to and rotated among the other districts and provinces (Kibris, Reference Kibris2011, 223). Indeed, none of the 153 victims were serving in their home district at the time of their killing—instead, they were originally from 123 other districts unbeknown to the attackers, somewhere on average 715 kilometers away from the attacks (SD = 362, median = 718, min = 46, max = 1576). In other words, terrorist groups might target security forces in specific districts in Turkey, but they cannot target to which districts their victims will be taken in flag-draped coffins.
Treatment districts. The funeral places were distributed as-if randomly across Turkey.
This is a favorable setting to estimate the causal effect of security force casualties in terror attacks on electoral outcomes—with the overall assumption that districts are treated with funerals as-if randomly, and therefore that those with and without funerals are comparable, conditional on the number of security personnel in service from each district. Overall, the analysis is based on two variables of interest: (a) district-level voting results from the 5 June (pre-test) and 1 November (post-test) elections and (b) the funeral districts of the terror victims among the Turkish security forces.
The data on voting results comes from the Turkish Statistical Institute (TurkStat). The data on casualties originates from the UCDP Georeferenced Event Dataset (Pettersson and Öberg, Reference Pettersson and Öberg2020), which I validated against the news reports in the Turkish media. Treatment is coded as 1 for the 123 districts that had at least one funeral in between the two elections. While 102 districts were treated only once, the remaining 21 districts were treated multiple times—they received two or more casualties (mean = 2.4, SD = 0.6, median = 2, min = 2, max = 4). I coded Multiple Treatment as 1 for these districts, making it possible to distinguish between the effect of the initial and repeated casualties—a key assumption of the rally theory but one that has been largely unexplored so far.
The condition on the as-if random treatment is due to the likely consequential differences in the number of security personnel recruited from each district, requiring an adjustment for the increased probability of being assigned to the treatment groups among the districts with more townsmen in service. In the absence of precise data on this variable, I use a proxy measure—Recruitment Pool, the number of men in their 20s from each district at the end of 2014, as reported by the TurkStat. The motivation for this control strategy is the fact that age and gender strongly predict who serves in the Turkish security forces. The compulsory military service is for male citizens only, after turning 20 (Yildirim and Erdinç, Reference Yildirim and Erdinç2007). Similarly, police officers are almost exclusively male (Ekşi, Reference Ekşi2017), with the majority recruited in their early 20s as well (Caglar, Reference Caglar2004). This is reflected in the data, as all 153 casualties were male, with an average age of 28.9 (SD = 7.6, median = 26, min = 20, max = 54). Moreover, randomization checks reported in Table S2 confirm that Recruitment Pool is indeed a predictor of the treatment status. Once it is controlled for, however, these checks suggest that the assignment to the treatment groups is not correlated with a number of other pre-treatment district characteristics.
5. Results
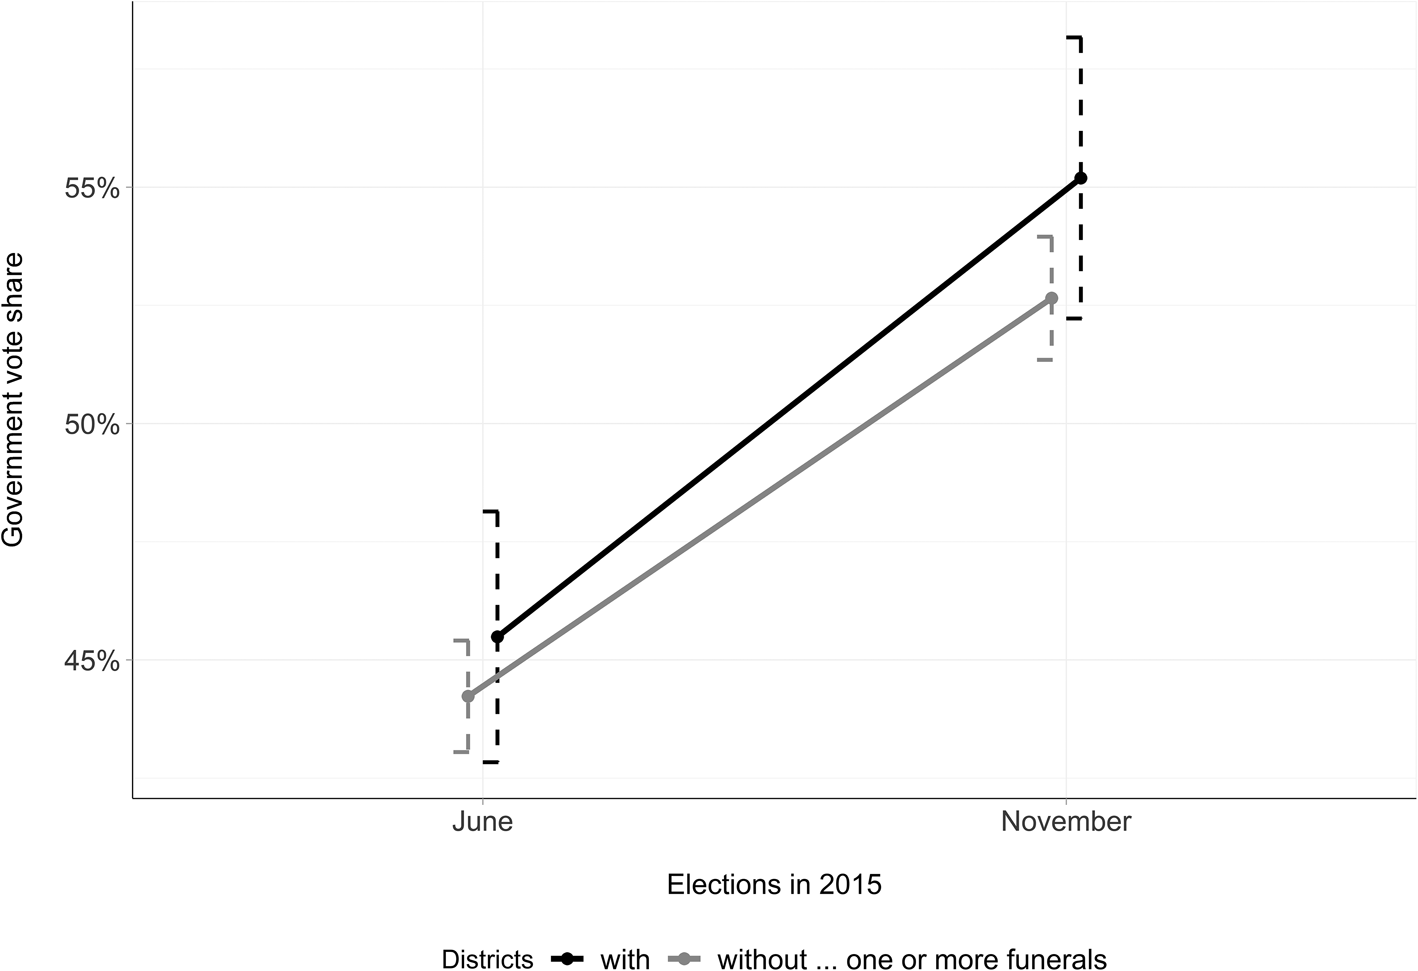
Figure 4 plots the government vote share in the two general elections of 2015, by treatment status. It shows that the treated and control districts were separated by a 1.3 percentage points difference in favor of the treated districts in the pre-test. In the post-test, however, this difference doubled in size, and the government vote share was 2.6 percentage points higher in the districts that received one or more casualties before the second election, compared to the control districts with no casualties. Overall, the comparison of the average vote shares suggests that security force casualties increased the electoral support for the government.
Government vote share in the 2015 elections. Compared to the election in June, the difference between the treatment and control districts was twice as large in November. Note: Error bars represent 95 percent confidence intervals.
The results in Table 1 confirm that this is a statistically significant increase. These are ordinary least squares (OLS) regression models with standard errors clustered at the level of provinces. In the first two models, which do not include Multiple Treatment, the coefficients for Treatment inform us about the same comparison as visualized in Figure 4—the differences between the government vote share in the districts with and without one or more funerals. After regression adjustments, the best estimates for the difference are just over 1 percentage point. This is slightly smaller than, yet comparable with, the simple difference of the group means in Figure 4.
Regression models of government vote share
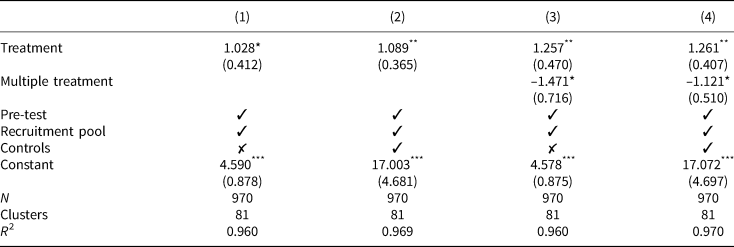
Notes: All models are OLS regressions. Standard errors are in parentheses, clustered at the province level. Controls refer to seven variables: Non-terror Funeral, Attack District, Kurdish District, AKP District, Higher Education, Electoral Margin, and Turnout. See the Supporting Information for the complete results (Table S3) and for further details on the underlying data and variables.
*p < 0.05, **p < 0.01, ***p < 0.001.
What happens when Multiple Treatment is introduced into the analysis, as in models 3 and 4? First, Treatment now estimates the effect of a single casualty, instead of one or more casualties, on government vote share. These estimates are slightly higher than in the preceding models, indicating that the government vote share increased by about 1.3 percentage points in the districts with only one funeral in between the two elections. This provides support for the first hypothesis.
Second, the effect of more than one casualty is now captured by Multiple Treatment. In contrast to the previous scenario, the results show that multiple casualties decreased the electoral support for the Turkish government—by 1.1–1.5 percentage points, depending on the model specification. In other words, the rally effect changed direction in the districts with repeated casualties. Hence there is support for the second hypothesis as well.
These results are robust to rigorous tests, reported in the online Supporting Information. With regard to the comparability of treatment and control groups, Table S5 shows that the results do not change if the data is weighted with entropy balancing, which creates perfectly balanced samples with respect to the treatment assignment. In re-consideration of the treatment coding, the results replicate in two alternative schemes as well, designed to isolate the effect of single casualties (Table S6) and detect quadratic relationships (Table S7). Finally, further tests rule out the possibility that differences in treatment timing (Table S8), treatment source (Table S9), or turnout (Table S10) could have driven the differences in the government vote share.
6. Conclusion
We know that governments are more likely to make concessions to violence against security forces, but we do not know why. Assuming that governments are concerned about public opinion, we need to understand the electoral effects of security force causalities in political violence if we want to solve this puzzle. Yet, we cannot do so with the existing knowledge because it either does not distinguish between the targets of political violence or, when it does, it suffers from large casualty totals as well as from the endogenous relationship between targets and votes.
This study tackles these challenges with data from Turkey, where political violence resumed between two general elections held in less than five months apart, targeting the security forces as well as civilians. The security force victims of the resulting attacks were distributed as-if randomly across the districts in the country, and their flag-draped coffins were the center of public ceremonies in their hometowns. Hence the data provide us with two ultimate tests on public opinion in a short period of time, small casualty totals by localities, and most importantly, with an exogenous variation of funeral places.
The results show that the public reacts significantly to political violence against security forces, but with a nuance: they rally behind their government after the initial terror victim from their hometown, but this rally reverses if the government fails to prevent further victims. This contradicts the existing studies that assume a linear relationship between the number of casualties and vote choice, debating whether casualties increase or decrease the support for incumbents. It does both.
These results might explain why governments are more likely to make concessions to stop violence against security forces. Once the members of security forces start falling victim to violence, preventing further casualties would not only avoid the punishment that the existing evidence attributes to the increasing number of casualties. It would also bring in rewards in localities with single casualties, and governments could catch the rally effect behind them. It is the latter aspect that this paper adds to our knowledge.
Supplementary material
The supplementary material for this article can be found at https://doi.org/10.1017/psrm.2021.30
Acknowledgments
I would like to thank Katrin Auel, Luis de la Calle, Josip Glaurdić, Peter John, Elad Klein, Brian J. Phillips, Antje Schwennicke, Guido Tiemann, Denise Traber, and the audiences at the following events for their comments on the earlier versions of this article: ECPR General Conference 2017, EPSA Annual Conference 2018, and the workshop on “The Effects of Terrorism and Violence on Political Behaviour” at the University of Barcelona.


 Open access