


INTRODUCTION
Dengue is endemic in more than 100 countries and poses a risk to approximately half of the world's population [Reference Gubler1]. Over the last two decades, dengue epidemics of increasing magnitude have spread throughout Brazil [Reference Nogueira2, Reference Nogueira3]. Control of Aedes aegypti populations is the only form of dengue prevention, given that there is neither aetiological treatment, chemoprophylaxis, nor vaccine [Reference Gubler1]. Insecticide-based interventions constitute the primary form of vector control [Reference Gratz4]. However, mosquitoes have developed resistance to the major classes of insecticides, hampering control efforts [Reference Brogdon and McAllister5–Reference Lima10].
Insecticide-based interventions can target larvae or adult mosquitoes [Reference Gratz4]. Larval control constitutes application of insecticides to breeding sites, inducing high initial mortality that slowly decays with time [Reference Lima, de Melo and Valle11, Reference Pontes12]. Although larval control can reduce adult mosquito abundance, the delay between implementation and subsequent impact on adult mosquitoes makes this intervention less appropriate for an emerging dengue epidemic [Reference Gratz4]. When a rapid reduction of adult mosquitoes is needed, adult control using ultra-low-volume insecticide applications has been suggested as the suitable intervention [Reference Gratz4, Reference Macoris7].
Studies on the efficacy of ultra-low-volume insecticide applications vary substantially [Reference Gratz4, Reference Gubler13–Reference Bangs19], as multiple factors are involved. For example, when using vehicle delivery, road availability and conditions, presence and height of fences, locality of houses within lots, and presence and state (open or closed) of doors and windows all have a bearing on efficacy. When using hand-held equipment, efficacy may vary as a function of time spent in a house, thoroughness of application, and presence of inapplicable resting sites: A. aegypti are known to rest in secluded and unreachable places such as inside wardrobes and under beds [Reference Koenraadt15, Reference Perich16]. Insecticide-related factors (type, dosage, droplet size) and environmental factors (air temperature, wind direction, speed) also influence the efficacy of ultra-low-volume insecticide applications [Reference Gratz4, Reference Perich16]. Recently, other forms of A. aegypti adult control have been proposed: insecticide treatment of surfaces and materials and use of lethal ovitraps [Reference Kroeger20–Reference Perich22]. These strategies have a selective effect on adult mosquitoes and prolonged environmental persistence, which may enhance the effectiveness of dengue control measures.
We evaluate the effectiveness of insecticide-based interventions on adult A. aegypti abundance and resistance profile using a mathematical model that simulates seasonal mosquito population dynamics. Insecticide-based interventions target larvae, adults, or both, with varying number of applications annually. Through our evaluation of the effectiveness of an intervention on both adult mosquito abundance and resistance profile, we reveal thresholds of optimal application frequency. We contrast the optimal intervention with year-long continuous larval control policies adopted in many settings where dengue transmission occurs [Reference Bangs19, Reference Donalisio and Glasser23]. Thus, we make recommendations for the improvement of current vector control policies to curtail dengue transmission. Our model extends previous studies that evaluate vector control policies [Reference Burattini24, Reference Newton and Reiter25] since it incorporates resistance evolution.
METHODS
Mathematical model
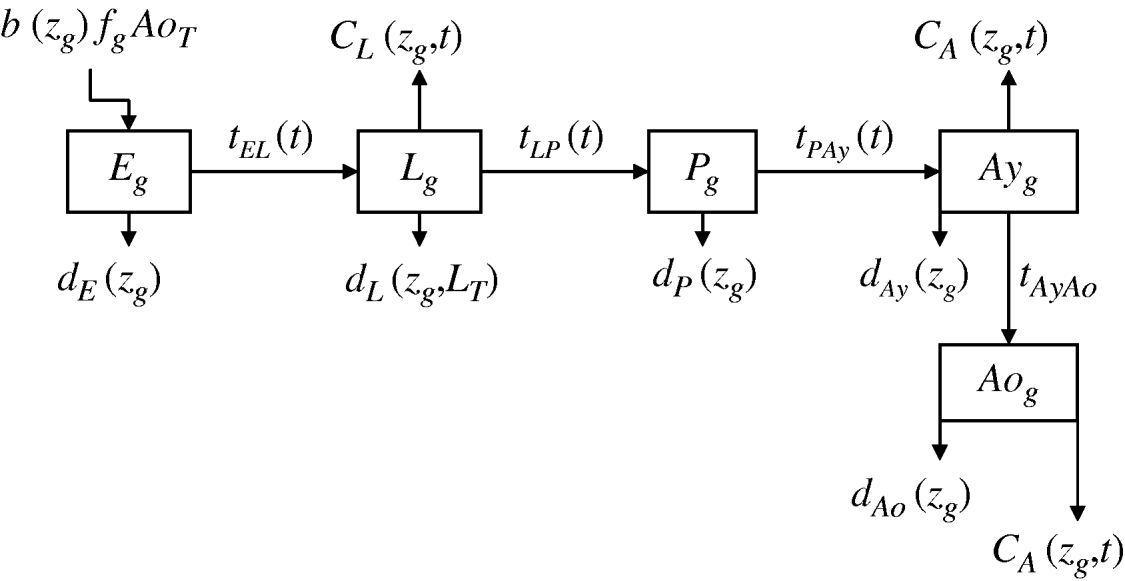
We developed a mathematical model of mosquito seasonal population dynamics, incorporating a population genetics framework describing insecticide resistance evolution (Fig. 1). The model is parameterized using specific A. aegypti ecological and biological literature (Table 1).
Schematic representation of Aedes aegypti population model. (For compartment and parameter definitions see Table 1.)
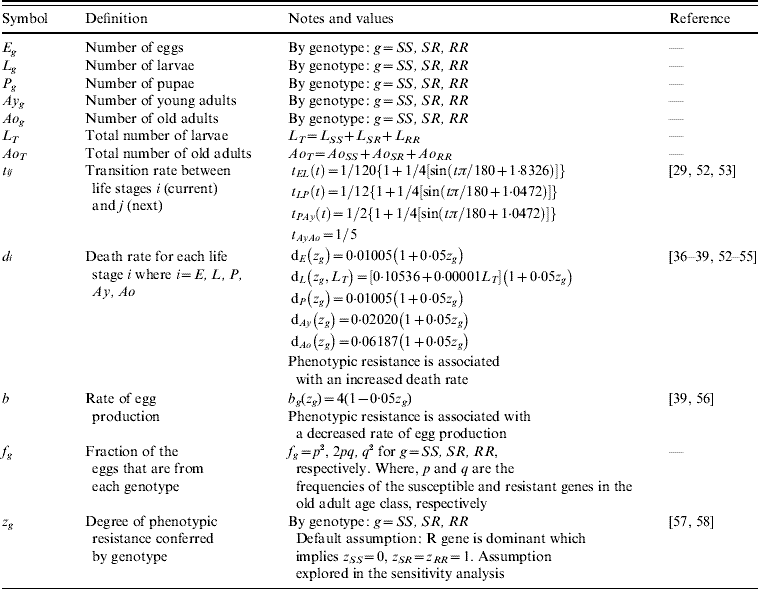
Model compartments, parameters symbols and definitions, notes and references
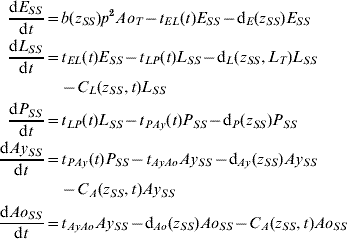
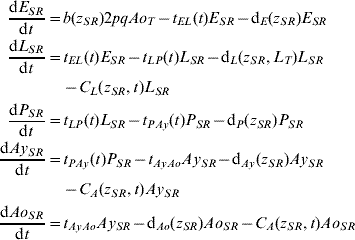
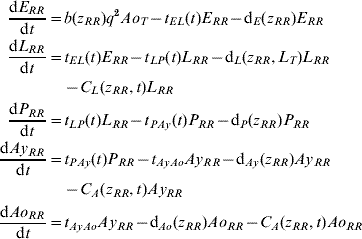
Five compartments are defined for each genotype (g). The first three mosquito life-stages: egg, larva, and pupa, are denoted by E g, L g, and P g. The adult life-stage is subdivided into two compartments: Ay g composed of young mosquitoes (aged 1–5 days, that do not yet lay eggs [Reference Scott26]) and Ao g composed of older mosquitoes (aged >5 days, that lay eggs). The three genotypes, g, for an insecticide resistance model that assumes a single locus with two alleles are SS, SR and RR, for susceptible homozygote, heterozygote, and resistant homozygote, respectively. Combining the five compartments and three genotypes gives 15 different state variables for the mosquito population. Changes to these 15 state variables are modelled in continuous time using a system of differential equations (see Appendix).
Based on previous observations [Reference Chevillon27, Reference Daborn28], we assumed that resistance to insecticide is conferred by a single locus with two alleles: an initially common allele that occurs at a frequency p and confers susceptibility to the insecticide, and an allele that occurs at the complementary frequency (q=1−p) and confers resistance. We set that offspring genotypes are in accordance with Hardy–Weinberg ratios based on the frequencies of p and q in Ao T (the total number old adults). Thus, f g=p 2, 2pq and q 2 when g=SS, SR, and RR, respectively. A basic mutation rate of 0·0008 is assumed to maintain the resistant gene at a frequency of 1% in the absence of intervention.
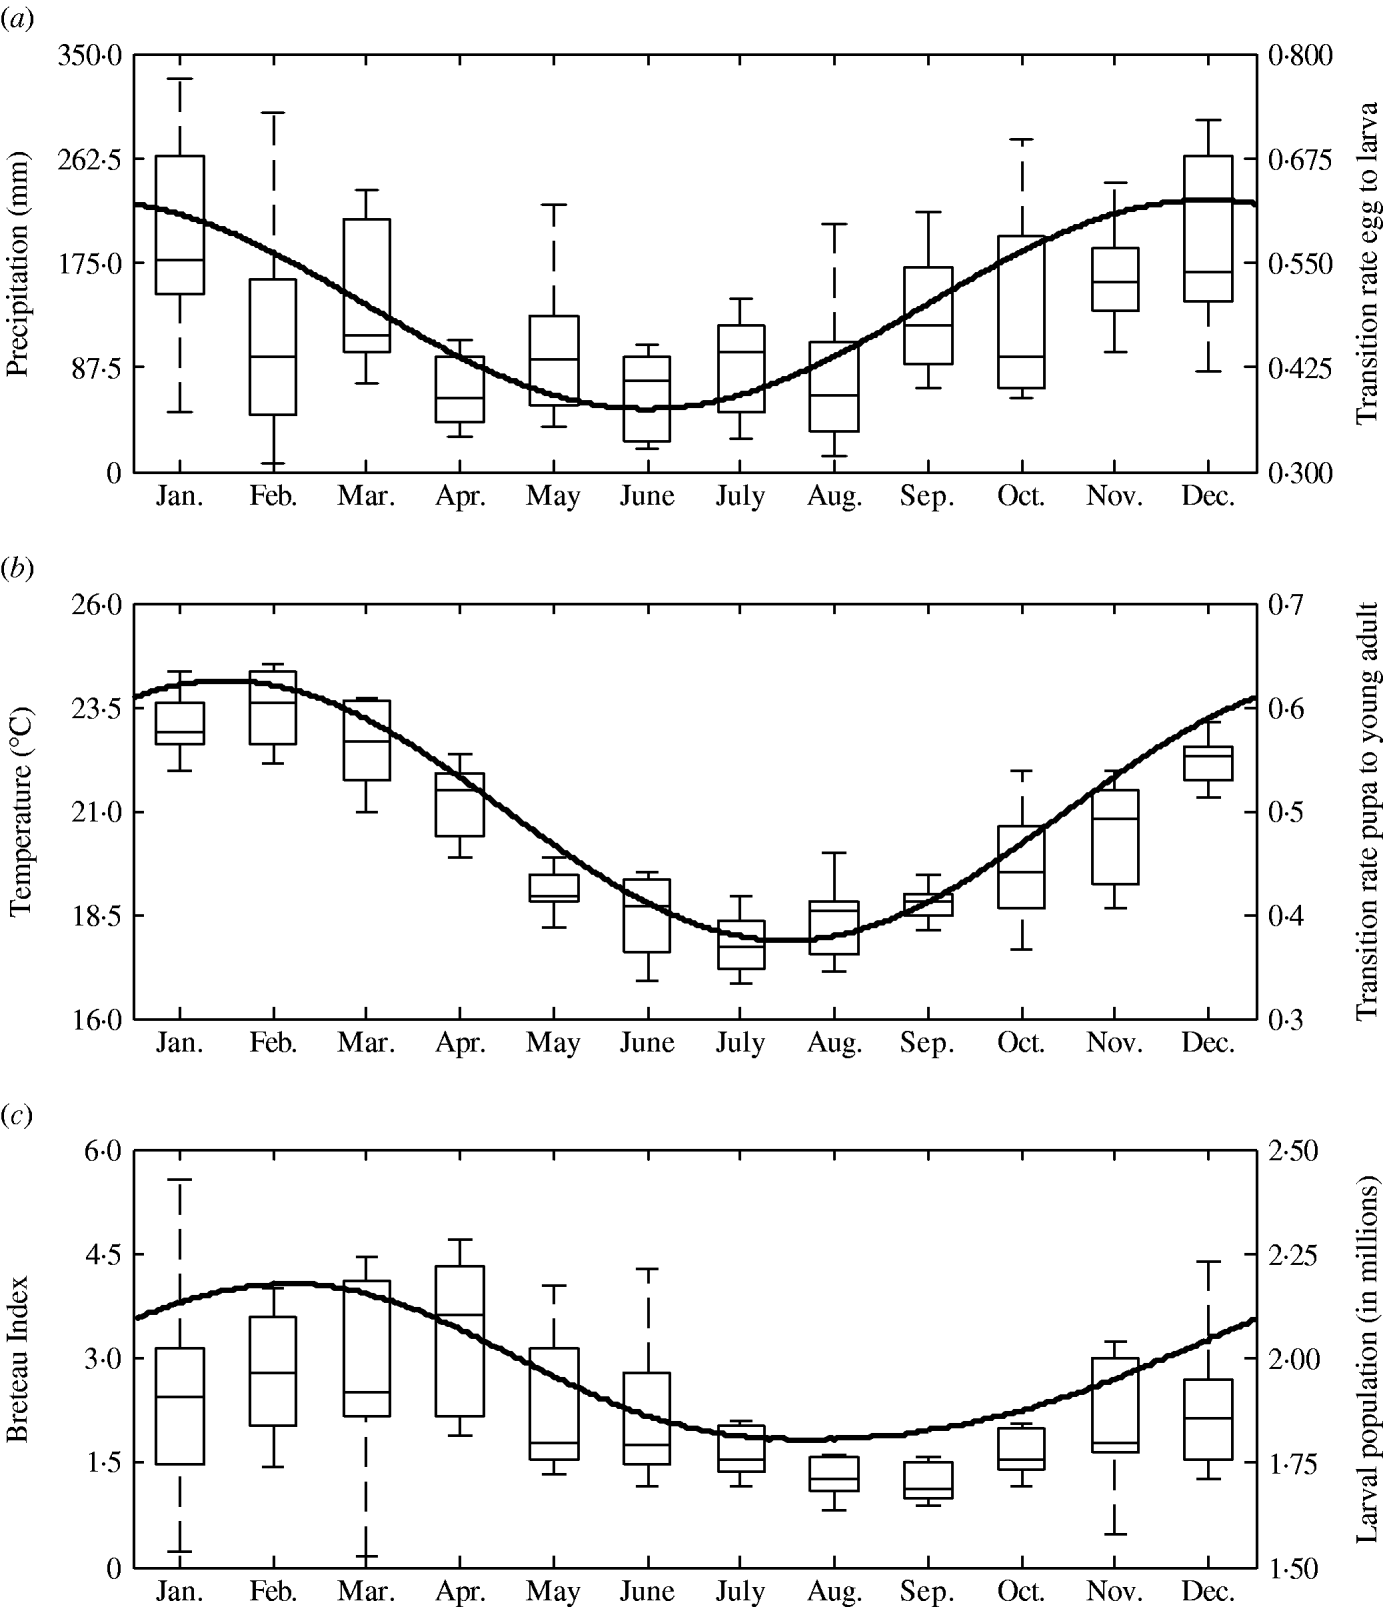
The transition rates between life-stages are given by t ij (where i is the current life-stage and j is the next life-stage). Marked seasonality is present in Rio de Janeiro's A. aegypti population: higher mosquito density occurs during the hot-wet season [Reference Honorio and Lourenco-de-Oliveira29, Reference Maciel-de-Freitas30], which is also the period when dengue transmission occurs with greatest intensity [Reference Luz31–Reference Camara33]. Consistent with the larval abundance time-series for Rio de Janeiro from 1997 to 2003, we incorporated seasonality of mosquito abundance (Fig. 2). Seasonality is built-in through transition rates between model compartments [Reference Lord34]. Weather data from Rio de Janeiro is used to parameterize the temporal pattern of the transition rates, which were mathematically defined as sinusoidal functions (Table 1). The transition rate from egg to larva, t EL, follows the pattern for precipitation, because eggs hatch in response to water (Fig. 2). The transition rates from larva to pupa and pupa to young adult, t LP and t Pay, respectively, are functions of temperature, since temperature accelerates A. aegypti's development rate (Fig. 2) [Reference Scott35]. The transition rate from young to old adult, t AyAo, is assumed to be constant (Table 1).
Left axis: box plot by month of (a) precipitation, (b) mean temperature, and (c) Breteau larval infestation index. Data for Rio de Janeiro, Brazil, from 1997 to 2003. Right axis: annual pattern of the transition rates from (a) egg to larva, (b) pupa to young adults, and (c) larval mosquito population as given by the model.
The death rate of each mosquito compartment, d i (where i=E, L, P, Ay, Ao), is the background mortality from natural sources. Field studies have shown that the larval development of A. aegypti is density-dependent [Reference Barrera, Amador and Clark36, Reference Southwood37]. Density-dependence in the larval stage is incorporated in the function of the background larval death rate, d L (Table 1). Recently, cohort studies of mosquito populations showed that adult death is age-dependent [Reference Styer38]. Thus, for the adult life-stage death rates vary by age group. The rate of production of viable eggs per adult is given by b [Reference Styer39].
The degree to which phenotypic resistance is conferred by each genotype is represented by z g (g=SS, SR, and RR, respectively). Our default assumption is that resistance is dominant. However, some resistant alleles may confer partial resistance to insecticides [Reference Rodriguez40]. We also assumed that resistance has a cost, that is, phenotypic resistance is associated with increased death rate and decreased rate of egg production [Reference Chevillon27, Reference Rosenheim and Tabashnik41]. Thus, the parameters d i and b are functions of z g. The default assumption is a 5% increase in the death rate and a 5% decrease in the rate of egg production [Reference Rosenheim and Tabashnik41]. Conversely, there may be a negligible cost in resistance to insecticides [Reference McCart, Buckling and ffrench-Constant42]. We evaluated the impact of our assumptions on the genetic characteristics of the resistance allele. In the Results section, we report on the alternative assumptions of additive resistance, and of no fitness cost.
Insecticide-based interventions
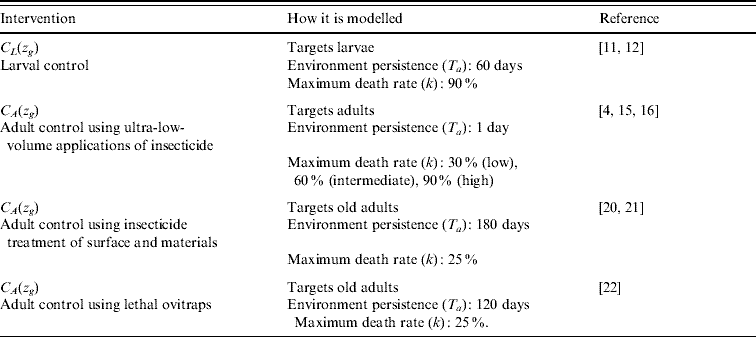
We evaluated four forms of vector control: (1) larval control [Reference Pontes12, Reference Lima, Melo and Valle43], (2) adult control using ultra-low-volume insecticide applications [Reference Koenraadt15, Reference Perich16], (3) adult control using insecticide treatment of surfaces and materials [Reference Kroeger20, Reference Ritchie21], and (4) adult control using lethal ovitraps [Reference Perich22] (Table 2). Interventions are simulated by applying an additional death rate to the affected compartment. The temporal decay in efficiency of an insecticide application (i.e. environmental persistence) is modelled by defining these additional death rates as functions of time (see Appendix for functions). Larval control poses a 90% risk of death on day 1 which decays to 0% over a 60-day period. Thus, evaluated interventions ranged from 1–6 larval applications annually. Adult control using ultra-low-volume insecticide applications poses a varying maximum risk of death of 30% (low efficacy), 60% (intermediate efficacy), and 90% (high efficacy) that occurs immediately after insecticide application and decays to 0% within the same day [Reference Gratz4, Reference Dorta14–Reference Perich16]. Adult control using ultra-low-volume insecticide applications are carried out during the dengue season: evaluated interventions ranged from 1–12 applications per dengue season. Adult control using insecticide treatment of surfaces and materials persists in the environment for 180 days, allowing for two timetables: year-long continuous application or one application at the beginning of the dengue season. Adult control using lethal ovitraps persists in the environment for 120 days, and therefore either one, two, or three applications annually were evaluated.
Description of the insecticide-based interventions which act on phenotypically susceptible mosquitoes
Rio de Janeiro's A. aegypti population exhibits seasonal peaking during the hot-wet season [Reference Honorio and Lourenco-de-Oliveira29, Reference Maciel-de-Freitas30], concurrently with dengue cases [Reference Luz31–Reference Camara33]. Hence, to achieve the greatest impact on disease transmission, an intervention needs to reduce mosquito abundance during the hot-wet season, which we refer to as the dengue season. Mosquito abundance during the dengue season changes when interventions are applied. We measured the effectiveness of an intervention as the relative mosquito abundance during the dengue season compared to mosquito abundance had insecticide not been applied. Specifically, we are measuring the effectiveness as the impact on the disease vector, that is, on the adult mosquito population. For each intervention, the impact was measured for the optimal initiation time. Thus, we first determined the initiation time producing the greatest reduction in mosquito abundance, and then used the specific time schema when applying the intervention in each year of the 10-year period. Moreover, we calculated the time needed for the frequency of the resistance gene to reach 30% in the population.
Sensitivity analyses
To evaluate which parameters most strongly affected our results, we performed univariate and multivariate sensitivity analyses. Univariate sensitivity analysis consisted of increasing the value of each parameter by 1% from its baseline value (as given in Table 1), and then measuring the percent change in adult abundance during the dengue season. Multivariate sensitivity analysis consisted of performing multivariate linear regression. Parameters were assumed to be uniformly distributed with lower and upper bounds given by a 25% decrease and increase, respectively, from their baseline values (as given in Table 1). We randomly sampled 1000 values for each parameter from their uniform distributions and ran the model with each set of parameters, thus obtaining 1000 estimates of adult abundance per dengue season. Subsequently, multivariate linear regression was used to estimate which parameters significantly influenced adult abundance assuming a threshold level of significance of 0·05.
RESULTS
Larval control
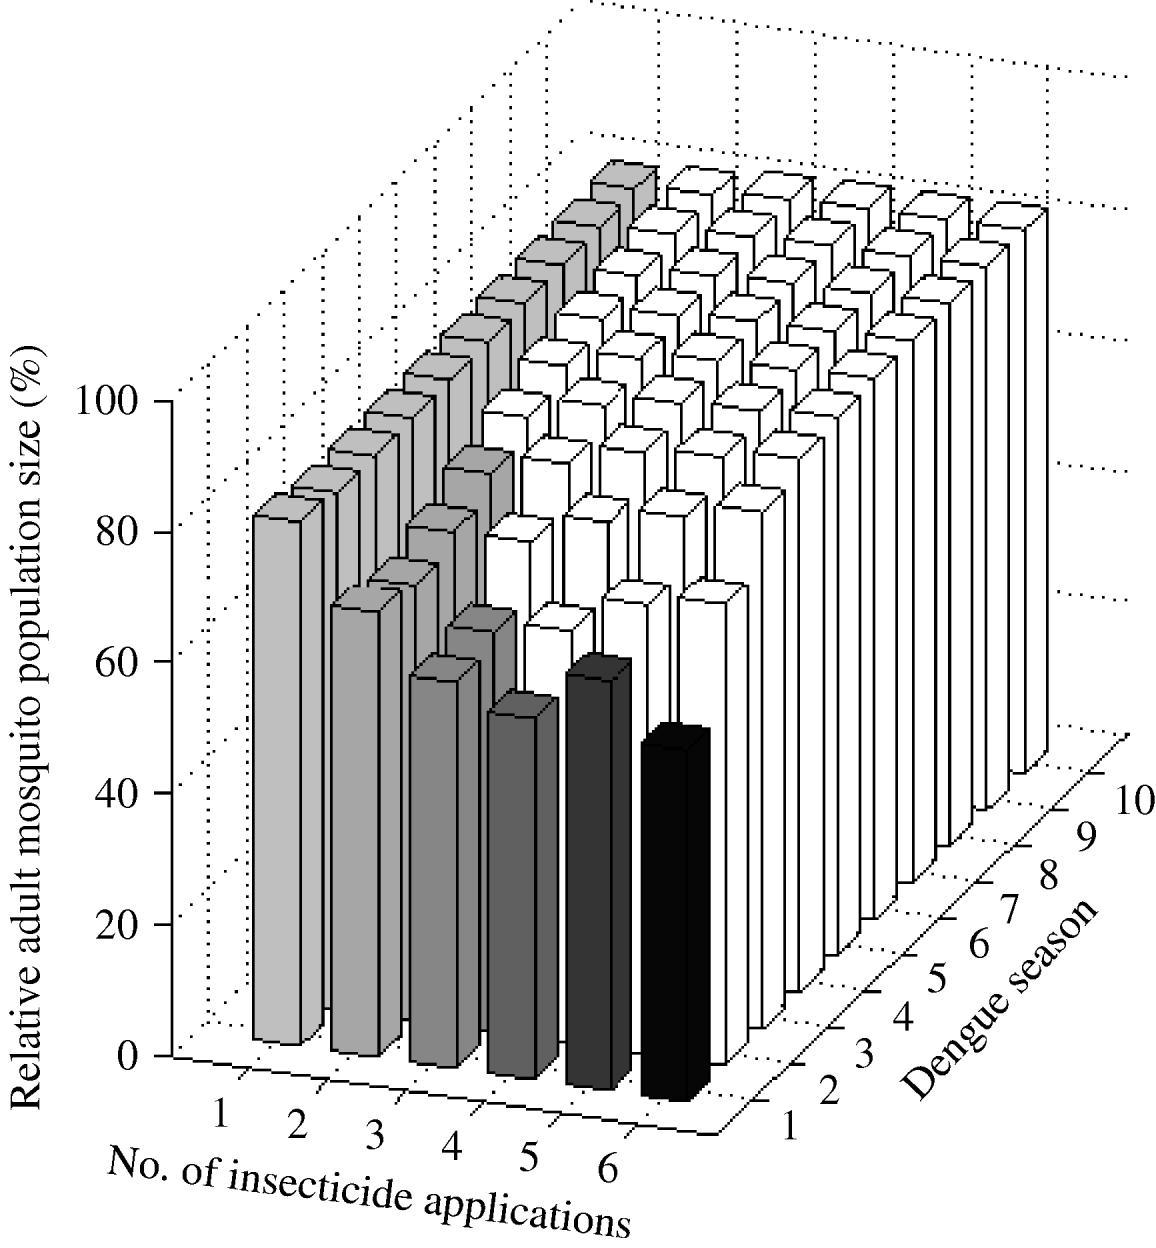
One larval control insecticide application annually achieved a sustained 20% reduction of A. aegypti abundance (Fig. 3). The frequency of the resistance gene did not surpass 30% during the 10-year period. Two applications annually reduced mosquito abundance by 32%. However, after the second year of intervention initiation, mosquito abundance gradually increases due to the evolution of resistance. The frequency of the resistance gene reached 30% in the fifth year. In the first dengue season, with either three or four applications annually, mosquito abundance is reduced by 41% and 45%, respectively. Counterintuitively, five applications annually reduce mosquito abundance by only 38% in the first dengue season. That is, for the 10-year period, mosquito abundance per dengue season is actually greater with five applications annually than with four applications annually. Five applications annually is a ‘dominated strategy’ [Reference Hunink44], that is, a greater benefit (smaller relative mosquito abundance) can be obtained with less effort (four instead of five applications annually). With six applications annually, mosquito abundance in the first dengue season is smaller than that with four applications, but at the cost of two additional applications annually. Although different reductions are achieved with four, five, or six applications annually, the frequency of the resistance gene always reaches 30% by the second dengue season.
Impact of larval control expressed as the (percent) relative adult mosquito population size compared to what it would have been had no insecticide been applied. Interventions vary by number of applications per year. Results are given for each dengue season for 10 years following intervention initiation. White bars indicate dengue seasons in which the frequency of the resistance gene is >30%.
Adult control using ultra-low-volume insecticide applications
Low efficacy ultra-low-volume insecticide applications reduce mosquito abundance by 9% to 53% in the first dengue season, depending on the number of applications during that season (Fig. 4). With fewer than seven applications, the frequency of the resistance gene does not surpass 30% within the 10-year period. Reduction in mosquito abundance beyond 50% in any given dengue season is only achieved with ten or more applications per season. For intermediate efficacy, one and 12 applications per season reduce mosquito abundance by 16% and 70%, respectively. Similarly to larval control, adult control using ultra-low-volume insecticide applications also produces dominated strategies. Eight applications per season is a ‘dominated strategy’ because greater reduction in mosquito abundance is achieved with seven applications. As would be expected, resistance evolves faster for intermediate efficacy compared to low efficacy. For high efficacy, 12 applications per dengue season reduce mosquito abundance by 82%. However, resistance evolves much faster. With eight or more applications, the frequency of the resistance gene reaches 30% in the first dengue season.
Impact of adult control using ultra-low-volume insecticide applications expressed as the (percent) relative adult mosquito population size compared to what it would have been had no insecticide been applied. Maximum efficacy of insecticide is 30% (low), 60% (intermediate) and 90% (high). Interventions vary by number of applications per dengue season. Results are given for each dengue season for 10 years following intervention initiation. White bars indicate dengue seasons in which the frequency of the resistance gene is >30%.

Adult control using insecticide treatment of surfaces and materials
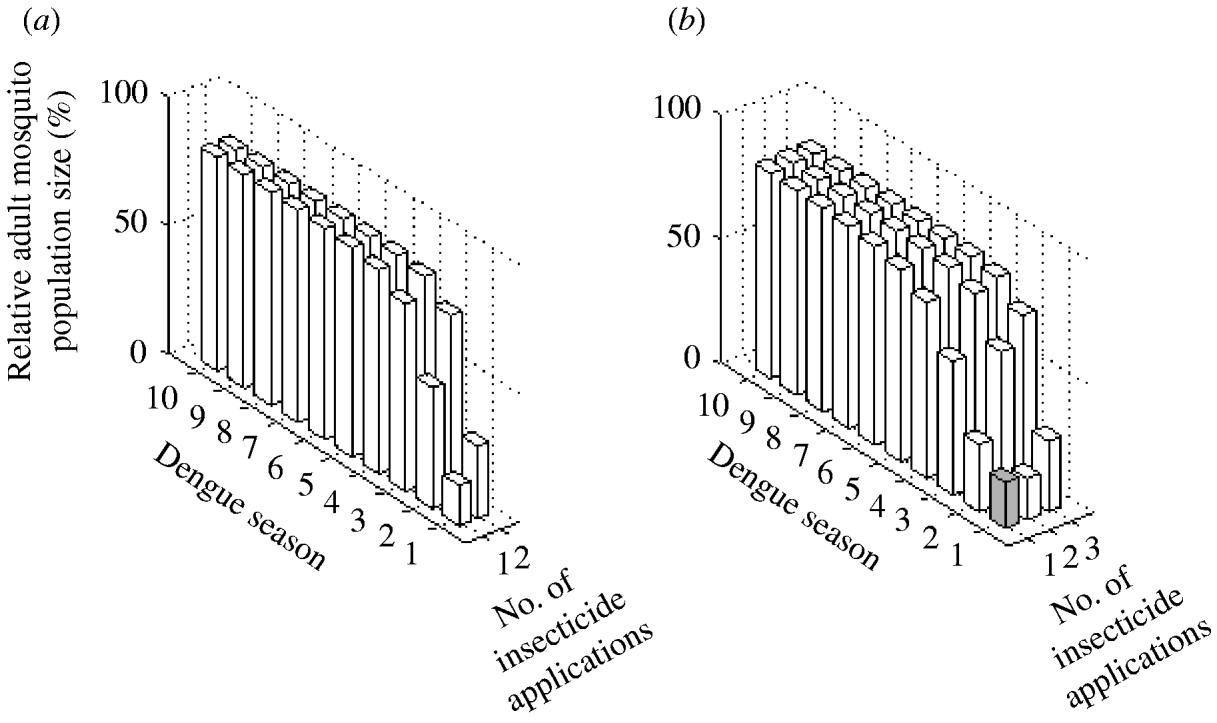
The two possible interventions using insecticide treatment of surfaces and materials have a significant impact on A. aegypti abundance (Fig. 5). Reduction in mosquito abundance of 84% and 72% in the first dengue season are achieved with one and two applications annually, respectively. However, for both interventions, environmental persistence causes resistance to evolve within the first dengue season. Consequently, mosquito abundance increases by the second dengue season.
Impact of adult control using (a) insecticide treatment of surfaces and materials and (b) lethal ovitraps expressed as the (percent) relative adult mosquito population size compared to what it would have been had no insecticide been applied. Interventions vary by number of applications per year. Results are given for each dengue season for 10 years following intervention initiation. White bars indicate dengue seasons in which the frequency of the resistance gene is >30%.
Adult control using lethal ovitraps
Adult control using lethal ovitraps generates very similar results to adult control using insecticide treatment of surfaces and materials (Fig. 5). With one application annually, mosquito abundance is reduced by 82% in the first dengue season. In the following dengue season, the frequency of the resistance gene reaches 30% and mosquito abundance reduction is 73%. For the subsequent years, mosquito abundance increases steadily. With two applications annually, a stronger impact occurs in the first dengue season, which leads to less reduction in mosquito abundance in subsequent years, because the resistance gene surpasses a frequency of 30% within the first dengue season.
Optimization of insecticide-based intervention
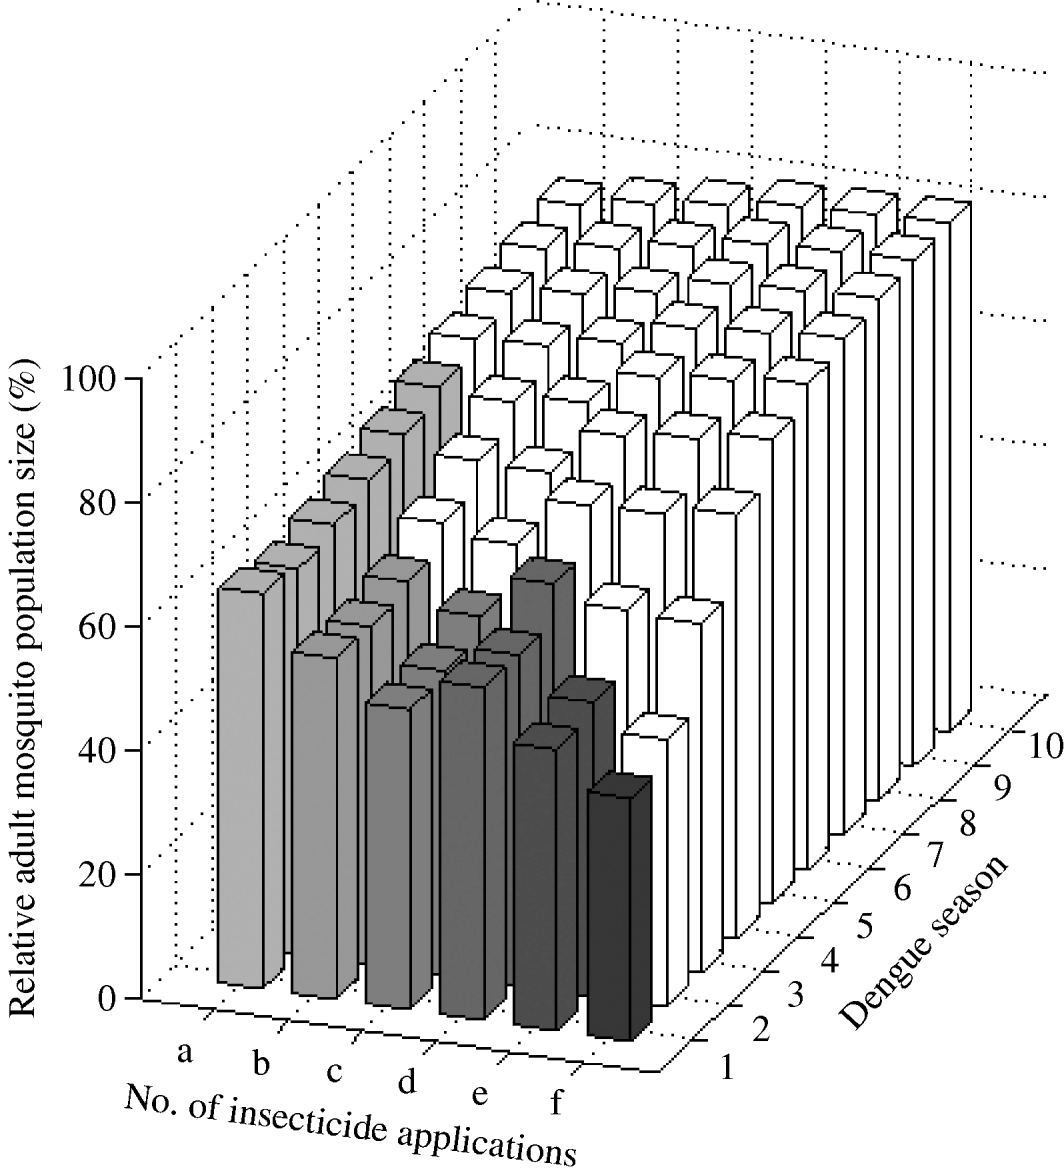
We found that a combined targeting of larvae and adults restricted in time to the dengue season is optimal (Fig. 6). One ultra-low-volume insecticide application plus one larval application reduces mosquito abundance by ~34% for six dengue seasons. That is, adding one adult ultra-low-volume insecticide application reduced mosquito abundance by 20% in the first dengue season (mosquito abundance is 80% with one larval application and 64% when one adult application is added). Adding two and three adult ultra-low-volume insecticide applications to one larval application further reduces mosquito abundance by 45% and 52% in the first dengue season, respectively. For these interventions, the frequency of the resistance gene increases beyond 30% by the fourth dengue season. Adding one ultra-low-volume insecticide application to two larval applications reduces mosquito abundance by 46% in the first dengue season. Further reductions are possible with more ultra-low-volume insecticide applications at the cost of more rapid evolution of resistance.
Impact of combined larval and adult insecticide treatment expressed as the (percent) relative adult mosquito population size compared to what it would have been had no insecticide been applied. Strategies (a), (b), and (c) are composed of one larval application initiated at the beginning of the dengue season plus one, two, and three ultra-low-volume insecticide applications during the dengue season, respectively. Strategies (d), (e), and (f) are composed of two consecutive larval applications initiated at the beginning of the dengue season plus one, two, and three ultra-low-volume insecticide applications during the dengue season, respectively. Results are given for each dengue season for 10 years following intervention initiation. White bars indicate dengue seasons in which the frequency of the resistance gene is >30%.
Genetic characteristics of the resistance allele
One baseline assumption was genetic dominance of the resistance allele. If we assume that resistance is additive [Reference Rodriguez40] the longevity of insecticide utility increases. For example, the intervention with two larval and three ultra-low-volume insecticide applications causes resistance to evolve only in the sixth dengue season (compared to the second if resistance is dominant, Fig. 6). Thus, a reduction in mosquito abundance of ~65% is sustained until the sixth dengue season. Another baseline assumption was resistance cost in terms of increased death rate and decreased rate of egg production. If we assume there is no fitness cost associated with phenotypically resistant mosquitoes [Reference McCart, Buckling and ffrench-Constant42], then the frequency of the resistance gene rises faster, and mosquito abundance attains pre-intervention levels as the population becomes fully resistant.
Sensitivity analyses
The parameter that most strongly influenced mosquito abundance was the transition rate from larvae to pupae (Fig. 7). Increasing the value of the transition rate from larvae to pupae by 1% caused a 2% increase in mosquito abundance. Interestingly, this finding is in agreement with proposals for estimating adult population size by measuring pupae abundance [Reference Focks and Chadee45]. Pupae abundance precisely correlates with adult abundance because the death rate of the pupal life- stage is minimal [Reference Focks46]. Accordingly, in our model, the transition rate from larvae to pupae is the most important parameter influencing adult abundance. The second most important parameter is the death rate of old adults (Fig. 7). As expected, an increase in the death rate of 1% decreases adult abundance by almost 2%. The rate of egg production is the third most important parameter causing adult abundance to increase by ~1%. The strength of density dependence is also an important model parameter: a 1% increase in the strength of density dependence causes a 1% decrease in adult abundance.
Tornado plot showing the (percent) change in the adult mosquito population size as a result of a 1% change in the value of the parameter of the model.
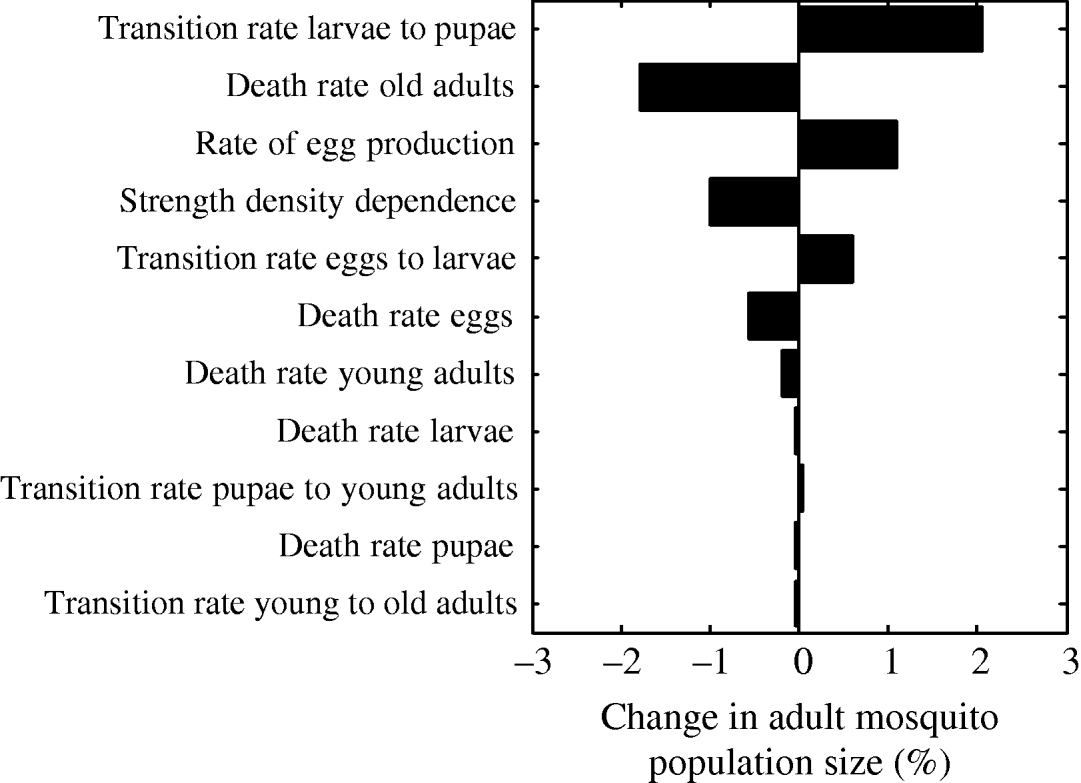
Adult abundance was only slightly sensitive to the death rate induced by insecticides (as given in Table 2). An increase of 1% in the maximum efficacy of an insecticide reduced adult abundance by <0·5% (data not shown). When incorporating insecticide-based interventions, we also explored the impact of the parameters: mutation rate and fitness cost. However, these parameters show very little impact on adult abundance: an increase of 1% from their baseline values causes a minor reduction (<0·1%) in adult abundance.
The results from the multivariate sensitivity analysis were similar to those obtained with the univariate sensitivity analysis. The parameters found to significantly influence adult abundance in the multivariate linear regression model were: transition rate from larvae to pupae, death rate of old adults, strength of density dependence, rate of egg production, death rate of eggs, and transition rate from eggs to larvae.
DISCUSSION
We modelled seasonal mosquito population dynamics and evaluated the effectiveness of insecticide-based interventions on reducing adult mosquito abundance and on driving resistance evolution. We revealed thresholds in the frequency of insecticide applications beyond which more applications do not further decrease mosquito abundance. Additionally, we also revealed a non-monotonous relationship between the frequency of insecticide applications and the consequent reduction of mosquito abundance when more applications actually induced less reduction than fewer applications. In such case, more frequent insecticide applications constitute suboptimal allocation of resources. Specifically, year-long continuous larval control offered no significant benefits to justify its implementation. However, year-long continuous larval control policies have been adopted in many settings where dengue transmission occurs [Reference Bangs19, Reference Donalisio and Glasser23].
We revealed that continuous larval control (i.e. six applications annually) only slightly reduced adult mosquito abundance beyond the effect of four applications annually. Our results are supported by field trials of insecticide-based larval control in Bangkok, Thailand [Reference Bang and Pant47]. The field trials showed that the best of the four experimental interventions considered was two insecticide applications annually: one just before the rainy season, and a second 2 months after [Reference Bang and Pant47]. We showed that increasing the number of larval applications beyond four is actually detrimental because it drives resistance evolution and thus decreases the useful lifetime of the insecticide.
Adult control using ultra-low-volume insecticide applications were effective in reducing mosquito abundance. However, many applications may be needed to cause a significant reduction of the adult mosquito population. This result has also been observed in field trials carried out in Thailand, when it was found that if ultra-low-volume insecticide applications are not repeated several times, mosquito abundance reduction is minimal [Reference Gratz4, Reference Gratz48]. Our model also showed that when using ultra-low-volume insecticide applications there are thresholds in the number of applications beyond which more applications serve only to waste resources and accelerate resistance evolution.
For adult control, insecticide treatment of materials and surfaces and use of lethal ovitraps selectively eliminate the disease vector and exhibit longer environmental persistence [Reference Kroeger20–Reference Perich22]. We found that mosquito abundance in the first dengue season is lowest with these two interventions. However, these interventions produced the fastest resistance evolution. Field trials conducted thus far confirm an effective reduction in the A. aegypti population [Reference Kroeger20–Reference Perich22] with these adult control measures. However, to our knowledge, no study has assessed their impact on resistance evolution.
Two studies have estimated the impact of vector control on dengue cases using mathematical models [Reference Burattini24, Reference Newton and Reiter25]. The studies differ in the resulting impact of interventions on dengue cases since the expected impact can only be seen if seasonality is introduced in the model [Reference Burattini24]. We incorporated seasonality and showed that repeated larval and adult control can effectively reduce mosquito abundance. Further, we showed that year-long continuous larval control is not optimal because it drives resistance evolution. By considering both the impact of interventions on mosquito abundance and on the evolutionary trajectory of resistance, we found that the optimal intervention is combined larval and adult control restricted in time to the duration of the dengue season.
The combined targeting of larvae and adult mosquitoes was more effective than either intervention on its own. One larval application at the beginning of the dengue season plus three ultra-low-volume insecticide applications during the dengue season reduced A. aegypti abundance by half. Since the intervention was not continuous, the frequency of the resistance gene remained low for three dengue seasons. The potentiated effect of the combined intervention is plausible. Ultra-low-volume insecticide applications have a short-lived impact on mosquito abundance [Reference Bang, Gratz and Pant49]. However, when combined with larval control, mosquito abundance reduction can be sustained [Reference Bang, Gratz and Pant49].
A recent analysis found container-specific, insecticide-based larval control performed twice a year to be cost-effective in reducing dengue burden in urban areas of Cambodia [Reference Suaya50]. There was no statistical difference in the effectiveness obtained in areas with two rounds of larval control compared to areas with one round of larval control [Reference Suaya50]. This empirical study supports our finding that more applications do not necessarily increase effectiveness and that dengue control performed during the dengue season can be a cost-effective strategy.
The comparison of A. aegypti's resistance profile in regions of Brazil exposed to different insecticide schemes also supports limiting the use of insecticide-based vector control [Reference Macoris7, Reference Cunha8]. Mosquito populations from the Northeast, where organophosphates were used for larval and adult control, show high levels of resistance to this insecticide [Reference Macoris7]. Vector control in São Paulo, conversely, used organophosphates and pyrethroids on larvae and adult mosquitoes, respectively. The combined strategy generated higher levels of resistance to pyrethroids but lower resistance to organophosphates (compared to the Northeast populations) [Reference Macoris7]. In Rio de Janeiro, organophosphates were used intensively for larval and adult control from 1986 [Reference Braga9, Reference Lima10]. However, insecticide resistance to organophosphates hampered control efforts and, in 1999 pyrethroids replaced organophosphates for adult control [Reference Montella6, Reference Braga9, Reference Lima10]. Resistance to pyrethroids was detected only 4 years later, in 2003 [Reference Cunha8]. Currently, vector control policies in Brazil need to consider the presence of insecticide resistance [Reference Macoris7, Reference Donalisio and Glasser23].
Continuous monitoring of resistance and ongoing policy changes are needed for adequate control of A. aegypti and hence dengue transmission. Our results support restricting insecticide application to the dengue season, thereby reducing selection for resistance and increasing the lifetime of an insecticide. Our model allows analysis of the trade-off between reducing mosquito abundance and driving resistance evolution. We identified thresholds in the frequency of applications that should not be exceeded. Taking into account these thresholds in the development of control strategies should optimize resource allocation, reduce dengue transmission and minimize resistance evolution. Our results are likely to be applicable to the control of other disease vectors through the use of insecticides.
APPENDIX
The mathematical model of A. aegypti population dynamics is given by the system of differential equations below. The five compartments (eggs, larvae, pupae, young and old adults) and three genotypes (susceptible homozygote, heterozygote, and resistant homozygote) combined make 15 different state variables which are modelled in continuous time. The system was numerically integrated in Matlab® [51]. The initial conditions were 40 million mosquitoes: 97·9% eggs, 0·6% larvae, 0·1% pupae, 0·7% young adults, and 0·7% old adults. (For symbols and parameter definitions see Tables 1 and 2.)
The functions defining larval and adult control are equivalent. Mathematically, the insecticide function is given by:

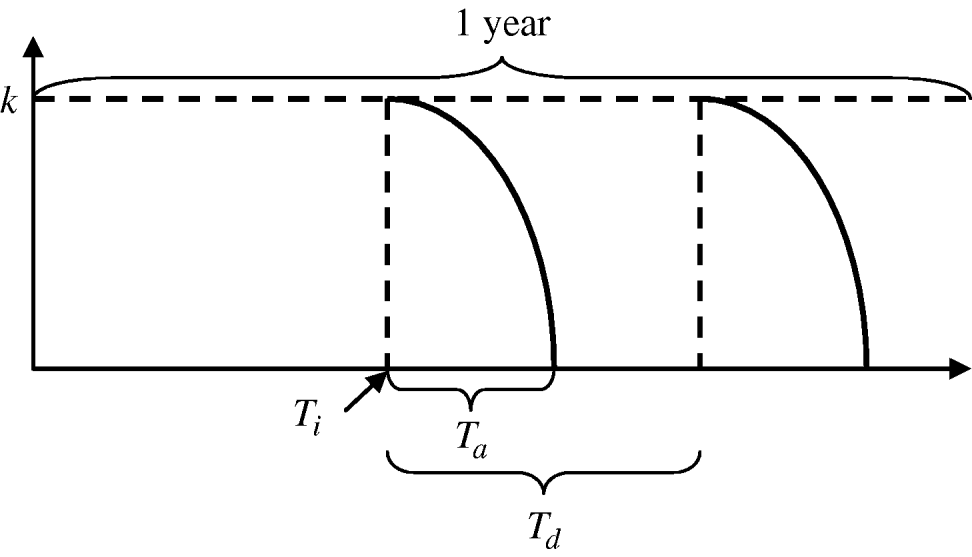
where k is the maximum efficacy of the insecticide, T n is the time since the start of an application, and T a is the environmental persistence, i.e. time period during which the insecticide is active. For each year, insecticide initiation starts at day T i and is performed every T d days, for a maximum of N applications per period of time. For larval control and adult control using insecticide treatment of surfaces and materials or lethal ovitraps, T a=T d since there is no interval between applications. Each type of insecticide has a different maximum efficacy (k) and environmental persistence (T a) as given in Table 2. A schematic representation of the vector control function is given in Figure A1.
Vector control function.
To determine the optimal starting time of each intervention we ran the model starting larval control at all days (T i) of the previous year and calculated the relative adult population size in the first dengue season (days 0–120 for 1 January–30 April). The starting day (T i) producing the smallest relative adult population size was then defined as the optimal initiation time. For adult control using ultra-low-volume applications of insecticide, possible starting days (T i) were the days within the dengue season. The interval between applications varied from 1 to 21 days (T d−T a). The best combination of starting time and interval between applications was then defined as the optimal starting time.
ACKNOWLEDGEMENTS
We thank Thomas Scott for interesting discussions on insecticide-based interventions, and Kristina Talbert-Slagle and Dave Thomas for editing revision. P. M. Luz was funded by CAPES (Brazilian Federal Agency for Post-graduate Education), Fulbright, and the Garfield Weston Foundation. C. T. Codeço, D. Valle, and P. M. Luz were partially funded by FIOCRUZ (PDTSP-Dengue). J. Medlock was funded by the National Science Foundation, grant no. SBE-0624117. C. J. Struchiner was partially funded by CNPq and FAPERJ. A. P. Galvani gratefully acknowledges funding from Notsew Orm Sands Foundation, Garfield Weston Foundation and MacMillan award.
DECLARATION OF INTEREST
None.



