


1. Introduction
1.1. Cognitive misalignment during value co-creation in service-dominant logic
As the paradigm shifts from product-centric to service-centric, value is redefined not as inherent in goods, but as value co-creation realized through dialogue and interaction among active actors (Reference Vargo and LuschVargo & Lusch, 2008). This framework extends beyond commercial contexts to social design and community building. In these settings, service design acts as a tool for social integration, enabling actors to cooperate and produce commonly recognized value regardless of profit orientation (Reference Soto Hormazábal, Mollenhauer, Miettinen and SarantouSoto Hormazábal et al., 2021). While Service-Dominant Logic (SDL) posits that co-creation integrates knowledge among actors from heterogeneous domains, the specific processes involved remain a subject for further inquiry (Reference Vargo, Maglio and AkakaVargo et al., 2008). Reference Grönroos and VoimaGrönroos and Voima (2013) distinguished between value creation by beneficiaries and joint value co-creation, emphasizing that the latter requires a space for direct interaction. However, actors with different backgrounds often interpret the same events differently(Reference Muller, Druin and JackoMuller & Druin, 2012). Furthermore, since shared knowledge includes experiences and sensations that are difficult to articulate (Reference SandersSanders, 2000), the dialogue process involves imperfect communication. Consequently, the process of value co-creation inevitably progresses while harboring cognitive misalignments between actors.
1.2. Shared contexts for dynamic service design process: ba
Service design encompasses the design of comprehensive customer experiences, requiring the creation of processes and spaces where actors share experiences and collaboratively create new ones. Nonaka distinguishes dynamic knowledge from static information in his knowledge creation theory, defining knowledge as being generated through human action and social interaction, dependent on specific contexts such as time and spaces. Knowledge creation is interpreted as a cyclical process (the SECI model) where tacit knowledge is externalized into explicit knowledge through dialogue and shared experience, which then recirculates into new tacit knowledge. Reference Nonaka and ToyamaNonaka and Toyama (2003) defined the shared contexts for this dynamic process as ba.
In this study, the collaborative process of services is viewed as a continuous sequence of context sharing through ba, where the trajectory of context change via interaction corresponds to the actor’s experience. Therefore, service design can be essentially described as the design of ba and context sharing processes mediated by it.
This study models ba, dynamic context sharing process during co-creation as an interaction process that inherently includes cognitive misalignments. We conducted a multi-agent simulation of autonomous actors to visualize the cognition and behavior regarding ba. By observing the resulting dynamics, we examined how the participants’ cognitive traits regarding the ba influence the transition of context sharing and the sustainability of co-creation.
2. Research methods
2.1. Overview
We developed a collaborative process model based on individual cognition and behavior. To empirically replicate the value co-creation process in services, we designed a collaborative task and formalized its conditions into a mathematical model for multi-agent simulation. Results from this collaborative task experiments provided reference values for model parameters. In the simulation, we varied parameter values and combinations in the mathematical model and compared results to confirm the effects of each characteristic on co-creation sustainability and development. The cognition and behavior process relating to the ba can be summarized as a three-step cycle for each individual actor, as shown in Figure 1: (1) perceived expressions of oneself and others, which involves imperfect communication arising from differences in knowledge backgrounds; (2) inferred ba that should be shared at that time and place from perceived expressions; and (3) selected expressions in accordance with the inferred ba. These three steps constitute a repetitive process.
Model of collaborative participants’ cognitive and behavioral processes

Figure 1 Long description
A diagram of the cognitive and behavioral processes of collaborative participants in value co-creation. Panel A: The left side of the diagram shows a flowchart with labeled steps. The process starts with perceived expression, followed by inferred ba, and then selected expression. Arrows indicate the flow between these steps. The diagram includes a central box representing the interaction space where expressions are perceived and selected. Panel B: The right side of the diagram shows a vertical flowchart with three main components: perceived expressions at the top, inferred ba in the middle, and selected expressions according to ba at the bottom. Arrows indicate the flow from perceived expressions to inferred ba and then to selected expressions according to ba.
Step (2), inferred ba that should be shared at that time and place from perceived expressions, was modelled mathematically using a weighted Bayesian inference. Bayesian inference is a statistical method of estimating probability distributions that cause observed results. Assuming that actors perceived ba as dynamically changing over time, we added weights to the observed data at the moment of inference so that older data effects would gradually decrease when inferring current context. Furthermore, the degree of expression effect attenuation is assumed to be a characteristic of the context assumed by the actors themselves, with the attenuation degree set individually for each actor. In addition to differences in expressions perceived in step (1), weighting differences during inference in step (2) cause actors to have different cognitions, leading them to choose actions according to their own contextual understanding at that moment.
This research was approved in advance by the Research Ethics Review Committee of the Faculty of Design, Kyushu University and was subsequently conducted in accordance with the approved protocol (No. 639).
2.2. Experiment
2.2.1. Collaboration through improvisational dance subsection
We employed improvisational physical expression as the experimental protocol, which enables the clear observation of cognitive misalignments resulting from the imperfect communication inherited in service collaboration, while simultaneously ensuring the improvisation and emergence of actor interactions (Reference Shimizu and OkadaShimizu & Okada, 2022). During the experiment, each of the actors was required to express ba as they each perceived by physical expressions. The four actors took turns expressing context solely through physical expression (improvisational dance), interpreted the context present in the ba from each other’s dances, and then sequentially expressed the ba they recognized through their own dances. Through repetition of this process, they collaborated toward the goal of sharing context. Each actor was interviewed using questionnaires and video reviews to capture their intentions in their own expressions during collaboration, their perceptions of others’ expressions, and their perceptions of ba in chronological order.
2.2.2. Quantitative measure of context through adjectives
To quantify each actor’s perception of the ba during collaboration and their perception of context in their own and others’ expressions, we set three pairs (six in total) of adjectives as context components: x-x’: fulfilled-empty, y-y’: pleasant-unpleasant, and z-z’: gentle-scary. These adjectives were selected from the SD Scale (Reference Inoue and KobayashiInoue & Kobayashi, 1985) and based on three criteria: they function effectively as context components and are easily understood; they are not adjectives that directly describe physical quantities related to bodily movements; and they are semantically unbiased across languages. Each actor maintained these contextual components as a framework when expressing themselves and interpreting the intentions of others’ expressions. Interviews based on questionnaires and video reviews were conducted according to this framework.
2.2.3. Experimental protocol
Participants were selected according to their dance experience (at least 2 years), familiarity with improvisational expression, and expressive ability. Experiments were conducted with three groups, each comprising four participants. A non-melodic drumbeat (BPM=100) was used. Participants were positioned at the vertices of a 4.4-meter square and expressed themselves through dance without changing positions. Figure 2 shows the layout and experimental scene.
Scene from the experiment

Verbal communication was strictly prohibited to ensure that interaction was mediated solely through physical expression, functioning as the exclusive analogue touchpoint. To replicate physical environment constraints and regulate power dynamics within institutional structures, the protocol imposed strict rules: immobile positioning within a $4.4\;m$
square, a fixed expression duration of
$4.4\;m$
square, a fixed expression duration of $2 \times 8$
counts, and a predetermined sequence of turns to equalize participation opportunities. Furthermore, to form a goal-oriented ecosystem, the group was explicitly assigned a shared collaborative goal: to achieve context convergence and share a unified context within the group. Each actor expressed the context (SD-scale adjectives) perceived at a given moment, interacting with others’ expressions through the ba. Immediately after the task, interviews through video review were conducted individually, ensuring others could not hear the conversations.
$2 \times 8$
counts, and a predetermined sequence of turns to equalize participation opportunities. Furthermore, to form a goal-oriented ecosystem, the group was explicitly assigned a shared collaborative goal: to achieve context convergence and share a unified context within the group. Each actor expressed the context (SD-scale adjectives) perceived at a given moment, interacting with others’ expressions through the ba. Immediately after the task, interviews through video review were conducted individually, ensuring others could not hear the conversations.
-
1. One adjective from each of the three pairs was assigned to each participant, with unique combinations.
-
2. Participants expressed the given adjectives through dance in 2×8-count solo turns. Each could freely allocate counts and use one adjective per segment.
-
3. After each round, participants answered questionnaires about the ba perceived as shared.
-
4. In subsequent rounds, participants expressed their perceived ba via dance.
-
5. Steps 3 and 4 were repeated until the fourth round, which was followed by individual interviews with video reviews.
Each actor’s cognition of the ba was obtained after each round via questionnaire responses, following the observation of all four participants’ dance expressions. Each participant answered by marking the diagram shown in Figure 2 with the ba they perceived as being shared at that time. Through this method, we obtained the transition of each actor’s cognition of the ba after each round.
Each actor’s perception of context in their own and others’ expressions was obtained through individual interviews. Immediately after the task session, the experimenter showed each participant a video recording of it and interviewed them regarding their cognition of all movements and expressed contexts. For their own dances, participants identified which adjectives they intended to express and through which movements. For others’ dances, they indicated which adjective they perceived from each movement. Through this method, we captured the context expressed through dance by each actor and the context perceived in that dance by the other three in chronological order.
2.3. Multi-agent simulation
2.3.1. Mathematical model for cognition and action in collaboration
Hereafter, agents in the simulation model corresponded to actors in collaboration.
Definition of context components: The three adjective pairs used in 2.2.2 were mapped to axes $X$
,
$X$
, $Y$
, and
$Y$
, and $Z$
, each taking two possible values (Equation 1).
$Z$
, each taking two possible values (Equation 1).
 $$X = {\rm{\;}}\left\{ {\matrix{ {{{\left( {1,{\rm{\;}}0} \right)}^{\rm{T}}}} \cr {{{\left( {0,{\rm{\;}}1} \right)}^{\rm{T}}}} \cr } } \right.,{\rm{\;}}Y = {\rm{\;}}\left\{ {\matrix{ {{{\left( {1,{\rm{\;}}0} \right)}^{\rm{T}}}} \cr {{{\left( {0,{\rm{\;}}1} \right)}^{\rm{T}}}} \cr } } \right.,{\rm{\;}}Z = {\rm{\;}}\left\{ {\matrix{ {{{\left( {1,{\rm{\;}}0} \right)}^{\rm{T}}}} \cr {{{\left( {0,{\rm{\;}}1} \right)}^{\rm{T}}}} \cr } } \right.$$
For example, $X = \;{\left( {1,0} \right)^{\rm{T}}}$
corresponds to the “fulfilled” context from the “x-x’: fulfilled-empty” components used in 2.2. The random variables
$X = \;{\left( {1,0} \right)^{\rm{T}}}$
corresponds to the “fulfilled” context from the “x-x’: fulfilled-empty” components used in 2.2. The random variables ${\boldsymbol{X}}$
,
${\boldsymbol{X}}$
, $\boldsymbol{Y}$
,
$\boldsymbol{Y}$
, $\boldsymbol{Z}$
are Bernoulli-sampled according to probability
$\boldsymbol{Z}$
are Bernoulli-sampled according to probability $\boldsymbol{X}$
,
$\boldsymbol{X}$
, $\boldsymbol{Y}$
, and
Z
, respectively, as shown in Equation 2.
$\boldsymbol{Y}$
, and
Z
, respectively, as shown in Equation 2.
 $$X,{\rm{\;}}Y,{\rm{\;}}Z{\rm{\;}}\sim{\rm{\!Bernoulli}}\left( \boldsymbol{X} \right),{\rm{\;Bernoulli}}\left( {\boldsymbol{Y}} \right),{\rm{\;Bernoulli}}\left( {\boldsymbol{Z}} \right)$$
The probabilities $\boldsymbol{X}$
,
$\boldsymbol{X}$
, $\boldsymbol{Y}$
, and
$\boldsymbol{Y}$
, and $\boldsymbol{Z}$
are random variables that follow Beta distributions, shown in Equation 3.
$\boldsymbol{Z}$
are random variables that follow Beta distributions, shown in Equation 3.
 $${\boldsymbol{X}},{\rm{\;}}{\boldsymbol{Y}},{\rm{\;}}{\boldsymbol{Z}}{\rm{\;}}\sim{\rm{\;Beta}}\left( {\boldsymbol{\alpha}} \right),{\rm{\;Beta}}\left( {\boldsymbol{\beta}} \right),{\rm{\;{{Beta}}}}\left( {\boldsymbol{\gamma}} \right)$$
Where the parameters ${\boldsymbol{\alpha}} $
,
${\boldsymbol{\alpha}} $
, ${\boldsymbol{\beta}} $
and
${\boldsymbol{\beta}} $
and ${\boldsymbol{\gamma}} $
are parameters of these Beta distributions, as defined in Equation 4.
${\boldsymbol{\gamma}} $
are parameters of these Beta distributions, as defined in Equation 4.
 $${\boldsymbol{\alpha}} = \;\left( {\matrix{ {{\alpha _1}} \cr {{\alpha _2}} \cr } } \right),\;{\boldsymbol{\beta}} = \;\left( {\matrix{ {{\beta _1}} \cr {{\beta _2}} \cr } } \right),{\boldsymbol{\gamma}} = \;\left( {\matrix{ {{\gamma _1}} \cr {{\gamma _2}} \cr } } \right)$$
Expression selection by agents: Where an agent expressed each context component, random variables X, Y, Z are sampled from Beta ( ${\boldsymbol{\alpha}} $
), Beta (
${\boldsymbol{\alpha}} $
), Beta ( ${\boldsymbol{\beta}} $
), Beta (
${\boldsymbol{\beta}} $
), Beta ( ${\boldsymbol{\gamma}} $
), respectively. Then, based on these generated random variables, each component expression
${\boldsymbol{\gamma}} $
), respectively. Then, based on these generated random variables, each component expression $W\; = \;\left( {X,\;Y,\;Z} \right)$
is selected as if biased coins had been tossed. The probability that actor A extracts an expression for context component
$W\; = \;\left( {X,\;Y,\;Z} \right)$
is selected as if biased coins had been tossed. The probability that actor A extracts an expression for context component $X$
in the
$X$
in the $i$
th round is shown in Equation 5.
$i$
th round is shown in Equation 5.
 $$\;\;X_A^i\;\sim \;{\rm{Bernoulli}}\left( {{\boldsymbol{X}}_A^i} \right)$$
Where the parameter ${\boldsymbol{X}}_A^i$
follows the distribution in Equation 6.
${\boldsymbol{X}}_A^i$
follows the distribution in Equation 6.
 $${\boldsymbol{X}}_A^i{\rm{\;}}\sim {\rm{\;Beta}}\left( {{\boldsymbol{\alpha}} _A^i} \right)$$
Perception of expression context: Where one agent perceives the context of an expression by another agent, a fixed probability of misperception is introduced for each context. However, no misperception occurs when an agent perceives their own expression.
Inferring ba from expressions: Agents infer ba from observed expressions using weighted Bayesian inference. Specifically, whenever they perceive others’ expressions, they update the estimated probability distribution using the sequential updating equations shown in Equation 7.
 $$\left\{ {\matrix{ {{\boldsymbol{\alpha}} _A^{i + 1} = \;{v_A}{\boldsymbol{\alpha}} _A^i + \;{w_{A,{\rm{\;}}B}}X_{A,B}^i,} \cr {{\boldsymbol{\beta}} _A^{i + 1} = \;{v_A}{\boldsymbol{\beta}} _A^i + \;{w_{A,B}}Y_{A,B}^i,} \cr {{\boldsymbol{\gamma}} _A^{i + 1} = \;{v_A}{\boldsymbol{\gamma}} _A^i + \;{w_{A,B}}Z_{A,B}^i\;} \cr } } \right.$$
These equations model the update when agent A perceives agent B’s expression at the $i$
th round. Here, the parameter
$i$
th round. Here, the parameter ${v_A}$
is the weight representing the temporal decay of observation influence set for each actor;
${v_A}$
is the weight representing the temporal decay of observation influence set for each actor; ${w_{A,B}}$
is the weight representing the importance of observed data set for each pair of expresser and observer.
${w_{A,B}}$
is the weight representing the importance of observed data set for each pair of expresser and observer.
2.3.2. Simulation procedure
Consistent with the experimental design, each agent is assigned an initial individual context and a predetermined order of expression.
The multi-agent simulation procedure is described below:
-
1. Initial values of prior distribution parameters for each agent and component are set
-
2. The expression order of agents is set
-
3. The current Beta distribution to be used for selecting expressions is set
-
4. The agent is designated to express according to the order
-
5. The expression $W\; = \;\left( {X,\;Y,\;Z} \right)$
based on the agent’s Beta distribution is selected
$W\; = \;\left( {X,\;Y,\;Z} \right)$
based on the agent’s Beta distribution is selected -
6. All agents perceive the expressed context
-
7. All agents update their Beta distribution parameters based on the perception
-
8. Steps 4 to 7 for the number of agents are repeated
-
9. Steps 3 to 8 are repeated

2.3.3. Correspondence between mathematical model indicators and collaboration model
The expected values calculated from updated Beta distribution parameters for each agent form the matrix ${\boldsymbol{B}}$
(Equation 8), representing the ba perceived by each actor.
${\boldsymbol{B}}$
(Equation 8), representing the ba perceived by each actor.

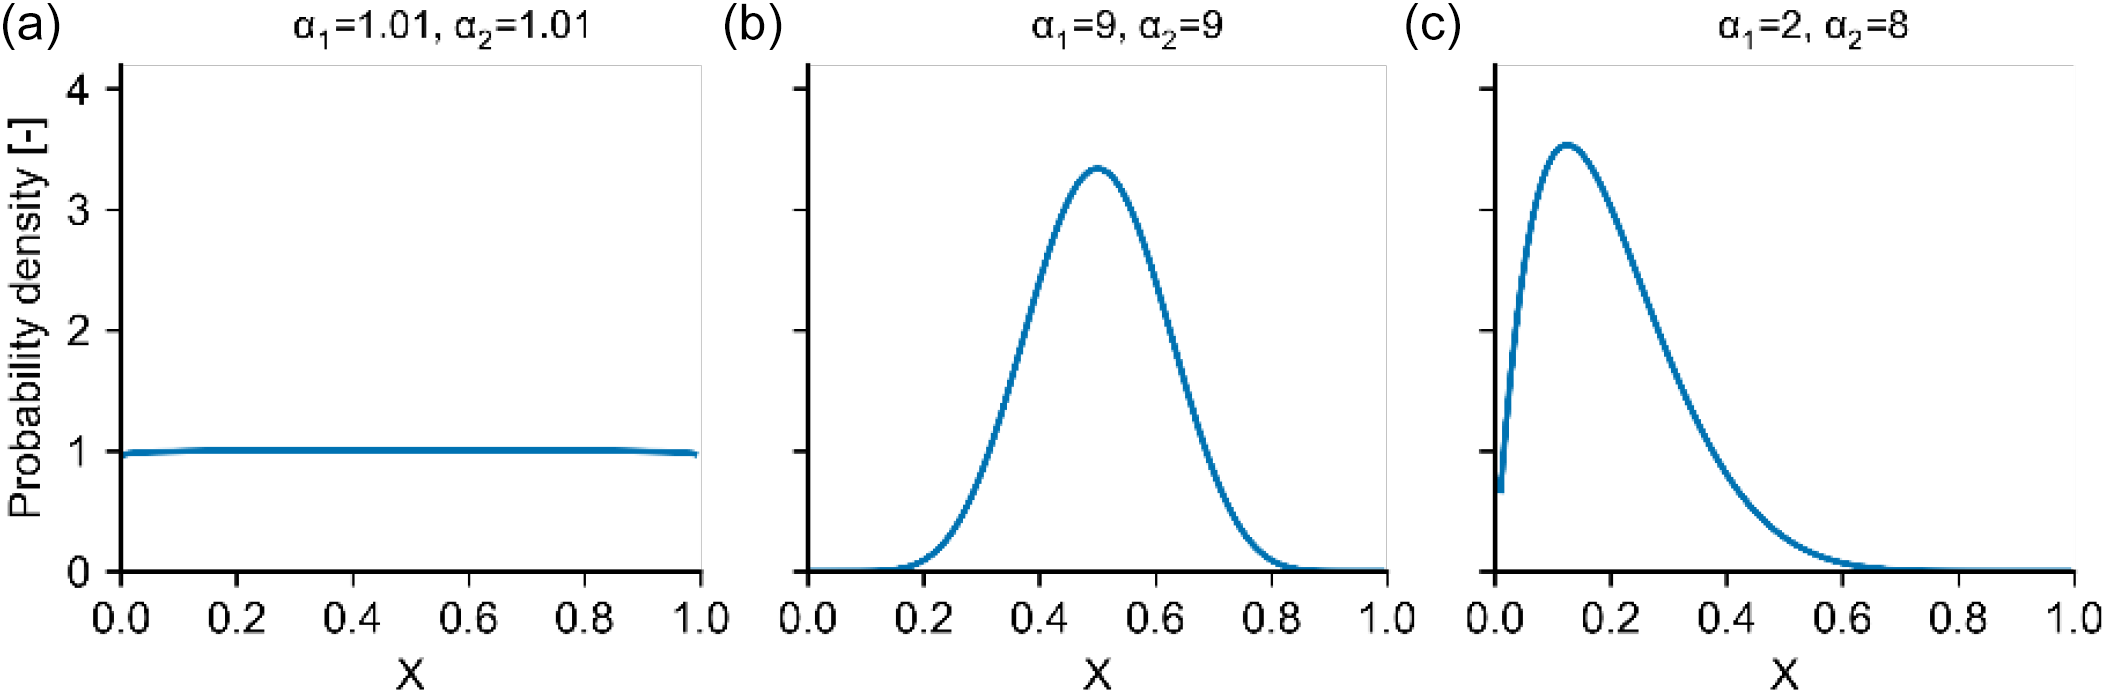
In the presented mathematical model, agents extract context expressions according to their Beta distributions. These distributions can be interpreted as the potential influence of individuals on the ba. As illustrated in Figure 3, Beta distributions can be biased to one side, depending on parameters, and the degree of bias (i.e., concentration of probability mass) varies. Therefore, Beta distributions held by agents are interpreted as individual context vectors in collaboration.
Differences in beta distribution shapes depending on parameters

Furthermore, the Wasserstein distance between distributions is used as an indicator to assess the degree of context sharing. A smaller Wasserstein distance between agents A and B indicates a greater degree of context sharing. Table 1 summarizes the correspondence between mathematical indicators and their meanings in the co-creation model.
Correspondence between mathematical indicators and meanings in collaboration

Behavioral traits and cognition of properties of the ba : Parameters representing the behavioral traits of individuals and their cognition of ba properties, which influence the collaboration process, are shown in Table 2 and Table 3. For behavioral traits regarding participation in the ba, a model shows how to select the type of expression. The expression is selected via coin tosses based on random variables.
Operationalization of individual behavioral traits in a model

Parameters representing individual cognition of ba properties

The properties of ba that individual actors assume include perceived influence levels, and the lingering impact of their expressions over time. The influence level is reflected in weight $w$
during inference. Lingering impact is reflected in temporal decay rate
$w$
during inference. Lingering impact is reflected in temporal decay rate $v$
, which is set for each actor.
$v$
, which is set for each actor.
Parameters not depending on individuals but affecting the collaborative process are shown in Table 4.
Non-individual conditions and corresponding parameters in the model

2.3.4. Parameter settings
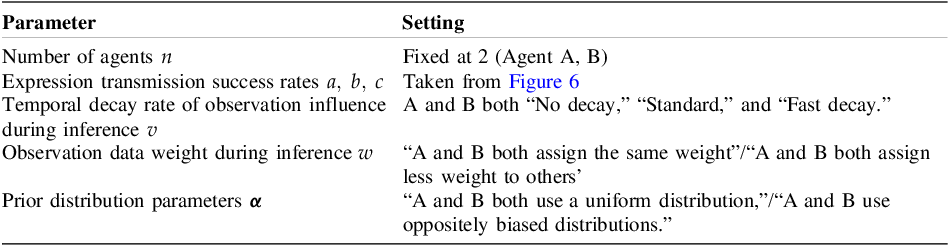
Simulation parameters were set as shown in Table 5.
Simulation parameters

Parameters that do not change regardless of trial settings: The number of agents $n$
was fixed at 2 (Agent A, B). Context transmission success rates for context components
$n$
was fixed at 2 (Agent A, B). Context transmission success rates for context components $X$
,
$X$
, $Y$
,
$Y$
, $Z$
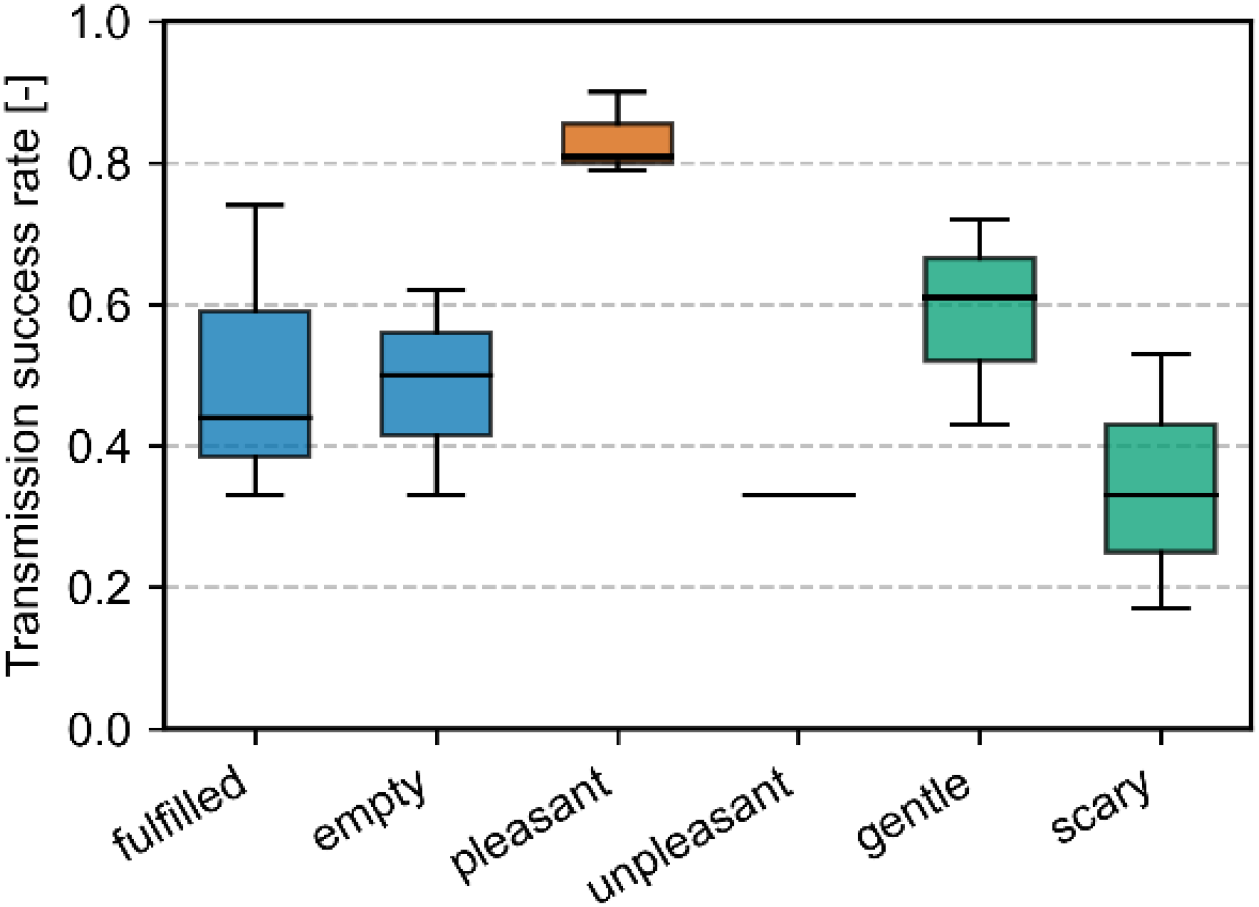
were taken from average values in Figure 4. These were set to
$Z$
were taken from average values in Figure 4. These were set to ${\boldsymbol{a}} = ({a_1},{\rm{\;}}{a_2}) = \left( {0.503,{\rm{\;}}0.483} \right)$
,
${\boldsymbol{a}} = ({a_1},{\rm{\;}}{a_2}) = \left( {0.503,{\rm{\;}}0.483} \right)$
, ${\boldsymbol{b}} = ({b_1},{\rm{\;}}{b_2}) = \left( {0.833,{\rm{\;}}0.330} \right)$
,
${\boldsymbol{b}} = ({b_1},{\rm{\;}}{b_2}) = \left( {0.833,{\rm{\;}}0.330} \right)$
, ${\boldsymbol{c}} = ({c_1},{\rm{\;}}{c_2}) = \left( {0.597,{\rm{\;}}0.343} \right)$
.
${\boldsymbol{c}} = ({c_1},{\rm{\;}}{c_2}) = \left( {0.597,{\rm{\;}}0.343} \right)$
.
Differences in transmission success rates per expressed adjectives

Parameters changed to confirm the effect of cognition of
ba
properties: To confirm the influence of cognition of ba properties, the temporal decay rate of observation influence during inference $v$
and the weight of observed data during inference
$v$
and the weight of observed data during inference $w$
were individually varied. We compared simulation results under three conditions for the temporal decay rate
$w$
were individually varied. We compared simulation results under three conditions for the temporal decay rate $\nu $
: No decay (
$\nu $
: No decay ( $\nu = 1.0$
), Standard (
$\nu = 1.0$
), Standard ( $\nu = 0.8$
), and Fast decay (
$\nu = 0.8$
), and Fast decay ( $\nu = 0.65$
). These settings allow us to examine how individual actors’ perception regarding the fluidity of the ba influences the dynamics of collaboration. To represent differences in perceived influence levels between actors, simulation results were compared under two observation data weight
$\nu = 0.65$
). These settings allow us to examine how individual actors’ perception regarding the fluidity of the ba influences the dynamics of collaboration. To represent differences in perceived influence levels between actors, simulation results were compared under two observation data weight $w$
conditions: A and B both assign the same weight to their own and others’ expressions, and A and B both assign less weight to others’ expressions compared to their own. In the former condition, both self and others’ expressions were assigned
$w$
conditions: A and B both assign the same weight to their own and others’ expressions, and A and B both assign less weight to others’ expressions compared to their own. In the former condition, both self and others’ expressions were assigned $w = 1.0$
; in the latter condition, self-expression was assigned
$w = 1.0$
; in the latter condition, self-expression was assigned $w = 1.5$
and others’ expressions
$w = 1.5$
and others’ expressions $w = 0.5$
.
$w = 0.5$
.
Parameters varied to confirm the influence of conditions not dependent on individuals: To confirm the influence of initial individual context vector values, simulation results were compared under two conditions for initial distribution parameter values: “A and B both use uniform distribution,” and “A and B use oppositely biased distributions.” The uniform distribution was defined as ${\boldsymbol{\alpha}} = {\boldsymbol{\beta}} = {\boldsymbol{\gamma}} = \left( {1.0,\;1.0} \right)$
, and the biased distributions were set as follows: for Agent A,
${\boldsymbol{\alpha}} = {\boldsymbol{\beta}} = {\boldsymbol{\gamma}} = \left( {1.0,\;1.0} \right)$
, and the biased distributions were set as follows: for Agent A, ${\boldsymbol{\alpha}} = {\boldsymbol{\beta}} = {\boldsymbol{\gamma}} = \left( {2.0,\;5.0} \right)$
; for Agent B,
${\boldsymbol{\alpha}} = {\boldsymbol{\beta}} = {\boldsymbol{\gamma}} = \left( {2.0,\;5.0} \right)$
; for Agent B, ${\boldsymbol{\alpha}} = {\boldsymbol{\beta}} = {\boldsymbol{\gamma}} = \left( {5.0,\;2.0} \right)$
.
${\boldsymbol{\alpha}} = {\boldsymbol{\beta}} = {\boldsymbol{\gamma}} = \left( {5.0,\;2.0} \right)$
.
2.3.5. Calculation of transmission success rates by expressed adjective
We obtained the adjective sets expressed by each actor and those received by the other three in each turn from the experiment and calculated the proportion of correctly transmitted contexts per expressed adjective. The results are illustrated in the box plot in Figure 4. Differences in transmission success rates were observed, depending on the adjective.
3. Results and discussion
3.1. Observed transitions in ba and contextual distance
Under standard parameter settings where both agents A and B were set with $v = 0.8$
,
$v = 0.8$
, $w = 1.0$
, and prior distributions were set as uniform, simulation results are shown in (a), (b) and (c) of Figure 5 for context components
$w = 1.0$
, and prior distributions were set as uniform, simulation results are shown in (a), (b) and (c) of Figure 5 for context components $X$
,
$X$
, $Y$
, and
$Y$
, and $Z$
respectively. In two broken line charts, blue and red show the transitions of ba as perceived by Agent A and Agent B. The vertical axis represents the degree of bias in expectations, while the horizontal axis indicates collaboration progression in terms of observation numbers. For example, in the blue broken line chart of graph (b), the graph biased toward the positive direction means that the ba concerning component Y-Y’ was perceived by Actor A as increasingly “pleasant” as the collaboration progressed.
$Z$
respectively. In two broken line charts, blue and red show the transitions of ba as perceived by Agent A and Agent B. The vertical axis represents the degree of bias in expectations, while the horizontal axis indicates collaboration progression in terms of observation numbers. For example, in the blue broken line chart of graph (b), the graph biased toward the positive direction means that the ba concerning component Y-Y’ was perceived by Actor A as increasingly “pleasant” as the collaboration progressed.
Simulation results for each context component

The bar chart in Figure 5 shows the transition of Wasserstein distance between the individual context vectors of Agents A and B. From these results, we successfully reproduced temporal changes in individual perceptions of ba for each component and changes in distance between individual context vectors. Comparing ba perception with contextual distance, we found that as ba becomes more biased, context sharing increases. Conversely, when context is neutral or when its bias changes, context sharing decreases.
3.2. Differences in temporal decay rate
$\nu $

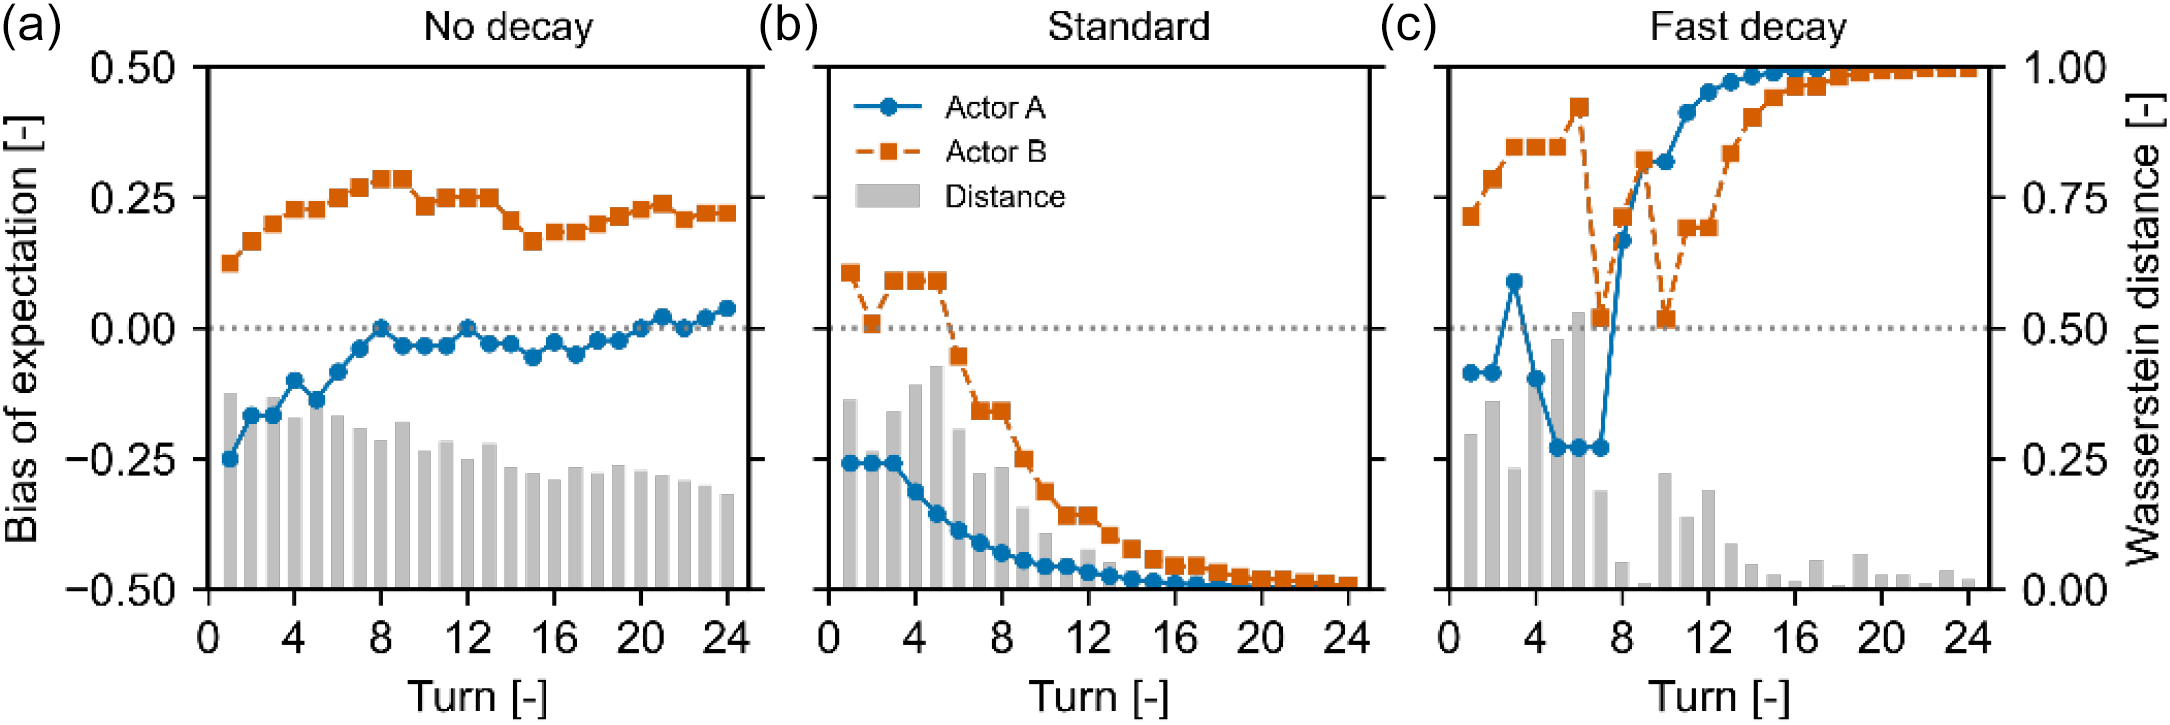
Figure 6 compares the simulation results for Context Component X under three conditions: (a) “No decay,” (b) “Standard,” and (c) “Fast decay.” In the “Fast decay” condition, the perception of the ba fluctuates significantly and becomes unstable. Conversely, in the “No decay” condition, fluctuations diminish as collaboration progresses; however, the cognitive misalignment (Wasserstein distance) persists without narrowing.
Simulation results of context component X under three decay conditions

Figure 6 Long description
Three line graphs depict simulation results of context component X under three decay conditions. Panel A: No decay. Panel B: Standard decay. Panel C: Fast decay. Each panel shows bias of expectation on the left y-axis and Wasserstein distance on the right y-axis, both plotted against turns on the x-axis. The graphs include data series for Actor A, Actor B, and Distance. Actor A is represented by a blue line with circular markers, Actor B by an orange dashed line with square markers, and Distance by grey bars. In Panel A, bias of expectation for Actor A fluctuates around zero, while Actor B shows a slight negative bias initially, which increases over time. Distance decreases steadily. In Panel B, both actors' biases fluctuate more significantly, with Actor A showing positive bias and Actor B showing negative bias initially, both stabilizing around zero. Distance shows a decreasing trend. In Panel C, biases for both actors show high variability initially, with Actor A's bias decreasing over time and Actor B's bias stabilizing around zero. Distance decreases more rapidly compared to the other panels.
Mathematically, these results align with the general tendency that systems retaining large amounts of accumulated information stabilize with smaller fluctuations per observation, whereas systems with low retention depend heavily on recent observations, resulting in instability. Interpreting this within the collaboration model, the increased fluctuation observed when expression influence decays easily suggests that the actors’ very perception of “fluidity” drives the dynamism of the ba. Furthermore, the persistence of the cognitive misalignment in the “No decay” condition suggests that achieving convergence (consensus) is difficult when past expressions are never forgotten. This offers an implication for facilitation and the design of ba: maximizing information retention is not always optimal. Instead, a trade-off exists between convergence and stability. Consequently, appropriate unlearning and resetting mechanisms should be intentionally designed to facilitate effective context sharing.
3.3. Differences in observation data weight
${\boldsymbol{w}}$

Figure 7 shows simulation results for collaborations where both individuals perceived the influence of others’ expressions on the ba to be minor. As is particularly notable in the results for context component Y, the actors’ perceptions of the ba proceed almost independently, with limited mutual influence. Consequently, as the bias in individual perception strengthens, the contextual distance between agents expands rather than shrinks. Consequently, as a bias in individual perception strengthens, the contextual distance between agents expands rather than shrinks.
Condition where others’ expressions are assigned lower weight

These results indicate that when actors downplay the impact of others’ expressions, a high degree of subjective conviction does not imply a shared context. This yields two critical implications for service design practice:
-
• Facilitation via Boundary Objects: The divergence caused by self-focus underscores the importance of facilitation that redirects participants’ attention from the self to shared objects. Design tools such as graphic recording or physical prototypes function as “Boundary Objects” (Reference Matsumae and NagaiMatsumae & Nagai, 2018) that externalize context. These tools are mathematically equivalent to forcing an increase in the weight assigned to external observations, thereby preventing the isolation of contexts.
-
• Risk of Subjective KPIs: Intuitively, high participant confidence or satisfaction is often interpreted as a sign of successful collaboration. However, the simulation suggests a counter-intuitive risk: high subjective certainty may coexist with widening cognitive misalignments. Therefore, relying solely on “subjective satisfaction” as a Key Performance Indicator (KPI) for co-creation workshops may lead designers to overlook critical misalignments in context.
3.4. Differences in temporal decay
$\nu $
with oppositely biased initial distributions

Figure 8 shows simulation results where Agents A and B started with oppositely biased prior distributions. The results are compared under the three temporal decay conditions defined in Section 3.2. In the “No decay” condition (Figure 8a), the initial discrepancy between the actors’ contexts persists throughout the interaction. The contextual distance remains large, indicating a failure to reach a shared understanding. In contrast, in the conditions with temporal decay (Figure 8b and 8c), the distance decreases rapidly, and the contexts converge despite the initial conflict.
Oppositely biased initial distributions under three decay conditions

Figure 8 Long description
Three line graphs depict the bias of expectation and Wasserstein distance across different decay conditions over 24 turns. Panel A: No decay. The line graph shows the bias of expectation on the y-axis ranging from -0.50 to 0.50 and turns on the x-axis ranging from 0 to 24. Actor A is represented by blue circles connected by a solid line, Actor B by orange squares connected by a dashed line, and the distance by grey bars. Actor B starts with a positive bias that slightly increases over time, while Actor A starts with a negative bias that gradually increases. The distance between actors decreases over time. Panel B: Standard decay. The line graph shows the bias of expectation on the y-axis ranging from -0.50 to 0.50 and turns on the x-axis ranging from 0 to 24. Actor A is represented by blue circles connected by a solid line, Actor B by orange squares connected by a dashed line, and the distance by grey bars. Both actors' biases decrease over time, with Actor A's bias becoming negative and Actor B's bias approaching zero. The distance between actors also decreases over time. Panel C: Fast decay. The line graph shows the bias of expectation on the y-axis ranging from -0.50 to 0.50 and Wasserstein distance on the right y-axis ranging from 0 to 1.00, with turns on the x-axis ranging from 0 to 24. Actor A is represented by blue circles connected by a solid line, Actor B by orange squares connected by a dashed line, and the distance by grey bars. Actor B's bias initially increases and then decreases, while Actor A's bias fluctuates before stabilizing. The Wasserstein distance increases initially and then decreases over time.
These results reinforce the findings of Section 3.2, demonstrating them more prominently: under conditions where past expressions are never forgotten, achieving cognitive convergence is significantly difficult, especially when actors hold conflicting prior knowledge or strong biases. This leads to an implication for service design: when stakeholders enter a collaboration process with conflicting backgrounds, archiving all interactions can act as a barrier to consensus. Therefore, designing phases to reset past contexts, such as utilizing ephemeral communication tool that intentionally lower information retention, is an effective strategy to break initial stalemates and foster new consensus.
4. Conclusion
This study modelled the process of value co-creation in service as a context-sharing within ba, specifically focusing on cognitive misalignments, and analyzed its dynamics through a multi-agent simulation based on a collaborative physical expression task. The simulation results revealed that individual cognitive properties regarding the ba significantly influence the process. Specifically, we derived two critical implications for service design practice:
-
• Dynamics of ba and suggestions for unlearning: The results confirmed that a faster decay of expression influence increases fluctuations in actors’ perceptions of the context, suggesting that actors’ perception of the “fluidity” of ba drives its dynamism. Conversely, in the “no decay” condition, initial cognitive biases were fixed, making context convergence difficult. These findings imply the necessity of designing for unlearning, such as utilizing ephemeral communication spaces, to facilitate new consensus-building.
-
• Effects of controlling cognitive targets: Under conditions where actors weighted different expressions during inference, cognitive misalignments between them widened as individual biases increased. This indicates the need to direct actors’ attention toward “Boundary Objects” or others to prevent contextual discrepancy. Furthermore, since high subjective conviction does not guarantee a shared context, relying solely on subjective satisfaction risks overlooking critical misalignments.
In this study, we introduced uncertain transmission, the source of cognitive misalignments, as a fixed probability. However, the transmission success rate derived from SD-scale adjectives is highly dependent on individual and cultural interpretation. In reality, these misalignments arise from differences in actors’ cultural and knowledge backgrounds. From this perspective, future research involves extending the model to describe the internal mechanisms of how misunderstandings and interpretation gaps occur, rather than treating them solely as external stochastic factors. Finally, to refine the simulation parameter settings, analyzing the video data of participant behavior, which has already been acquired during the experiment, should be considered to empirically ground the model’s assumptions.
Acknowledgement
This work was supported by JSPS KAKENHI Grant Number JP22KK0220.









 Open access

