


1. Introduction
Simulations are widely used in engineering of Cyber-Physical Systems (CPS). Within engineering projects, models are created and simulations are carried out by experts who define input data, including product models and parameters (Reference HäfnerHäfner, 1998). Engineering of CPS encompasses various disciplines such as mechanical, electrical, and software engineering (VDI/VDE, 2021). Within all disciplines, discipline-specific models are created and improved over time. At the end of the engineering phase, advanced models are available for examining properties and system behavior of CPS.
However, the potential of these models is not fully exploited for future products. To exploit efforts from engineering further, the resulting simulation data must be used beyond engineering processes. It can be leveraged to drive innovations and inform strategic planning of future products. To this end, simulation data from engineering is not yet used in strategic planning of follow-up products. Core tasks in strategic product planning (SPP) are a) the exploration of the problem space and b) the development and selection of ideas (Reference Gräßler, Rarbach and BenediktGräßler et al., 2025). Due to the various disciplines involved in CPS engineering, multidisciplinary perspectives must be considered in SPP. However, the team is not composed of engineers from all disciplines. SPP teams are cross-functional, with experts from finance, marketing, and engineering (Reference Kester, Griffin, Hultink and LaucheKester et al., 2011), so engineers must cover a cross-section of engineering disciplines. The results of SPP are prerequisites for awarding the engineering order and transitioning to product engineering (Reference Pahl, Beitz, Feldhusen and GrotePahl et al., 2007). Simulation data carries the potential to support SPP decisions when it comes to assessing the limitations of existing products. This helps to explore the problem space and develop new ideas (Reference Panzner, Enzberg and DumitrescuPanzner et al., 2024). In addition, initial ideas can be evaluated by comparing similarities. During product creation of a drone, for example, simulation data can be used to deduce that the drone will achieve a maximum flight time of 20 minutes, while similar models from competitors achieve longer flight times. Ideas are being gathered in SPP to address this problem with the new product. Other simulation results show that reducing the weight of the body leads to higher susceptibility to wind. These results can therefore be used to evaluate ideas at an early stage and, as in this case, to rule them out. To increase the benefit, it is useful to expand parameter sets and simulation runs of engineering simulation data. This means that additional simulations combining existing models with new parameterizations are performed to derive further insights from the simulation data beyond those already known from engineering. However, there is often no capacity for such additional simulations, as efforts within product engineering are limited to simulations necessary to start production quickly (Reference HäfnerHäfner, 1998). Moreover, simulation experts are usually involved in new projects immediately after completing the previous project. Decision makers in SPP often do not have in-depth knowledge of applying discipline-specific simulations (Reference Tidd and BessantTidd & Bessant, 2021). To still exploit simulation data for future innovations, it must be processed with minimal additional effort and without in-depth expertise in individual simulation disciplines. One approach to automating simulation is to integrate simulators into workflows that define the sequence of data processing steps and orchestrate the simulation execution (Reference Díaz, Alarcón, Mourgues and GarcíaDíaz et al., 2017). Considering the workflow integration to overcome the challenges, this paper answers the following research questions (RQs):
RQ1: Which processing steps are required in simulation workflows for simplified use of multidisciplinary simulators in SPP?
RQ2: Does integrating multidisciplinary simulators into end-to-end workflows increase usage by users without in-depth expertise?
The resulting software solution, referred to as Simulator HyperSuite (SHS), enables workflow-based simulation with multiple simulators. In Figure 1, the general principle and the position of the SHS within the generic Product Lifecycle (gPLC) according to (Reference Gräßler and PottebaumGräßler & Pottebaum, 2021) is illustrated.
Positioning of the SHS within the gPLC according to Reference Gräßler and PottebaumGräßler & Pottebaum, 2021

Figure 1 Long description
A diagram representing the integration of simulation data from engineering into the Simulator HyperSuite for extended data use in SPP. The diagram shows a flowchart with various stages of product creation, including strategic planning, engineering, realization, service delivery, operation, and decommissioning. Simulation data from engineering, which includes configurations, input data, context data, and outputs, is fed into the Simulator HyperSuite. The Simulator HyperSuite consists of multiple simulators labeled as sim 1, sim 2, sim 3, and sim n. The outputs from these simulators are used for problem space exploration and triggering ideas. The diagram illustrates the flow of data and the interactions between different stages and components in the process.
2. Research design
The investigations follow a four-step research approach, depicted in Figure 2, considering the RQs. First, the integration of simulators into workflows is described, allowing more automated simulation and thereby a systematic exploration of an extended parameter scope based on a literature analysis to derive functional requirements of the SHS (1). Moreover, user needs are derived from user surveys. Building on this, the concept of the SHS is derived (2), incorporating the answers to RQ1. To this end, the literature was examined to determine data types used in simulations and processing steps to prepare data for decision support. The SHS is implemented in a research prototype (3) to be applied and evaluated (4) in the EU research project CREXDATA with the aim of answering RQ2. To this end, end users without in-depth expertise applied the research prototype to parameterize simulations and interpret results. Usability was assessed by statements with Likert-type response options.
Research design

3. Related work
In this chapter, methodological and architectural frameworks integrating multidisciplinary simulators rather than specific commercial software such as Ansys ModelCenter, or ESTECO modeFRONTIER, which operate at different application levels, are considered. The most common approaches include co-simulation and integrated simulation environments. In addition, multidisciplinary design, analysis, and optimization as well as process integration and design optimization are analyzed.
Co-simulation combines several simulators running in parallel with defined synchronization points (Reference GroganGrogan, 2021). At these points, data is exchanged between the simulators so that one simulator builds on the interim results of the others. This allows for simulating more complex correlations for which simulators from different disciplines are needed (Reference Hardy, Palmintier, Top, Krishnamurthy and FullerHardy et al., 2024). Hardy et al. outline that co-simulation platforms usually integrate existing simulators. That brings the advantage of well-developed and validated solutions (Reference Hardy, Palmintier, Top, Krishnamurthy and FullerHardy et al., 2024). However, every simulator follows its domain-specific assumptions according to timescales, resolutions, and accuracies (Reference GroganGrogan, 2021). As a result, the co-simulation platform’s primary task is to synchronize the different simulators and harmonize data exchange formats. Hardy et al. provide one example for a co-simulation platform, namely the Hierarchical Engine for Large-scale Infrastructure Co-Simulation (HELICS). This platform is used for co-simulations in the energy sector, e.g., to simulate the behavior of power grids, but also the cybersecurity of smart grids can be investigated, and hardware-in-the-loop simulations can be run (Reference Hardy, Palmintier, Top, Krishnamurthy and FullerHardy et al., 2024). In comparison, Grogan uses a similar approach but applies it in a completely different domain. In this approach, co-simulation is used to combine agriculture, water, and energy analyses for sustainable infrastructure planning (Reference GroganGrogan, 2021).
Integrated Simulation Environments (ISEs) extend co-simulation capabilities through higher-integrated simulators. ISEs are environments that combine multiple analysis functions and provide a common user interface. Models used for simulation are created directly in the ISE, partially based on their own modeling languages (Reference Fritzson, Pop, Abdelhak, Ashgar, Bachmann, Braun, Bouskela, Braun, Buffoni, Casella, Castro, Franke, Fritzson, Gebremedhin, Heuermann, Lie, Mengist, Mikelsons, Moudgalya and ÖstlundFritzson et al., 2020). The models are then used for the different analysis tasks, which are conducted in parallel. As with co-simulation, data is exchanged between different submodules of the ISE. Finally, data from different analysis tasks is merged and visualized. Although the common user interface improves usability, a major challenge remains the creation of comprehensive models that incorporate multi-domain expertise for the various sub-simulations. This results in complex models. Additionally, extending ISEs with additional simulators and analysis functions is costly. Fritzson et al. present OpenModelica as an example for ISEs (Reference Fritzson, Pop, Abdelhak, Ashgar, Bachmann, Braun, Bouskela, Braun, Buffoni, Casella, Castro, Franke, Fritzson, Gebremedhin, Heuermann, Lie, Mengist, Mikelsons, Moudgalya and ÖstlundFritzson et al., 2020).
Multidisciplinary design, analysis, and optimization (MDAO) goes one step further by integrating optimization. First, the entire system, including all interactions between subsystems, is analyzed with coupled simulations. Then, all design variables are optimized according to the given constraints and optimization criteria (Reference Gray, Hwang, Martins, Moore and NaylorGray et al., 2019). MDAO is thus a methodological framework in which mathematical descriptions of behavior from different disciplines are combined in a common system of equations. The individual equations from the different systems have intersections of variables that result from higher-level constraints to be considered by all disciplines. For example, the fuel consumption of a car is influenced by its external shape, its control system, i.e., the software, and individual electrical consumers. As a result, a restriction on fuel consumption links equations from design, software engineering, and electrical engineering, among other areas. Gray et al. describe the OpenMDAO framework as an exemplary way to apply MDAO (Reference Gray, Hwang, Martins, Moore and NaylorGray et al., 2019).
Process integration and design optimization (PIDO) uses the principles of MDAO to explore large parameter ranges. For that, simulators are integrated into workflows (Reference Díaz, Alarcón, Mourgues and GarcíaDíaz et al., 2017). These allow automated simulation of system behavior. Simulation results are then input for optimization algorithms. Gerber and Lin, for example, apply a genetic algorithm for optimization (Reference Gerber and LinGerber & Lin, 2014). Optimized configurations are used for further simulations. Depending on the number of variable parameters and the possible variations for each parameter, many possible alternative solutions are evaluated. PIDO does not identify an optimal solution but rather creates a basis for decision-making by weighing up suitable trade-offs. Diaz et al. provide an example of applying PIDO in the field of architecture, engineering, and construction (Reference Díaz, Alarcón, Mourgues and GarcíaDíaz et al., 2017).
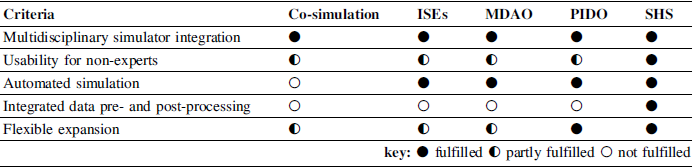
All approaches described integrate simulators from different disciplines and are primarily used in engineering processes. As a result, they are mainly used by experts with competencies in discipline-specific modeling. In contrast, the approach developed in this paper uses data resulting from product engineering but reduces barriers to using simulation results for decision support beyond engineering phases. Table 1 compares characteristics of the approaches, qualitatively derived from the literature cited above, and contrasts them with requirements for use in SPP.
Distinction between the developed approach and the frameworks described

The comparison shows that previous approaches have primarily been designed to automate various simulations and exchange interim results. However, the application requires technical understanding. There is a lack of simplified user interaction for transfer to the SPP. The approach outlined in this paper distinguishes itself by enhancing usability through the inclusion of pre- and post-processing and the creation of a common user interface for input and output of all simulators.
4. Concept development
To develop the concept for simplified use of simulation workflows, requirements for integrating simulations into workflows are first derived from the literature. In addition, specific user needs are identified. Based on this, a generic concept is developed that covers the steps from parameterization to the generation of decision support.
4.1. Literature-based requirements
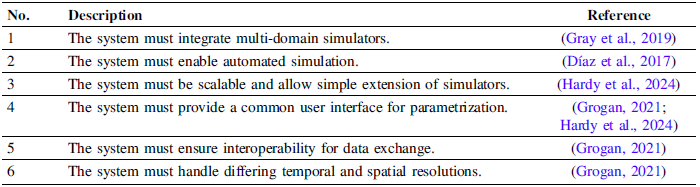
Functional requirements for implementing automated simulation in workflows are derived from the analyzed literature and summarized in Table 2. Requirements 4 and 6 clarify that there must be an input option for end users and that these inputs must be pre-processed before the simulators are parameterized with them. A modular structure is suitable for meeting the requirements of a common user interface for all simulators and requirements 1 and 3 (Reference Hardy, Palmintier, Top, Krishnamurthy and FullerHardy et al., 2024). This allows the simulators to be viewed as individual modules that are linked to pre-processing via uniform interfaces. This also highlights the importance of requirement 5, which ensures data exchange between the individual modules.
Requirements of the Simulator HyperSuite

4.2. User needs
In addition to functional requirements, user needs were collected from end users in the EU research project CREXDATA. As part of the project, simulators are being made available to users in disaster control for processing extreme data. The users surveyed are thus faced with the challenge of using simulators that were previously operated separately by different experts. They only use the simulators in the event of corresponding crises and therefore relatively rarely. Semi-structured group interviews were conducted with a total of 15 experts from this group to derive specific user needs. These interviews revealed the following four user needs:
-
1. Simulators must be integrated by domain experts. Users without in-depth expertise focus on the use of integrated simulators.
-
2. Parameterization must be as simple as possible, since users use the application irregularly. This includes inserting all parameters in domain-typical formats and reducing variables to the essentials.
-
3. User interfaces should be reduced to the essentials to reduce complexity.
-
4. Targeted decision support should aggregate and visualize simulation results.
These user needs show that the interfaces to the user must be designed to be as low-threshold as possible. This requires suitable pre- and post-processing to reconcile user needs with the technical requirements of the individual simulators.
4.3. Concept of the SHS
Based on these requirements and user needs, the concept of the SHS depicted in Figure 3 has been developed. The concept is based on the workflows being modeled by experts at the end of the engineering phase. At this point, simulation models are available, so activities can focus on integration into workflows. Integration is a prerequisite for ensuring that simulations can later be used by users without in-depth expertise. Concerning RQ1, the concept contains all relevant types of processing steps from parameterization to output visualization needed to enable users without in-depth expertise to use the simulations. The individual elements of the SHS are explained in the following.
Schematic representation of the Simulator HyperSuite

The first two elements of the workflow are created to manage data inputs into the simulation workflows. Simulators require input data, context data, and parameters/configuration settings (Reference Pottebaum, Ebel and GräßlerPottebaum et al., 2024). Some of these are entered by users. A Graphical User Interface (GUI), depicted as number 1 in Figure 3, that includes all the parameters to be defined, is suitable for this purpose (Reference GroganGrogan, 2021). The input should be designed in such a way that users can only enter parameters within a meaningful parameter scope. This can be implemented using sliders, for example. During integration into workflows, experts must define which of the data is fixed and which may be varied. The parameters to be varied must be inserted for each simulation run in the GUI. In addition, it is useful in some cases to insert data from real measurements or archived data, such as data from tests during engineering, records from production, or measurements from operation. To handle this data, an interface to retrieve data from databases is created, depicted as number 2 in Figure 3. This building block of the workflow addresses the second user need, automating data entry and thereby significantly accelerating the process.
The next step defined in the SHS is data pre-processing, i.e., preparing inserted data for simulation. GUI inputs are designed to accommodate data formats that are as intuitive as possible for end users. These user-specific data formats sometimes differ from data formats required by simulators (Reference Díaz, Alarcón, Mourgues and GarcíaDíaz et al., 2017). For maximum usability, the input formats must be discussed with users during implementation. As a result, input data must be pre-processed before it can be processed in simulations. Since each discipline-specific simulator requires individual data schemes and formats, this step must be performed individually for each simulator. This includes, for instance, the unification of differing time scales and the conversion of units (Reference GroganGrogan, 2021). This step is completed when the simulator-specific configuration files are created, which carry all relevant information to initialize the simulation. This is followed by the core of the workflow—the actual simulation, i.e., the data processing. The simulations, marked as number 4, are triggered when pre-processing is complete. The inserted data is processed. This step results in the individual simulation results of all simulators.
In steps 5 and 6, the simulation results from the discipline-specific simulators are merged and post-processed to finally provide a graphical representation for informed decision support (Reference GroganGrogan, 2021). Only this step transforms the pure simulation results into decision support. Like pre-processing, the fifth step involves harmonizing data formats and converting them into user-friendly units. Scripts and calculation rules can also be incorporated to calculate more aggregated key figures from the raw data, which help end users in their decision-making. Finally, the processed outputs must be visualized for end users in a GUI. Sufficient visualization concepts are highly dependent on specific applications and are therefore not discussed further in this paper. The visualization must be individually adapted to end-user needs to achieve the best possible decision support.
5. Application of the SHS
The application scenario involves evaluating drone characteristics and limitations based on simulation results. This evaluation is important in SPP for drones to assess the extent to which new application scenarios can be covered by existing drones in the portfolio. From this, conclusions can be drawn about the necessary further developments and the engineering effort required. At the same time, this scenario is also relevant for drone end users to assess whether the existing drone is suitable for a specific mission objective. Both groups typically have no in-depth expertise in using drone simulations. Since end users are more readily available than decision-makers, allowing larger samples to be tested, the evaluation was carried out with end users. One common application for drones is disaster management (Reference Stampa, Sutorma, Jahn, Thiem, Wolff and RöhrigStampa et al., 2021). End users from the disaster management domain were therefore selected, and additional simulators were integrated into the demonstrator for this target group. To apply the concept of the SHS, a demonstrator is implemented, integrating three simulators. In the following, the integration is illustrated based on the robotic simulation Gazebo as an example.
5.1. Demonstrator setup integrating robotic simulation
For simulator parameterization by end users, a web application was developed, providing a central input mask that combines inputs and specifications for all integrated simulators. The structure is visualized in Figure 4. The input mask is divided into four sections. As there is a certain overlap between the data to be entered for the discipline-specific simulators, the first field at the top can be used to add data relevant to multiple simulators. Considering an engineering example, the ambient temperature of a pump is relevant for both fluid dynamics and heat transfer simulation (Reference Versteeg and MalalasekeraVersteeg & Malalasekera, 2007). The coupling effects reduce the complexity of simulator parameterization and speed up the parameterization process. Below this, there are individual input fields for each simulator where data is entered that is only used within that simulator, fields 2-4.
Structure of the GUI for parameterization of multiple discipline-specific simulators

Figure 4 Long description
The image shows a graphical user interface (GUI) for parameterization of multiple discipline-specific simulators. The GUI is divided into four sections. Section 1 is labeled simulator-independent inputs and includes fields for User Name, Date, Time, and Request Name. Section 2 is labeled simulator-specific inputs for flooding simulation and includes fields for Deepwave Input, Rainfall Area, Rainfall Event Name, DTM resolution, Rainfall Duration, and Rainfall Intensity. Section 3 is labeled simulator-specific inputs for wildfire simulation and includes fields for Spark Input, Simulation Area, Latitude, Longitude, Direction Vector X, Direction Vector Y, Weather Data, Temperature, Humidity, and Start Conditions. Section 4 is labeled simulator-specific inputs for robotic simulation and includes fields for Gazebo Input, Simulation Area, Latitude, Longitude, Direction Vector X, Direction Vector Y, Wind Conditions, Wind speed, Wind direction, Simulation Configuration, and Simulation Speed.
The parameters can be inserted in end-user-friendly formats. Considering the example of drone simulation in Gazebo, the GUI allows entering the wind direction in degrees. The simulator requires the wind direction as a three-dimensional vector. The x-axis points east, the y-axis points north, and the z-axis points orthogonally upward from the Earth’s surface (Reference Koenig and HowardKoenig & Howard, 2004). This format is not intuitive for users without simulator expertise. Therefore, the inserted format deviates from the format interpretable by the simulator. Thus, the inserted parameters are processed and tailored to the simulators.
The pre-processing sub-workflow is visualized in Figure 5, implemented in the modeling environment Altair RapidMiner AI Studio (https://RapidMiner.com/). The subprocess “Extract parameters” is used to retrieve all parameters inserted in the GUI and to store them in variables. These parameters are further processed in the operator “Create routes”, which calculates the route alternatives. The following process “Set configuration” writes the calculated routes and further parameters into the configuration files on the remote server, where the simulation is run. The last step of pre-processing is to trigger the script execution on the remote server. That is implemented in the “Execute simulation” process. This triggers the execution of the simulation and all simulation results are stored on the remote server.
In the post-processing workflow, relevant data is first extracted from simulation results. This step is followed by homogenizing data formats to perform further calculations, sort data, or cluster it. For sorting and clustering, criteria must be specified to provide effective decision support. Criteria are therefore selected in the workflow to influence data sorting accordingly. Finally, the sorted and aggregated data is output in an open data format, such as json or csv (Reference McKinneyMcKinney, 2013), to ensure easy further processing. Further processing steps include, for example, visualizing the output data. For the example of drone simulation, the results are visualized on a map in the form of routes the drone flies along. Key figures such as flight duration and battery status of the drone are displayed along the route, which can be used to support decision-making.
Exemplary data pre-processing workflow for robotic simulation

The demonstrator testing confirms the functionality of the SHS. All functional requirements listed in Table 2 are fulfilled. Only the scalability requirement can be verified to a limited extent, as only three simulators were integrated. However, due to the modular expandability of the GUI and the possibility of adding further parallel workflows, scalability can be considered as given, provided that a sufficiently powerful workflow management tool is available. Regarding RQ1, it can be summarized that for users without in-depth expertise, parameterization via a complexity-reduced GUI and the visualization of aggregated simulation outputs are relevant building blocks at the beginning and end of the workflow. Technically, pre- and post-processing are crucial to bridge the gap between end-user needs and simulator requirements, e.g., by changing formats and calculating indicators.
5.2. Evaluation design
To evaluate the SHS and answer RQ2, nine emergency personnel at command level used the demonstrator system in the evaluation scenario, as shown in Figure 6. They were confronted with a scenario in which a drone was needed for exploration. Analogous to SPP, where participating decision-makers must evaluate the performance of existing products in relation to new application scenarios, users had to estimate how many drones were needed for the exploration mission and which of the available drones were suitable for the mission. To do this, they configured the simulator parameters via the GUI in accordance with their task. The workflow then ran, and the users discussed the visualized results to finally make the decisions. Subsequently, all participants were asked to anonymously rate their agreement with the following four statements, derived under consideration of RQ2, with Likert-type responses of 1 to 10. A rating of 1 indicates no agreement, a rating of 10 indicates complete agreement.
Use of SHS by end users for evaluation

Figure 6 Long description
The image consists of four separate elements: one photo, one diagram, and two illustrations. The elements are arranged side-by-side to show the process of using simulation data in strategic product planning. The first element is a photo showing a person working on a computer. The second element is a diagram showing a form with various fields to be filled out. The third element is an illustration showing a cityscape with a drone flying over it. The fourth element is an illustration showing a person wearing a virtual reality headset. The purpose of combining these images is to illustrate the steps involved in using simulation data to inform strategic planning decisions. The main subject of the image is the process of using simulation data in strategic product planning. The first element highlights the initial exploration and parameterization phase. The second element shows the pre-processing phase where data is prepared for simulation. The third element illustrates the simulation phase where the data is used to model and analyze different scenarios. The fourth element shows the visualization phase where the results of the simulation are presented to inform decision-making. The color scheme in the illustrations is used to convey different stages of the process, with blue representing the initial stages and green representing the final stages.
-
1. The SHS allows for parameterizing the simulators even without in-depth expertise.
-
2. By integrating the simulators into workflows, I would be more likely to use simulators in an operation, as different simulation models and parameterizations can be executed automatically.
-
3. The graphical user interface for using various simulation models simplifies use in operations.
-
4. Visualization enables quick understanding of simulation results and supports decision-making during deployment.
5.3. Evaluation results
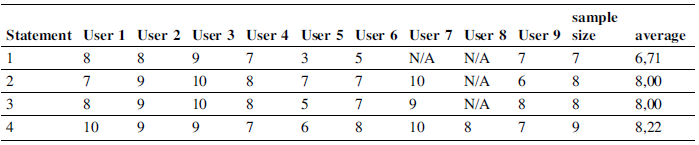
The evaluation results are listed in Table 3. The first statement received the lowest level of agreement compared to the others. However, the average value of 6.71 shows that there is still a tendency to agree with the statement, i.e., the SHS allows simulators to be parameterized even without expertise. A brief introduction to the functions of the individual simulations, for example, an explanation of inputs, processing, and outputs, simplifies use and creates a better understanding among users. Nevertheless, the ratings for the second statement show that end users are more likely to consider using the simulations in practice because of integration. The responses to the third and fourth statements highlight the importance of user interfaces when the simulators are operated by users from other disciplines. The input GUI is crucial for reducing the complexity of parameterization. In addition, visualization of the simulation outputs tailored to the target group is necessary, which is not described in detail in this paper, to make the results useful for decision support. Concerning RQ2, the high average level of agreement with all statements shows that integrating simulators into workflows, including pre- and post-processing, increases simulator usage among users without in-depth expertise in the discipline-specific simulators. This is also confirmed by qualitative feedback from end users. Discussions have shown that simplified operation via the GUI is what makes it possible for end users to use the simulators in the first place. Without this setup, they would rely primarily on experience and would not have a quantitatively sound basis for discussion.
End-user evaluation

6. Discussion
The SHS differs from the frameworks for multidisciplinary simulation presented at the outset, enabling users without in-depth expertise to use discipline-specific simulators, while the frameworks described in related work are designed to link simulation results from different simulators. To this end, elements of the approaches described above were taken up and consistently geared towards application by end users without in-depth expertise. Decision-makers in SPP can thus make data-based decisions and support the exploration of the problem space through parameter studies based on engineering simulation data. The SHS represents an end-to-end approach, including data entry, pre-processing, automated simulation, and post-processing, thereby ensuring user-friendliness for users without in-depth expertise. It can be expanded by integrating additional simulators into workflows and adding further fields for simulator-specific data in the GUI. In addition, the pre- and post-processing operators can also be extended. For example, additional processing steps with Artificial Intelligence applications can be integrated into the workflows, enabling the investigation of larger amounts of data and more diverse scenarios in SPP. The SHS thus provides a way to make simulation available to users without in-depth expertise, assuming a previous integration by experts. This can be applied to many use cases. The SHS can be used not only in SPP to explore problem spaces and investigate limitations of systems, but also in other areas of the company, such as in consulting situations in sales. The SHS can also be provided to customers as an additional service. This allows atypical application scenarios to be simulated before actual implementation and prevents unintended product misuse that could lead to damage to the product or injury to users.
Nevertheless, limitations of the SHS must be considered. In contrast to co-simulation, the simulations in the SHS run in separate workflows, meaning that no data is exchanged between the simulations. In principle, it is also conceivable to integrate a co-simulation approach into a workflow. However, greater complexity compared to a simple simulator creates new challenges, which is why further investigations are needed in this regard. Furthermore, it must be considered that every step of a simulation workflow is subject to uncertainty (Reference Fujimoto, Bock, Chen, Page and PanchalFujimoto et al., 2017). The automatic processing of data in a series of sub-processes multiplies uncertainties that exist at the outset. The uncertainty influences decision-making and, therefore, cannot be ignored in terms of reducing complexity. For this reason, the appropriate representation of uncertainties must be considered when developing visualization concepts. Finally, it must be noted that the use of simulators in the SHS requires initial integration. Even if simulators are executed in SPP the discipline-specific experts must ensure the integration of the simulators and the appropriate configuration of workflows and GUIs at the end of an engineering process so that they can then be used by users without in-depth expertise.
7. Conclusion
In this paper, processing components for automated simulation in strategic product planning using multidisciplinary simulators are presented. The Simulator HyperSuite enables decision makers to parameterize and execute simulations without in-depth expertise. The input data is entered by users in a central GUI, supplemented by measurement data, and made available for simulation by pre-processing. Outputs are aggregated, sorted, and finally visualized after post-processing to support decision makers. The approach makes simulation data from completed engineering processes usable in strategic product planning to explore problem spaces and support idea evaluation for new products through parameter studies. As a result, challenges resulting from the lack of domain-specific experts and time pressure through shorter innovation cycles can be overcome, and multidisciplinary data from engineering processes is leveraged for future products with low additional effort. This boosts innovative strength and thus improves a company’s competitive position. In the future, scalability, suitable visualization concepts, and the consideration of uncertainty visualization must be further investigated to ensure optimal decision support with data resulting from the SHS.
Acknowledgement
The research leading to these results has received funding from the European Union’s Horizon Europe Program under the CREXDATA Project, grant agreement n° 101092749.





 Open access

