


Introduction
SARS-CoV-2 transmission occurs primarily through respiratory pathways [Reference Wang1], while other transmission routes are of minor importance [Reference Meyerowitz2]. Nevertheless, many SARS-CoV-2-infected individuals release virus or viral fragments in their stool, enabling reliable detection in wastewater [Reference Chan3, Reference Cheung4]. This has led to the widespread establishment of monitoring SARS-CoV-2 through wastewater surveillance systems.
Several studies have used faecal shedding data in combination with other information to predict SARS-CoV-2 incidence or prevalence from wastewater data [Reference McMahan5, Reference Miura, Kitajima and Omori6]. These models rely on faecal shedding parameters to link the number of infected individuals with the amount of viral RNA detectable in wastewater. However, many studies have made assumptions or used shedding parameters from individual papers, such as the proportion of infected individuals who shed the virus, the timing of peak shedding, and the duration of shedding data derived from other clinical data [Reference Wölfel7]. Therefore, it is crucial to make shedding parameters available that integrate the current knowledge to refine wastewater-based models.
The average shedding of SARS-CoV-2 RNA in stool can be formally quantified using the following parameters:
-
1. Proportion of patients with detectable viral RNA in stool – the fraction of diagnosed SARS-CoV-2-infected individuals who have viral RNA detectable in stool.
-
2. Decline over time – how fast does the positivity rate (PR; proportion positive) of patients with initially detectable viral RNA in stool decline over time and after symptom onset.
-
3. Viral load kinetics – the timing of the magnitude of viral RNA in stool; and: what is the temporal sequence of the shedding peak in stool and respiratory samples respectively?
-
4. Shedding duration – the maximum duration of faecal viral shedding time (VST).
Several reviews have addressed some of these questions and parameters [Reference Chan3, Reference Johnson8–Reference Merola, Armelao and de Pretis12]. However, many reviews did not apply standardized criteria for key factors (e.g., requirement of a systematic approach to stool sampling, considering the duration of follow-up, etc.). Additionally, some did not address key limitations of the underlying studies. Most reviews have made statements about the proportion of patients (or persons with SARS-CoV-2 infections) of whom viral RNA can be detected in the stool [Reference Chan3, Reference Mishra9–Reference Merola, Armelao and de Pretis12], and the maximum duration of virus in stool [Reference Chan3, Reference Gupta11, Reference Yan13–Reference Van Doorn15]. Two studies tried to characterize the dynamic aspects [Reference Miura, Kitajima and Omori6, Reference Gastine16], and none have covered all aspects named above. In addition, the use of specific population subsets or differing methodologies of the underlying studies has led to inconsistent findings, particularly regarding how long individuals shed viral RNA in stool.
Our review aims to synthesize available evidence on the following parameters:
-
(1) Proportion of persons infected with SARS-CoV-2 who shed viral RNA in the stool.
-
(2) Among individuals with faecal shedding:
-
(a) Decline of PR over time.
-
(b) Dynamic course of viral RNA in stool over time.
-
-
(3) Maximum duration of faecal viral shedding.
Methods
Information sources and search strategy
We searched PubMed using a combination of MeSH terms and keywords linking the three categories: population (SARS-CoV-2-infected individuals), sample material (stool), and parameters (including positivity rate, kinetics, and viral load) using the AND operator (Appendix; Table A1). Additionally, we screened a public repository on shedding data [Reference Wang17] to identify further relevant studies.
Inclusion and exclusion criteria
We included studies in which SARS-CoV-2 infections were confirmed via positive respiratory swabs prior to stool sample collection. Only studies that began collecting stool samples during the first week after symptom onset. Furthermore, we selected studies that collected at least three stool samples for the majority of participants.
To calculate the proportion of SARS-CoV-2-infected individuals in whom SARS-CoV-2 was also detected in stool (objective 1), only studies that reported this indicator based on the number of participants, rather than the number of samples, were included. To estimate the proportion of SARS-CoV-2-infected individuals with positive stool (trend of the PR) over time (objective 2a), studies that involved SARS-CoV-2-infected individuals who regularly provided stool samples over a period of time, were included. To calculate the shedding dynamic (of the PR, objective 2a, or viral load, objective 2b), we included only studies that specified the day of sample collection with respect to symptom onset (and not, e.g., with respect to hospital admission), as well as studies that incorporated SARS-CoV-2-negative stool samples in their proportion of patients with faecal shedding or in their analysis of viral shedding kinetics. To calculate the maximum VST of the detectable virus in stool samples (objective 3), only studies that provided duration of VST, with a minimum follow-up period (at least 2 weeks), in time after symptom onset were included.
We excluded studies with unclear methodologies, such as studies that lacked information on the number of stool samples taken per patient, as well as studies with vague patient selection criteria. Additionally, during the screening process, studies focusing on animals and those that were not written in English or German were disregarded.
Selection of studies
We imported the identified studies into EndNote for de-duplication and transferred the remaining studies to Microsoft Excel (Microsoft Corporation, Redmond, WA, USA). One author (S.A.) reviewed the titles and abstracts of the identified studies according to the inclusion and exclusion criteria and classified them as preliminarily included, excluded, or uncertain. Studies initially classified as ‘uncertain’ were discussed with a second author (U.B.) until all conflicts were resolved. Full texts were then carefully examined by (S.A.) and again reclassified as included, excluded, or uncertain, and remaining uncertainties were resolved through discussion with (U.B.).
Data extraction
For each included study, we systematically extracted the following details: author(s), journal, publication year, title, main findings, including the proportion of infected individuals with shedding, PR over time, shedding kinetics, and duration of shedding. One reviewer (S.A.) extracted the data while a second reviewer (U.B.) checked it for accuracy to ensure consistency and reliability.
Calculation of key parameters
For the three study objectives, we calculated the proportion of infected individuals who also shed virus in the stool, the PR over time, the kinetics of the viral load, and the VST. Details and the related statistical analysis are summarized in Table 1.
Summary of the calculation of key parameters

Results
The PRISMA flow chart [Reference Page18] outlines how included studies are selected, as illustrated in Figure 1. Out of the 644 identified studies, 33 primary studies were included in this review. Most studies were conducted between January 2020 and August 2021, with two later studies in February 2021–January 2022 [Reference Khemiri19] and 2023 [Reference Wannigama20]. Participants of studies exclusively conducted in 2020 were not vaccinated, or vaccination was not reported. Similarly, participants of studies partially or entirely conducted in 2021, that is, when vaccines had become increasingly available, were primarily not vaccinated or vaccination was not reported, with few exceptions (Appendix; Table A2). Notably, the study that was conducted in 2023 involved fully vaccinated participants, mostly without a booster, with a 100% detection rate of SARS-CoV-2 RNA in stool [Reference Wannigama20].
PRISMA flow chart depicting the screening process for filtering suitable primary studies for the review.

Objective 1: Proportion of persons infected with SARS-CoV2 who shed viral RNA in the stool
Out of the 33 analysed studies, 32 provided data on the proportion of SARS-CoV-2-infected individuals with detectable viral RNA in their stool (Figure 2). The studies included between 5 and 280 participants (median = 45). Furthermore, the proportion of SARS-CoV-2-infected persons with faecal shedding varied from 18 to 100%. The mean proportion across studies was 64% (standard deviation = 26%), reflecting substantial heterogeneity. Because smaller studies tended to report higher proportions, we also calculated a pooled proportion of 54% (995 of 1847 patients; 95% CI = 52–56%, Figure 3).
Proportion of individuals with SARS-CoV-2 infection (total cases) in whom viral RNA was detected in stool samples (positive cases). Squares represent the effect estimate for each study (the proportion of SARS-CoV-2-infected individuals with faecal shedding of viral RNA), with larger squares indicating larger sample sizes. Note: This figure provides a descriptive summary of detection rates across studies without meta-analytical models. The Exact (Clopper–Pearson) method was used to calculate 95% CIs.

Proportion of patients with detectable SARS-CoV-2 in stool across three categories: all studies, studies only in children (Of these, six targeted only children [Reference Khemiri19, [Reference Han21]–Reference Hua25] and three studies included children and adults [Reference Wannigama20, [Reference Pace26], Reference Holm-Jacobsen27]), and studies in adults (23 of these addressed adults only [Reference Wölfel7, [Reference Chen28]–Reference Zuo49]). The x-axis displays the study reference. The left y-axis, corresponding to the bars, represents the quantity of patients per study, and the right y-axis, corresponding to the red dots, indicates the proportion of SARS-CoV-2-infected individuals testing positive for the virus in stool. Orange bars in the children’s and adults’ panels mark studies that involved both children and adults and contributed stratified data for the respective age category. The pooled proportion is displayed by the horizontal grey line: 54% for all studies (top panel), and 61% and 53% for the children’s and adults’ panels respectively.

Pooled proportions were higher in children (61%) compared with adults (53%) (p-value = 0.02), indicating a significant difference in detection rates between the age groups. Detection rates stratified by clinical severity ranged from 35% in asymptomatic individuals to 42% in those with severe illness, without significant differences (p-value = 0.49; p-value for trend = 0.16). Although most studies contribute to both subgroup analyses, stratification by age and by clinical manifestation highlights different aspects of the population. Age-based stratification includes all reported individuals, regardless of symptom status or illness severity. Detailed subgroup results are shown in Table 2 and Figure 3.
Proportion of SARS-CoV-2-infected individuals shedding viral RNA in stool by subgroup

Objective 2a: Viral shedding dynamics: Positivity rate over time
For this analysis, we included data from five studies (466 stool samples through day 21; Figure 4). The pooled PR exceeded 75% in the first week. According to the trend analysis, 50% of the people who initially excreted SARS-CoV-2, still excreted SARS-CoV-2-positive stool on day 22 after symptom onset, that is, corresponding to a period of approximately three weeks. The Weibull model predicted a decline below 5% by day 65. Study-level variability was observed, particularly in early and late time points, but the overall pooled trend was robust.
Pooled proportion of SARS-CoV-2 RNA-positive stool samples by day since symptom onset across five studies [Reference Wölfel7, [Reference Khemiri19], [Reference Kujawski29], [Reference Lo31], Reference Arts35]. X-axis shows days after symptom onset; Y-axis shows pooled PR. The observed PR from five studies are displayed as blue markers with distinct shapes. The solid blue line represents the fitted Weibull decay curve to the daily weighted PR computed from pooled data. The shaded blue ribbon depicts the 95% CI derived from 5,000 bootstrap replicates. A vertical dashed line at day 21 marks the end of empirical data; the pale-blue shaded area to the right denotes the extrapolation range.

Objective 2b: Viral shedding dynamics: Kinetics of viral load over time
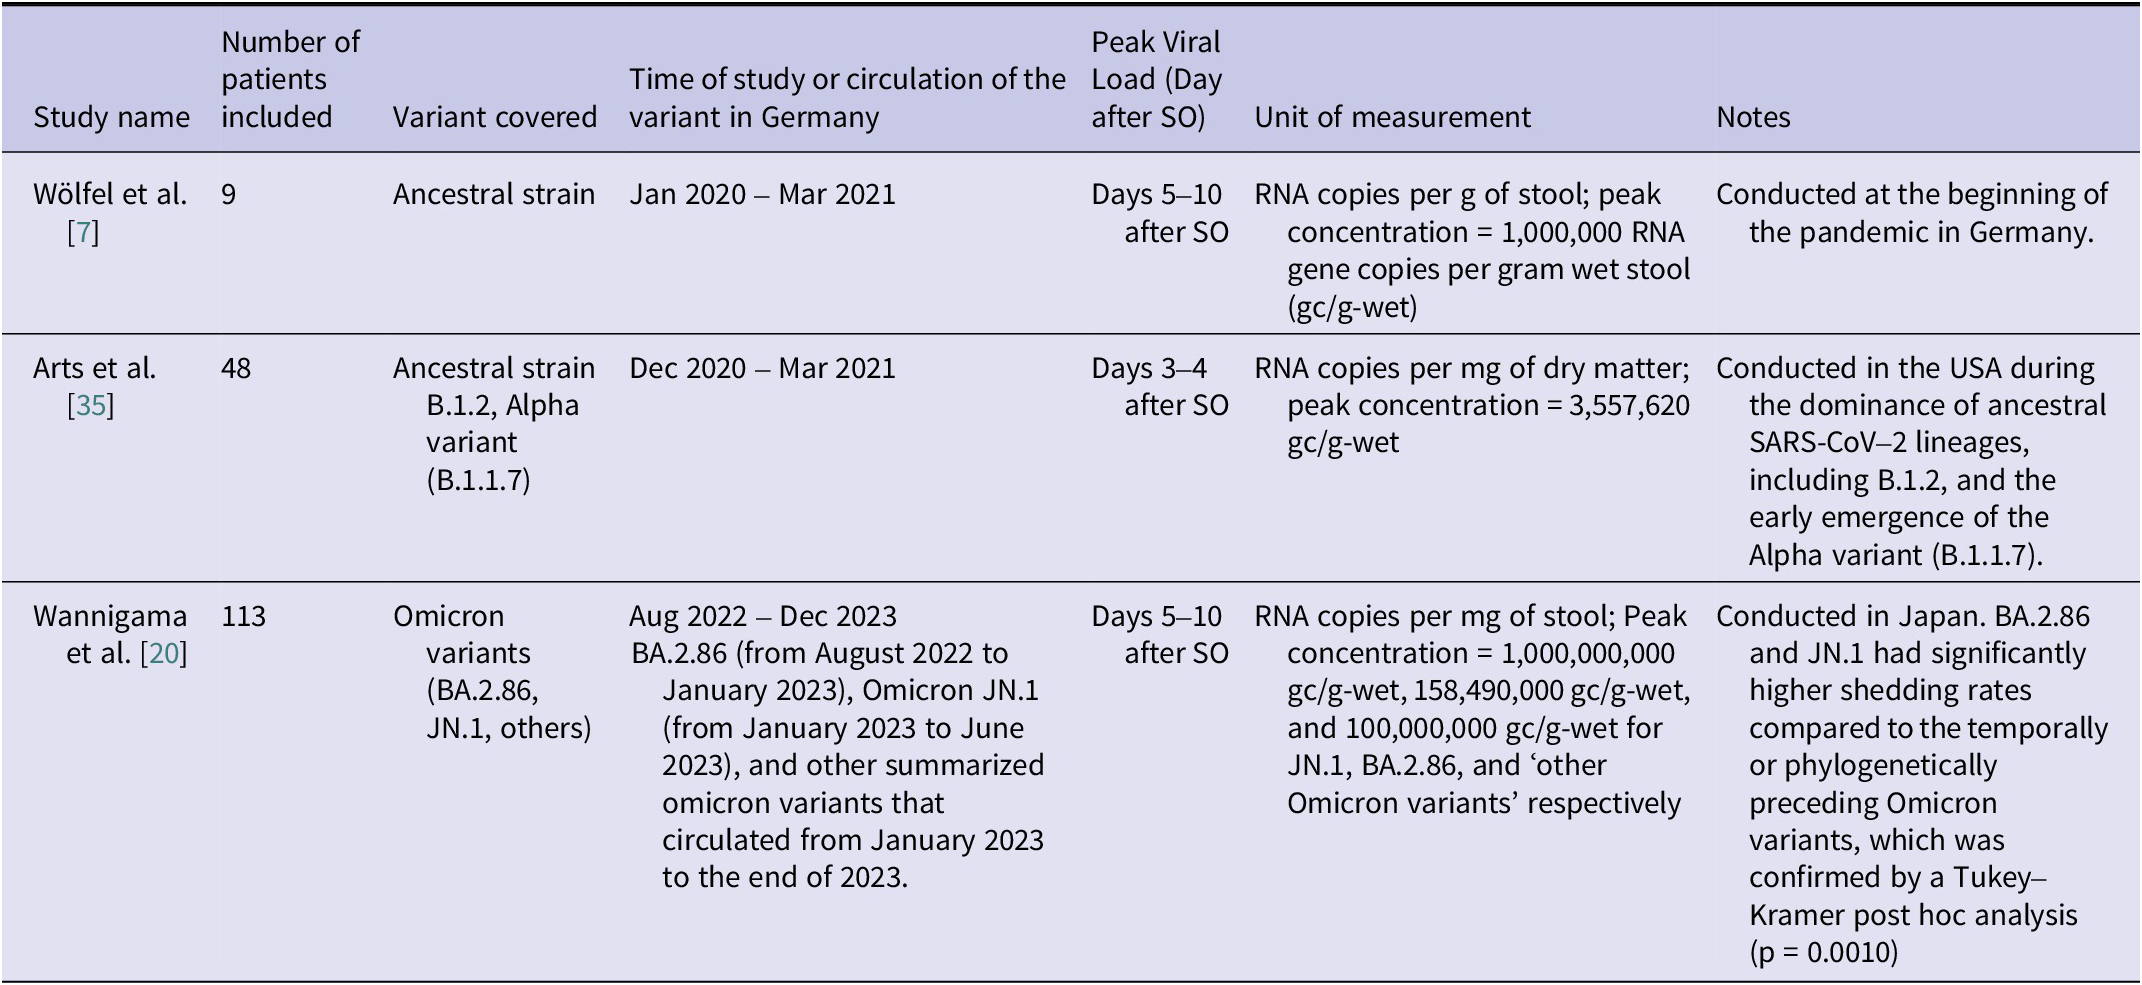
We extracted the information regarding the amount of the viral load in stool from only three studies that provided robust data [Reference Wölfel7, [Reference Wannigama20], Reference Arts35] (Table 3). Figure 5 shows normalized viral kinetics by days after symptom onset. For reference, viral load kinetics in the upper respiratory tract (URT) from a separate study are also displayed (green squares) [Reference Jones50], typically preceding the faecal kinetic curve by 3–10 days. Sharp peaks are noticed across the different SARS-CoV-2 variants included in each study, with peaks occurring at day 3 [Reference Arts35], 7 [Reference Wölfel7], and 9 [Reference Wannigama20] respectively.
Comparison of Peak SARS-CoV-2 Viral Load Kinetics Over Time and Variants: Insights from Three Studies; SO = symptom onset

Note: Study [Reference Arts35] used dry weight, while the other two studies [Reference Wölfel7, Reference Wannigama20] used wet weight. To harmonize the units, we converted dry to wet weight based on a wet mass of 128 g/person/day, corresponding to a dry mass of 29 g/person/day [Reference Rose59].
Normalized viral load in stool (expressed as a percentage of the maximum value within each data series in stool and upper respiratory tract (URT) samples from individuals infected with SARS-CoV-2, plotted by days after symptom onset. The circles represent stool viral load data derived from three studies [Reference Wölfel7, [Reference Wannigama20], Reference Arts35]. Blue circles correspond to study [Reference Wölfel7] and reflect the ancestral strain. Pink circles represent data from study [Reference Arts35] and include both ancestral and Alpha variants. Yellow, grey, and orange circles originate from the study [Reference Wannigama20] and represent different Omicron variants. Green squares show URT viral data for comparison [Reference Jones50]. Solid and dashed grey lines represent non-parametric approximations of faecal and URT viral kinetics respectively. These lines were included for visual comparison only and were not derived from formal statistical fitting. The y-axis presents normalized viral load values on a linear scale.

Numerous studies have examined the temporal kinetics of virus shedding using Ct values [Reference Khemiri19, [Reference Pace26], [Reference Holm-Jacobsen27], [Reference Kujawski29]–[Reference Lo31], [Reference Vaselli43], [Reference Wang44], [Reference Young46]–Reference Zuo49], Kaplan–Meier plots [Reference Scarselli24, [Reference Hua25], Reference Shi42], or Weibull regressions [Reference Sun51]. In studies that used Ct values and therefore did not report a direct quantitatively interpretable viral load, SARS-CoV-2 RNA was found to be detectable in almost all patients in the first week after symptom onset. After the second week of symptom onset, Ct values increased rapidly, indicating an exponential decrease in viral load. Hence, these studies support results of the three studies illustrated in (Figure 5).
Objective 3: Duration of SARS-CoV-2 virus shedding in stool
The duration of detection of SARS-CoV-2 RNA in stool among SARS-CoV-2-infected people who shed the virus at all has been measured in several studies. Some have stopped taking faecal samples in individual patients after obtaining one or mostly two, negative samples. Several studies have followed up patients for the time period they were hospitalized, which favours obtaining samples from patients with more severe disease, whose stools were perhaps more likely to still be positive for a longer time than among patients with milder disease. Thus, most studies did not sample their entire patient cohort (or even close to the entirety) systematically for the same extended period of time. Due to limitations in the available studies, we have refrained from calculating a summary value. The included 25 studies followed between 3 and 173 patients (median = 13), (Table A3: 13 studies with systematical sampling; Table A4 (12 studies without systematic sampling), (see Appendix)). While the majority of studies reported shedding durations ranging from 2 weeks to 12 weeks (Figure 6), one exceptional study documented a considerably longer shedding period [Reference Natarajan41]. This study monitored 60 patients for 28 weeks (7 months), collecting an average of three stool samples per patient. After 7 months, SARS-CoV-2 RNA was detected in 4% of samples, but it is not clear if these patients had provided stool samples and tested positive continuously throughout the entire 7 months. Out of the 25 studies, 20 provided a direct comparison of respiratory and faecal shedding. Among those, 17 studies found that shedding in the respiratory tract stopped before faecal shedding ceased [Reference Wölfel7, [Reference Khemiri19], [Reference Han21], [Reference Liu22], [Reference Holm-Jacobsen27], [Reference Lavania30]–[Reference Zheng34], [Reference Deng36], [Reference Lin39]–[Reference Natarajan41], [Reference Vaselli43], [Reference Wang44], Reference Sun51], while three studies found that shedding in the respiratory tract lasted longer than in stool [Reference Hua25, [Reference Kujawski29], Reference Zhang48].
Maximum duration of SARS-CoV-2 stool shedding reported across the 24 studies.Note: one exceptional study [Reference Natarajan41] providing positivity rates up to seven follow-up months is not considered here, for more details see the ‘Results’ section.

Discussion
This review aimed to examine the frequency, dynamics, and duration of SARS-CoV-2 RNA shedding in the stool of infected individuals. We found that approximately half of the people infected with SARS-CoV-2 shed viral RNA in the stool. While significant differences were identified between age groups, no significant differences were found when stratifying by clinical severity. We estimate that among SARS-CoV-2-infected individuals who shed SARS-CoV-2 in their stool, about half of these do so for 22 days, with a peak viral load observed during the first or early second week after symptom onset. Maximum VST is reported to range between 2 and 12 weeks.
Proportion of persons infected with SARS-CoV2 who shed viral RNA in the stool
Our estimated proportion of SARS-CoV-2-infected persons, who shed viral RNA in their stool (54%), is comparable with findings from four systematic reviews estimating between 48 and 55% [Reference Johnson8, Reference Mishra9, Reference Gupta11, Reference Morone52], while three others reported proportions farther away (35% [Reference Díaz10], 43% [Reference Zhang14], and 66% [Reference Chan3] respectively). Differences between reviews may be attributed to variations in the inclusion criteria of the included studies. At any rate, the studies included in our review are remarkably heterogeneous, stemming from different study designs, patient populations, and laboratory methods used during the data collection process. Moreover, the proportion of SARS-CoV-2-infected persons shedding viral RNA in the stool seems to be associated with the size of the study. An obvious observation is the higher proportion among the smaller studies, which may reflect publication bias, because studies with negative findings of SARS-CoV-2 in the stool might be published less often.
Further stratification by clinical severity revealed detection rates of 35% among asymptomatic individuals, 39% among symptomatic non-hospitalized individuals, 39% among hospitalized individuals with mild to moderate symptoms, and 42% among those hospitalized with severe illness. These differences were not statistically significant (chi-square test, p-value = 0.49), suggesting no clear link between symptom severity and stool-based viral RNA detection. A meta-analysis reported a higher proportion of faecal RNA detection in patients with more severe disease (60% vs. 47% for mild or moderate cases), although the between-group differences were also not statistically significant [Reference Wong53]. Similarly, another meta-analysis reported no significant difference in faecal RNA positivity between severe and non-severe cases (odds ratio = 2.009, p-value = 0.079) [Reference Zhou54].
The majority of included studies in our review were based in clinical or hospital settings, which likely overrepresent individuals with more severe disease. Asymptomatic or mildly symptomatic individuals – who may not seek medical care or be routinely tested – are likely underrepresented.
While the lack of significant association in our findings does not rule out the possibility of a relationship between severity and viral shedding, factors such as the timing of sample collection could influence detection rates. For example, hospitalized patients may have their samples collected later in their illness, potentially leading to an underestimation of shedding proportion.
Although we did not conduct a formal meta-analysis or funnel plot to assess publication bias, it is important to note that studies with low or negative detection rates may have been less likely to be submitted or accepted for publication, potentially inflating the overall PR estimates. Future studies might recruit participants using community-based strategies, such as targeting households with a positive primary case, to obtain more accurate estimates with minimal bias and assess the true burden of stool-based viral RNA shedding across different clinical presentations.
The proportion of individuals with detectable SARS-CoV-2 RNA in stool was higher in children (61%) than in adults (53%; p = 0.02). Although two systematic reviews reported higher detection rates in children, they concluded that the difference was not substantial [Reference Díaz10, Reference Zhang14]. Three other systematic reviews and meta-analyses found considerably higher detection rates in children (86–89%) [Reference Xu55–Reference Benvari, Mahmoudi and Mohammadi57], compared with 54% in adults [Reference Cheung4], although statistical significance was not discussed. This finding is noteworthy, as children have been reported to shed significantly less SARS-CoV-2 in respiratory samples compared with adults [Reference Jones50, Reference Euser58]. It remains unclear why viral traces cannot be detected in stool samples from many infected individuals. Possible reasons include the sensitivity of the detection methods, timing of collection of the stool sample, prevailing immunity at infection, or biological variation among infected hosts.
Viral shedding dynamics: (a) positivity rate over time, after symptom onset
Our results indicate that half of the people who shed viral RNA in the stool will do so for about 22 days, which equals the median clearance reported in a previous systematic review [Reference Díaz10]. Additionally, these findings align with another early systematic review by Morone et al. (2020) with a somewhat shorter median duration of 19 days [Reference Morone52]. However, in contrast to our review, Morone et al. included more than 25 case reports of patients with frequently mild illness and/or follow-up periods that were not long enough to meet the inclusion criteria of at least two weeks in our review. Both aspects may have led to a slightly shorter PR over time compared with our study.
In general, a common bias in larger studies is the focus on hospitalized patients, leading to an overrepresentation of more severe cases who stay in the hospital for a longer time and might be more likely to shed the virus longer in stool. Upon preparation of a review, such studies may potentially lead to a certain overestimation of shedding duration.
Viral shedding dynamics: (b) quantity (viral load) over time (kinetics)
Due to the limited number of robust studies, only three studies were suitable to analyse the (quantitative) kinetics of the viral load [Reference Wölfel7, [Reference Wannigama20], Reference Arts35]. Results suggest that viral shedding may peak during the first or early second week after symptom onset. This pattern applies to symptomatic individuals, as asymptomatic cases lack, by definition, a defined onset of symptoms. The observed time lag between peak shedding in the URT and stool – ranging from several days to about one week – may reflect the time needed for the virus to be swallowed, perhaps infect intestinal cells, and be excreted (Figure 5).
The three studies were conducted at different points in the pandemic, capturing periods with different dominant SARS-CoV-2 variants. We report normalized values because the absolute quantities of viral load cannot be easily compared across variants due to differences in methodology and measurement. Notably, the duration of sample collection in one study spanned several consecutive periods with different dominant Omicron variants [Reference Wannigama20]. The authors noted that a significantly higher number of genome copies were measured for the BA.2 and JN.1 variants compared with those that preceded them chronologically or phylogenetically.
These findings have direct relevance for wastewater-based surveillance. The continued detectability of viral RNA in stool – despite vaccination, prior infections, and viral evolution – indicates that wastewater monitoring remains a feasible and informative tool. In addition, understanding shedding kinetics helps interpret wastewater signals more accurately – for example, in differentiating between ongoing transmission (incidence) and residual signal from prolonged shedding (prevalence). Clarifying this distinction is critical for accurate public health interpretation. Together, these insights support the continued value of wastewater surveillance in tracking SARS-CoV-2.
Duration of SARS-CoV-2 virus shedding in stool
Our review also investigated the maximum duration of SARS-CoV-2 viral shedding in stool across the included studies. Again, study methodologies varied widely. For many study investigators, systematic follow-up was a challenge – for example, when hospitalized patients were clinically fit for discharge but may still have had detectable viral RNA in their stool. Although many studies applied a systematic sampling approach – often defining the end of shedding after two consecutive negative stool samples – several others predefined a fixed period for sample collection regardless of patient shedding status. This design choice may have led to truncation of the actual shedding duration. For instance, Young et al. collected stool samples only during the first two weeks following study enrolment, with the maximum reported VST being 9 days [Reference Young46]. Lo et al. followed participants for one month with a maximum VST of 19 days [Reference Lo31], while Vaselli et al. limited collection to three weeks, reporting a maximum VST of 21 days [Reference Vaselli43]. These predefined periods may have missed longer shedding durations. Nevertheless, it is noteworthy that two studies using a systematic sampling approach – defining the end of shedding after two consecutive negative stool samples – still reported relatively short maximum durations of shedding: 14 days [Reference Khemiri19] and 17 days [Reference Scarselli24]. Hence, because of the methodological differences, the range of reported maximum durations of faecal shedding (2–12 weeks) is not surprising. Interestingly, one study detected SARS-CoV-2 RNA in 4% of stool samples after 28 weeks [Reference Natarajan41]. Compared with the other studies, this duration is exceptionally long. In this study, an average of 3 stool samples per patient suggests that patients were not closely followed up. Without longitudinal follow-up of the same patients, it is difficult to determine whether the detection of SARS-CoV-2 RNA in stool after such a long time reflects continuous shedding from a single infection or another infection acquired during the study period. Whole-genome sequencing might have helped in validating the results. Regarding the question of the sequence of respiratory and faecal shedding, there seems to be a consensus that viral shedding in stool starts later and lasts longer than in the respiratory tract.
This review has a number of limitations. These include the limited generalizability of our findings due to heterogeneity among the included studies and likely a substantial publication bias. We did not account for several factors that could be related to faecal viral shedding, such as demographic variables (e.g., sex and ethnicity), pre-existing conditions, and differences between symptomatic and asymptomatic individuals. We did take the vaccination status into consideration; however, as the vast majority of studies were conducted in 2020, vaccination was not an issue, as vaccines were not available yet in 2020. Given the limited availability of high-quality studies, conclusive statements regarding differences in shedding kinetics among SARS-CoV-2 variants cannot be drawn.
For the research questions explored in this review, we propose a number of recommendations to enhance the quality of future studies (Table 4).
Recommendations for enhancing the quality of future studies on SARS-CoV-2 stool shedding

Conclusions
Our study suggests that viral shedding of SARS-CoV-2 can be detected in stool samples of approximately 50% of infected individuals. Among those with detectable viral shedding, the PR decreases to about 50% after three weeks post-symptom onset, with viral load peaking between days 3 and 9 after symptom onset. The maximum viral shedding duration may last up to 12 weeks. Methodological limitations, such as non-systematic data collection, unclear methodologies, and inadequate reporting of results, hinder the drawing of strong and reliable conclusions. The implementation of more standardized methods would enhance the robustness and comparability of findings.
Abbreviations
- CI
-
confidence interval
- gc/g-wet
-
RNA gene copies per gram of wet stool
- PR
-
positivity rate
- VST
-
viral shedding time
Supplementary material
The supplementary material for this article can be found at http://doi.org/10.1017/S0950268826101241.
Data availability statement
The data from the scoping review are provided in the additional file. Further inquiries can be directed to the corresponding author.
Author contribution
SA: Conceptualization, data curation, formal analysis, investigation, methodology, project administration, visualization, writing – original draft, writing – review and editing. WH, TG, JS: Conceptualization, project administration, writing – review and editing. PP, AS, RK: Conceptualization, data curation, writing – review and editing. UB: Conceptualization, investigation, methodology, project administration, formal analysis, visualization, writing – original draft, writing – review and editing, supervision.
Funding statement
The author(s) declare that financial support was received for the research, authorship, and/or publication of this article. This manuscript was financed by the Robert Koch-Institute, Berlin, Germany, acting under the auspices of the Ministry of Health.
Competing interests
None.
Ethics approval and consent to participate
Not applicable.


 Open access