


Introduction
Anthropogenic activities causing climate change, habitat loss and fragmentation, as well as introduced predators, are the main threats to bird diversity worldwide. If these impacts continue unchecked and effective conservation actions are not implemented, it is predicted that hundreds of bird species will be extinct by 2100 (Johnson et al. Reference Johnson, Balmford, Brook, Buettel, Galetti and Guangchun2017). In addition to species loss, which is irreversible, ecosystem changes can drastically modify bird ecology, allowing some species to succeed and thrive in anthropogenic habitats whilst others collapse (Tietze Reference Tietze2018). Assessing changes in species ecology over a large timescale is essential, not only to assess how human threats affect species’ ecology, but also to monitor and improve on-going wildlife conservation actions by evaluating multiple characteristics of restored populations, such as survival, reproduction, and trophic ecology (Amundsen et al. Reference Amundsen, Primicerio, Smalås, Henriksen, Knudsen and Kristoffersen2019; Lindenmayer et al. Reference Lindenmayer, Likens, Andersen, Bowman, Bull and Burns2012).
Aotearoa New Zealand’s avifauna is known for its unique lineages and high levels of endemism, and also for typically high rates of threatened species (Jetz et al. Reference Jetz, Thomas, Joy, Redding, Hartmann and Mooers2014; Sekercioglu et al. Reference Sekercioglu, Daily and Ehrlich2004). Over 50 bird species have become extinct since the first humans arrived in Aotearoa (Checklist Committee OSNZ 2022; Tennyson and Martinson Reference Tennyson and Martinson2007). Nevertheless, New Zealand is now among the countries with widely established effective conservation actions for wildlife, with several successful initiatives to save species from the brink of extinction (Miskelly and Powlesland Reference Miskelly and Powlesland2013). Although the entire country has experienced intense losses of natural plant cover since human settlement, the rates of forest fragmentation and biodiversity loss are greater on the North Island (Craig et al. Reference Craig, Anderson, Clout, Creese, Mitchell and Ogden2000; Ewers et al. Reference Ewers, Kliskey, Walker, Rutledge, Harding and Didham2006). Likewise, even though the histories of bird conservation on the North and South Islands have their own particularities, similar strategies have been adopted in both, such as conservation translocations of individuals and management of invasive predators (Miskelly and Powlesland Reference Miskelly and Powlesland2013).
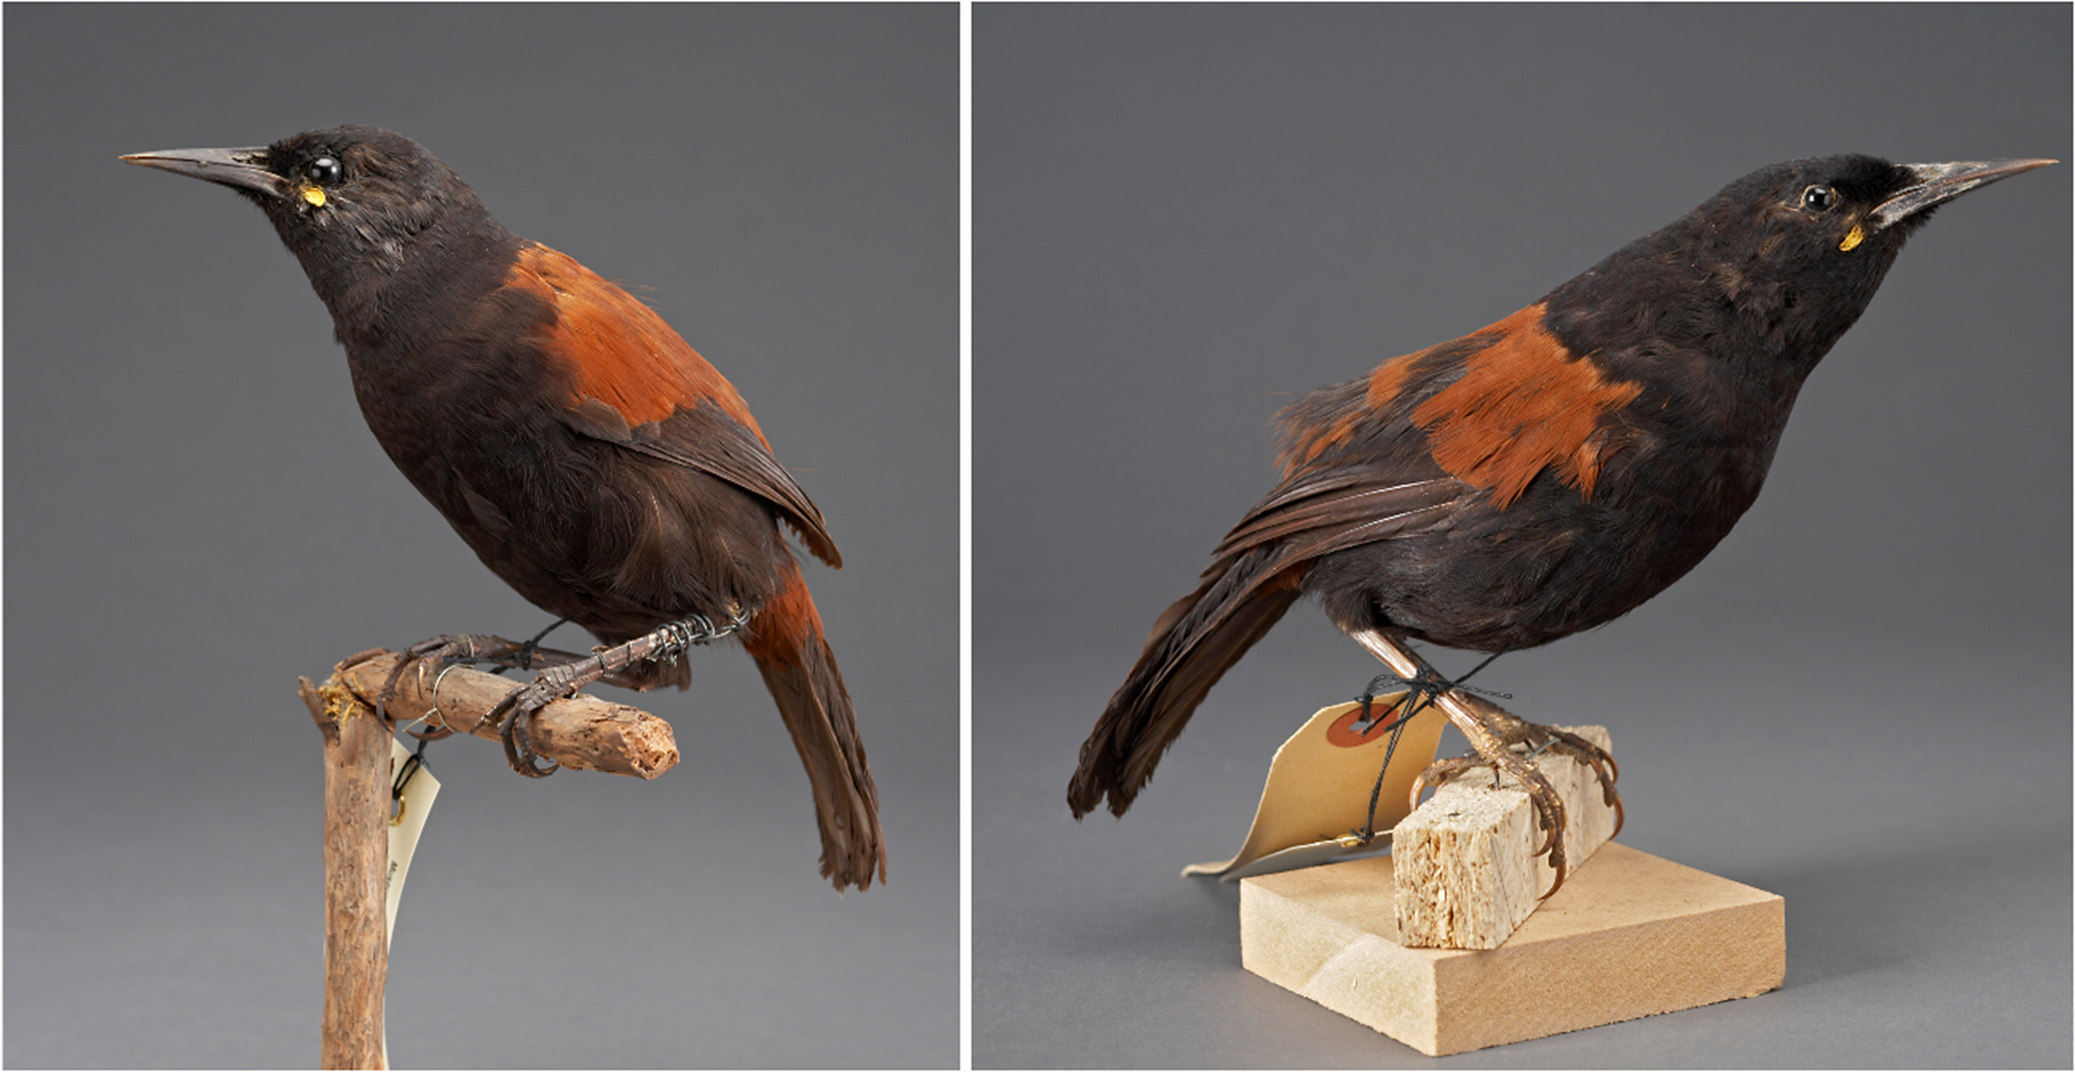
Tīeke or saddlebacks are passerine birds belonging to the New Zealand endemic family Callaeidae, or wattlebirds. They are a pair of sister species, each inhabiting one of the country’s main islands (a common segregation in New Zealand’s avifauna): the North Island Saddleback (hereafter NI saddleback), Philesturnus rufusater (Lesson 1828), and the South Island Saddleback (hereafter SI saddleback), Philesturnus carunculatus (Gmelin 1789) (Figure 1). Today, saddlebacks are among the species experiencing the most effective conservation actions in New Zealand. Large-scale management of introduced mammals began in the 1950s (Fea et al. Reference Fea, Linklater and Hartley2021) and successful translocations of saddlebacks were carried out to managed conservation areas in the 1960s (Hooson and Jamieson Reference Hooson and Jamieson2003). Even though NI and SI saddlebacks were considered as subspecies then (Parker et al. Reference Parker, Ludwig, King, Brunton, Scofield and Jamieson2014), conservation actions targeted both northern and southern populations, proving the inestimable value of conserving these independent evolutionary lineages (Mace Reference Mace2004; Zink and Klicka Reference Zink and Klicka2022). Management and translocation programmes allowed both species to start recovering, but populations are still restricted to predator-free islands and fenced sanctuaries, making them highly dependent on predator control (Miskelly and Powlesland Reference Miskelly and Powlesland2013; Miskelly et al. Reference Miskelly, Tennyson, Edmonds and McMurtrie2017). Whilst NI saddlebacks recovered comparatively quickly after translocations began, SI saddlebacks faced more intense population bottlenecks due to the small source population, reaching a nadir of just 36 individuals in the 1960s (Hooson and Jamieson Reference Hooson and Jamieson2003). In effect, SI saddlebacks would be extinct if a few individuals had not been rescued from Big South Cape Island and translocated to Te Poho-o-Tairea (Big) and Kaimohu Islands in 1964.
Museum specimens (mounts) of the two saddleback species from the Museum of New Zealand Te Papa Tongarewa (NMNZ) collection. Left: North Island (NI) Saddleback Philesturnus rufusater (Lesson, 1828); specimen NMNZ OR.005045 (CC BY 4.0 Te Papa). Right: South Island (SI) Saddleback Philesturnus carunculatus (Gmelin, 1789); specimen NMNZ OR.011659 (gift of L.J. Vangioni, 1942; CC BY 4.0 Te Papa). The NI saddleback can be distinguished by a thin pale-yellow band on the leading edge of the ‘saddle’, more easily observed in live birds.
Modern conservation and management of native birds in New Zealand is a complex venture, involving scientists, governmental bodies, indigenous groups (iwi Māori) with land management rights (Mana Whenua), and local communities. In addition to building on centuries-old indigenous knowledge and current ecological studies, the use of heritage collections from museums can provide vital information to help evaluate the effectiveness of conservation measures (e.g. Tawa and Sagawa Reference Tawa and Sagawa2021; Wehi et al. Reference Wehi, Rogers, Jowett and Sabadel2022). While the demographic recovery of populations is rightly considered a conservation success (Elphick et al. Reference Elphick, Reed and Jota2001), a broader question remains as to whether conservation actions can also restore the full ecological and trophic roles of species (Tawa and Sagawa Reference Tawa and Sagawa2021). In this paper, we show that stable isotope methodology is a valuable tool in this endeavour. To that end, we use tīeke, or saddlebacks, as our model species.
The use of stable isotope analysis in animal ecology studies has increased in the scientific literature in past decades (Boecklen et al. Reference Boecklen, Yarnes, Cook and James2011; Fry Reference Fry2008), making ornithological stable isotope studies an emerging theme to be explored from several angles, from diet and habitat use to migration (Hobson Reference Hobson2011; Navarro et al. Reference Navarro, Magioli, Moreira and Silveira2022; Rayner et al. Reference Rayner, Dunphy, Lukies, Adams, Berg and Kozmian-Ledward2021). Carbon and nitrogen are elements commonly used in stable isotopic ornithology because they provide useful information about how organisms use their environment and their foraging ecology (Inger and Bearhop Reference Inger and Bearhop2008). The carbon stable isotope ratio 13C/12C (measured as δ 13C in units of per mil, ‰) varies according to the different photosynthetic pathways of plants (C3, C4, and CAM), so δ 13C values can indicate the source of carbon and hence the type of habitat used by the organisms (Kelly Reference Kelly2000). The nitrogen stable isotope ratio 15N/14N (δ 15N, in ‰ units) varies according to the diet and trophic position of organisms, wherein δ 15N values increase with increasing trophic level (Kelly Reference Kelly2000). Therefore, the bivariate association of δ 13C and δ 15N values is a useful proxy for assessing the ecological niche of organisms, as it provides information on at least two ecological axes that comprise the hypervolume of the n-dimensional trophic niche space (Newsome et al. Reference Newsome, del Rio, Bearhop and Phillips2007).
The knowledge gained through stable isotope analysis, especially when carried out on a large timescale, has been widely used in conservation biology, helping to improve policies and actions (Tawa and Sagawa Reference Tawa and Sagawa2021; Wehi et al. Reference Wehi, Rogers, Jowett and Sabadel2022). For instance, Tawa and Sagawa (Reference Tawa and Sagawa2021) showed that Oriental Storks Ciconia boyciana reintroduced to Japan forage at a lower trophic level than extinct historical populations, reflecting the loss of high-quality wetland prey and highlighting the need for habitat restoration. Through stable isotope niche metrics, studies on a large spatiotemporal scale have shown that intensified anthropogenic impacts in recent decades directly affect bird ecology (Farmer and Leonard Reference Farmer and Leonard2011; Navarro et al. Reference Navarro, Magioli, Bogoni, Silveira, Moreira and Alexandrino2021; Rayner et al. Reference Rayner, Dunphy, Lukies, Adams, Berg and Kozmian-Ledward2021), which can influence future conservation decisions. Thus, threatened species can benefit from new research using stable isotope data, not only through better understanding of impacts from human activities, but also from evaluating the success of implemented conservation actions.
In our study, we measured stable isotope niche metrics (width and overlap), using δ 13C and δ 15N values, to assess whether the trophic ecology of two saddleback species in New Zealand has changed over time following detrimental anthropogenic impacts and subsequent implementation of conservation actions. We were able to amass a long time series of specimens thanks to natural history collections. We hypothesised that, following the population recovery of saddlebacks due to successful translocations and management of invasive predators, the species would also experience better habitat resource provisioning, which would alter their stable isotopic niche to potentially resemble the historical niche prior to the species’ decline.
Methods
Study system
Presently, NI saddlebacks are classified as ‘At Risk – Relict’ and SI saddlebacks as ‘At Risk – Recovering’ (Robertson et al. Reference Robertson, Baird, Elliott, Hitchmough, McArthur and Makan2021) and ‘Near Threatened’ and ‘Least Concern’, respectively, on the International Union for Conservation of Nature (IUCN) Red List (IUCN 2025). Both species were common at the time of European settlement but declined soon afterwards due to habitat loss and introduced mammals, and by the end of the nineteenth century, were already considered rare (Salvador et al. Reference Salvador, Tomotani, Miskelly and Waugh2019). NI saddlebacks became extinct on mainland Aotearoa New Zealand in the 1890s and SI saddlebacks in the early twentieth century (Salvador et al. Reference Salvador, Tomotani, Miskelly and Waugh2019). Both saddlebacks were then considered a single species and only received legal protection in 1906 when populations were already extremely reduced (Miskelly Reference Miskelly2014). NI saddlebacks survived as a single population on Taranga (Hen) Island, whilst SI saddlebacks survived on three of the South Cape Islands: Taukihepa (Big South Cape), Rerewhakaupoko (Solomon), and Pukeweka Islands (Hooson and Jamieson Reference Hooson and Jamieson2003).
Both saddleback species are considered obligate native forest inhabitants (Innes et al. Reference Innes, Kelly, Overton and Gillies2010) and display similar foraging patterns and diet (Pierre Reference Pierre2000). They are insectivorous omnivores, feeding on insects (and other invertebrates such as spiders), while also including a smaller seasonal component of fruits and nectar in their diets (BirdLife Australia 2023). Most foraging is at ground level, in leaf litter and decaying bark, but birds may also forage on a range of plants up to the canopy (Heather and Robertson Reference Heather and Robertson2005; Higgins et al. Reference Higgins, Peter and Cowling2006; Pierre Reference Pierre2001). NI saddlebacks are expected to have a wider variety of plant-related items in their diet, at least in some regions of the country (BirdLife Australia 2023; Pierre Reference Pierre2000), but few studies have compared proportions of resources used across species, and no study has compared their feeding ecology over time. Furthermore, recent studies are perforce conducted with relict island populations or translocated animals. Whilst these provide valuable ecological information, especially as some reintroduction sites historically supported saddleback populations, they may not fully capture the species’ ecological patterns when they occupied the two main islands of Aotearoa New Zealand (mainland) prior to human-driven changes. Thus, data from historical series of specimens are particularly valuable.
Sampling
We sampled one contour feather randomly taken from the breast area of study skins and mounts from the following ornithological collections: Auckland War Memorial Museum (AWMM; Auckland, New Zealand); Canterbury Museum (CM; Christchurch, New Zealand); Carnegie Museum of Natural History (CMNH; Pittsburgh, USA); Muséum national d’Histoire naturelle (MNHN; Paris, France); Museum of New Zealand Te Papa Tongarewa (NMNZ; Wellington, New Zealand); National Museums Scotland (NMS; Edinburgh, UK); Naturhistorisches Museum Basel (NMBA; Basel, Switzerland); Naturhistoriska riksmuseet (NRS; Stockholm, Sweden); and Senckenberg Naturmuseum (SMF; Frankfurt am Main, Germany).
We collected samples from 33 NI saddlebacks (15 ♀, 17 ♂, 1 unknown) and 36 SI saddlebacks (11 ♀, 19 ♂, 6 unknown) (see Supplementary material File S2 for complete list of specimens and collection data, and Figure S1 for a map of sampled locations). The NMNZ and AWMM collections contributed most samples (n = 49), reinforcing the importance of those museums in housing significant archives of New Zealand’s avifauna (Gill Reference Gill2001). Overseas museum collections were likewise fundamental, especially in obtaining samples of the oldest specimens (including type specimens of SI saddleback; File S2).
Considering the history of saddleback decline and the onset of translocation efforts to save the species from the brink of extinction around the 1960s (Bell et al. Reference Bell, Bell and Merton2016; Miskelly and Powlesland Reference Miskelly and Powlesland2013), we grouped specimens of our data set into three temporal groups for analysis, denominated ‘historical’, ‘bottleneck’, and ‘post-translocation’ and thus, reflecting three different periods of these species’ history in Aotearoa New Zealand. The historical group refers to individuals collected on the mainland before the escalation of human impacts that extirpated saddlebacks in those areas, representing the species’ natural ecology without human interference. The bottleneck group refers to individuals collected on islands where natural populations were confined after the species collapsed on the mainland. For SI saddlebacks, this includes individuals from South Cape Islands, Big South Cape Island, Solomon Island, and Pukeweka Island, where specimens were collected between 1932 and 1965. For NI saddlebacks, this includes individuals from Hen Island and Cuvier (Repanga) Island, where specimens were collected between 1880 and 1964. The post-translocation group refers to individuals collected after 1965 on managed islands where translocations were well-established, relating to the period after the management actions for saddleback conservation began.
Sampling was as comprehensive as possible within the constraints of specimens available from the historical and bottleneck periods (cf. Salvador et al. Reference Salvador, Tomotani, Miskelly and Waugh2019, who presented a complete list of available specimens). For the NI saddleback, no specimens were collected on the mainland nor were available for the historical period (Salvador et al. Reference Salvador, Tomotani, Miskelly and Waugh2019), so comparison among the three temporal groups was possible only for the SI saddleback.
Stable isotope analysis
The sampled feathers were cleaned in ethanol. The top 1.5 cm of each feather was cut off, then the two vanes of the section were separated from the shaft and used for analysis; the shaft was discarded. For each sample, the vanes were snipped into fine segments using ethanol-cleaned scissors to homogenise the material and were then weighed. Approximately 0.5–0.8 mg (0.7 mg on average) of the homogenised feather subsample was used for analysis.
Stable isotope analysis was performed on a DELTA V Plus continuous flow isotope ratio mass spectrometer (IRMS) linked to a Flash 2000 elemental analyser using a MAS 200 R autosampler (Thermo-Fisher Scientific, Bremen, Germany) at the New Zealand Institute for Earth Science Ltd (formerly the National Institute of Water & Atmospheric Research – NIWA) Environmental & Ecological Stable Isotope Analytical Facility (Wellington, New Zealand). The δ 15N values of the samples were calibrated against an atmospheric air international standard, and δ 13C sample values were calibrated against a CO2 reference gas, relative to the international standard Carrara Marble NSB-19 (National Institute of Standards and Technology – NIST; Gaithersburg, MD, USA), which in turn was calibrated against the original Pee Dee Belemnite (PDB) limestone standard. The stable isotope values provided by the mass spectrometer were expressed in delta (δ) ‰ notation, following the equation:

where R is the corresponding ratio of 13C/12C or 15N/14N of the sample.
Full analytical methodology and details of standards used for data normalisation and accuracy and precision calculations can be found in Bury et al. (Reference Bury, Peters, Sabadel, St John Glew, Truman and Wunder2024) (text in File S6). Repeat analysis of standards produced data accurate to within 0.10‰ for δ 15N and 0.15‰ for δ 13C, and a precision of better than 0.20‰ for δ 15N and δ 13C.
Data analysis: environmental influence
The δ 13C values were corrected to account for the Suess effect, which is a substantial change in atmospheric δ 13C values due to the increase in anthropogenic CO2 input into the atmosphere after the Industrial Revolution (Revelle and Suess Reference Revelle and Suess1957). We used the negative exponential model employed by Long et al. (Reference Long, Sweitzer, Diefenbach and Ben-David2005) to correct values between 1880 and 2012. For samples between 1826 and 1880 (n = 7) we employed the correction factor for the year 1880 (1.9‰) because given the difference in correction factors for the Suess effect, the correction for older samples is negligible, i.e. <0.1‰ (see Francey et al. Reference Francey, Allison, Etheridge, Trudinger, Enting and Leuenberger1999).
The occupation of islands by large colonies of seabirds such as petrels, gannets, gulls, cormorants or penguins creates unusual ecosystems enriched by guano (Wiser et al. Reference Wiser, Buxton, Clarkson, Hoare, Holdaway, Richardson and Dymond2013). This seabird excrement is enriched in the heavy stable isotopes of 13C and 15N, which increases the δ 13C and δ 15N values of the soils, plants, and animals near the colonies (Hawke et al. Reference Hawke, Clarka and Vallance2013; Szpak et al. Reference Szpak, Longstaffe, Millaire and White2012). To test whether stable isotope values of saddleback specimens caught in locations with seabird colonies were influenced by guano presence, we fitted a linear model for each stable isotope measurement (δ 13C and δ 15N, separately) using species, temporal group, and presence/absence of seabird colonies as explanatory variables. Historical and current presence of seabird colonies and their abundance were assessed through the published literature and team members’ experience with previous research on those sites (e.g. Miskelly et al. Reference Miskelly, Bishop, Greene, Rickett, Taylor and Tennyson2020; Waugh et al. Reference Waugh, Tennyson, Taylor and Wilson2013). If at least one of the explanatory variables was found to be significant (P <0.05), we employed a pairwise comparison test using the emmeans package (Lenth Reference Lenth2024) to check which groups differed in stable isotope values. Additionally, using only the set of individuals influenced by guano presence (i.e. individuals from islands), we fitted a linear model for each stable isotope value using species and temporal groups as explanatory variables, and another linear model for δ 15N using species and seabirds’ abundance as explanatory variables, to corroborate our results. We used R software v. 4.3.0 to run all statistical analyses (R Core Team 2024).
Data analysis: stable isotope niche
To test differences or similarities in trophic niches (i.e. stable isotope ellipses in the δ-space) between temporal groups, we used δ 13C and δ 15N values to calculate the following metrics: niche width, overlap between total niches (using p.interval = 95%), and overlap between core niches (using p.interval = 50%). For that we used the Stable Isotope Bayesian Ellipses in R (SIBER) package (Jackson et al. Reference Jackson, Inger, Parnell and Bearhop2011). Niche width, i.e. standard ellipse area (SEA), measured in ‰², was estimated for each temporal group of NI saddleback (bottleneck and post-translocation) and SI saddleback (historical, bottleneck, and post-translocation). The overlap measures for the two species were calculated as the proportion (in %) of an ellipse area of one temporal group that overlapped with the ellipse area of another temporal group and vice versa. Model fitting was performed via Markov chain Monte Carlo (MCMC) simulation, which calculated posterior estimates of SEA after 100,000 iterations. After running the model, we used the posterior estimates of SEA to calculate the mode value (used as niche width measurement) and credible intervals (95%, 75%, and 50%) for NI and SI saddlebacks of each period. Then, we compared the probability that the posterior SEA distributions of temporal groups were different (larger or smaller) for each species, adopting a probability of >0.9 as statistically significant.
To further evaluate the potential influence of unbalanced sample sizes among temporal groups, we conducted a complementary analysis for the SI saddleback using Isotopic Richness (IRic) metric, following Cucherousset and Villéger (Reference Cucherousset and Villéger2015). This metric represents the amount of isotopic space (i.e. isotopic niche) occupied by a group and was calculated based on a bootstrap resampling procedure (1,000 iterations) designed to control for differences in sample size.
Results
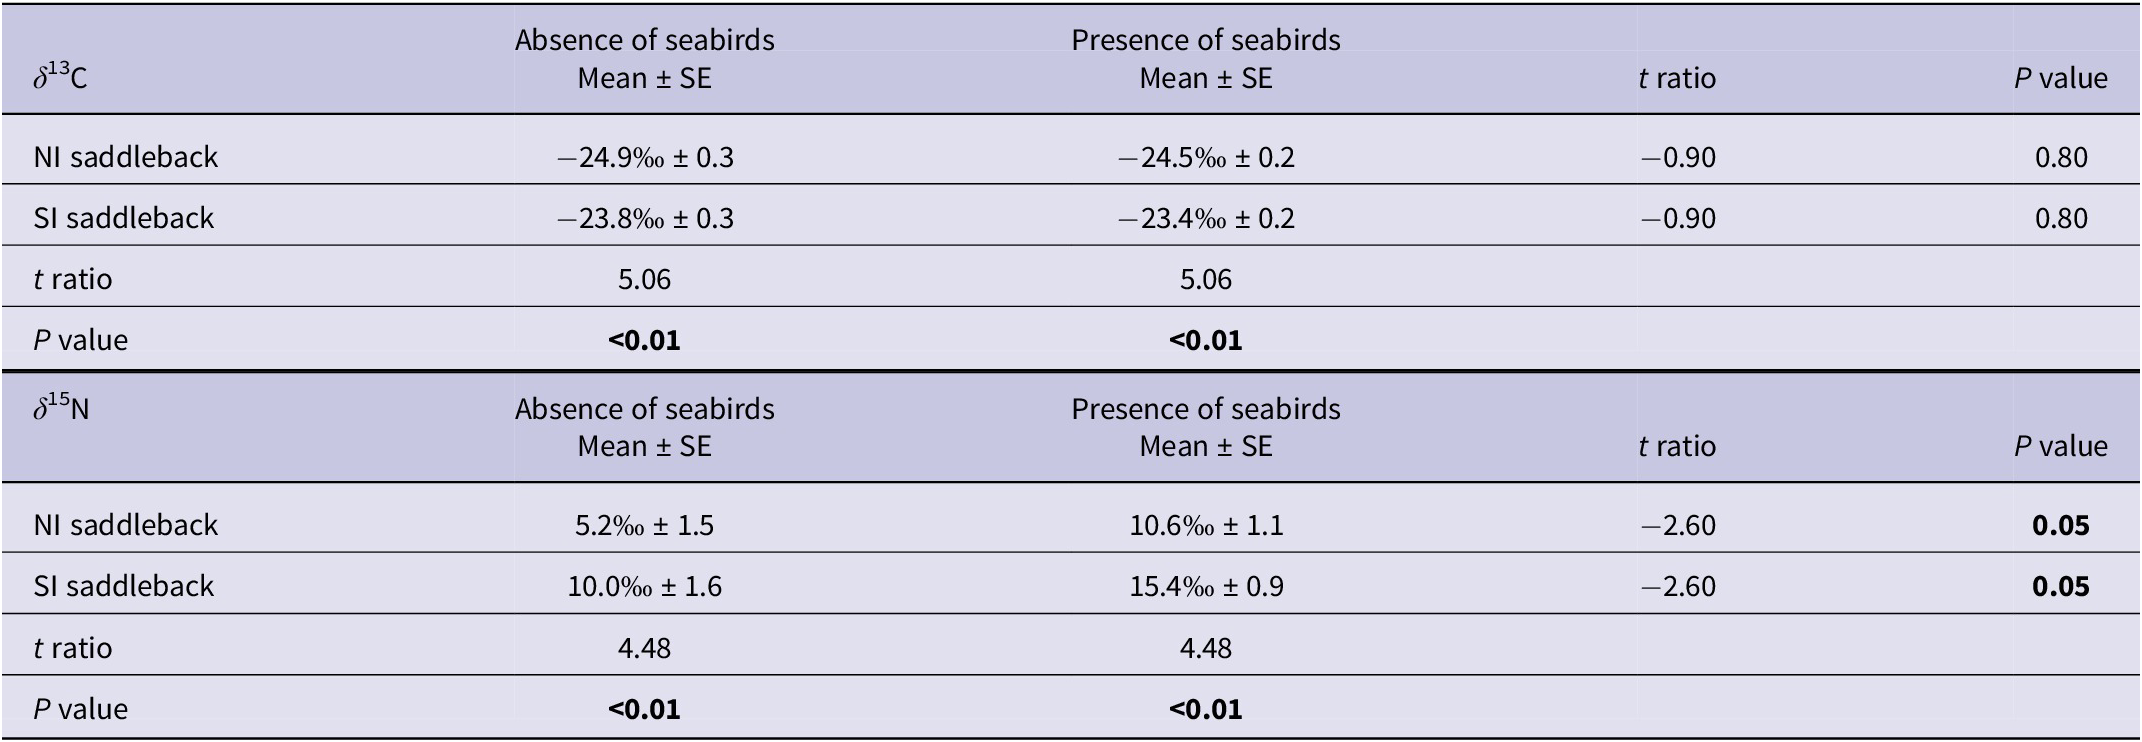
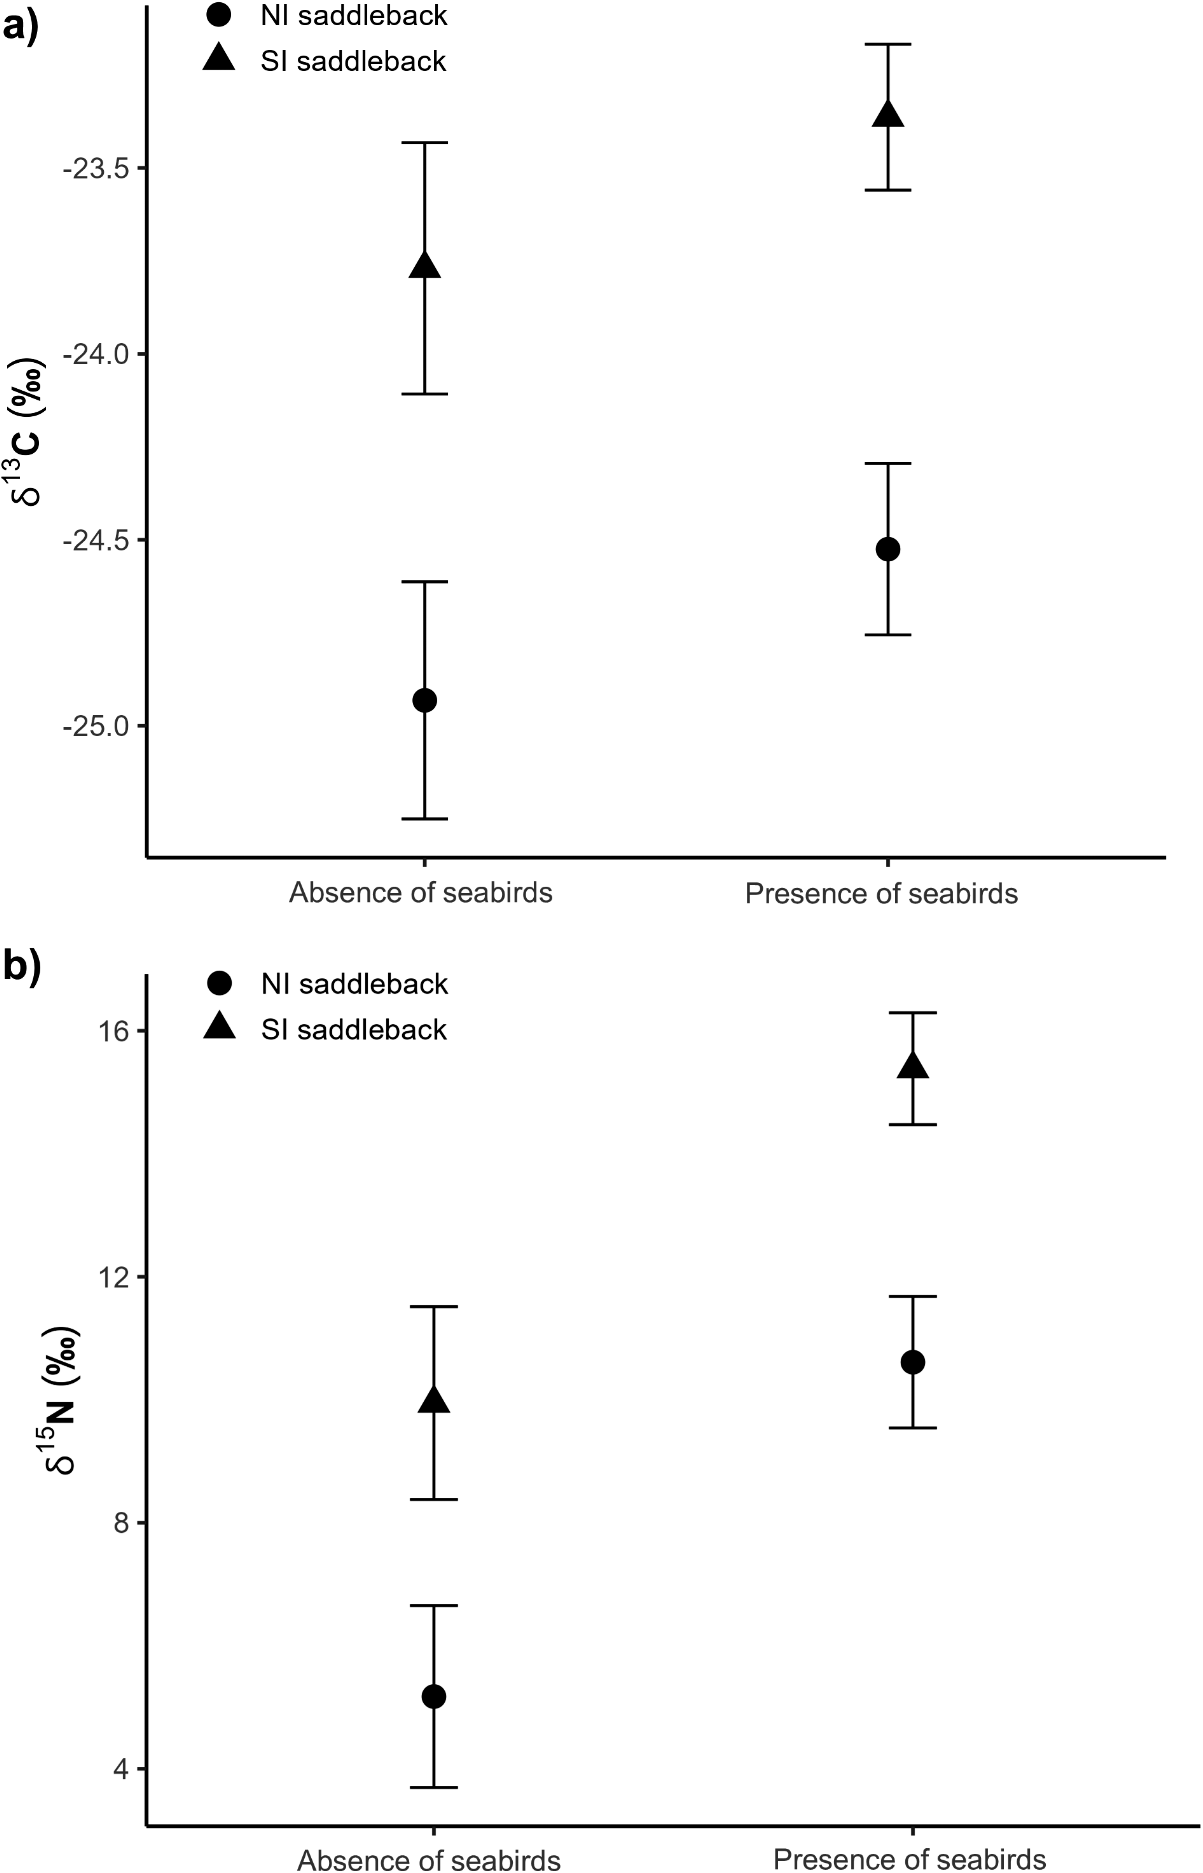
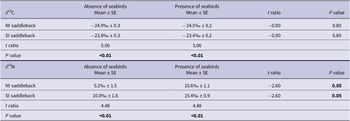
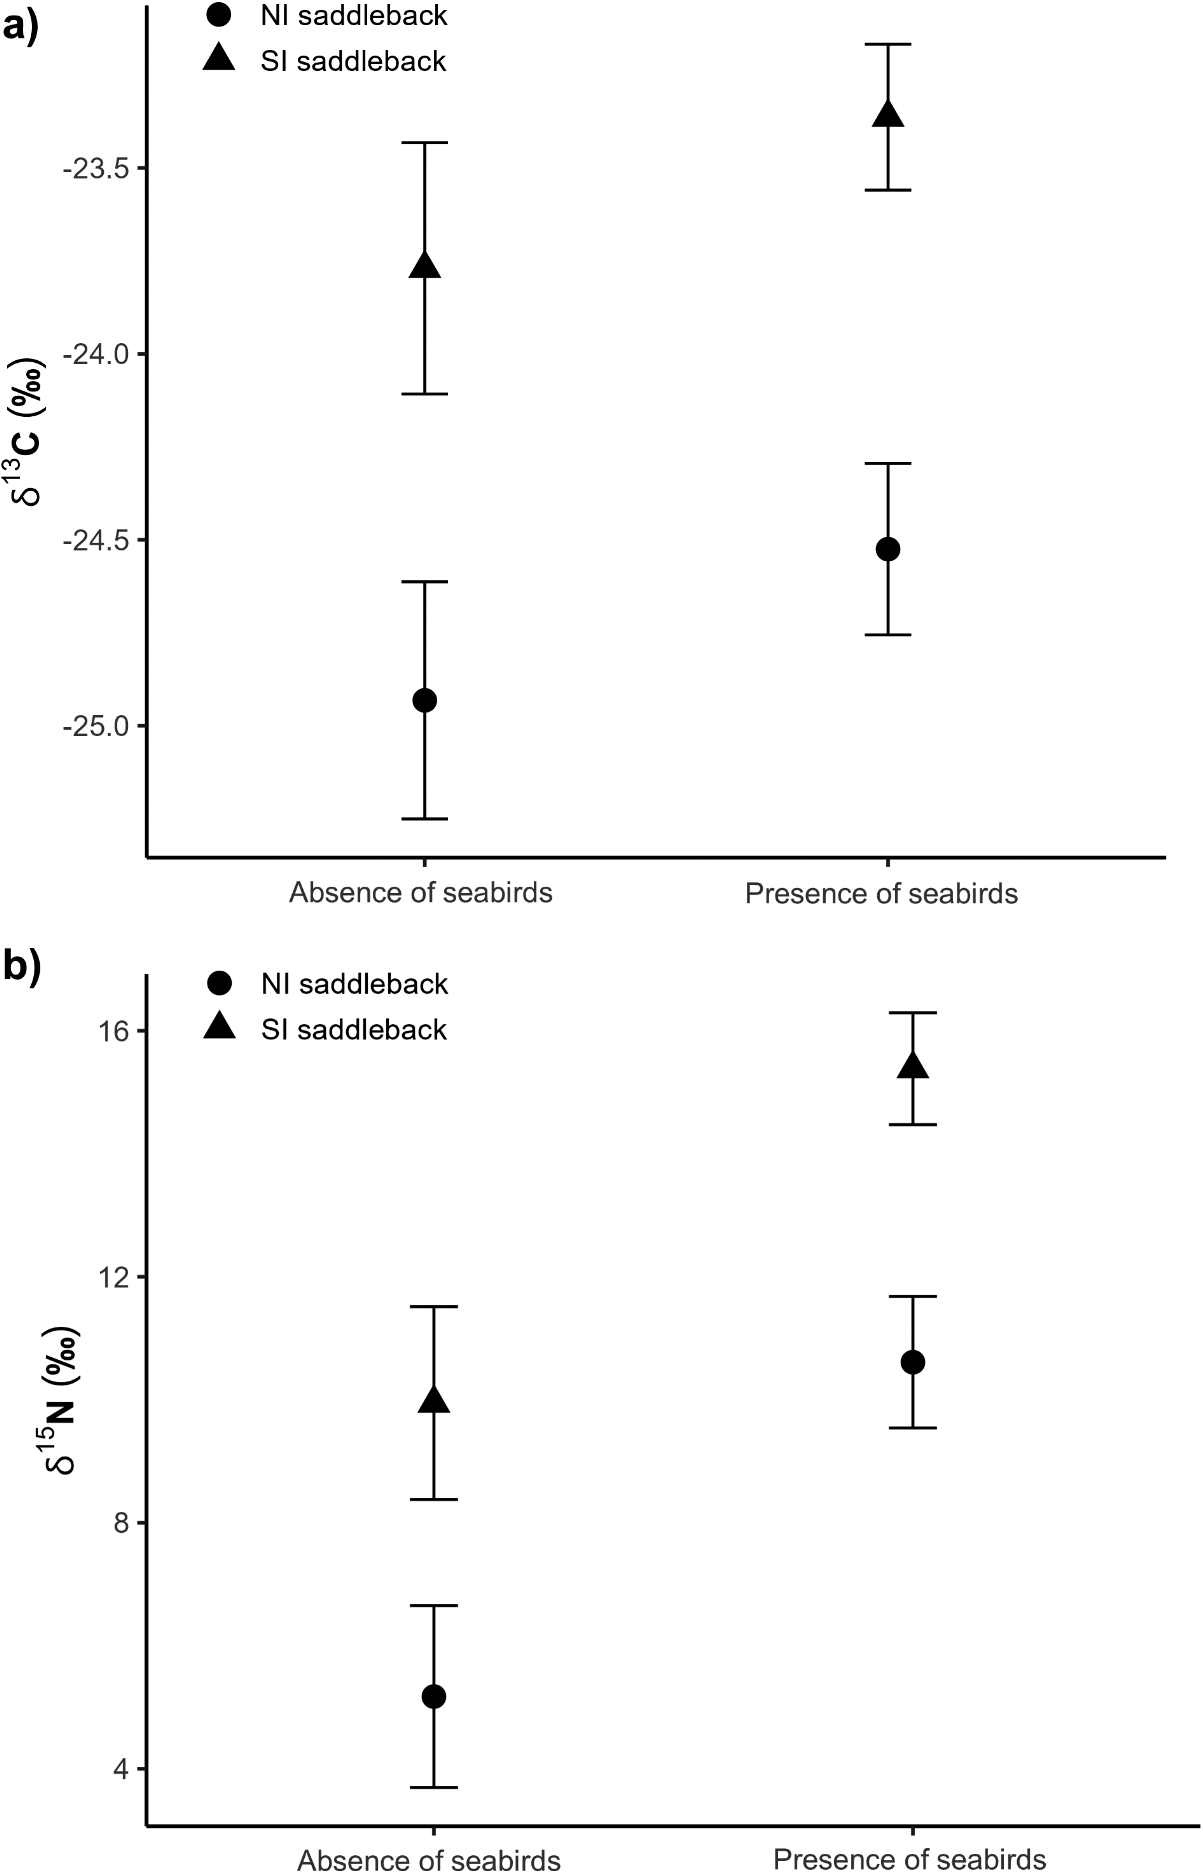
Results of the linear models showed that guano, due to the presence of seabirds in the localities where specimens were collected, produced higher δ 15N values in saddlebacks but did not alter δ 13C values (Table 1, Figure 2, and Table S1). Results of the linear models (for δ 15N and δ 13C) showed that the explanatory variable ‘species’ was significant and the pairwise comparison test showed that NI and SI saddlebacks had distinct stable isotope values (Table 1, Figure 2, and Table S1). When analysing only the set of individuals influenced by guano presence (i.e. individuals from islands) in the linear models, only the explanatory variable ‘species’ was significant (Tables S2 and S3, Figures S2 and S3), corroborating the significant difference between NI and SI saddleback’s stable isotope values.
Mean and standard error (SE) δ 13C and δ 15N feather values of North Island (NI) and South Island (SI) Saddlebacks collected in localities where seabirds were absent or present. The mean values were compared using a pairwise comparison test after fitting a linear model for each stable isotope measurement (δ 13C and δ 15N, separately) using species, temporal group, and presence/absence of seabirds as explanatory variables
Mean and standard error of (a) δ 13C and (b) δ 15N values of North Island Saddleback and South Island Saddleback species collected in localities where seabirds were absent or present.
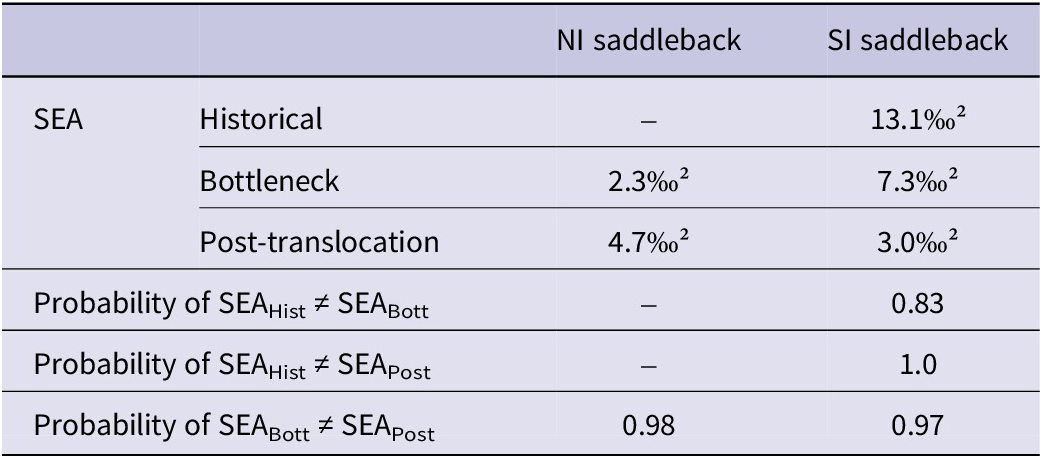
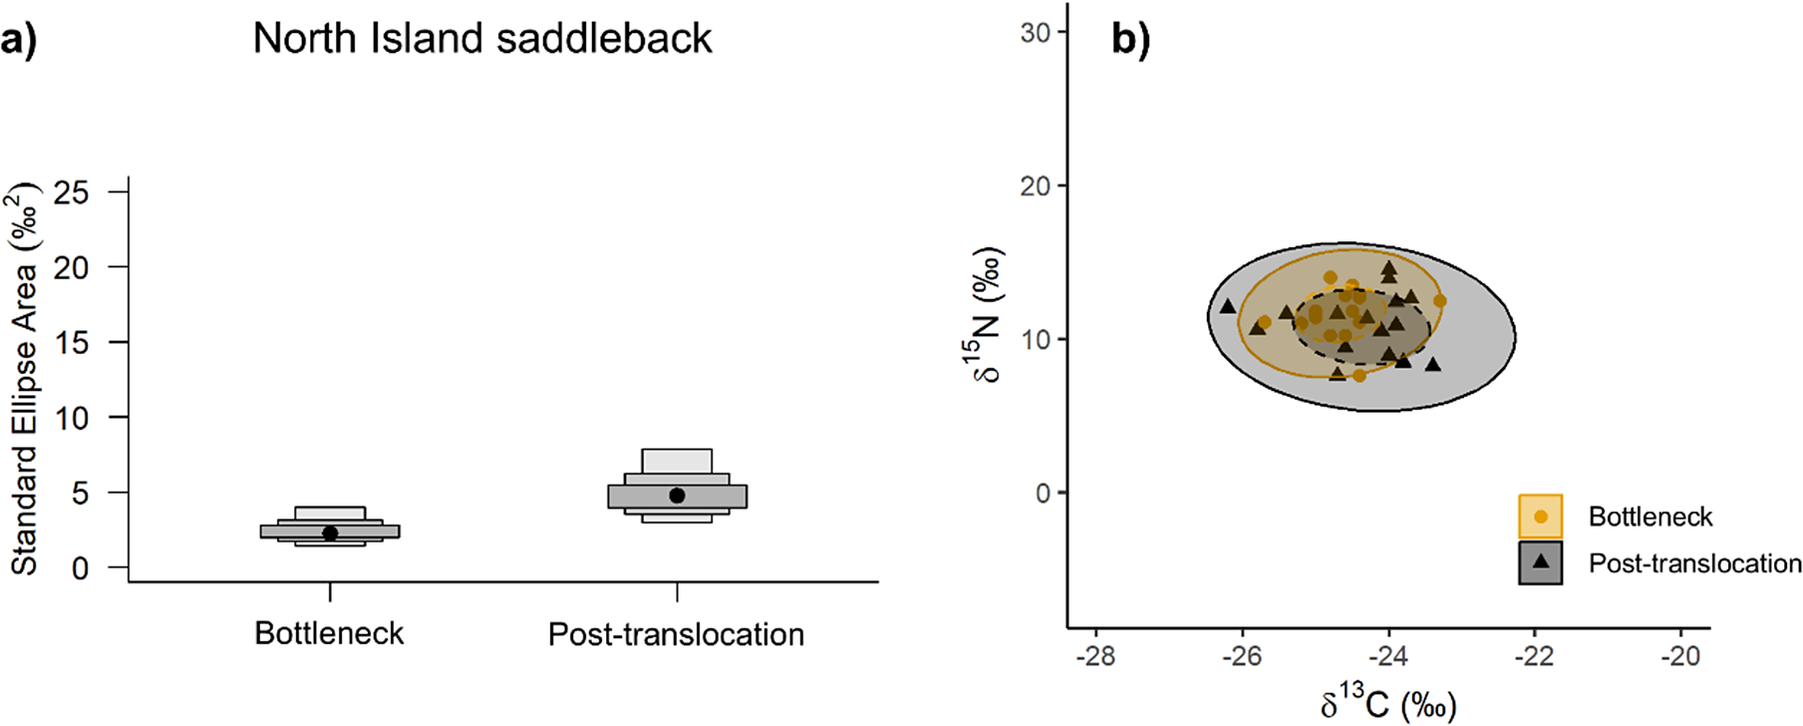
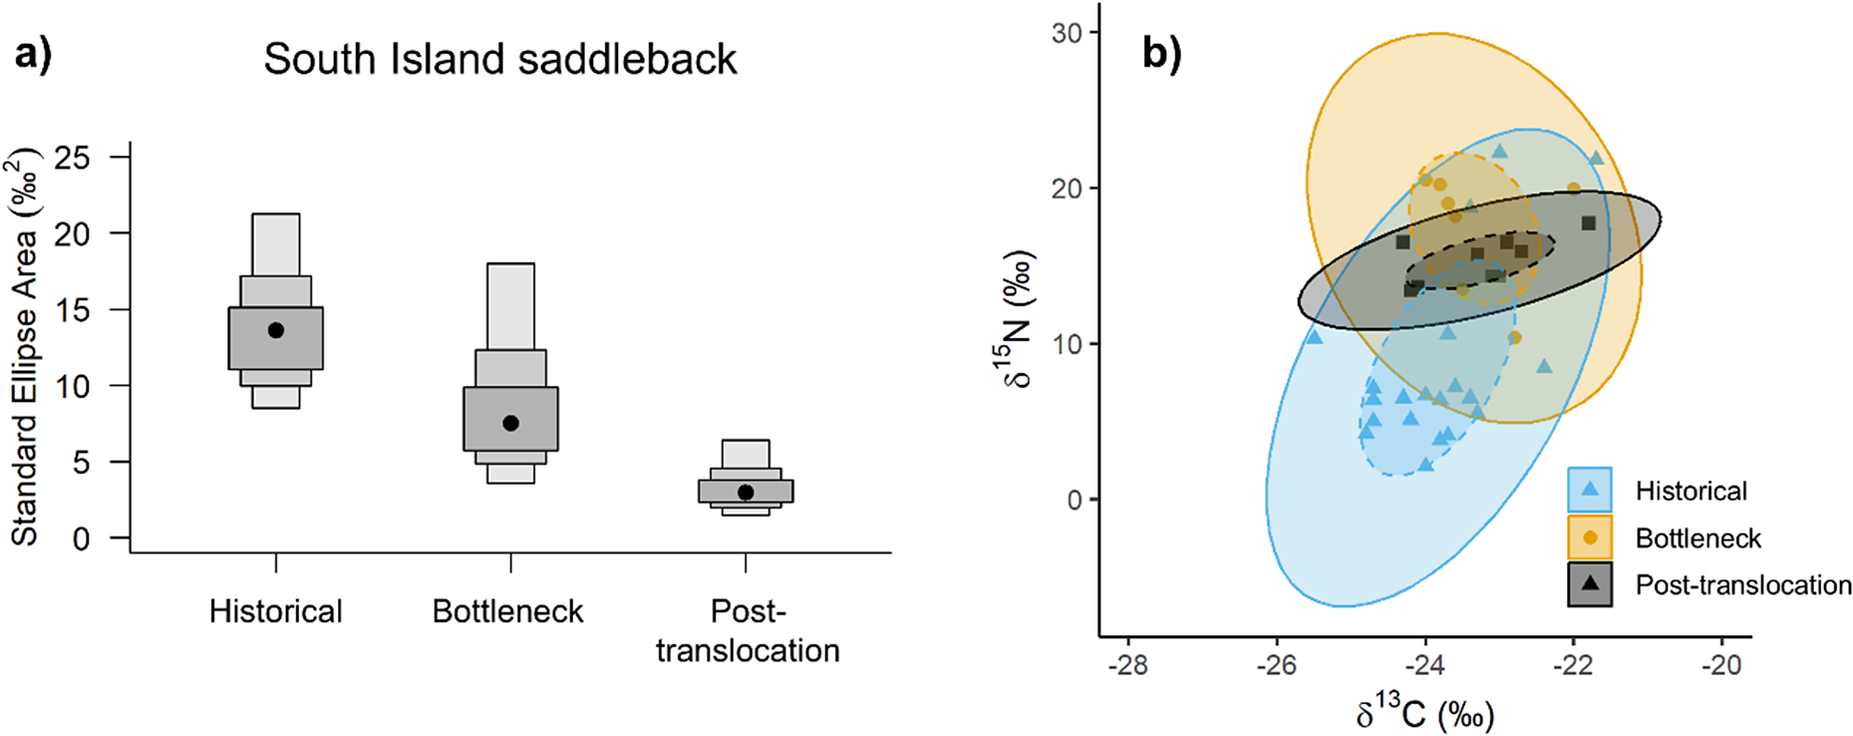
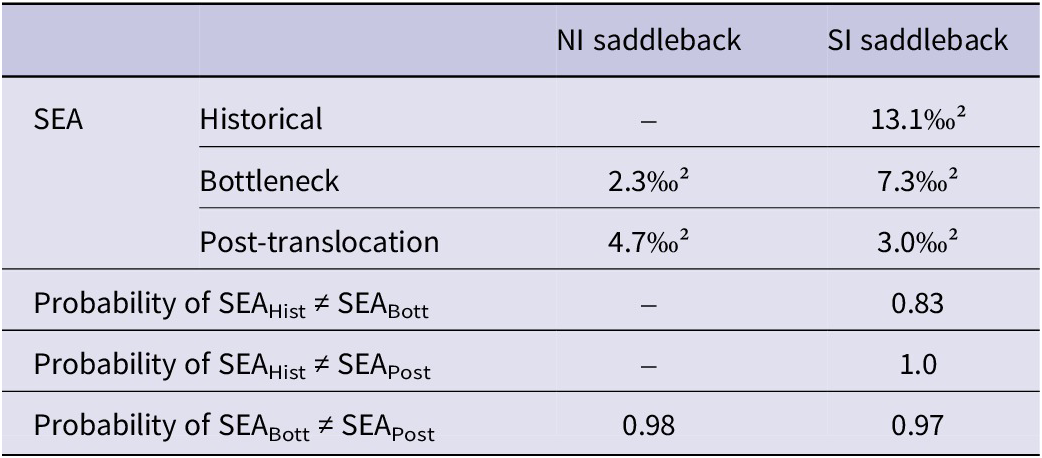
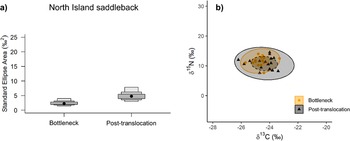
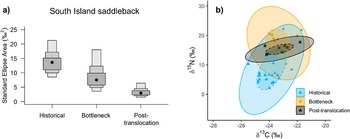
The stable isotopic niche widths of both saddleback species differed significantly between temporal groups (Table 2). We only compared the niches of the bottleneck and post-translocation groups for the NI saddleback, as it was not possible to measure the historical niche. There was a 100% expansion in the width of the NI saddleback’s stable isotopic niche in the post-translocation period (Figure 3). In contrast, the width of the SI saddleback niche significantly decreased over time (Figure 4). For the post-translocation group, we observed a 77% niche contraction compared with the historical group and a 59% contraction compared with the bottleneck group. Although the probability of the SEA posterior distributions between historical and bottleneck is lower (0.83) than the other comparisons, if we consider the SEA mode values, the island population had a niche almost two times smaller than the historical SI saddlebacks from the mainland. The IRic metric corroborated the temporal contraction of isotopic niche in the SI saddleback, with mean IRic values decreasing from the historical population (0.21 ± 0.11) to the bottleneck (0.15) and post-translocation population (0.07 ± 0.0) (Figure S4). This result, in concordance with the Bayesian approach, indicates that the observed niche contraction is robust and not driven by unbalanced sample sizes among temporal groups.
Stable isotopic niche widths of North Island (NI) and South Island (SI) Saddlebacks and the probability that niche widths between temporal groups (historical, bottleneck, and post-translocation) are significantly different, adopting the probability of >0.9 as statistically significant. SEA = standard ellipse area
(a) North Island Saddleback stable isotopic niche width (standard ellipse area) represented by the mode value (black dot) and confidence intervals in grey (95%, 75%, and 50%). (b) The ellipses representing the total (full lines) and core (dashed lines) stable isotopic niches of the different temporal groups (bottleneck and post-translocation).
(a) South Island Saddleback stable isotopic niche width (standard ellipse area) represented by the mode value (black dot) and confidence intervals in grey (95%, 75%, and 50%). (b) The ellipses representing the total (full lines) and core (dashed lines) stable isotopic niches of the different temporal groups (historical, bottleneck, and post-translocation).
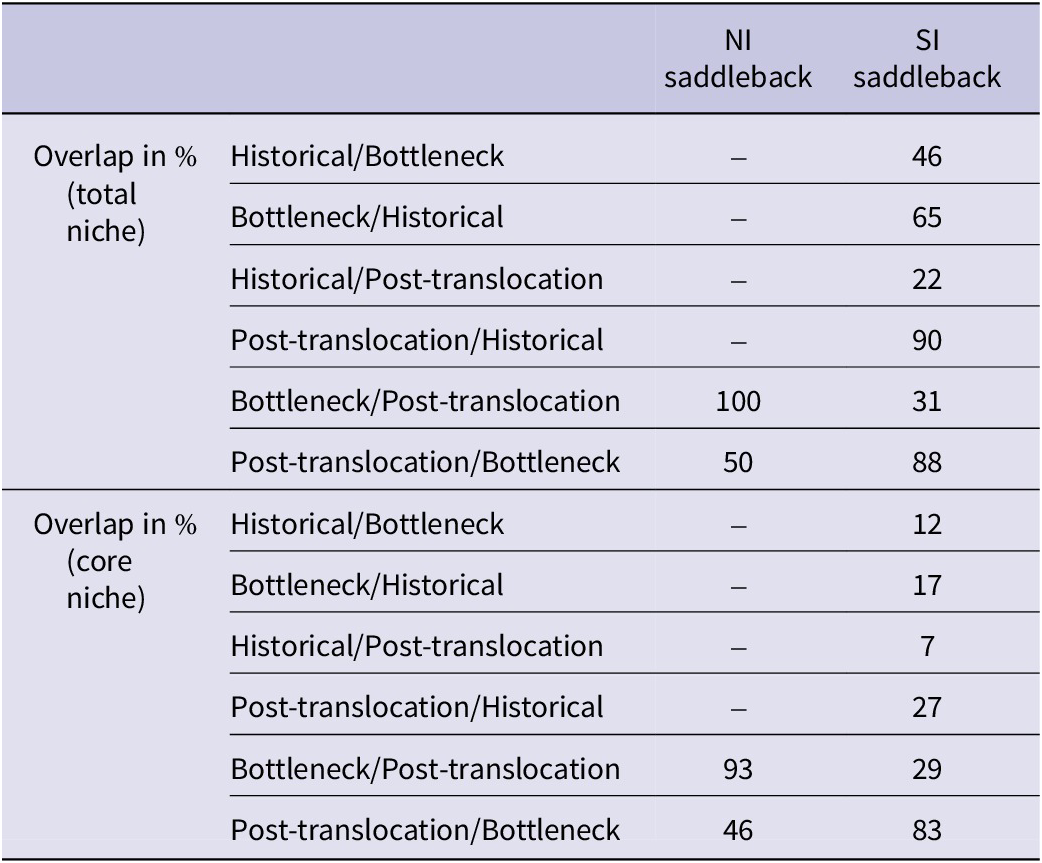
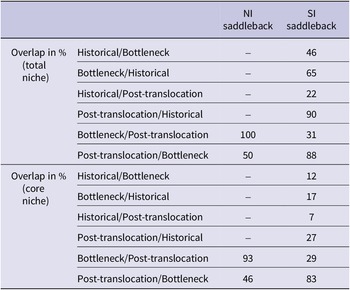
There was a maximum overlap of the total niche of bottleneck over post-translocation group for the NI saddleback, so the total bottleneck niche was completely embedded in the total post-translocation period’s niche (Table 3 and Figure 3). The overlap of bottleneck and post-translocation periods’ core niches in the same species was also high (93%). In contrast, the overlap of the core niches of bottleneck over post-translocation period for the SI saddleback was minimal (29%). There was also a minimal total niche overlap of bottleneck over post-translocation periods of this species (31%), indicating that island population niches differed greatly in δ-space over time (Table 3).
Total stable isotopic niche overlap and core niche overlap calculated as the proportion (in %) of an ellipse area of one temporal group that overlapped with the ellipse area of another temporal group and vice versa
Discussion
Saddleback trophic ecology
The mean δ 15N values of SI saddlebacks were significantly and consistently higher than those of NI saddlebacks (Figure 2), even for comparisons considering only individuals from islands (i.e. influenced by guano; Figures S2 and S3; see ‘Seabird guano influence’ in File S1), suggesting differences in trophic ecology between species. The two saddleback species are omnivores with similar foraging ecologies, eating mainly insects and supplementing their diets with fruit and nectar (BirdLife Australia 2023). Nevertheless, some populations of SI saddleback were reported to be largely insectivorous, with a consumption of invertebrates far exceeding the consumption of other food sources (Pierre Reference Pierre2000). The difference of >3‰ between the δ 15N of NI and SI saddlebacks (if similar δ 15N baseline values in NI and SI saddleback habitats are assumed), further suggests that that these two species forage at different trophic levels, as there is a 3–4‰ increase in δ 15N for each trophic step within the food chain (Kelly Reference Kelly2000). Although our results suggest that the SI saddleback is likely a more exclusively insectivorous bird than its NI counterpart, this interpretation should be treated with caution given the relatively small sample size and the seasonally supplemented diet of the NI saddleback with fruits or nectar (BirdLife Australia 2023). Nevertheless, the large δ 15N difference observed strongly suggests that the two species may forage at distinct trophic levels. We acknowledge that direct comparisons with potential food sources and baseline δ 15N values would strengthen dietary inferences. However, given the generalist omnivorous foraging ecology of saddlebacks and the lack of temporally and spatially matched resource data, such analyses were beyond the scope of this study and not essential for the broad ecological interpretations we present here.
Both NI and SI saddlebacks prefer evergreen coastal forests and mixed lowland broadleaf forests (del Hoyo et al. Reference del Hoyo, Elliott and Christie2004), which is corroborated by their δ 13C range (Figure 2) being typical of C3 plants that dominate the landscape of New Zealand (Rogers et al. Reference Rogers, Turnbull, Martin, Baisden and Rattenbury2017). The small differences in δ 13C values observed between species are likely due to distinct environmental conditions and/or floristic composition between islands, which produce significant variation in New Zealand isoscapes (e.g. del Hoyo et al. Reference del Hoyo, Elliott and Christie2004; Kramer et al. Reference Kramer, Kinaston, Holder, Armstrong, King and Sipple2022; Rogers et al. Reference Rogers, Wassenaar, Soto and Bartle2012).
Stable isotopic niches
We observed inverse effects in each saddleback species when comparing stable isotope niche widths and overlaps between bottleneck and post-translocation groups. These results, although contrasting, may be related to recovery trends of each species after conservation actions (Hooson and Jamieson Reference Hooson and Jamieson2003). Stable nitrogen isotope values differed significantly between locations with and without seabird guano input, indicating that direct comparisons of δ 15N values between mainland and island populations should be made with caution. However, within each temporal group, all individuals share a common provenance and therefore experience similar environmental influences of guano input. Thus, this effect does not bias estimates of isotopic niche width, which are driven by within-group isotopic variance (see also File S1). Potential bias may arise when interpreting niche overlap between temporal groups that differ in guano influence (i.e. historical vs bottleneck and post-translocation groups), and we therefore interpret overlap metrics for these comparisons conservatively.
For the NI saddleback, there was an expansion of the stable isotopic niche after the bottleneck period (Figure 3). That, together with the high overlap of the total and core stable isotopic niches of bottleneck and post-translocation groups (Figure 3), demonstrates that conservation actions have likely been effective for this species in providing a more diverse habitat and food resources, which had a very narrow niche during the bottleneck period. The reduced stable isotopic niche size we observed for the NI saddleback before conservation actions is consistent with their history, as our sample series begins in 1880, when the NI saddleback was already in severe decline. While a reduced niche width does not necessarily represent a risk to species survival (Pagani-Núñez et al. Reference Pagani-Núñez, Valls and Senar2015), species that are highly dependent on certain resources can quickly collapse if they do not have enough plasticity and/or time to exploit other habitats and food sources (Tawa and Sagawa Reference Tawa and Sagawa2021).
The stable isotopic niche of the NI saddleback before implementation of conservation actions was 100% smaller than the current niche. This indicates that this historically abundant species (Salvador et al. Reference Salvador, Tomotani, Miskelly and Waugh2019) was probably on the verge of complete collapse after the intensification of anthropogenic impacts in the nineteenth century (Atkinson and Campbell Reference Atkinson and Campbell1966; Buller Reference Buller1888). However, the lack of an ‘historical’ group of mainland birds for comparison hinders interpretation, so it is presently impossible to tell how the current stable isotopic niche would compare to the species’ ‘natural situation’ in mainland North Island prior to anthropogenic changes. It is thus not possible to assess whether the niche width increase observed means a return to the species’ original niche or just a small step towards it. Additionally, samples from the post-translocation group are more widely distributed among collection localities in comparison to the geographically restricted bottleneck population, which may artificially produce a broader niche, although significant environmental stable isotopic variation is not expected among the islands.
The SI saddleback shows a contraction in niche width in the bottleneck and post-translocation groups and a low overlap of core niches between temporal groups (Figure 4). The broader stable isotopic niche observed in the historical period is straightforward to interpret, as it is a representation of this species living on the mainland South Island prior to the intensification of human-driven changes (sampled specimens date back to 1826). There was a retraction and a ‘shift’ in stable isotope niche during the bottleneck stage. However, this contrast should be interpreted with caution, as the uncertainty surrounding both SEA and IRic metrics is greater for the comparison between the historical and bottleneck groups. In particular, variation around the historical IRic mean partial overlaps with the bottleneck estimate, indicating that the strength of inference for niche retraction in this comparison is more limited than for other temporal contrasts. Nevertheless, the direction of change is consistent with the known demographic and spatial history of the species, since during the bottleneck period populations were confined to only three of the South Cape Islands (Hooson and Jamieson Reference Hooson and Jamieson2003). Such restricted habitat and consequently, restricted food resources diversity, were likely reflected in the stable isotopic niche width. The ‘shift’ in the niche (low overlap) during the bottleneck period could also be due to higher δ 15N values explained by the presence of guano from seabird colonies on these islands (Figure 2).
An unexpected observation was that the stable isotope niche in the conservation period contracted even further compared with the bottleneck period (Figure 4), contrary to what was observed in NI saddlebacks (Figure 3). The conservation efforts in New Zealand’s South Island included populations of SI saddlebacks being translocated to different small islands. The higher δ 15N values of the post-translocation group compared with the historical group are likewise due to the presence of seabird colonies. However, the overall retraction in niche width is not as straightforward to explain, especially considering that seabirds’ abundance is not a significant explanatory variable for the variation in δ 15N values of individuals from islands (Figure S3). We can postulate that contemporary habitats are less diverse in terms of food resources (insects, fruits, and nectar), signifying a niche retraction in the δ 15N axis and not in the δ 13C axis. When food resource scarcity exists in the environment, the diets of organisms are homogenised, leading to niche contraction (Burdon et al. Reference Burdon, McIntosh and Harding2020); in depleted environments, niche reduction is observed across trophic guilds (Navarro et al. Reference Navarro, Magioli, Bogoni, Silveira, Moreira and Alexandrino2021). Even if conservation efforts to recover vulnerable populations are effective, if the diversity of food resources available in the environment is not sufficient or cannot be fully explored by the species (e.g. due to increased proportions of exotic species), there is a risk of species collapse (Tawa and Sagawa Reference Tawa and Sagawa2021). This further highlights the importance of reintroducing SI saddlebacks to as broad a range of habitats as possible.
Although in some contexts a contraction in stable isotopic niche can indicate dietary specialisation, leading to reduced niche breadth (Stephens et al. Reference Stephens, Hobbie, Lee and Rowe2019), we consider this unlikely for SI saddlebacks. These birds are omnivorous generalists that normally exploit a broad array of invertebrates and plant resources, and there is no evidence that post-translocation populations have shifted toward increased specialisation. Instead, the observed contraction is more plausibly explained by reduced diversity of available food resources in remaining habitats.
Whilst NI saddlebacks are considered to have a larger proportion of plant-related items in their diet, SI birds currently feed on a higher proportion of invertebrate prey (Pierre Reference Pierre2000). Considering how narrow the post-translocation group’s δ 15N niche amplitude is compared with the bottleneck period (Figure 4; both periods are immediately comparable in terms of seabird guano influence), it is possible that SI saddlebacks are now relying less on invertebrate prey than they normally would. Reasons for reduced availability of such prey items could be due to the naturally restricted island invertebrate faunas, which is consistent with island biogeography predicting less diverse species assemblages compared with the mainland (MacArthur and Wilson Reference MacArthur and Wilson1967).
Whilst some SI saddleback populations have re-established well to other islands (but not to the mainland) in the last few decades (Lovegrove Reference Lovegrove1996; Miskelly et al. Reference Miskelly, Tennyson, Edmonds and McMurtrie2017), and current numbers and population trajectories clearly demonstrate conservation success in some islands (Hooson and Jamieson Reference Hooson and Jamieson2004), our results indicate that their ecological niche has not yet returned to its historical breadth. This does not diminish the achievements of translocations and predator management since population metrics point to a successful recovery (Hooson and Jamieson Reference Hooson and Jamieson2003). Rather, our study highlights how stable isotope analysis can complement those measures by providing an additional perspective on whether species are also recovering their full potential in terms of trophic ecology. For instance, Tawa and Sagawa (Reference Tawa and Sagawa2021) showed that Oriental Storks Ciconia boyciana reintroduced to Japan forage at a lower trophic level than historical populations, reflecting habitat change and prey loss. Whilst this may not be the case for saddlebacks, it illustrates how stable isotopic data can reveal hidden ecological constraints that reproductive success alone cannot detect.
In SI saddlebacks, the narrower stable isotopic niche of conservation populations likely reflects the reduced habitat and resource diversity of the islands where they now persist. This pattern is somewhat understandable but nonetheless suggests that their realised trophic niche is contracted compared with the past. We recognise the limitations of our data set, especially the small sample sizes, but we have assessed nearly all historical specimens (see Salvador et al. Reference Salvador, Tomotani, Miskelly and Waugh2019) available to us in collections. Future work should therefore focus on monitoring present and future populations, applying stable isotopic approaches, including compound-specific stable isotope analysis of nitrogen in amino acids to determine baseline δ 15N and trophic position values (Chikaraishi et al. Reference Chikaraishi, Ogawa, Kashiyama, Takano, Suga and Tomitani2009, Reference Chikaraishi, Steffan, Ogawa, Ishikawa, Sasaki and Tsuchiya2014; McClelland and Montoya Reference McClelland and Montoya2002; Tomotani et al. Reference Tomotani, Salvador, Sabadel, Miskelly, Brown and Delgado2022) alongside conventional demographic metrics to track changes in diet and habitat use. In this way, stable isotopic data can help to ensure that conservation actions continue not only to safeguard more birds and secure their population trajectories, but also to restore the ecological roles that these species originally fulfilled.
Conclusions
We have shown that, when conservation success is measured in terms of trophic ecology and the potential fundamental ecological niche of a species, NI saddlebacks appear to have re-established their ecological role since conservation efforts started, whereas SI saddlebacks showed a stark contraction in their stable isotopic niche. This does not imply that conservation actions for SI saddlebacks have failed completely, since translocated populations have increased and established successfully at multiple sites, but rather that their ecological potential has not yet been fully restored. Despite populational metrics from previous studies showing the successful re-establishment of these species in habitats where they were reintroduced (Hooson and Jamieson Reference Hooson and Jamieson2003; Lovegrove Reference Lovegrove1996), to our knowledge no other study has compared aspects of their ecology over a period of more than 100 years. Long-term ecological studies are essential to access information on how vulnerable species respond to impacts and also to measure the effectiveness of conservation actions (Lindenmayer et al. Reference Lindenmayer, Likens, Andersen, Bowman, Bull and Burns2012; Tawa and Sagawa Reference Tawa and Sagawa2021; Wehi et al. Reference Wehi, Rogers, Jowett and Sabadel2022). Our study demonstrates the value of using museum specimens over a wide time span to supplement current ecological knowledge on saddlebacks, which can be readily applied to other vulnerable species.
New Zealand is the global leader in rescuing species from near extinction using translocations to predator-free islands, and several bird species besides the SI saddleback now survive only as translocated populations (Miskelly and Powlesland Reference Miskelly and Powlesland2013; see Sherley et al. Reference Sherley, Stringer and Parrish2010, for non-bird examples). Furthermore, other New Zealand species became confined to small islands, including birds, lizards, and tuatara (Merton Reference Merton and Temple1977; Miskelly and Powlesland Reference Miskelly and Powlesland2013; Sherley et al. Reference Sherley, Stringer and Parrish2010). Thus, our findings suggest that bottlenecked and translocated populations are likely to have reduced stable isotopic trophic niche utilisation compared with historical (mainland) populations, and that conservation recovery may not necessarily equate to restoration of ecological connectivity and resilience. Whilst this information would not have altered past management choices, which were necessarily constrained by the availability of predator-free sites and the urge to save a rapidly dwindling population, stable isotope analysis can help guide future decisions by revealing how well reintroduced populations recover their ecological roles under current and prospective habitat conditions. We therefore recommend conservationists make greater use of stable isotopic tools to obtain additional ecological information to complement conservation plans. Stable isotope analysis is a relatively low-cost and easily accessible method, with the added benefit of being minimally invasive to live animals and museum specimens, requiring just a contour feather for analysis.
Finally, our study also emphasises the relevance of natural history collections in conservation biology and the importance of their continued maintenance for the future, both as archives of biodiversity and as historical documentation of the changes that our planet is experiencing (Salvador and Cunha Reference Salvador and Cunha2020; Wheeler Reference Wheeler2023). When studying anthropogenic effects on fauna, using historic material from natural history collections is not only advisable, but essential, as it extends information beyond what is achievable with contemporary samples alone and often provides baseline data for comparison with contemporary data (Meineke et al. Reference Meineke, Davies, Daru and Davis2019; Schmitt et al. Reference Schmitt, Cook, Zamudio and Edwards2019). This is especially true for species for which it is extremely hard to conduct properly controlled studies and experiments (Webster Reference Webster2017), such as threatened New Zealand birds.
Supplementary material
The supplementary material for this article can be found at https://doi.org/10.1017/S0959270926100513.
Acknowledgements
We thank all museum staff who granted access to the specimens housed in the collections under their care and who provided us with information on the specimens and feather samples: Ruby Moore (AWMM); Paul Scofield, Phil Skewes, and Natasha Bonham-Carter (CM); Steve Rogers and Chase Mendenhall (CMNH); Jérôme Fuchs (MNHN); Dieter T. Tietze (NHMB); Bob McGowan and Zena Timmons (NMS); Ulf Johansson (NRS); Gerald Mayr (SMF). We thank Josette Delgado and Julie Brown (New Zealand Institute for Earth Science) for carrying out the stable isotope analysis. Thank you to the anonymous reviewers and editor for their helpful comments. Thank you also to all the naturalists and ornithologists who collected the specimens and deposited them in museums, thus enabling our study, as well as everyone involved in tīeke conservation for their efforts in keeping the populations of these amazing birds afloat. Author contributions: conceptualisation: BMT, RBS, SMW; methodology: BMT, SJB, RBS; investigation: ABN, BMT, RBS; data curation: ABN, BMT, RBS, CMM, MJR; formal analysis and visualisation: ABN; writing (original draft): ABN, RBS, BMT; writing (review and editing): all authors; project administration: BMT; funding acquisition: BMT, RBS, SMW. This project was funded by the Dutch Research Council (NWO), the Birds New Zealand Research Fund, and the Museum of New Zealand Te Papa Tongarewa. BMT was supported by a Rubicon fellowship of the NWO (#019.181EN.005). ABN was supported by a PhD scholarship of the São Paulo Research Foundation (FAPESP; #2020/07619-0). LFS thanks FAPESP (#2017/23548-2) and the National Council for Scientific and Technological Development (CNPq) for the Productivity Research Fellowship (#302291/2016-6 and #308337/2019-0).



 Open access

