

Introduction
Subject of this study
The research presented in this paper has been conducted as part of the WASA project (2016–2020), a joint effort funded by the Lower Saxony Ministry for Science and Culture and the Volkswagen Foundation, combining multidisciplinary research from several institutions (Bittmann et al., Reference Bittmann, Capperucci, Bartholomä, Becker, Bungenstock, Enters, Karle, Siegmüller, Wehrmann, Wurpts and Zolitschka2020). WASA expands upon the investigations of its predecessor ‘Settlement and Cultural History of the Lower Saxony Wadden Sea’, which ran from 2012 to 2015 to identify areas of likely archaeological preservation in the East Frisian Wadden Sea (Goldhammer & Karle, Reference Goldhammer and Karle2015; Karle & Goldhammer, Reference Karle and Goldhammer2017).
The WASA project’s focus lies within the analysis of marine sediment archives from the East Frisian Wadden Sea region in northwestern Germany. It aims at understanding the formation of palaeolandscapes since the end of the last ice age. One part of the project studies the possible correlation and shift of archaeological settlement patterns, climate change and sea-level rise through time. From Mesolithic hunter-gatherers to Frisian chiefdoms in medieval times, communities and societies in the coastal areas of the East Frisian peninsula lived in a highly dynamic environment of water landscapes, needing to adapt to the interplay of their ever-shifting natural and increasingly anthropogenically shaped surroundings. This part of the project is achieved by statistical and geospatial analysis of archaeological and geological data, using the former to determine patterns of geographical and chronological extension of human activity and the latter to generate digital elevation models (DEMs), representing different stages of the landscape’s evolution. General environmental data are incorporated to contextualise the model’s spatial information within parameters of human accessibility and availability of resources. This approach aims at identifying settlement patterns on land in time slices to exemplarily apply the findings to fossil surfaces found in the coastal clay district and the Wadden Sea. Following that, archaeological expectancy maps are to be generated. In this paper, we focus on the methodology applied and our results for the project’s Stone Age dataset.
Study region: the Dornumer tidal basin
Even though the number of known archaeological sites in the East Frisian Wadden Sea has significantly increased in recent years (Niederhöfer, Reference Niederhöfer2016; Karle & Goldhammer Reference Karle and Goldhammer2017; Jöns et al., Reference Jöns, Lüth, Mahlstedt, Goldhammer, Hartz and Kühn2020), the heterogeneous nature of their individual feature set, quality of preservation and deposition as well as their chronological and spatial spread is ill-suited for quantitative analysis of settlement patterns through time. Key to such an approach are factors like a dataset’s area-wide distribution, chronological distinction as well as relative quantity (Wheatley & Gillings, Reference Wheatley and Gillings2002; Mennenga, Reference Mennenga2016: 169ff.). Furthermore, archaeological surveys in the Wadden Sea so far have been limited to a select few areas, incidental finds characterizing most known sites (Karle & Goldhammer, Reference Karle and Goldhammer2017: 224). Considering the Stone Age, only 11 Mesolithic and Neolithic sites are presently known in the East Frisian Wadden Sea, including assemblages as well as single finds of stone and antler tools. Even though a number of additional Stone Age finds have been recorded by regional authorities and museums,Footnote 1 the circumstances or location of their finding are lost (Jöns et al., Reference Jöns, Lüth, Mahlstedt, Goldhammer, Hartz and Kühn2020: 118).
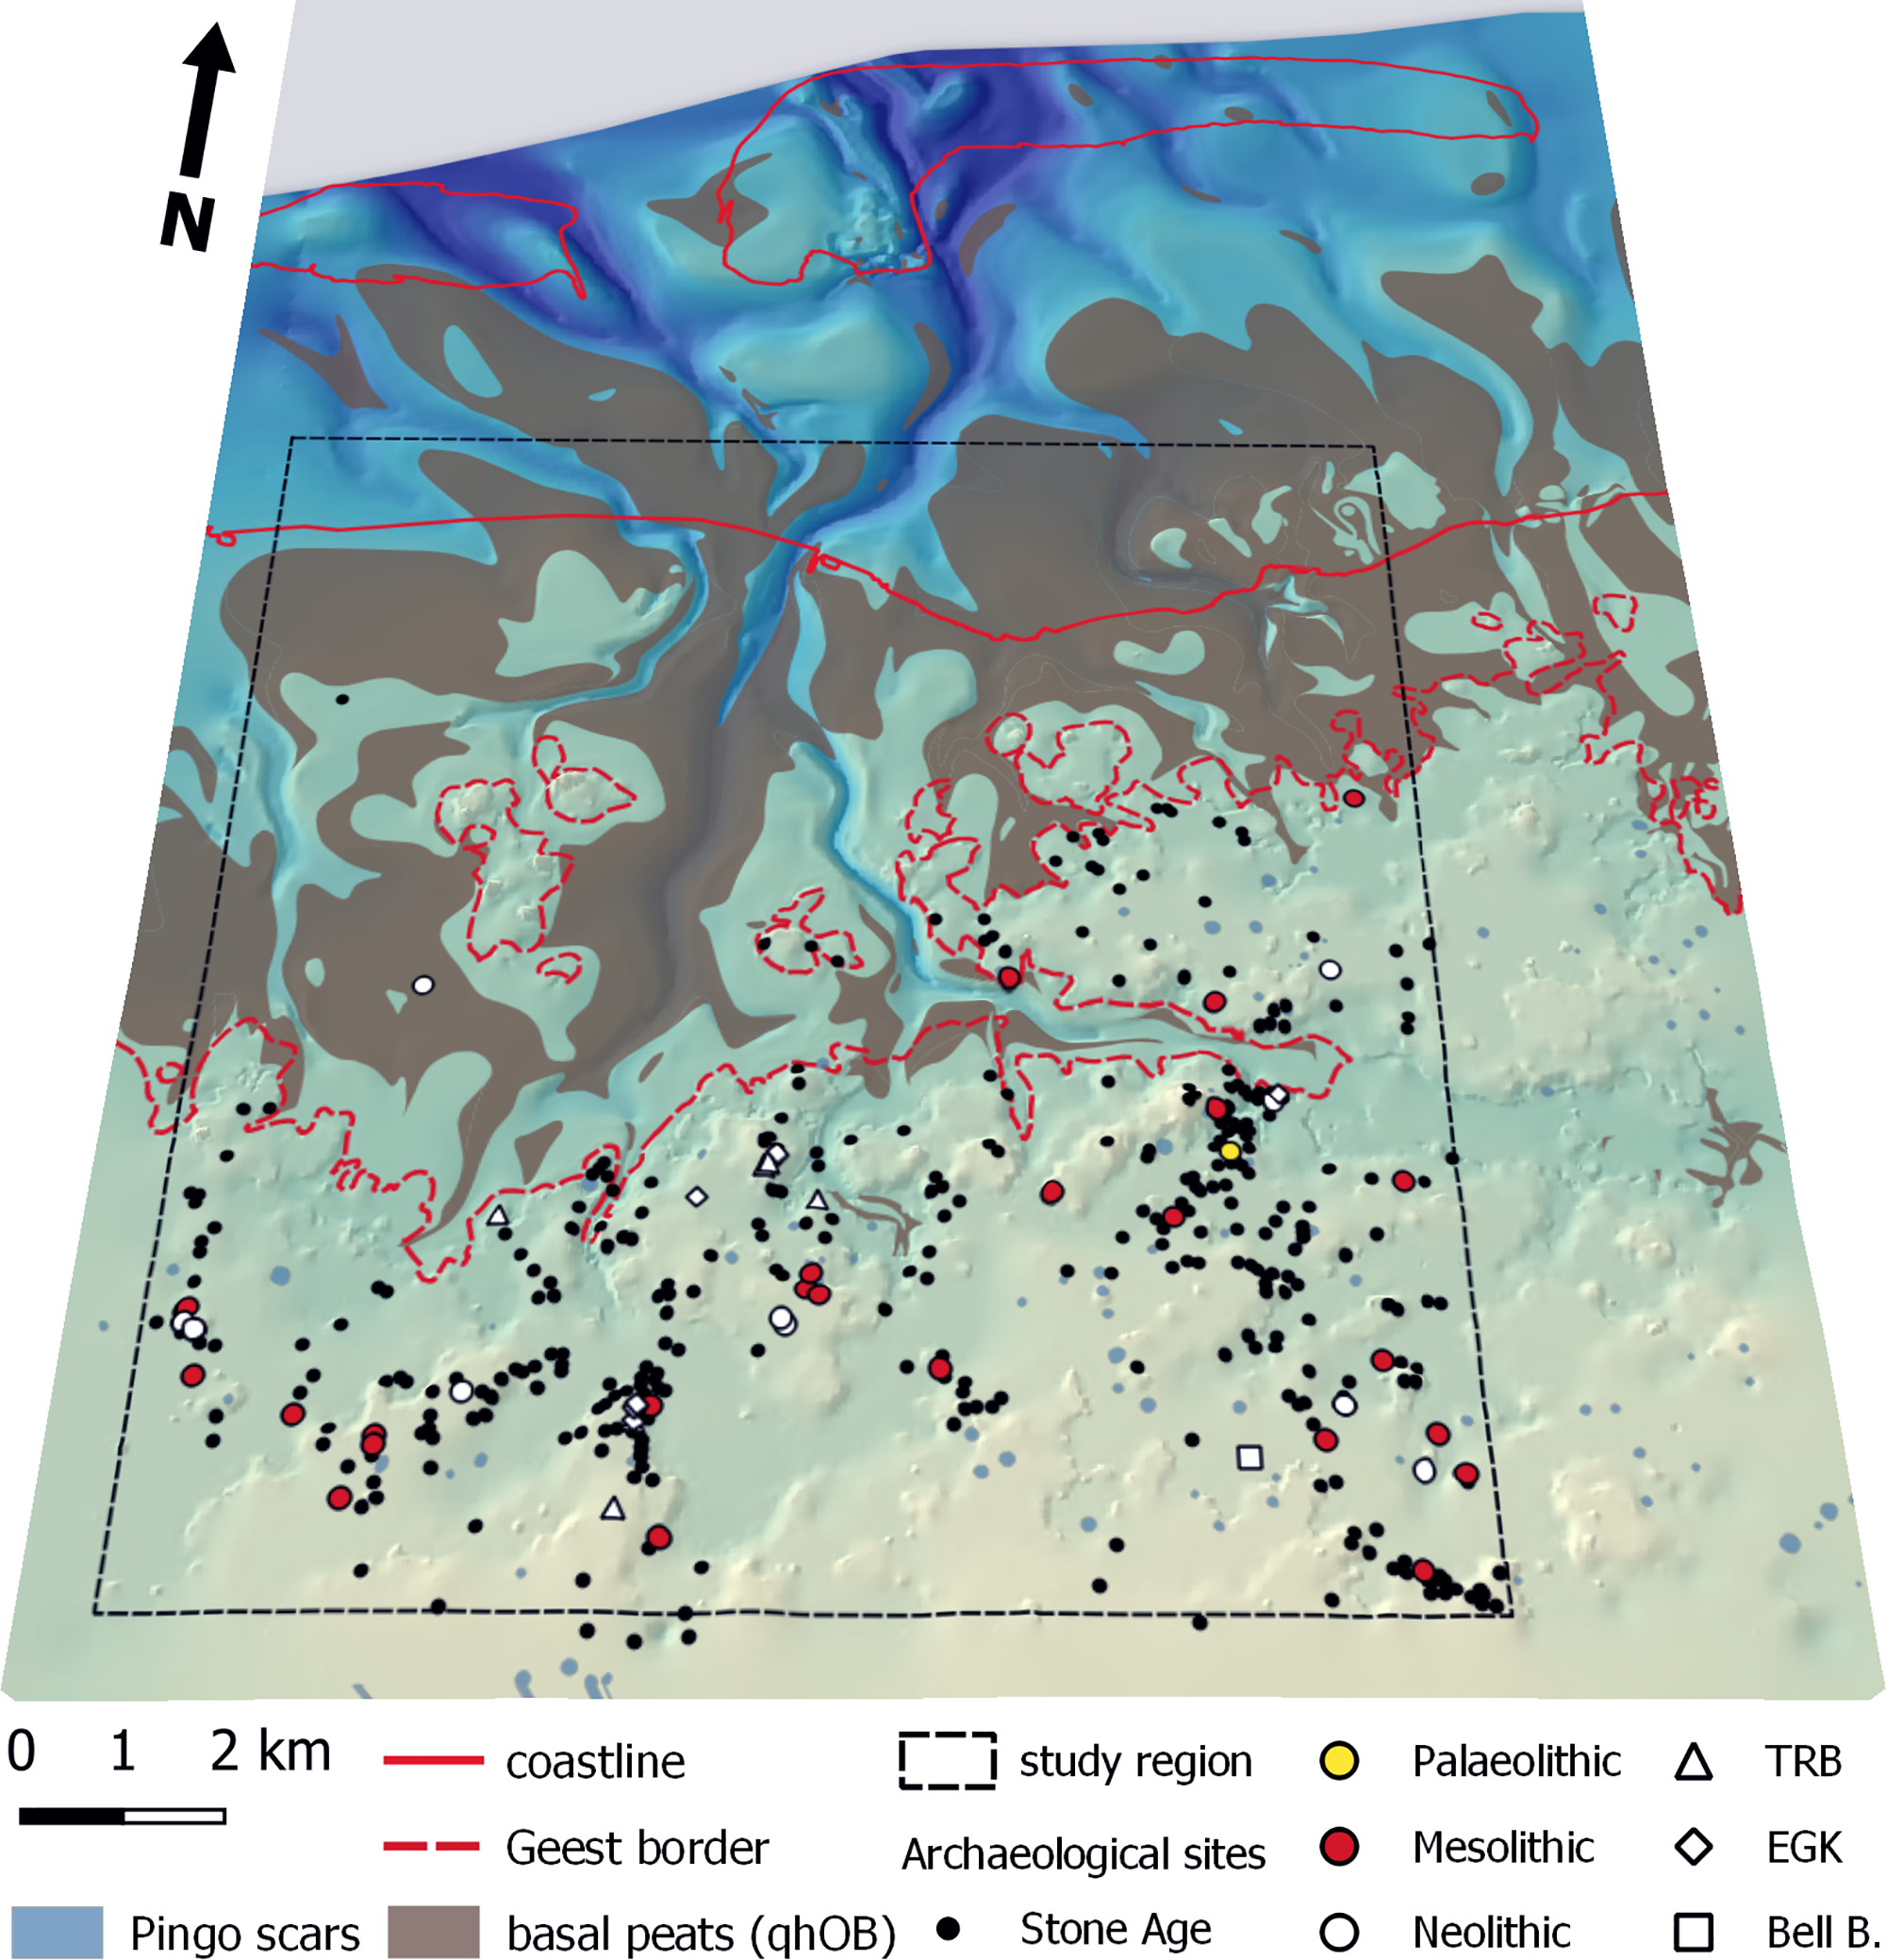
To circumvent this problem, the project initially selected three suitable regions on the East Frisian mainland, whose natural environment is as similar as possible to the originally landlocked areas that lie beneath the Wadden Sea today. At the same time, the regions’ archaeological data basis had to be as dense through as many periods as possible. The choice was made for a region predominantly characterised by moors at Friedeburg, a second comprising the Ems estuary and its embankments, and a third – as the largest and most important region – a direct contact of Geest and tidal marshland in the vicinity of Dornum. The latter proved to be particularly suitable and came into the investigation’s focus (Fig. 1).
Map of the study region. Archaeological sites are plotted according to their typo-chronological classification (see section ‘Archaeological data’).
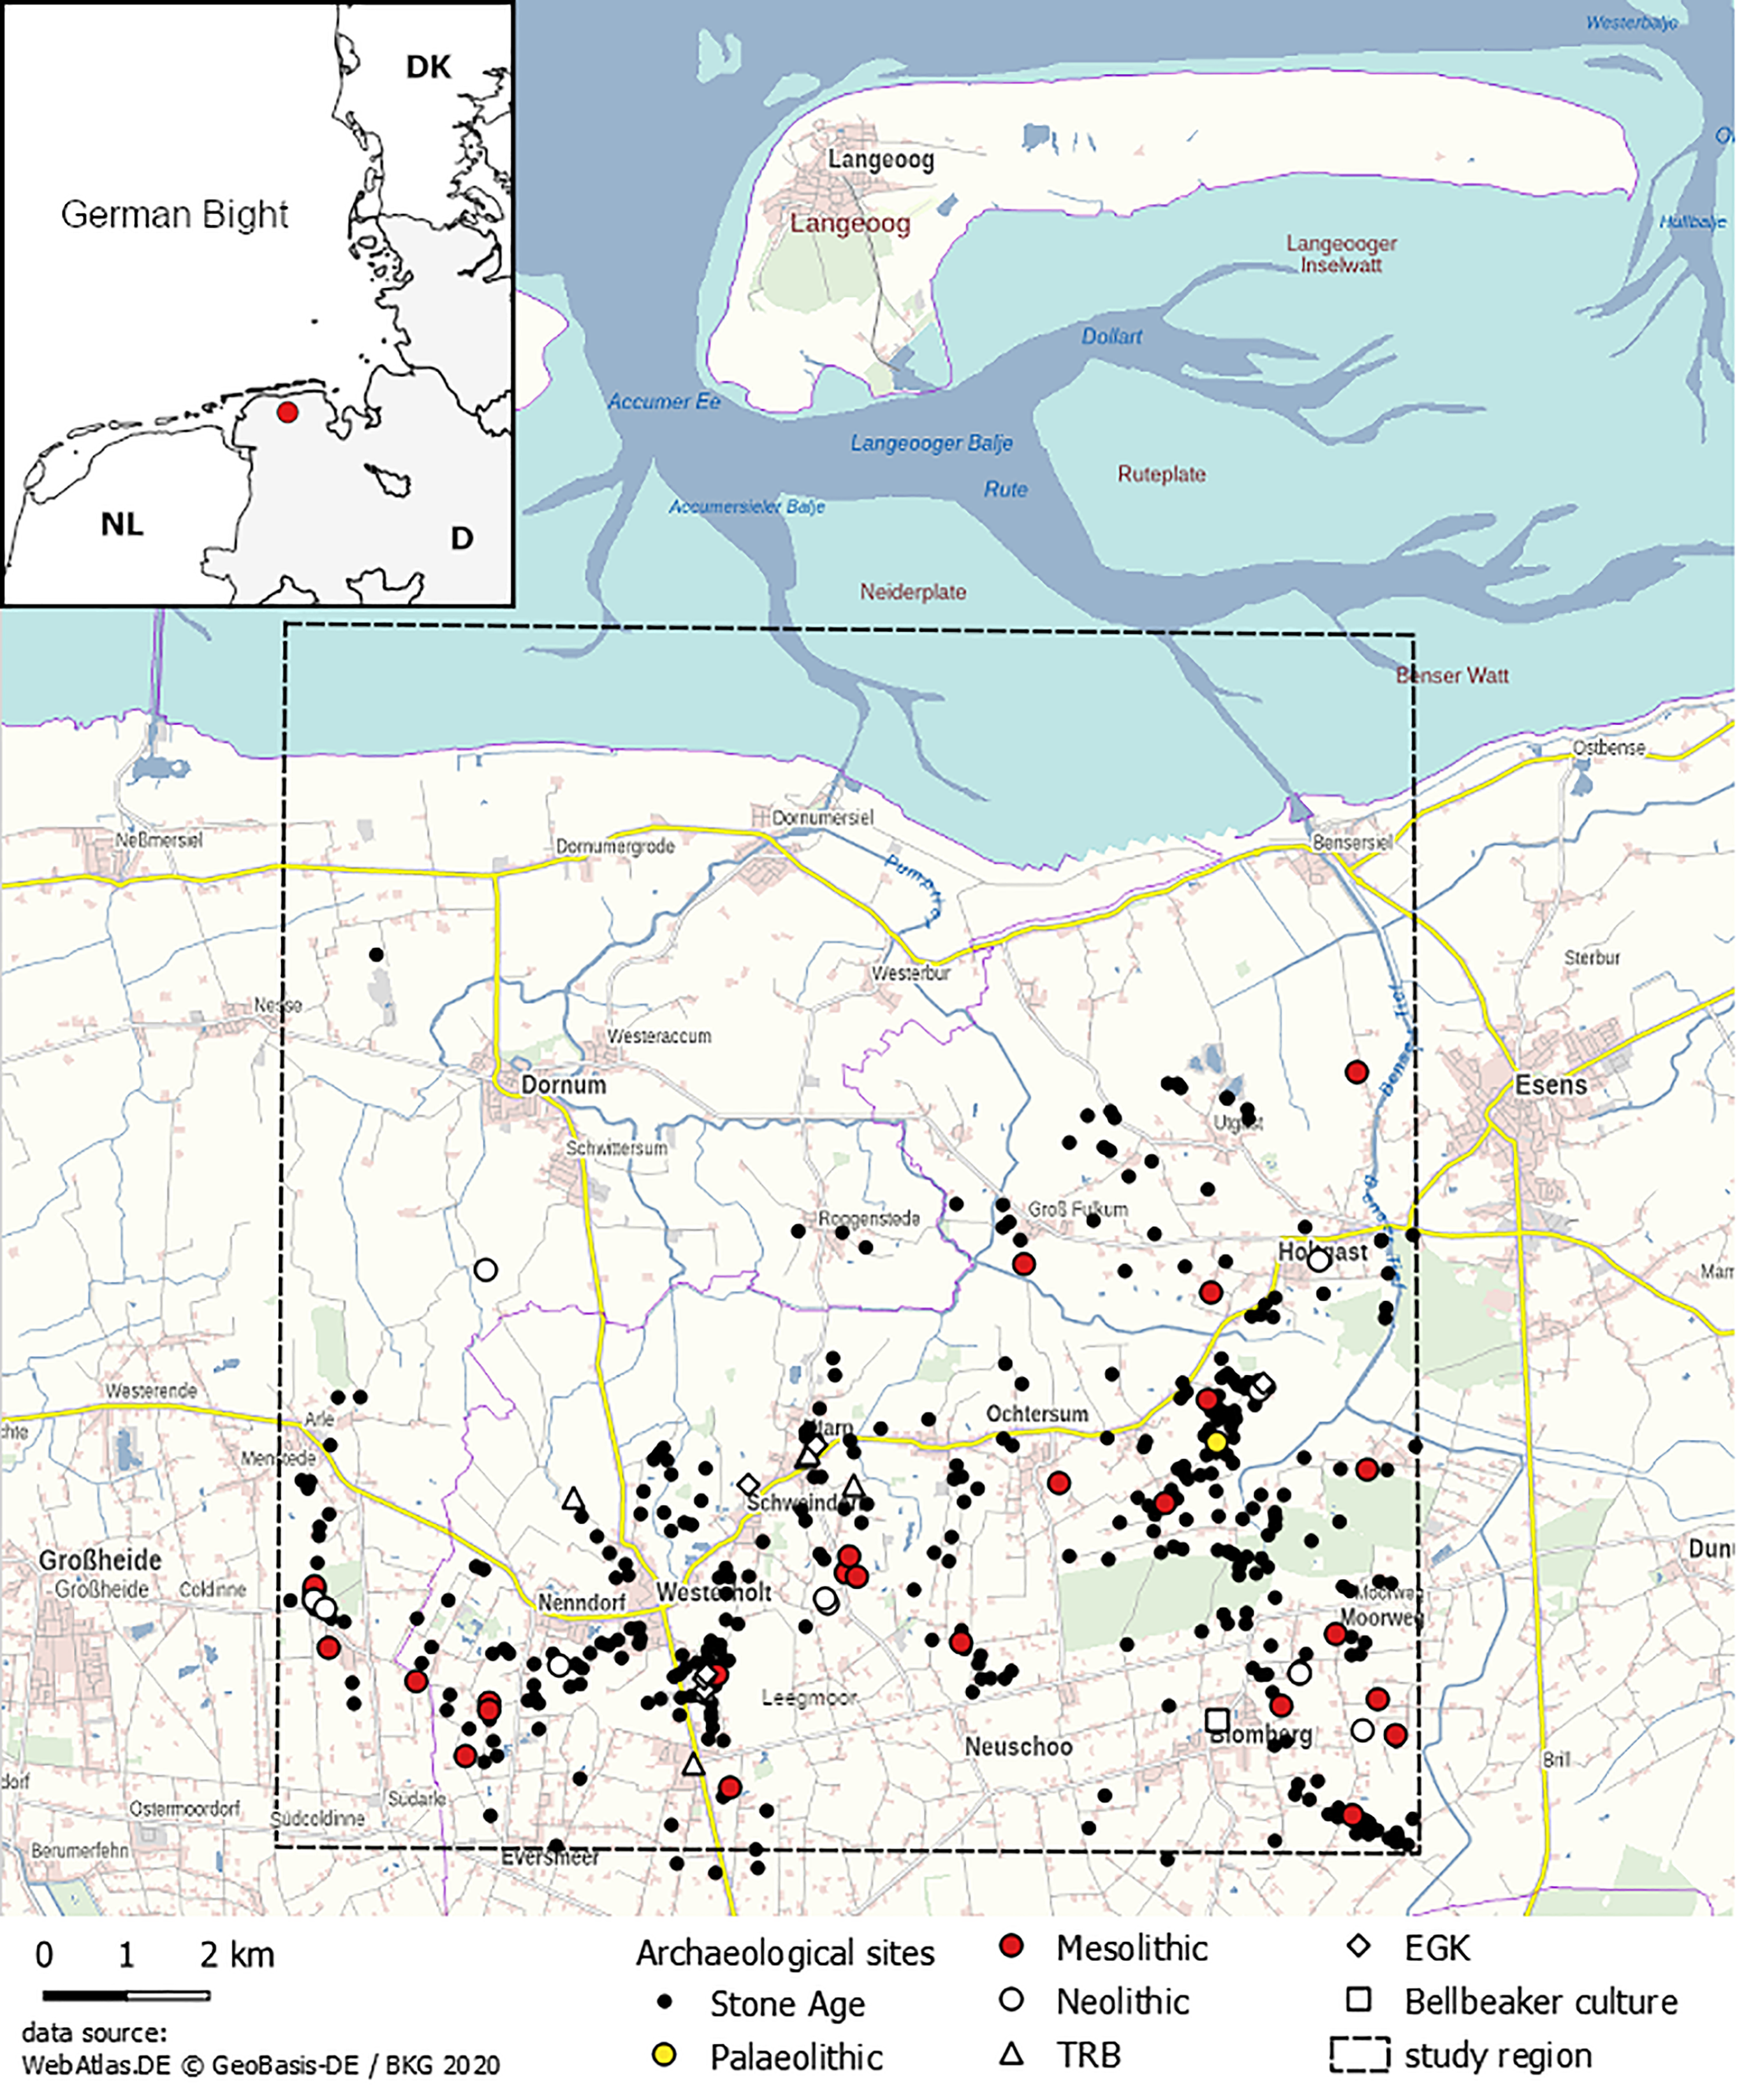
The study region comprises an area of 13.8 by 14.8 km (204.2 km2) centred around the prehistorical Dornumer tidal basin, a set of palaeovalleys and -channels that were successively covered by marine transgression, vanishing around 2500 BP or some time thereafter (Vos & Knol, Reference Vos and Knol2015: 158–159). Today the region lies at the East Frisian peninsula’s central northern coast, bordering the Wadden Sea. Politically it is part of the state of Lower Saxony, Germany. Northern boundaries are the island of Langeoog and its back-barrier system of tidal flats and channels. To the south, the East Frisian Geest rises up to 6.5 m NHN.Footnote 2 The region consists of three major classes of coastal morphology from north to south: the Wadden Sea, the tidal marshes and Geest. Historically this covers a large variety of landscapes, each with its own natural and cultural features in different periods. These can be understood and described as habitats having different characteristics and potential for human settlement and land use during the individual periods (Karle & Goldhammer, Reference Karle and Goldhammer2017: 225).
Today, the region is considered rural, being largely characterised by agricultural land use. The coastal strip and the island of Langeoog are tourist regions. On the mainland, these are dominated by the holiday resorts of Dornumersiel and Westeraccumersiel, while on the island touristic focus is on the northwestern end. Even though the island is not part of the study region, it is worth noting that over a dozen Stone Age finds have been made there along the beaches and tidelands surrounding the island. All of them are single finds that have been washed up from the North Sea, comprising various flint, bone and antler tools, including microliths (Niederhöfer, Reference Niederhöfer2016: 188–193; cf. ibid. catalogue entry nos. 83, 100, 103).
General Holocene development
As per our previous remarks, the area consists of the East Frisian Geest uplands with their sandy to loamy soils, melting sands and cover of aeolian sands to the south and tidal marshlands with marine sediments to the north, which formed successively under tidal conditions in the Holocene. As a result, they are characterised by low elevation, small streams and clayey soils. Marine sediments often reach a thickness of several metres on top of the glacial deposits underneath, likely covering fossil topsoil horizons (‘Dwöge’) and prehistoric sites (cf. Streif, Reference Streif1998, Reference Streif2004; Bungenstock, Reference Bungenstock2008; Karle & Goldhammer, Reference Karle and Goldhammer2017). Examples of this phenomenon are sites like Heeveskesklooster, Oldeboorn, Steenendam and Wetsingermaar in the Netherlands (Fokkens, Reference Fokkens1998; Raemaekers et al., Reference Raemaekers, Aalders, Beckerman, Brinkhuizen, Devriendt, Huisman, De Jong, Molthof, Niekus, Prummel and Van der Wal2012; Kamstra et al., Reference Kamstra, Peeters and Raemaekers2016), as well as Bunderneuland, Oldersum and possibly Osteel in Germany (Bärenfänger et al., Reference Bärenfänger, Schwarz and Stutzke1995; Schwarz, Reference Schwarz1995; information on Osteel kindly provided by S. Mahlstedt, Lower Saxony Institute for Historical Coastal Research (NIhK)). Depending on the thickness of these layers, the fossil soils’ preservation varies. Especially in the more recent periods after the Roman Empire, the sedimentary deposits grow so thin that preservation conditions are likely poor. Landscape development in the coastal clay district has also been severely affected by land reclamation and agricultural use since the Middle Ages, being cut off from the sea by dyke building and altered by artificial drainage (Homeier, Reference Homeier1969; Behre, Reference Behre2004).
In contrast, the Geest is of hilly, varied elevation with sandy soils, shaped by glacial moraines and periglaciation during the Pleistocene, featuring a melt water drainage system of basins and palaeovalleys. Individual Geest hilltops protrude among the tidal marshes at Dornum, Westeraccum, Schwittersum and Roggenstede. Archaeological finds show that these predominantly flood-proof areas have been inhabited at least since the Roman Iron Age (Schwarz, Reference Schwarz1990: 131, 218ff.).
Between 9000 and 8000 BP, the rising sea reached the equivalent of today’s coastline, drowning the Doggerbank after cutting the land connection between continental Europe and the British Isles (Behre, Reference Behre2003). The still rapidly growing North Sea is thought to have been flooding landwards through the aforementioned palaeovalleys, which in turn are expected to have been developing into estuaries ‘with tidal channels and flats along their margins’ (Karle & Goldhammer, Reference Karle and Goldhammer2017: 227). Subsequently groundwater levels would increase, allowing for a succession of freshwater marshes and peat bogs to form along the nearshore Pleistocene topography. With rising sea levels, these bogs would eventually be drowned and covered by marine sediments, the marsh, bogs and peat growing landwards in the process. As such, they often form the basal sedimentary sequence in the Holocene, followed by a complex stratigraphy of clastic and organic sediments (Streif, Reference Streif1998, Reference Streif2004). In the study region, such basal peats extend over huge areas, today mostly covered with Holocene sediments (cf. Streif, Reference Streif1998, Reference Streif2004). In some areas they might have been reworked by channel migration, storm surges or were unable to grow. The Holocene sequence reaches thicknesses between <1 m and >20 m in the deepest valleys and channels.
Maps of current soil typesFootnote 3 also show widespread wetting phenomena on the Geest area, mostly in the form of pseudo-gleying; in low-lying areas, increased gley formation can be observed. Likewise, channels feature extensive lowland moors. In some areas of wet woodland, such as at Klosterschoo, lowland moors today are still several decimetres thick and reach up to at least 5.5 m NHN. First results of local drilling surveys, however, suggest that these upper sections of peat formed over the course of the first millennium AD and therefore had no influence on the Meso- and Neolithic landscape (A. Siegmüller, unpublished report, archived at NIhK). During the Stone Age, this area was likely covered by relatively dry soils characterised by Regosols or brown earths.
Investigation of this very dynamic part of the landscape is methodologically challenging but contributes to our understanding of the processes taking place in the Wadden Sea area today. In order to model the region’s prehistoric topography, it has been of great importance to focus efforts on detecting fossil surfaces. Sediment layers in between such surfaces indicate transformative conditions, thus signifying an interruption or end to human habitation.
The most reliably detectable surface supporting habitation is the Holocene base, which also likely featured the most continual general relief following the Pleistocene. Still, it needs to be taken into account that geological processes, especially erosion, transformed this surface before it was covered by and subsequently sealed beneath marine sediments. The Holocene base map proposed by Streif (Reference Streif1998) describes the contact relief between glacial deposits and Holocene sediments as it is today. However, it differentiates neither the contacts’ time of formation nor their nature. It is therefore necessary to look again in detail at where fossil surface soils are still preserved, since only in these cases is a reconstruction of the prehistoric relief feasible.
A particular challenge is deep channels running through the Holocene base. Without thorough geological investigation, it is often difficult to tell whether they are of Pleistocene origin or whether they eroded the Holocene base in later events (cf. Cohen et al., Reference Cohen, Westley, Erkens, Hijma and Weerts2017; Schaumann et al., Reference Schaumann, Capperucci, Bungenstock, Bartholomä, Enters, Wehrmann and McCann2020). Conversely, knowledge of the early postglacial morphology predating Holocene sea-level rise is essential for understanding the distribution of the various sediment successions in the coastal plain and, by implication, the subsequent formation and possible spatial extent of fossil soils (cf. Karle & Goldhammer, Reference Karle and Goldhammer2017: 225). Indeed, stratigraphical investigations at Rodenkirchen in Wesermarsch county suggest that the Pleistocene relief influenced the local topography up until the Bronze Age (Bungenstock, Reference Bungenstock2008).
It is against this background that, in the following, we present and discuss a DEM of the Dornumer tidal basin area. We focus on the Boreal to early Subboreal periods as the basis for our spatial analysis of Stone Age environmental and settlement conditions.
Methods and materials
A digital elevation model (DEM) of the Dornumer Holocene base topography
In order to assess potential Stone Age settlement areas in those parts of the study region covered by marine clay, it was first necessary to create a terrain elevation model of the Holocene base topography. To this end, we combined existing elevation datasets. On the one hand, we use the previously mentioned Holocene base map as proposed by Streif (Reference Streif1998) and, on the other hand, data from topographic surveys conducted in Lower Saxony between 1947 and 1965 for the ‘Deutsche Grundkarte 1:5,000’ (DGK5).Footnote 4
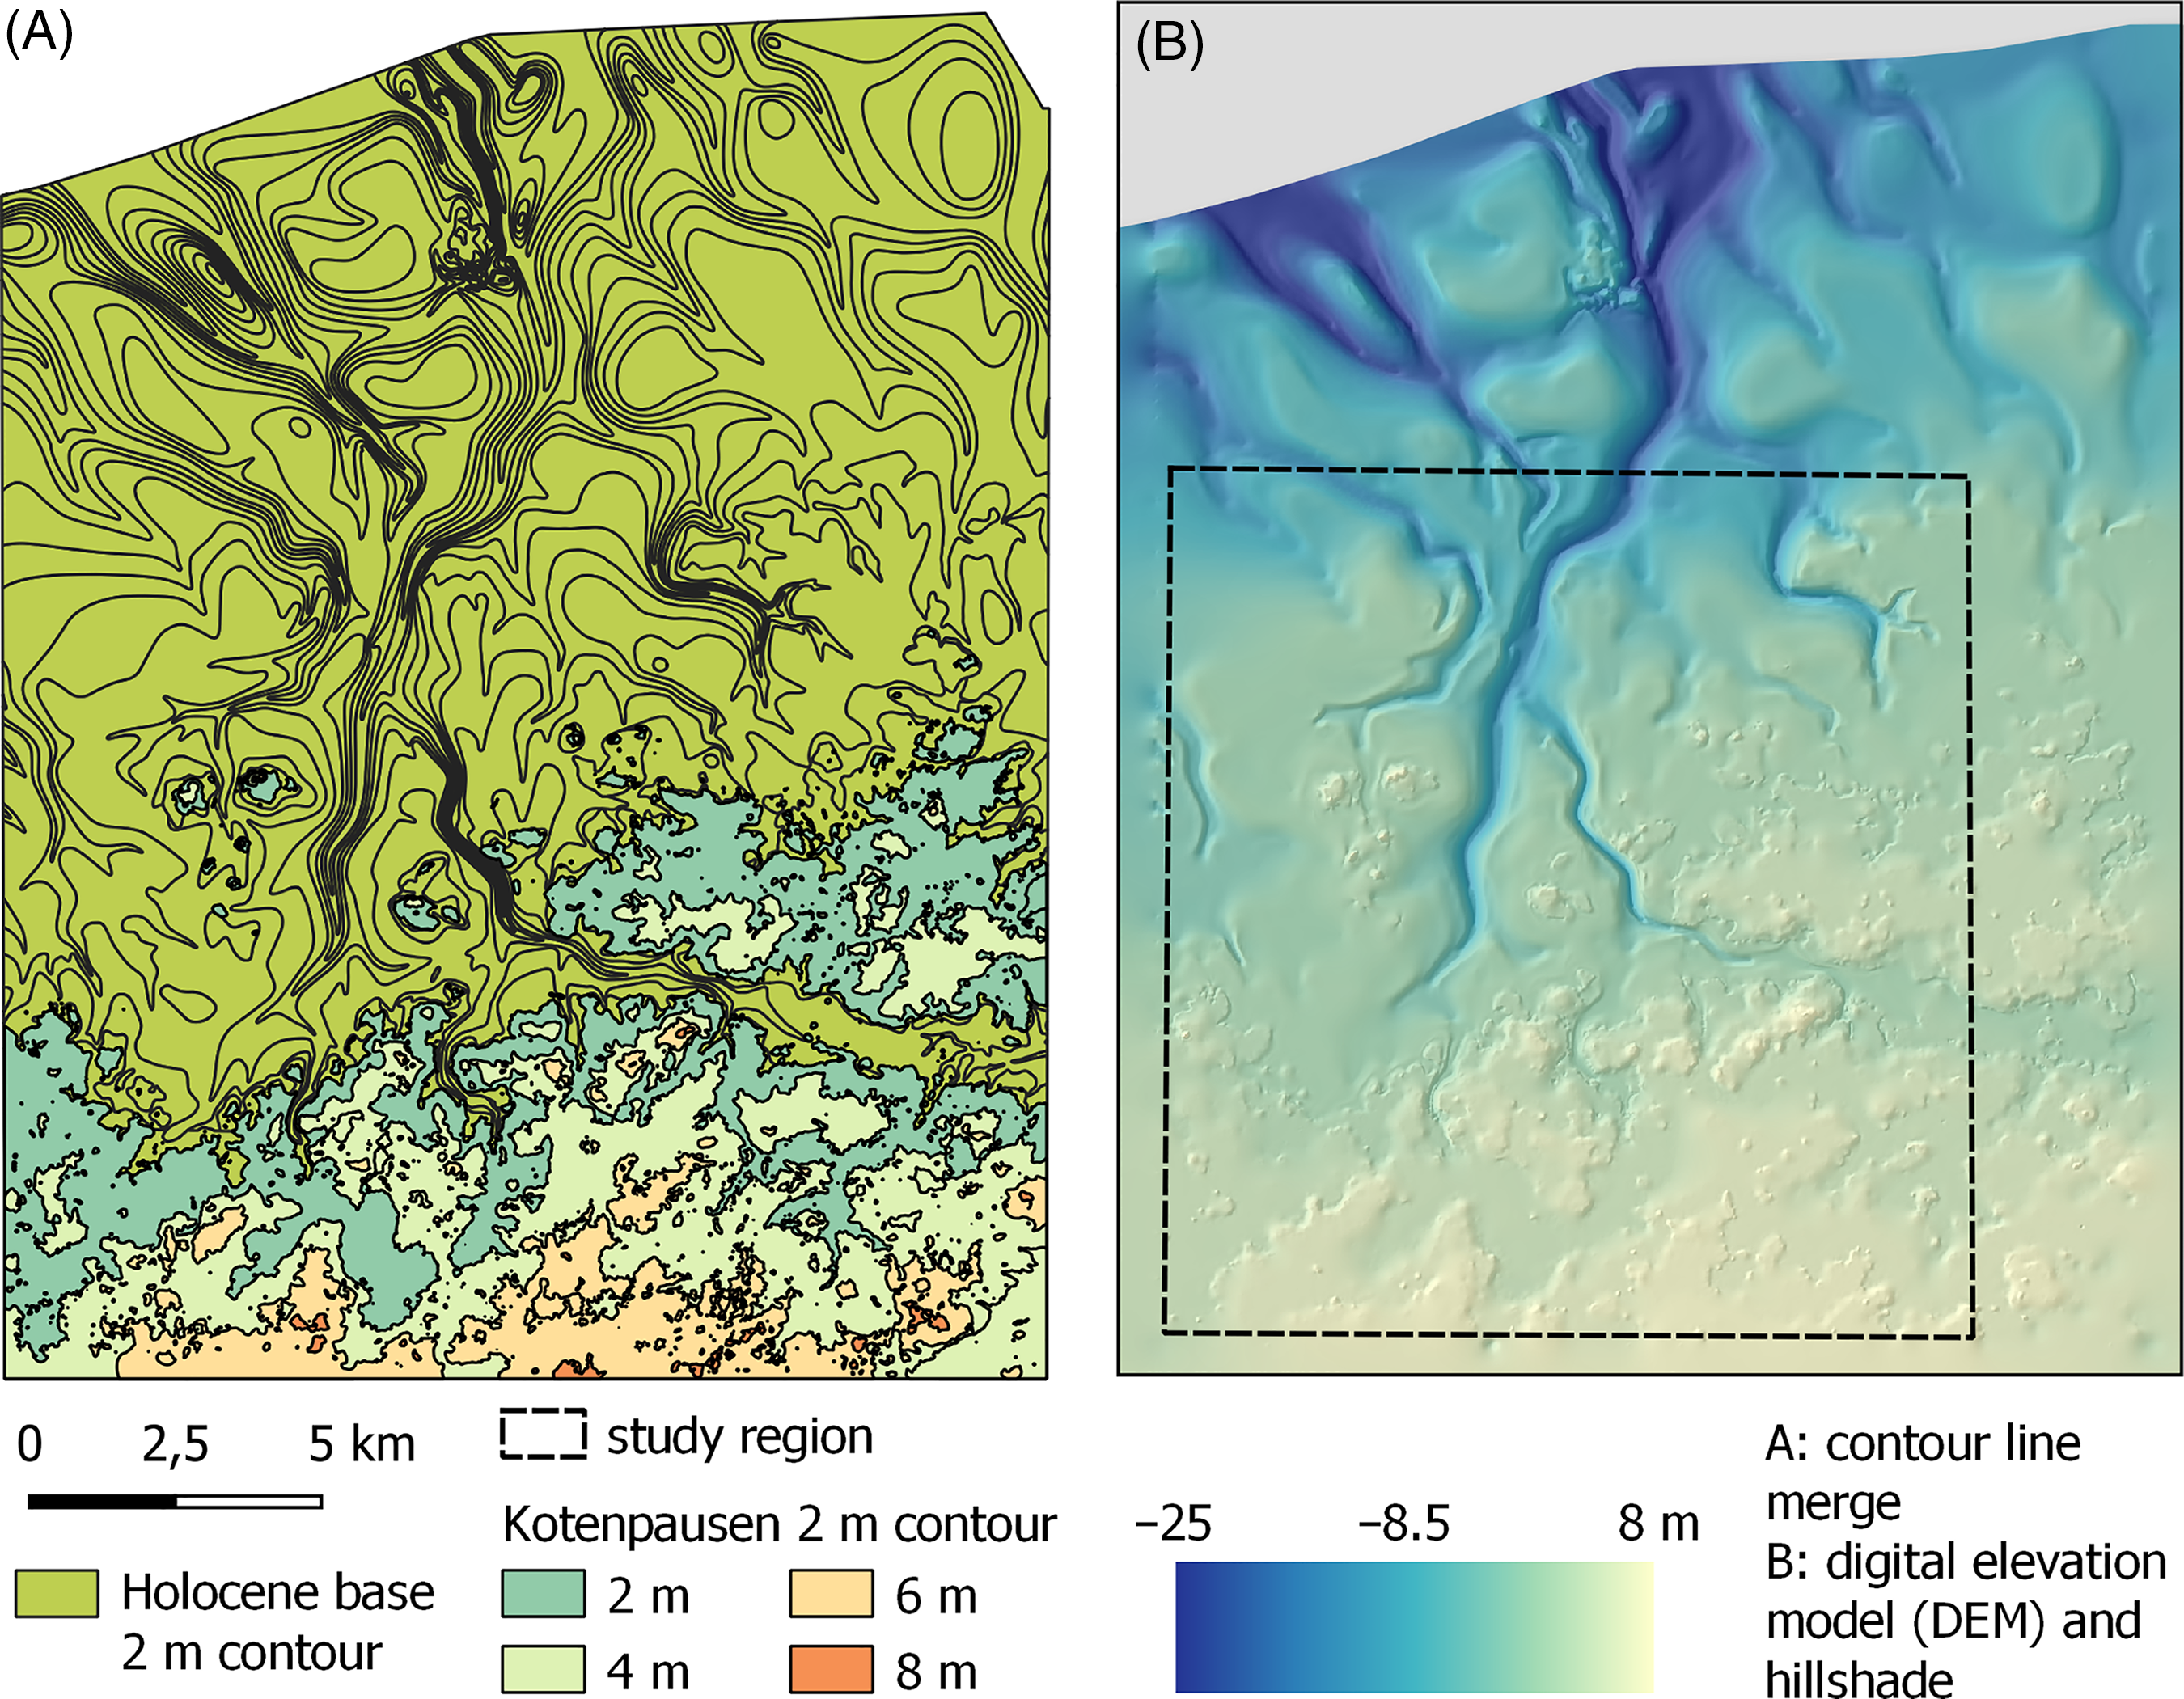
The Holocene base map’s elevation data are digitally available in vector-based, 2 m contour lines, covering the entire length of Lower Saxony’s coastline (GHBK25). Streif’s map, however, does not provide elevation data for areas above NHN and the Geest. To include those areas of our study region not covered by the Holocene base map, historical survey data were utilised. These elevation data are available in the form of analogue map sheets, so-called ‘Kotenpausen’. Originating from the 1950s and 1960s, they help to exclude at least the most recent anthropogenic relief changes from our model (Spohr, Reference Spohr2010), even if the data’s density is lower than in high-resolution DEMs provided by national surveys today. For this purpose, the analogue maps were digitised in the software QGISFootnote 5 and converted into 2 m contour lines for merging with the Holocene base map. By using the latter as a polygonal vector mask, we extracted those areas that had no elevation information, and replaced them with the corresponding Kotenpausen data, merging the two into a single vector-based dataset, filling gaps manually (Fig. 2A). In order to translate the dataset’s elevation information from widely spaced contour lines to a DEM with continuous relief, computer-aided interpolation was applied. Calculations were performed using a multilevel B-spline algorithm as implemented by O. Conrad (Reference Conrad2006)Footnote 6 in the open-source software SAGA-GIS, which comprises a wide range of tools for geoscientific analyses of grid data (Conrad et al., Reference Conrad, Bechtel, Bock, Dietrich, Fischer, Gerlitz, Wehberg, Wichmann and Böhner2015). Based on the works of Lee et al. (Reference Lee, Wolberg and Shin1997), the B-spline algorithm is suited to interpolate continuous grid data from irregularly spaced point geometries like our vector-line dataset. We consider the resulting grid-based DEM an approximation of the study region’s Holocene base topography, being subject to the restrictions set out in the previous section (‘General Holocene development’) as well as those concerning the Kotenpausen data. While these areas appear much more detailed, they have also been exposed to natural processes and human activity in a starkly different manner than those beneath the tidal marsh. This is to be taken into account when considering further analysis.
Merging of vector-based elevation data (A) and resulting DEM after interpolation (B). The model covers a larger area than the study region in order to include the Wadden Sea’s palaeotopography.
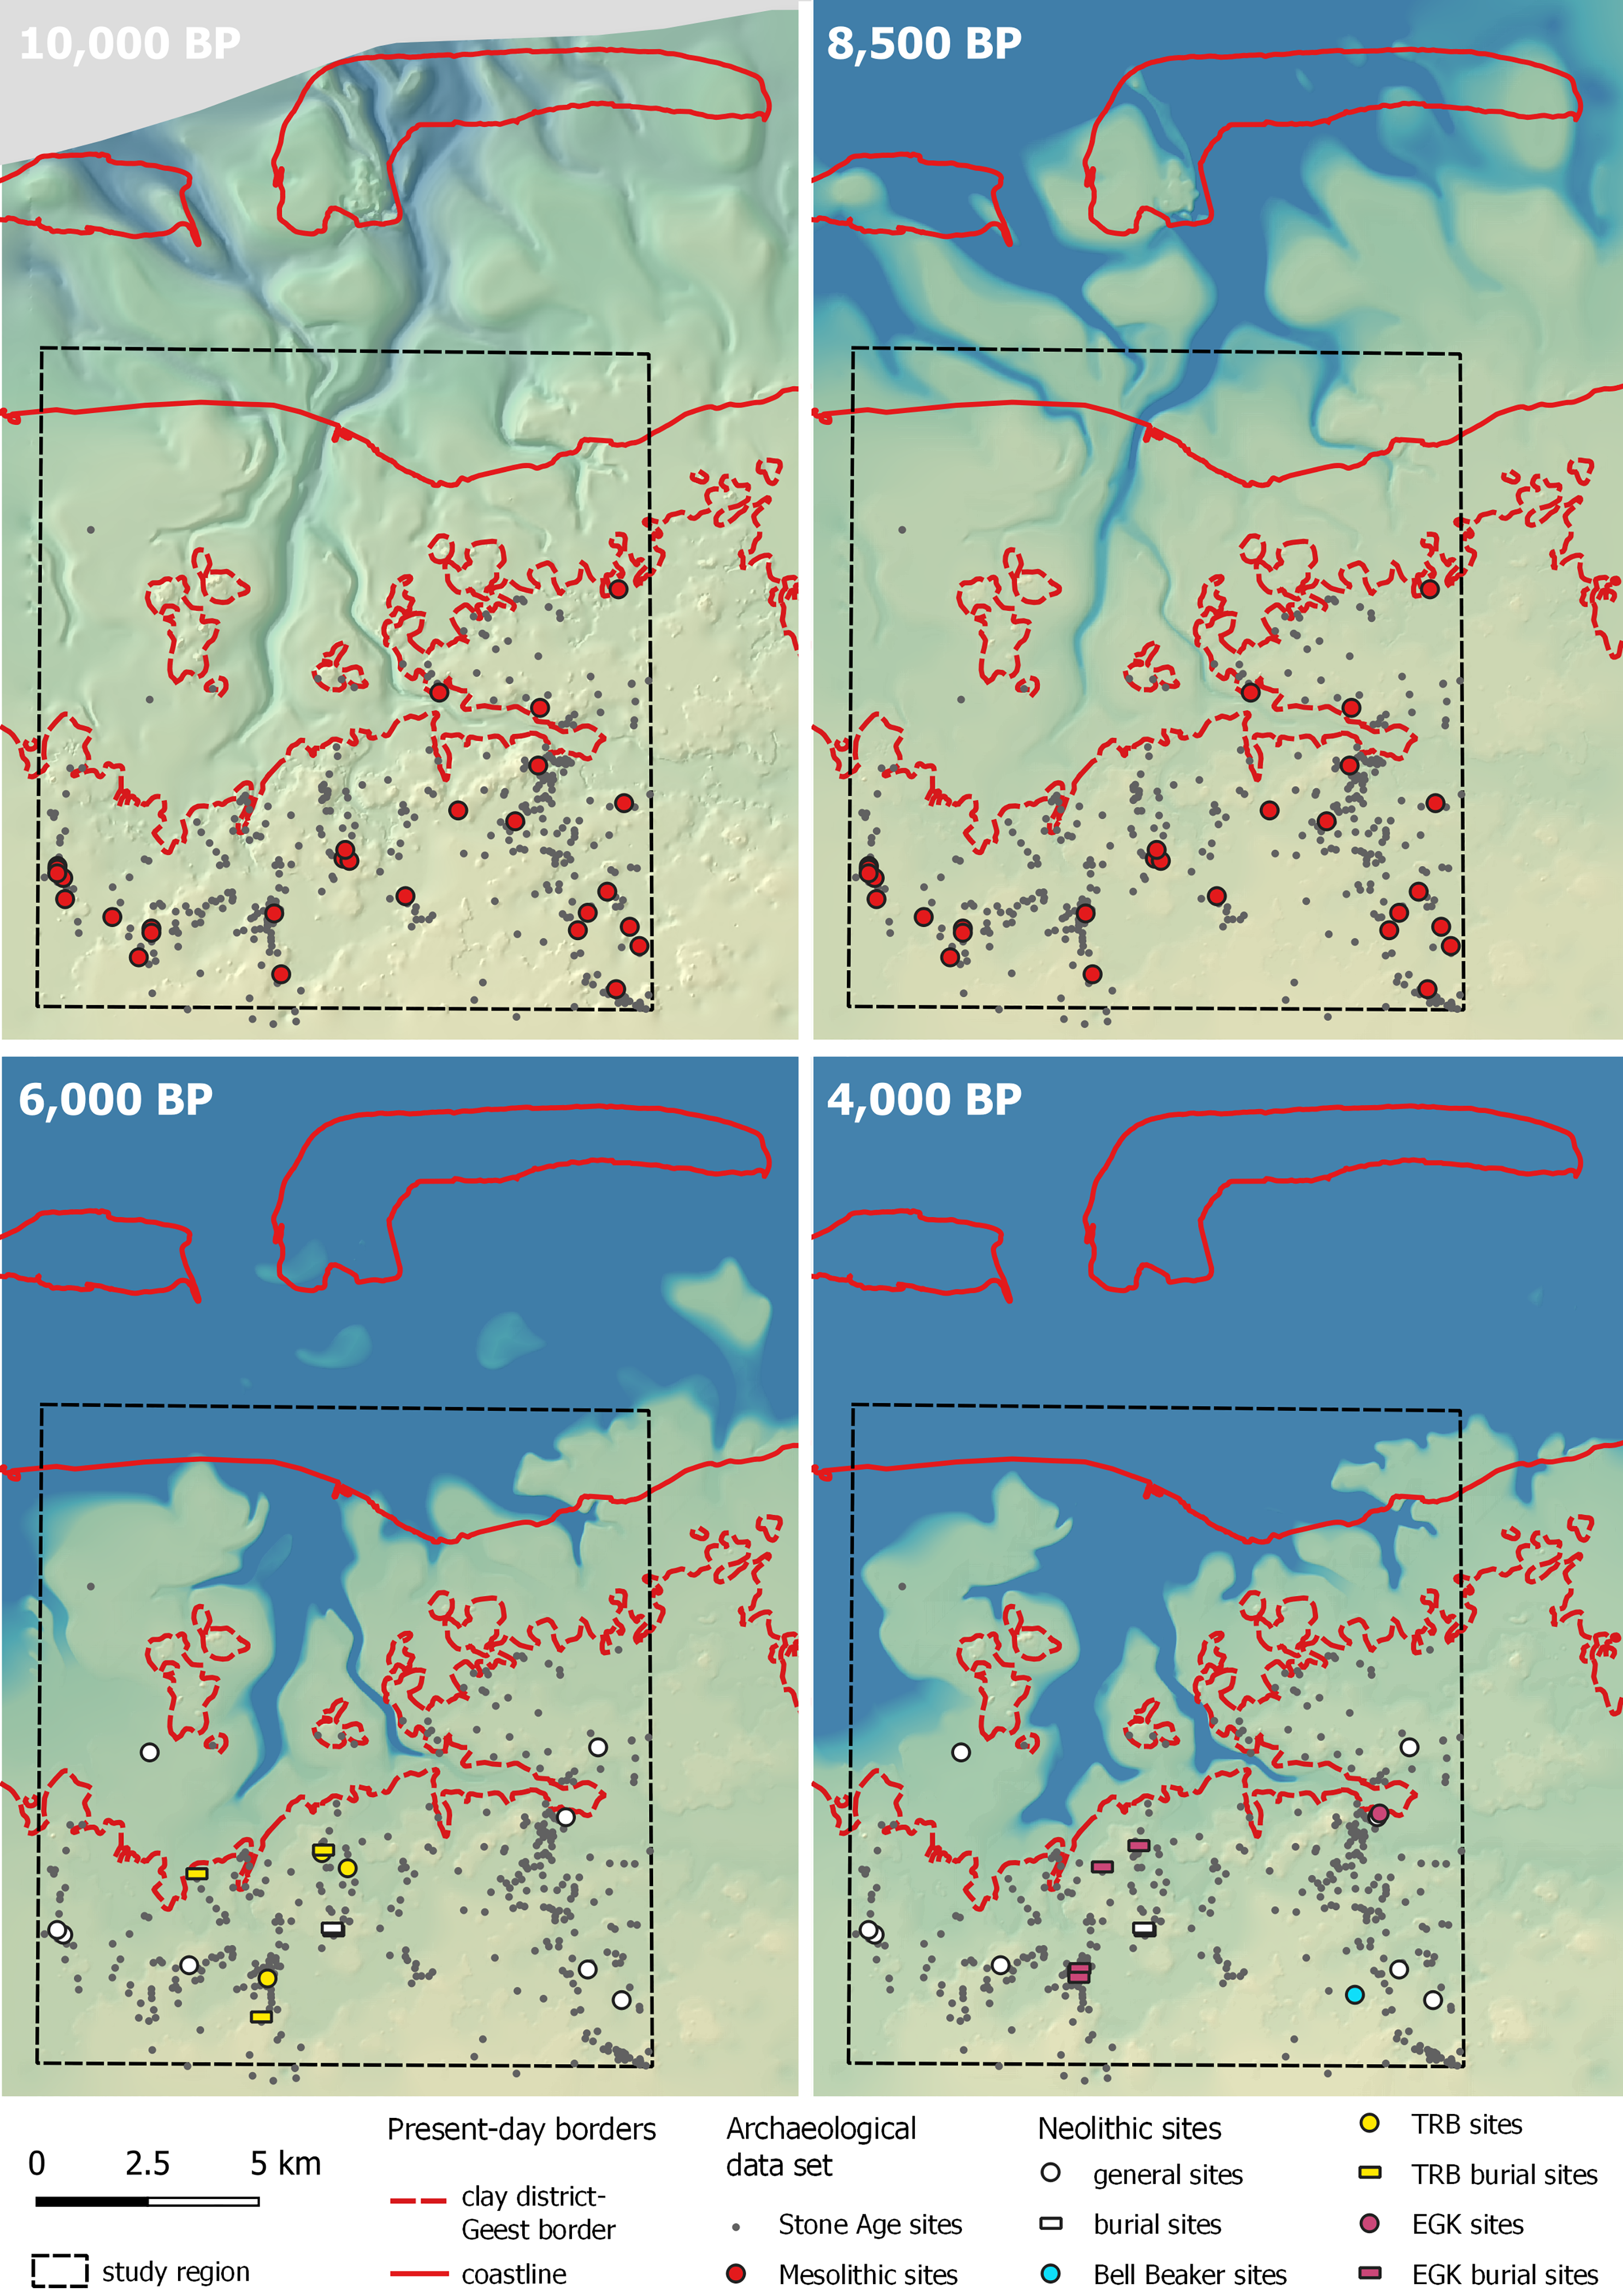
In the next step, we applied several stages of Holocene sea-level rise to the DEM to estimate how much land mass was available for human habitation and use at different times over the course of the Boreal, Atlantic and early Subboreal periods. To this end, modelling was carried out for four different Stone Age time slices applying the sea-level index curve proposed by Bungenstock et al. (Reference Bungenstock, Freund, Mauz and Bartholomä2020) for the island of LangeoogFootnote 7 as well as data from Vink et al. (Reference Vink, Steffen, Reinhardt and Kaufmann2007) for the 10,000 BP slice: the early Mesolithic (10,000 BP), the ongoing Mesolithic (8500 BP), the Neolithic/early Funnelbeaker culture (TRB) (6000 BP) and the late Neolithic to beginning Bronze Age (4000 BP).
Studies on sea-level development suggest that palaeovalleys and lowlands beneath the present-day coastline were invaded by the rising North Sea in the first half of the Holocene (Behre, Reference Behre2003; Vink et al., Reference Vink, Steffen, Reinhardt and Kaufmann2007; Bungenstock et al., Reference Bungenstock, Freund, Mauz and Bartholomä2020), likely submerging the study region’s northern part in the early Mesolithic and consequently subjecting the emergent coastline to tidal sedimentation processes. Taking this into account on a schematic level, basic simulation of marine coastal sedimentation effects on the Holocene base DEM was achieved utilising a sink fill module by Wichmann (Reference Wichmann2007) in the aforementioned SAGA software.
This module is based on an algorithm proposed by Wang & Liu (Reference Wang and Liu2006) and is designed to fill surface depressions in high-resolution DEMs while preserving a downward slope along water flow paths (Wichmann, Reference Wichmann2007). The algorithm progressively calculates flow paths by means of priority-queue and least-cost methods along adjacent cells from assumed water outlets (cells of lowest elevation) at the edge of a given DEM. These are then used to fill sinks and pits by raising corresponding cell values up to spill elevation (Wang & Liu, Reference Wang and Liu2006: 8–15) within the constraints of a preset minimum slope gradient along the flow path (Wichmann, Reference Wichmann2007). In consequence, height adjustment of a DEM’s outermost cell row allows controlling what is considered a sink by the algorithm and thus filled (i.e. our model’s ‘sediments’).
Applying this to the model presented in this paper, it is assumed that tidal sediment deposition follows the same general principles: sediments accumulating at the point of lowest elevation, being caught in sinks and pits, while following a gradually flattening downward slope due to in- and backflow effects in tidal processes. The model’s point of lowest elevation is located at its northern edge, where a set of long channels and valleys converge as prominent features of the Holocene base topography (Fig. 2B). To this end, we also assume that these features formed before the North Sea gained any depositional or erosional impact on the region; due to their size and position (converging right beneath today’s position of Langeoog) likely being of Pleistocene origin (cf. Cohen et al., Reference Cohen, Westley, Erkens, Hijma and Weerts2017; see Holocene base map limitations in the previous section (‘General Holocene development’)).
Accordingly, the model is filled from there, the respective cells’ elevation and the slope gradient being adjusted in such a way that the channel network’s fill does not exceed a time slice’s given MSL at its most landward point (i.e. the model’s proposed shoreline). For times in which sea levels are expected to have risen faster than sediment deposition, this results in landward progradation. Inversely, seaward progradation can be achieved by exceeding that limit. Still, individual sinks above the chosen limit would be affected either way as the algorithm sets out to connect them to a water outlet at the edge of the DEM. To prevent alteration of above sea-level topography, cells with such an elevation thus were excluded from the calculation and re-added in a subsequent step. In consequence, this model remains somewhat simplistic overall since more complex factors such as tidal range, formation of the East Frisian barrier islands, flow dynamics in channel systems, barrier beach formation or extreme events like storm surges, which may play a significant role in deposition processes, were not taken into account. As such, our model may only provide broad estimations of early Holocene topography development to help identify areas accessible to Stone Age communities.
Subsequently, the DEM was ‘flooded’ up to the respective MSL for each time slice as derived from Bungenstock et al. (Reference Bungenstock, Freund, Mauz and Bartholomä2020), who analysed Holocene sea-level development for the island of Langeoog, located in our study area’s northern part. In this way, the resulting DEMs give an approximate impression of the available habitat at different stages of the Stone Age, even if important factors for anthropogenic usability such as increasing ground wetness, vegetation and subsequent peat growth are merely considered at a general level only partly supported by local data (see ‘Radiocarbon dates and coastline progradation’ and ‘Vegetation’ below). These shortcomings are to be addressed in the course of the project, implementing existing data and new results obtained in the botanical subproject (Bittmann et al., Reference Bittmann, Capperucci, Bartholomä, Becker, Bungenstock, Enters, Karle, Siegmüller, Wehrmann, Wurpts and Zolitschka2020; Schlütz et al., Reference Schlütz, Enters and Bittmann2020).
Radiocarbon dates and coastline progradation
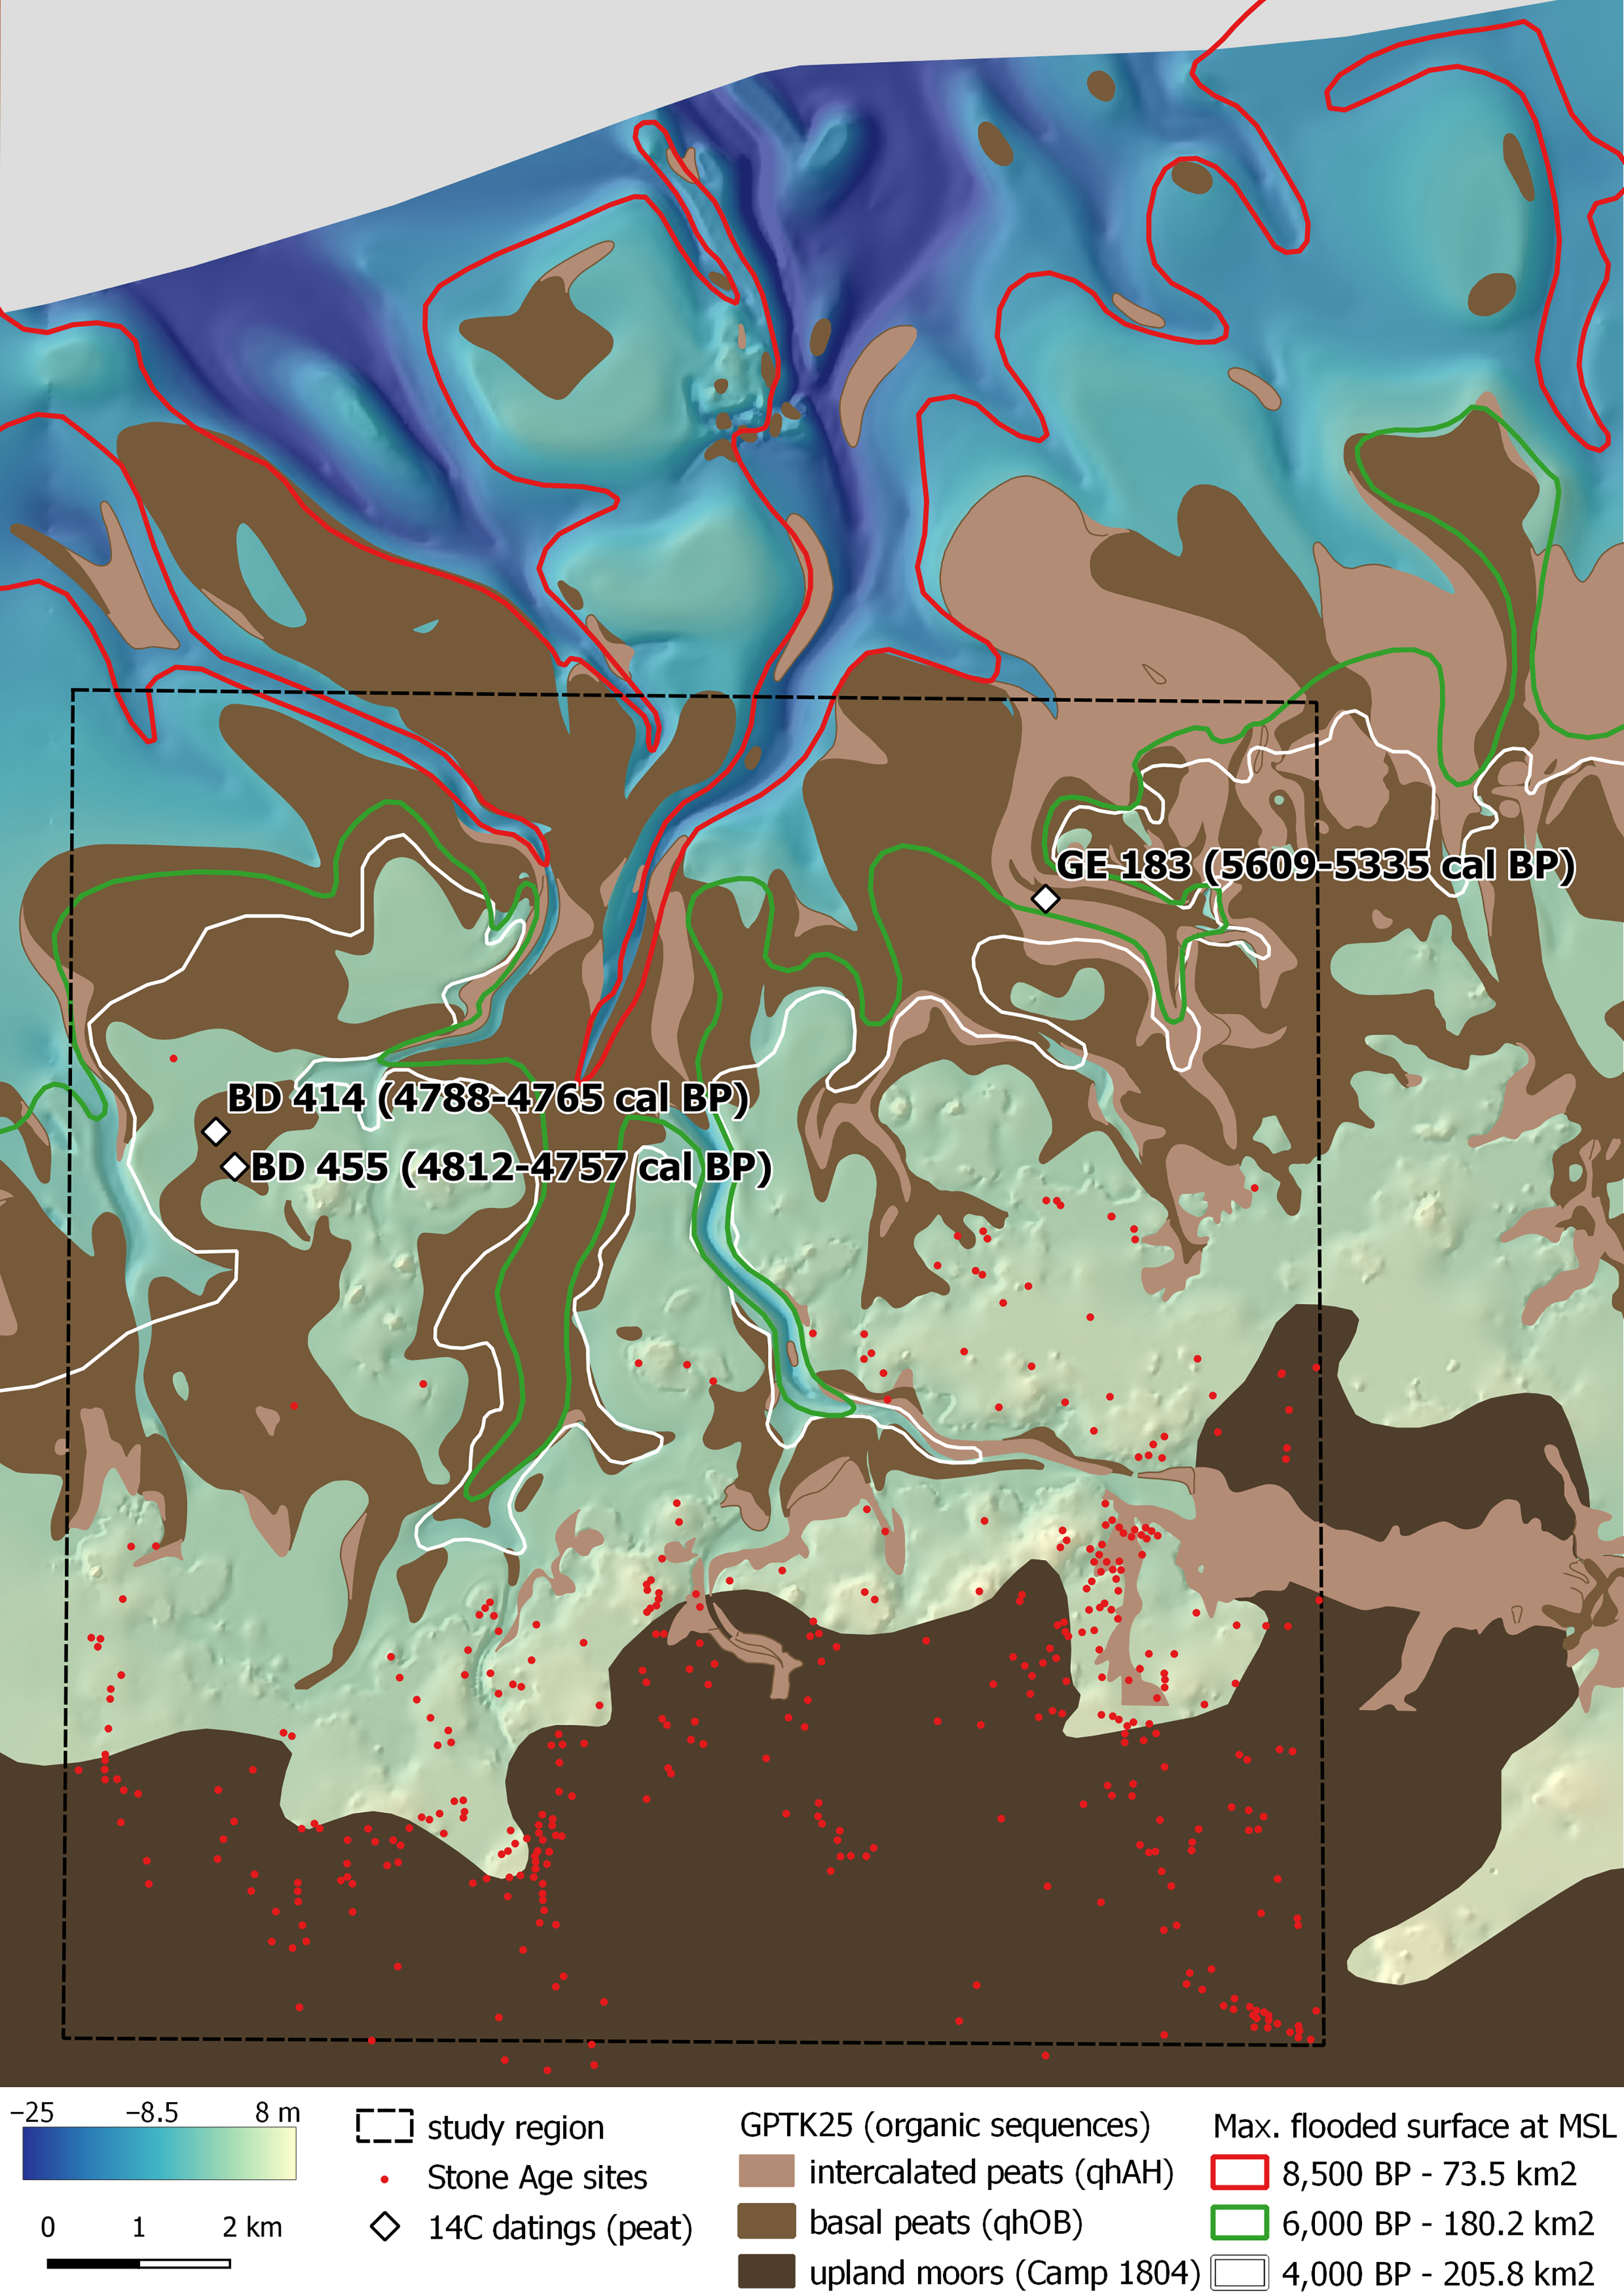
Absolute dates supported by radiocarbon samples from the tidal flats and coastal area overall are limited (Karle & Goldhammer, Reference Karle and Goldhammer2017: 226), but with 17 samples from 9 cores being available from Langeoog’s back-barrier tidal system as well as from Bensersiel on the mainland, most of which are dated younger than the Stone Age (Bungenstock & Schäfer, Reference Bungenstock and Schäfer2009: 37–38; Bungenstock et al., Reference Bungenstock, Freund, Mauz and Bartholomä2020). One sample taken from intercalated peats at −5.8 m NHN northwest of Bensersiel is dated 3659–3385 cal BC (cf. core GE 183 in Bungenstock & Schäfer, Reference Bungenstock and Schäfer2009: 37–38, fig. 3 and tab. 1), which corresponds to the Middle Neolithic. Geological maps suggest a wide extent of peat bogs at the Holocene base as well as smaller areas of intercalated peats (GPTK25), but of which only a few have been analysed. Due to possible erosion by storm surge events as well as peat compaction, it is hard to estimate how long they existed (cf. Bungenstock & Schäfer, Reference Bungenstock and Schäfer2009: 35, 44–48; Vos & Knol, Reference Vos and Knol2015: 158).
Onshore, there are two core archives with 14C-datings of basal peats taken in the 1960s, 1 km northwest of Dornum (Lang, Reference Lang1967), suggesting peat growth in that area started around 4800 cal BP and lasted at least another millennium.Footnote 8 According to the Lower Saxony geological coastal map of coastal Holocene profile types (GPTK25), these samples could relate to an extensive layer of basal peat, stretching north to south along a wide Holocene base ridge. In this area, the ridge runs only 0 to 2 m below NHN. In archaeological terms, these peats started forming right around the end of the Neolithic, their growth continuing at least into the middle Bronze Age. For the same period Bungenstock et al. (Reference Bungenstock, Freund, Mauz and Bartholomä2020) propose a reversal of coastal progradation, resulting in the coastline shifting seawards.
Archaeological data
In order to generate a comprehensive dataset, we made an inventory of all sites recorded by the Ostfriesische Landschaft (OL) Archaeological Service, Aurich, within the bounds of the study region since the 1960s (Schwarz Reference Schwarz1990: 13–17). In this process, we included sites from all periods, typo-chronologically re-evaluating those of uncertain dating to improve the dataset where possible. Archaeological registries often face challenges regarding consistency and scope due to the diverse and complex nature of the archaeological record. Typological classification of a site’s material is not always feasible or accurate as finds and features might be sparse or lacking in characteristics.
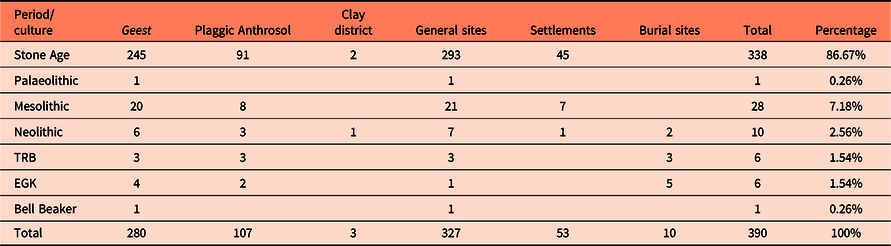
Our dataset comprises 1154 sites of various diagnostic quality, 390 of which are discussed in this paper, being assigned to the Stone Age and its regional archaeological cultures (Table 1). With the exception of three sites, they are located on the Geest in the study region’s southern part (Fig. 3). Furthermore, the majority of the selected Stone Age sites either are single finds or small assemblages (327, 84%) or of poor typo-chronological distinction (338, 87%), often both. In the context of the methods applied in our research, sites of poor diagnostic quality are of limited analytical value, but should not be excluded from the study, as they help to assess the extent of the archaeological record. Instead, we consider them when interpreting general patterns of Stone Age activity in the region. In consequence, we classify the 338 poorly dated sites to be of Stone Age origin in general, while 52 (13%) can be attributed to one of the Stone Age’s major periods or even specific cultural phenomena. The former include mostly single finds of flint or small assemblages lacking typo-chronologically diagnostic characteristics, but there are also sites with hundreds of finds. Examples are several sites in Menstede (Coldinne), which – in proximity of 80 to 120 m of each other – yielded a sum of over 1000 flint finds, as well as sites at Moorweg and Blomberg with over 100 flint finds each.Footnote 9
Stone Age dataset of 390 archaeological sites. For the purpose of GIS analysis, each site is represented by a single point geometry
3D map of known Stone Age sites in context of the Holocene base topography and basal peat extension in the coastal lowlands (50× vertical exaggeration). Potentially habitable areas north of the present-day Geest border feature almost no data points at all.
The only site in our dataset of likely Palaeolithic origin is located at Ostochtersum comprising a blade scraper and a prong. It does not allow any reliable statements to be made about this period other than testifying to the presence of man in the Pleistocene. Hereafter, we focus on the Mesolithic and Neolithic.
A total of 53 sites (13.6%) are classified by the archaeological registry as settlements, while another 10 are subsumed as Stone Age burial sites, including individual graves (2.6%). ‘Settlements’ are sites of probable human habitation, often indicated by a large number, a specific function or assemblage of finds implicating human settlement activities, or by settlement features, such as post-, refuse- or cooking pits (cf. Bailey et al., Reference Bailey, Andersen and Maarleveld2020: 48). Although the term is often associated with sedentism, this meaning cannot be applied to Mesolithic or Early Neolithic habitation strategies in NW Germany. Despite there being indications of agriculture and livestock farming already beginning at the end of the Mesolithic period at Ertebølle sites in the western Baltic region as well as at wetland Swifterbant sites in the Netherlands (Hartz et al., Reference Hartz, Heinrich, Lübke, Fischer and Kristiansen2002: 327–329; Reference Hartz, Lübke, Terberger, Whittle and Cummings2007: 586 ff.; Cappers & Raemaekers, Reference Cappers and Raemaekers2008: 391f.), the Neolithic mode of subsistence seems to not have been established before 5550 cal BP in the coastal region of NW Germany (Furholt, Reference Furholt, Furholt, Lüth and Müller2011: 117; Müller, Reference Müller2011, 11–19; Mennenga, Reference Mennenga2017: 15–18).
In the context of our dataset, the term thus may include sites of likely seasonal habitation, e.g. such as used by hunter-gatherer groups. This ambiguity, however, is compounded by a lack of uniform definition and classification used by changing personnel over the course of the OL registry’s maintenance. Without full revision, we therefore refrain from considering ‘settlements’ a suitable classification for statistical analysis of seasonal or long-term habitation patterns. Instead, reliable sites are taken into account individually. In summary, our dataset comprises a large quantity of sites, but overall low quality of individual information (cf. similar problems in Münch, Reference Münch2012; Mennenga, Reference Mennenga2016).
Conditions of preservation and detectability of sites pose another challenge, being influenced by the landscape’s ever-dynamic natural environment. In addition to the aforementioned circumstance that Stone Age sites are largely unknown in the region’s present-day coastal wetland, large tidal basins that were formed by the invading sea may have eroded numerous sites, creating ‘white spots’ in the archaeological record and presumably relocating archaeological material (cf. Homeier, Reference Homeier1969; Streif, Reference Streif1990: 82–93).Footnote 10 In consequence, Stone Age finds in the region’s clay district are highly incidental.
Despite all that, the dataset can be regarded as comparatively good (cf. Schwarz Reference Schwarz1990: 111–117; Mahlstedt, Reference Mahlstedt2015: 25–28, 150–152; Mahlstedt et al., Reference Mahlstedt, Hüser and Kegler2018). It represents all known evidence for the presence of Mesolithic and Neolithic individuals or groups in the study region. Its proximity to today’s Wadden Sea offers a plausible basis to transfer general trends shown by the analysis (‘Analysis of Archaeological Data’ below) to fossil surfaces beneath the Wadden Sea. Erosive and accumulative processes observed in the geological record, documenting changes in the natural environment as well as eroding or covering archaeological sites, play an important role in the Holocene, especially in times when due to the rising sea level the Wadden Sea gradually came into being. Even though these processes’ dynamics changed on account of land reclamation efforts in historical and contemporary times, such concepts can be taken into account when trying to identify areas of likely archaeological preservation.
Vegetation
Currently, comprehensive studies on Holocene vegetation development in the study region are missing. WASA’s botanical subproject focuses on the tidal flats in the back-barrier of Norderney and Spiekeroog, located 20 and 15 km west- and eastwards respectively (Bittmann et al., Reference Bittmann, Capperucci, Bartholomä, Becker, Bungenstock, Enters, Karle, Siegmüller, Wehrmann, Wurpts and Zolitschka2020). In consequence, we rely on general data for the region around Dornum and refer to preliminary results obtained from a core archive in the tidal flats near the present-day mainland, south of Norderney.
It is generally assumed that in the first half of the Mesolithic – which corresponds to the Preboreal and Boreal climatic phases – East Frisia was dominated by a dense forest cover, which had developed from a preceding tundra vegetation at the end of the Pleistocene (Behre, Reference Behre2014). Over the course of the Boreal, leading into the Atlantic period, these forests changed their composition. Between 10,000 and 8000 BP, birch and pine started to decline, giving way to hazel and alder. From 8000 to 6000 BP, dating well into the Atlantic’s climatic optimum, which sets the backdrop for the Mesolithic’s second half, forests are dominated by alder, oak, lime and elm. The more arid Geest is thought to have been characterised by mixed woodland, while forest mires formed in the lowlands. Rising sea levels caused a change in the coastal region’s climatic conditions, resulting in the emergence of raised bogs, which gradually displaced the woodlands. Along the coastline, salt marshes developed. With the onset of the Subboreal around 6000 BP, more or less coinciding with the Neolithic in the area of Northern Germany, elm starkly declines, followed by lime until 4000 BP. At the same time, crops emerge as an indicator of arable production and thus a Neolithic way of subsistence (Behre, Reference Behre2008, Reference Behre2014).
Applying this trend to the study region, the Boreal and Atlantic forestry can be expected to characterise the region’s southern part where topographical elevation is generally higher. Due to rising sea levels and subsequent bog formation, the northern part is likely dominated by wetlands and consequently a more open landscape starting between 9000 and 8000 BP; conditions that gradually shifted south until around 4000 BP, while the lowlands became increasingly amphibian with larger areas along the coast characterised by salt marshes (Karle Reference Karle2020). At the same time, it appears that areas of high elevation were partly excluded from the forest and covered with heathland. This is likely true for exposed hilltops, on which the first signs of progressive acidification were already visible in the Neolithic period in the form of podsolization.
In contrast, first results of the previously mentioned core from the Norderney tidal flats suggest that accumulation of a raw humus and later forming of the basal peat were driven by climate amelioration and not triggered by the sea level. The Holocene base was initially covered by heathlands and subsequently by raised bogs during the Mesolithic (information kindly provided by F. Schlütz, NIhK).
Lastly, the Neolithic period also saw the beginning of anthropogenic thinning of the woodlands, the extent of which may have been relatively small in the study region, causing only marginal change in the natural landscape.
Analyses and results
DEM-based time slices
Applying the premises outlined above (see ‘General Holocene development’) to the different stages of our DEM, analysis suggests that the Boreal and Atlantic periods, setting the backdrop for Stone Age groups of Mesolithic hunter-gatherers, featured a still mostly Pleistocene topography. As argued above in ‘A digital elevation model (DEM) of the Dornumer Holocene base topography’, we expect that the prominent set of channels running south–north through the Holocene base had already been part of that topography. The flooded DEM indicates that around 10,000 BP the valley bottoms at the model’s northernmost edge had not yet been inundated by the rising North Sea (Fig. 4; Fig. 7 further below). Fresh water from the higher areas continued to flow into a riverbed of Pleistocene channels. Sea levels rising at a rate of 1 to 1.2 m per century (Behre Reference Behre2003, Reference Behre2007; Vink et al., Reference Vink, Steffen, Reinhardt and Kaufmann2007) reached −14 m NHN at around 8500 BP (Bungenstock et al., Reference Bungenstock, Freund, Mauz and Bartholomä2020). This results in a land loss of about 17.3% in the DEM at MSL (Table 2), completely drowning the valleys in the model’s northern part and flooding the channels along a length of up to 7 km. Before or around this time the first peat bogs might have been formed (cf. Behre, Reference Behre2014: 57–61). Overlaying the geological map of Holocene basal peats (GPTK25) with the calculated land loss shows that bogs by and large had not yet been reached by the sea. Peat bogs mostly show a distribution along ridges and areas of highest relative elevation (Fig. 4). Radiocarbon dates from two basal peats in the vicinity of Dornum (‘Radiocarbon dates and coastline progradation’ above) support the premise that peats are younger the further south and therefore the higher they are located. Accordingly, we expect that only the northern peat bogs formed at the start of the Atlantic period. The then lowlands might have been characterised by alder carr with mixed woodland, while on the sandy hilltops to the south the beginning of podsolization may have occurred.
DEM with peat distribution, 14C-datings and flooding stages according to MSL (cf. Bungenstock et al., Reference Bungenstock, Freund, Mauz and Bartholomä2020), assuming no seaward progradation. Upland moors vectorised based on historical map by W.P. Camp 1804 (provided by Karle, Reference Karle2020). The distribution of Stone Age sites shows that upland moors had not yet spread as far.
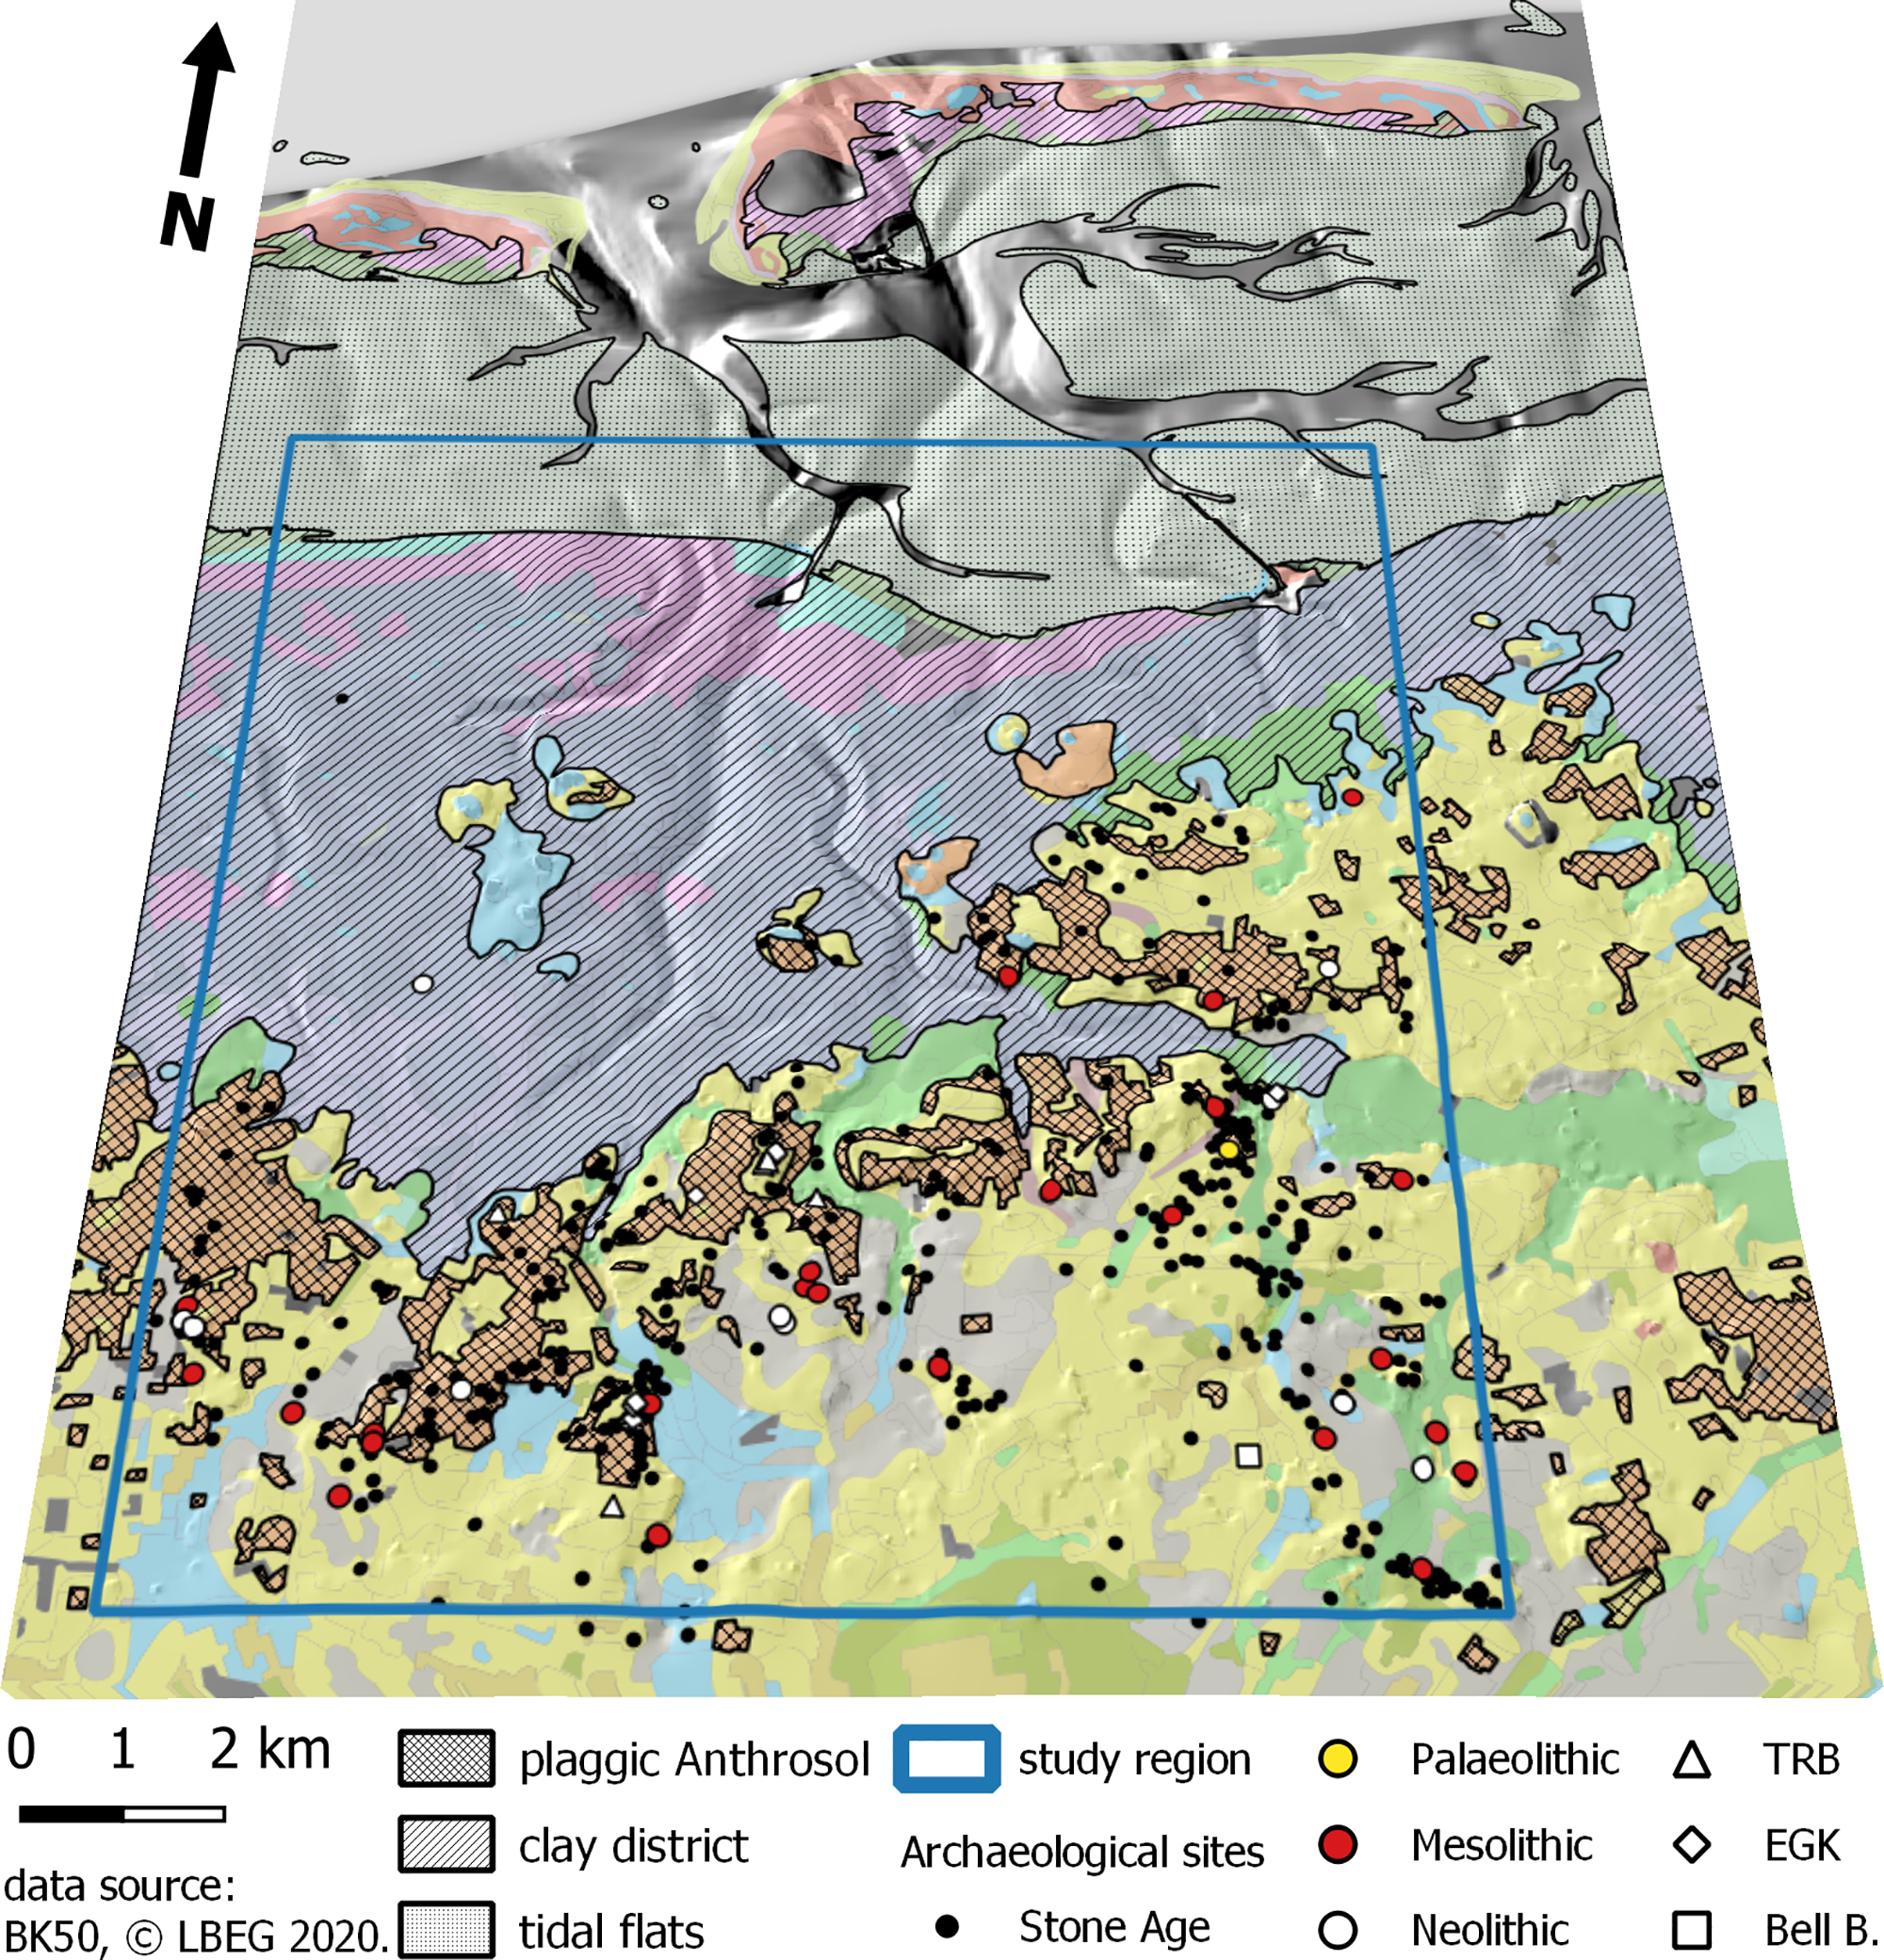
3D map of Holocene base topography (50× vertical exaggeration) overlaid with present-day soil map (BK50) and archaeological sites. Yellow: podzol; brown: plaggic Anthrosol on top of podzol; light blue: gley; grey: pseudogley; light/dark green: fen peat; purple/pink: marine clay, grey-white: tidal flats.
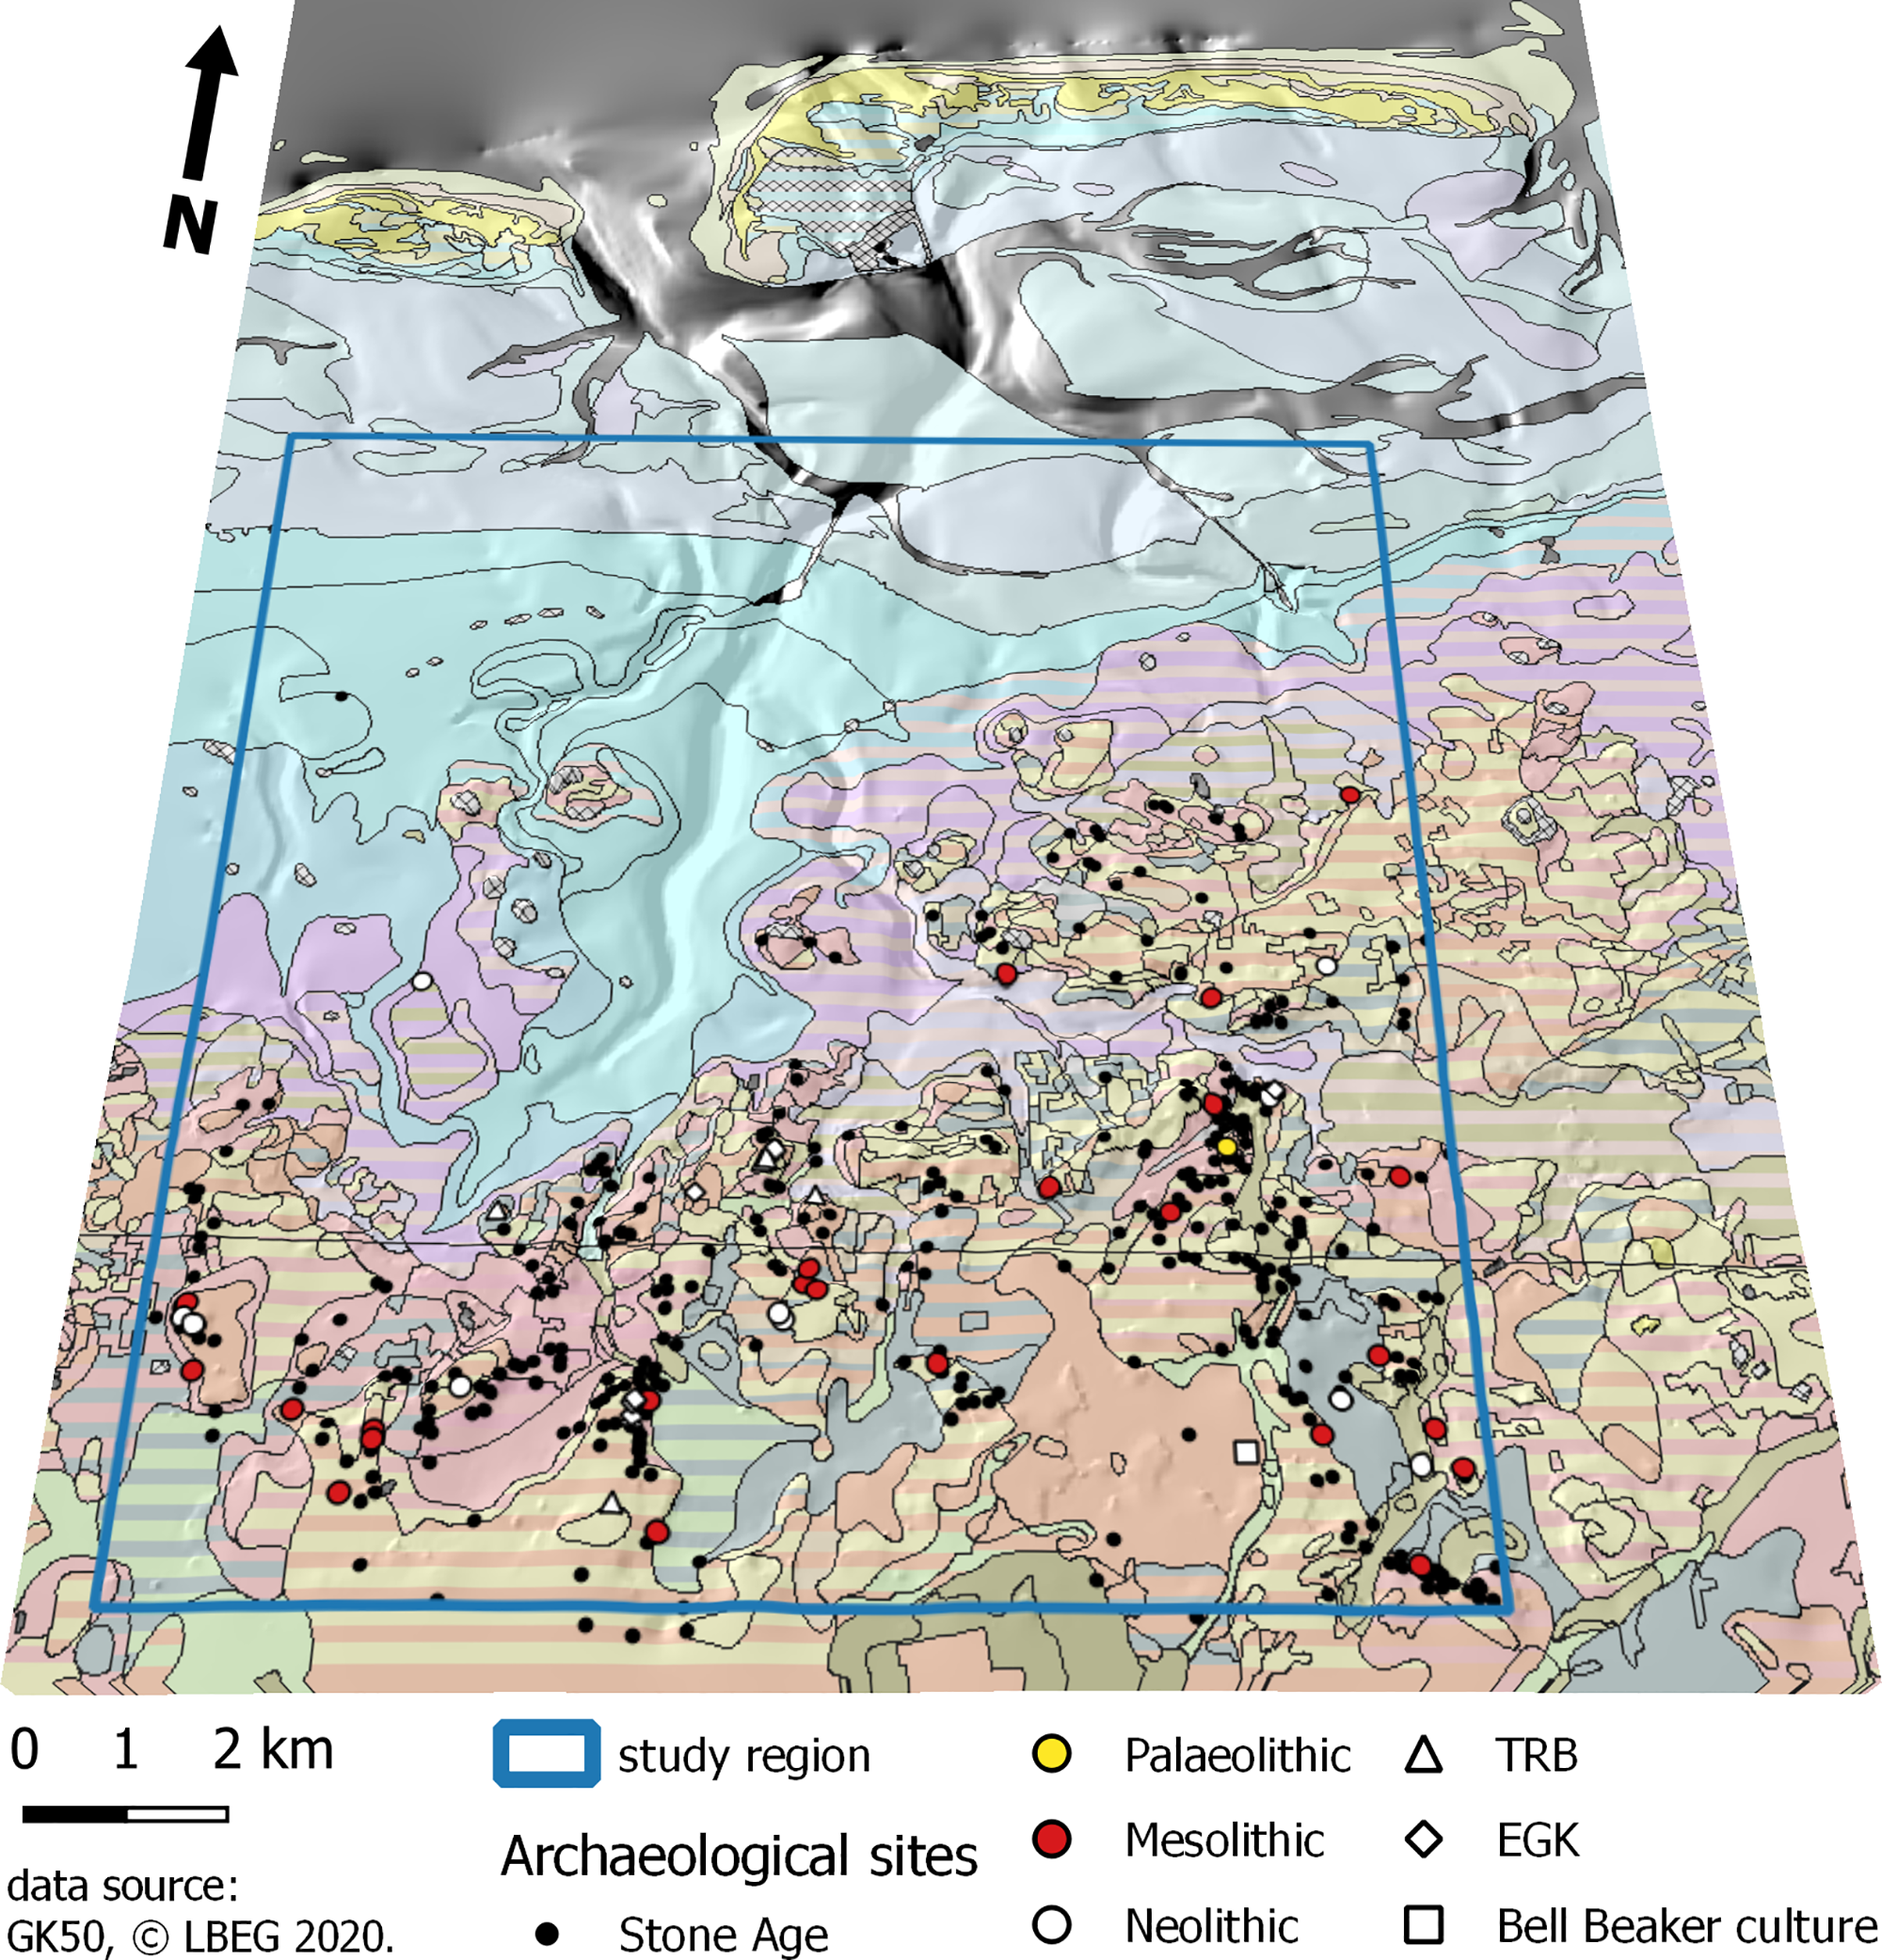
3D map of Holocene base topography (50× vertical exaggeration) overlaid with present-day geological map (GK50) and archaeological sites. Grey/brown/reddish brown: fine to medium sands; yellow: aeolian sands/silt; green: fluvial sands; pink/blue/light blue/light grey: mud- and sandflats.
DEM time slices illustrating stages of coastal submersion at MSL. Archaeological sites of the corresponding time period are shown. Their formation in time is dynamic and not concurrent with the time slices.
Modelled stages and DEM land loss (calculated at MSL). MSL derived from Vink et al. (Reference Vink, Steffen, Reinhardt and Kaufmann2007) and Bungenstock et al. (Reference Bungenstock, Freund, Mauz and Bartholomä2020). Stages 3 and 4 assume no seaward progradation. MSL: mean sea level; aMSL: DEM area above mean sea level

Between 7000 and 6000 BP, sea-level rise slowed significantly (Beets & van der Spek, Reference Beets and van der Spek2000; Bungenstock & Weerts, Reference Bungenstock and Weerts2010; Bungenstock et al., Reference Bungenstock, Freund, Mauz and Bartholomä2020), possibly enabling marine sediments to accumulate at a higher rate than the sea (Bungenstock & Schäfer, Reference Bungenstock and Schäfer2009). This may have resulted in a seaward progradation of the coastline starting at the end of the Mesolithic (Beets & van der Spek, Reference Beets and van der Spek2000: 7–14; Bungenstock & Schäfer, Reference Bungenstock and Schäfer2009: 44; Vos & Knol, Reference Vos and Knol2015: 158). The extent and duration of such a process in the study region is not yet understood.
Modelling the unknown
Assuming no prior seaward progradation our model suggests a significant cumulative land lossFootnote 11 of 42.4% with MSL at −5 m NHN at the start of the Subboreal around 6000 cal BP. In NW Germany, this period marks an archaeological transition from the Mesolithic to the Neolithic. Looking at the issue, there is, however, some evidence of coastal progradation during that period in the Dornumer tidal basin.
Core GE 183 from the Bensersiel tidal flats (‘Radiocarbon dates and coastline progradation’ above) yielded about 0.5 m of clastic sediments, which accumulated under lagoonal conditions and covered a layer of basal peats approximately between 6400 and 5600 BP. On top of these deposits, fen peats started growing around 5609 to 5335 cal BP (cf. Bungenstock & Schäfer, Reference Bungenstock and Schäfer2009: tab. 1, GE 183). Assuming a growth rate of 1 mm a−1, that peat could in turn have been covered by clastic sediments at around 5000 BP or – due to compaction – thereafter. Initially, these again formed under lagoonal conditions, but appear to have been eroded and subsequently covered by a succession of silty and sandy deposits under more energetic conditions, likely by the invading sea (cf. BDNBD, bore 2311GE0183).
The Holocene base map suggests that this sediment sequence is located on the slope of a deep, subjacent channel. Up until the influx of coarser marine sediments following 5000 BP, the sequence of lagoonal sediments and peats must have formed under sheltered conditions. Without significant seaward progradation the rising sea likely would have submerged the area at around 6400 cal BP (cf. MSL in Bungenstock et al., Reference Bungenstock, Freund, Mauz and Bartholomä2020). Still, the extent of these events cannot be extrapolated from a single core archive and requires further geological and archaeobotanical analysis. In addition to the studies on the Holocene sediment succession in the back-barrier system of Langeoog by Bungenstock & Schäfer (Reference Bungenstock and Schäfer2009) and Bungenstock et al. (Reference Bungenstock, Freund, Mauz and Bartholomä2020), findings made by WASA’s other subprojects may shed some light on these processes (Elschner et al., Reference Elschner, Scheder, Bungenstock, Bartholomä, Becker, Capperucci, Enters, Schlütz, Wehrmann and Hoffmann2020; Schlütz et al., Reference Schlütz, Enters and Bittmann2020).
Until the end of the Neolithic at around 4000 BP, sea-level rise had slowed to about 0.15 m per century. For this period Bungenstock et al. (Reference Bungenstock, Freund, Mauz and Bartholomä2020) propose a landward shift of the coastline, with MSL reaching −2 m NHN. As indicated by the radiocarbon dates from Dornum, by then peat bogs in that area likely only grew on the subjacent Holocene base ridge. While raised bogs on the Geest reached large dimensions, the coast would have been characterised by extensive salt marshes (Karle, Reference Karle2020).
Conclusion
Overall, this suggests that Stone Age communities should have been able to access and utilise areas much further north than the present-day Geest summits. Wetland sediments cover most areas of potential Stone Age habitation, causing a gap in the geographical extension of the known archaeological record. However, in view of the already large extension of peat bogs around 8500 BP, this insight is of relatively little significance. Overall, DEM calculations suggest a considerable reduction in habitable land mass due to rising sea level. The coastlines depicted in our model should not be considered static, since the effects of high and low tide are not displayed. Indeed, one should assume an extensive fringe of intertidal conditions along the coast (cf. Karle, Reference Karle2020). As a result of rising groundwater levels and thus ground wetness, the area that was actually favourable to settlement became even smaller. On the other hand, a coastal seam of fertile salt marshes could have been used for grazing livestock since the Middle Neolithic (cf. Nolte et al., Reference Nolte, Esselink, Bakker and Smit2015; Barr & Bell, Reference Barr and Bell2017). If crossing of lowland peat bogs were possible, the hilltops at Dornum, Westeraccum and Roggenstede would have provided ready access to the Stone Age tidal marshes. In contrast, the extensive wetting of the Geest by pseudo-gleying that can be seen today was probably largely caused by post-Stone Age pedogenesis and therefore had no influence on human activity in the Mesolithic and Neolithic.
Analysis of archaeological data
The sum of archaeological sites in the study region that were dated with varying degrees of accuracy to the Stone Age comprises a total of 390 entries. Mapping these sites with regard to soil types and geological stratigraphy (Figs 5 and 6) shows a clear dominance of Podzols on the Geest, on which 280 sites (70.9%) are located. A further 107 sites (27.1%) are also located on the Geest, but within areas superimposed by plaggic Anthrosol, which was applied as part of soil fertilization efforts from the 10th century AD onwards. For this purpose, Geest soils were removed extensively in some areas, mixed in with organic material and applied elsewhere (cf. Behre, Reference Behre1976, Reference Behre, Beck, Denecke and Jankuhn1980). Especially single finds and smaller assemblages in these areas are likely to have been relocated. However, it cannot be ruled out that finds such as stone tools successively moved upwards within the stratigraphy due to soil-physical processes like swelling, shrinkage or ground frost, eventually reaching the surface. It has been observed in several cases that field surveys can reveal sites even under relatively thick Anthrosol (Peek et al., Reference Peek, Siegmüller and Jöns2015; Peek & Siegmüller, Reference Peek and Siegmüller2016). The strongly underrepresented distribution of only three Stone Age finds in today’s tidal marshes was to be expected due to the substantial Holocene sediment cover in this area.
The Mesolithic
In the early to mid-Mesolithic the study region was still under the influence of fresh water. Pingo scars, the remnants of earth-covered ice mounds that had formed under permafrost conditions in the glacial period and their subsequent melting, densely littered the still Pleistocene topography; in some cases forming lakes that were used by Mesolithic groups (Mahlstedt et al., Reference Mahlstedt, Hüser and Kegler2018). A total of 28 sites can be safely assigned to the Mesolithic period. The relatively few known finds of this period cannot, for the most part, reliably be distinguished and assigned to different stages of the Mesolithic. In consequence, Figure 7 displays the full dataset in both time slices. The sites mainly comprise single finds of flint tools and flakes or small flint assemblages. Among these is one Ertebølle flint axe at Westerholt, which dates to the late Mesolithic. Other sites include a rock axe fragment at Moorweg, a rock club at Arle, one tranchet axe at Bloomberg and a single granite hatchet at Holtgast of pre-Neolithic style.
In general, Mesolithic flint artefacts in East Frisia bear similarities to tools from the northern Netherlands, being assigned to a Mesolithic ‘northwest group’. They comprise tools such as microliths and stone axes in similar style to the typical northern Mesolithic, but assemblages are often smaller, with somewhat heterogeneous inventories (Mahlstedt, Reference Mahlstedt2015: 150–151).
Particularly noteworthy is one site at ‘Narperfeld’ in Utarp where a possible Mesolithic hut feature was found in 1991, the site comprising 17 hearth pits, postholes and several hundred flint finds (Mahlstedt et al., Reference Mahlstedt, Hüser and Kegler2018: 124). Today the site is situated close to the clay-district–Geest border at the slope of a pingo scar, once probably being covered by peat, which has been turned to earth due to drainage and agricultural use.
The 28 known sites are without exception located in the area of today’s Geest, mainly at the edges of hilltops. Problematic are eight sites that are located in areas with plaggic Anthrosol, making up a high proportion (28.6%) of the sites analysed. Thus, a relocation of single finds or small assemblages cannot be ruled out. This is especially likely since surface finds made by the archaeological survey generally stem from the plaggic layer and not from the fossil surfaces below. However, since the areas where the plaggic base material was dug from lay almost exclusively on relatively dry, nutrient-poor sands predominantly covered with heaths, we deem it likely that finds translocated in this way originally came from higher sandy areas in the vicinity. The heathland cover further accelerates the acidification and podsolization of these soils.
Mahlstedt (Reference Mahlstedt2015) has been able to determine that Mesolithic sites in East Frisia were mainly located on the edge of hilltops or on the slope, although she recognised the tendency of younger Mesolithic sites being located rather further down the slope. Due to the poor typological specificity of the study region’s material, a corresponding distinction has not been possible. Mahlstedt et al. (Reference Mahlstedt, Hüser and Kegler2018) also found that pingo scars either were utilised short-term or by smaller Mesolithic groups. However, in our study region there is no clear correlation between the location of sites and pingo scars apart from individual cases like the one at Narperfeld. Still, they are found in general spatial proximity to each other, which might simply be caused by the pingo scars’ apparent abundance (cf. Mahlstedt et al., Reference Mahlstedt, Hüser and Kegler2018).
In the study region, three Mesolithic sites at Barkholt, Holtgast and Groß Fulkum lie in spatial proximity to the long channels that are deeply incised in the Holocene base topography. While this might hint at intentionality, it is not enough to establish a pattern. Considering the extension of forest mires and peat bogs in the then lowlands, areas of likely accessibility run along the wide sandy ridges near Dornum as well as those in the northeast. While proximity to the wetlands might have been attractive to the Mesolithic people, factors like local resources and relative aridity seem to have been of greater importance in choosing where to camp and work tools. Mahlstedt (Reference Mahlstedt2015) observed a similar pattern, in that unlike her other study regions in Lower Saxony, sites in East Frisia did not show any clear affinity to rivers. Instead, Mesolithic sites seem to prefer places of locally high elevation and exposure (Mahlstedt, Reference Mahlstedt2015: 125–126). The sandy ramparts enclosing pingo scars could have been used as such, while also providing a nearby freshwater habitat (Mahlstedt et al., Reference Mahlstedt, Hüser and Kegler2018: 125–126).
Likewise, relatively higher numbers of microliths may indicate increased hunting practices and thus high mobility of Mesolithic people in East Frisia, whilst finds of charred nuts show that gathering played a role as well (Mahlstedt, Reference Mahlstedt2015: 132–134, 146, 149). On the basis of this observation it can be assumed with some caution that Mesolithic groups targeted areas of rich natural resources. Hazel, for example, was particularly abundant in the Boreal woodlands, but less so in the Atlantic period (cf. Behre, Reference Behre2014).
Since the largest land mass was generally available in the Preboreal and Boreal periods, early to middle Mesolithic sites beneath today’s tidal marsh may be the most likely to bear characteristics similar to the ones found on the present-day Geest. In the Atlantic period, rising sea levels and the formation of peat bogs quickly limited accessible space in the lowlands. In consequence, those areas can be expected to have been utilised differently by late Mesolithic people.
The Neolithic
In contrast, the 23 Neolithic sites show a tendency of leaving the topographical edges and slopes where Mesolithic sites are located, instead shifting towards the hilltops (Figs 3 and 7). Conversely, soil types that are damp today, like gley with high ground moisture, apparently are avoided. This however is implied by their preference for hilltops, which usually are not affected by waterlogging. More often than not, sites are located on podzolised soils. This observation can also partly be attributed to the hilltop position of sites. Sandy soils with low levels of nutrients and good water conductivity tend to accelerate podsolization. Further investigation is required to determine whether these soil formation processes had already begun in the Neolithic or whether more fertile brown earths or even Regosols can still be expected in this period.
Ten out of 23 sites are classified as Funnelbeaker culture and Single Grave culture burials or funerary structures. Two of these are megalithic tombs at Westerholt and Utarp, neither of which is preserved today. The tomb at Utarp was excavated in 1878 (Schwarz, Reference Schwarz1990: 303–304), while the one at Westerholt is only supported by evidence of large glacial erratics found in 1931.Footnote 12 Megalithic tombs are collective graves. In NW Germany they are commonly associated with the Funnelbeaker culture’s (TRB) Western Group, which first began construction of such funerary monuments in the form of passage graves at around 5400 BP in the Middle Neolithic (Mennenga, Reference Mennenga2017: 27f.; Furholt & Mischka, Reference Furholt and Mischka2019: 928ff.). Even smaller varieties of such tombs, such as simple dolmen, bear evidence of the considerable effort undertaken by a community to build and maintain them. Their construction requires time, workers, likely cattle, as well as raw materials like logs to transport and raise the glacial erratics used to line and top the tomb (Müller, Reference Müller1990; Midgley, Reference Midgley2008: 44–45; Rosenstock et al., Reference Rosenstock, Masson and Zich2019). TRB passage graves generally are associated with either collective efforts of smaller societies or single larger ones able to support the builders (Rassmann & Schafferer, Reference Rassmann and Schafferer2012; Hinz, Reference Hinz2014; Wunderlich, Reference Wunderlich2019). Megalithic tombs are also thought to have served as orientation points in a landscape, often being constructed at a high and exposed position, likely along established routes. The megalithic tombs at Utarp and Westerholt, for example, might have been accessible by a wooden walkway running through the moor between Terheide and Tannenhausen where another two megalithic tombs are located, connecting the study region to the south (Schwarz, Reference Schwarz1990: 124).
In contrast, Single Grave culture (EGK) burials are characterised by the practice of single burial as the term suggests, typically in flat graves or burial mounds. The EGK is considered a local variant of the Corded Ware Culture in northern Germany, the Netherlands and southern Scandinavia at the end of the Neolithic. Their burial sites are known to be found in the vicinity of TRB megalithic tombs, sometimes using them for secondary burials (Müller, Reference Müller2011: 37f.). In the study region there is evidence of this phenomenon at Utarp (Figs 1 and 7). Four more EGK graves are found at Terheide and Schweindorf.
These burials document the longer-term presence of a group of people of both archaeological cultures. They do not allow, however, any detailed statements to be made about their way of subsistence or settlement besides general assumptions on sedentism and environmental exploitation. They nevertheless give evidence of Neolithic communities being willing and able to construct such sites even though raised bogs are expected to have dominated the Geest by that time, while the lowlands and coast had developed into a highly dynamic, amphibian landscape (cf. Karle, Reference Karle2020).
Other Neolithic sites in the study region are less considerable. The TRB is found at another five sites with numerous finds including ceramics, flint and rock tools, as well as three flint axes and a transverse arrowhead. TRB sherds in conjunction with a cluster of less diagnostic Stone Age sites at Terheide point to an area of high activity, possibly a settlement. Another such cluster is found at Utarp near the previously mentioned megalithic tomb (cf. Schwarz, Reference Schwarz1990: 124). Features of TRB houses are not known in the study region or East Frisia and are generally rarely preserved in northern Germany and the Netherlands (Mennenga, Reference Mennenga2017: 57–90). While Furholt & Mischka (Reference Furholt and Mischka2019: 934) suggest a general development from smaller hamlets or individual farmsteads to larger TRB settlements following 5300 cal BP in northern Germany and south Scandinavia, our limited TRB data do not allow any conclusion on this trend.
In total, six EGK sites have been identified in the study region, including the graves mentioned above, yielding several flint daggers, two flint axes and two rock hatchets. In addition, a single find of the Bell Beaker culture at the end of the Neolithic has been found at Blomberg, comprising one scraper in the style of Bell Beaker flint knives (Schwarz et al., Reference Schwarz, Stutzke, Adam, Heinze, Janssen, Lange, Redetzky, Weers, Wiese and Wirth1988: 73 no. 15). General clusters of Stone Age sites are located at Coldinne, Nenndorf, Barkholt and Nordmoor. Due to their lack of typo-chronologically differentiable features, they cannot easily be assigned to a specific Stone Age culture or period. Consequently, their temporal context remains unresolved.
Despite all limitations posed by the dataset analysed in this study, it can be concluded with some caution that Geest hilltops were preferred areas of Neolithic habitation. Finds and features of this period are most likely to be found in comparable locations beneath the present-day salt marshes and tidal flats.
Overall, the analysis also reveals various gaps in the distribution of sites, which are not easily explained by methodological or data-related issues. For both the Mesolithic and the Neolithic, the distribution of sites shows gaps around Süd-Coldinne, Leegmoor and Neuschoo (Fig. 1), i.e. in the study region’s southernmost Geest area. In the Lower Saxony soil map (BK50) these areas are classified as loamy. However, this assessment is not reflected in the respective core archives; on the contrary, fine and middle sands dominate and only occasionally loamier layers are recorded in the subsoil, only some of which have a waterlogging effect. Some areas at the study region’s southern border are covered by ‘Sanddeckkulturen’ (sand cover soils), but not to such an extent as to explain the gaps in the archaeological record. Indeed, non-site-specific soil maps come with generalisation-related issues and may be misleading when deriving soil information for larger scales than intended (van Zijverden, Reference van Zijverden2016: 86f., 125f.).
Discussion and conclusion
The study presented herein aims at identifying transferable characteristics of archaeological sites that may be correlated with settlement patterns in the context of East Frisia’s highly dynamic coastal habitat. In the absence of wetland-specific data in the Stone Age, the analyses were based on Geest sites. Applying our results to the present-day tidal marshes, which act as an archive of Holocene marine transgression covering fossil soils, helps to identify areas of potential prehistoric habitation or activity. Maps generated thereof (German: ‘archäologische Potentzialkarten’) have applications in cultural heritage preservation and land management.
In the last 40 years, predictive modelling in archaeology has been established as a varying set of often geostatistical methods used to determine the likelihood of a landscape’s geographical feature set having been inhabited by prehistoric communities (Kvamme, Reference Kvamme1990; van Leusen, Reference van Leusen2002; Wheatley & Gillings, Reference Wheatley and Gillings2002; Mischka, Reference Mischka2007; Münch, Reference Münch2012; Mennenga, Reference Mennenga2016). Those methods commonly comprise statistical analysis of factors like terrain elevation, slope and soil type associated with a set of archaeological sites, depending on their geographical distribution, age and cultural classification. To this end, DEMs can be used to calculate a site’s topographical characteristics. These are often based on present-day elevation data, assuming that a landscape’s modern topography is still representative of prehistoric conditions (cf. Mischka, Reference Mischka2007; Münch, Reference Münch2012; Mennenga, Reference Mennenga2016; Grøn, Reference Grøn2018).
This does not apply to the coastal clay district of NW Germany and the Netherlands. The dynamic nature of the coastal wetlands’ development requires thorough investigation to gain any detailed understanding. One result of such investigations is geological and palaeographic maps. Due to their large scope, those available for the East Frisian coast are relatively small-scale and lack elevation information (Vos & Knol, Reference Vos and Knol2014, Reference Vos and Knol2015; Karle, Reference Karle2020). There is, however, a need for large-scale, high-resolution/precision DEMs in archaeological landscape analysis to acquire site-specific three-dimensional data. Multidimensional models could also help to improve understanding of a landscape’s morphodynamics (cf. Vos & Gerrets, Reference Vos and Gerrets2005; Vos & Knol, Reference Vos and Knol2015; van Zijverden Reference van Zijverden2016).
Against this background, we created a palaeographic DEM of our study region in the area of the prehistorical Dornumer tidal basin in East Frisia. The DEM combines Holocene base elevation data as proposed by Streif (Reference Streif1998) and ‘Kotenpausen’ data from the 1960s for the study region’s Geest part. Using the sea-level-index curve by Bungenstock et al. (Reference Bungenstock, Freund, Mauz and Bartholomä2020), the DEM was flooded, applying basic simulation of tidal sedimentation. We compiled four time slices, 10,000 BP, 8500 BP, 6000 BP and 4000 BP, calculating the area inundated at MSL for each slice to get an idea of potential land loss. This comes with severe limitations due to missing data on the extent of possible seaward progradation between 7000 and 4000 BP as well as peat growth, erosion and compaction (cf. Bungenstock & Schäfer, Reference Bungenstock and Schäfer2009; Vos & Knol, Reference Vos and Knol2015). Nevertheless, the DEM helps to understand topographic and environmental relations between the prehistoric up- and lowlands and the coast. In a follow-up step, we analysed a heterogeneous dataset of 390 Stone Age sites derived from the archaeological registry of the Ostfriesische Landschaft to identify habitation patterns.
Our analysis found relative topographic elevation and soil aridity to be the most important markers for the distribution of Stone Age sites. This seems to apply to both the Mesolithic and Neolithic sites of our limited dataset, which exhibit a preference for slopes and ridges along a relief of glacial sands in the Mesolithic and hilltops in the Neolithic. Proximity to the region’s wetter areas seems to not have been sought out, but is a given considering the general abundance of pingo scars. These findings, however, must be subjected to critical thought. To start with, environmental factors in this study are limited to elevation and present-day soil information. Vegetation has only been considered at a general level, as local specifics are lacking. Other factors such as the sites’ actual characteristics and setting at their time of formation are unknown, even though they might have been crucial when Stone Age people decided where to settle (cf. Grøn, Reference Grøn2018).
Furthermore, it has to be kept in mind that even though the East Frisian Geest can be considered as ‘hilly’, local differences in elevation are relatively minor. Overall, the topography’s slope is gentle, but just a few centimetres difference in height sometimes mean the difference between wet and dry settlement land. While palaeochannels and -valleys cut comparatively deep into the Holocene base, with differences in elevation between the study region’s northernmost valley bottom and the southern hilltops of up to 35 m, they are also quite wide and long, running along distances of several kilometres. North to south the DEM’s average slope is only about 0.18%. In consequence, the Holocene base topography likely would appear quite flat to the eye, especially in the Boreal period’s woodland landscape. Local terrain depressions such as pingo scars, riverbeds or small ridges would have been far more visible than the terrain’s overall slope. With rising sea levels and an extensive growth of bogs in both the up- and lowlands, the woodland receded in the Atlantic period. This might have improved visibility, but also would have restricted accessibility.
Within the limits of the available environmental data, the distribution of Stone Age sites suggests that an immediate vicinity to bodies of water like pingo scar lakes, rivers and – following the rising sea – coastal bays has not been a driving factor. Instead, dry soils were chosen for habitation, perhaps characterised by a certain openness or vegetation. Since there is a causal correlation between soil aridity on the sandy Geest and relative elevation, the former might have been decisive in choosing places for habitation in an increasingly wet environment. Mahlstedt (Reference Mahlstedt2015: 149) argues that Mesolithic hunter-gatherers would have needed to apply ‘homing’ strategies of navigation in East Frisia’s extensive flat woodlands during the Boreal. Orientation might have included local waypoints, for example along rivers, instead of landmarks that can be seen from afar (cf. Kelly, Reference Kelly, Rockmann and Steele2003; Mahlstedt, Reference Mahlstedt2015). Such groups may have targeted specific resources in the shifting coastal area, which only required short-term habitation as the often small size of find inventories suggests (Mahlstedt, Reference Mahlstedt2015: 148–149). With the environmental changes brought by the Atlantic period, such strategies might have had to be adapted. Our dataset, however, is too small to contribute on this subject.
The Subboreal comes with a transition from a hunter-gatherer mode to a productive mode (Hinz, Reference Hinz2014), even though in East Frisia this process may have started as late as 5550 BP (cf. Müller, Reference Müller2011 regarding the emergence of the TRB northwestern group). TRB and EGK sites in the study region give evidence of the presence and dissemination of the northwestern Neolithic’s major cultural phenomena. The TRB’s monumental burial sites hint at an organised appropriation of the landscape and its natural resources (cf. Larsson, Reference Larsson2014) despite the habitat’s spatial restrictions. With all due caution, it can be surmised that the coastal environment and its unique set of natural resources were attractive for Stone Age people.
In order to ensure the transferability of these findings and extrapolate areas of potential human habitation as well as their preservation for different times, it is necessary to refine the DEM. To this end, the insights gained from the WASA project’s geological and botanical investigations will be applied. These can on the one hand help to draw a sharper picture of Holocene coastal processes and their extent, as well as the expected vegetation for different time slices. On the other hand, a revision of existing core archive data may enable us to identify areas of erosion where preservation of the archaeological record is unlikely. Due to the GIS-based approach we took, the DEM can easily be combined with palaeographic maps in the future (see Karle, Reference Karle2020). Our study shows the need for more complex, realistic environmental and topographic models. These should be based on targeted investigations of the coastal morphology and vegetation history that include selected archaeological sites, providing qualitative information on habitation and subsistence.
Acknowledgements
As mentioned in the introduction, this study has been carried out as part of the Wadden Sea archive of landscape evolution, climate change and settlement history project. Against this background, we thank the Niedersächsische Ministerium für Wissenschaft und Kultur and the Volkswagenstiftung for their extensive financial support, without which our study would not have been possible. Likewise, we thank the Ostfriesische Landschaft Archaeological Service as well as the Landesamt für Bergbau, Energie und Geologie, who provided us with their respective data on archaeological sites, geological features and survey information in the study region. We are especially grateful to Andreas Hüser, of Museum Burg Bederkesa in Bederkesa, formerly of the Lower Saxony Institute for Historical Coastal Research (NIhK), and Michael Lunge, also NIhK, for their preparatory work on the archaeological dataset and the vectorisation of historical Kotenpausen data we used to build our DEM. Thanks are also due to Andreas Vött, Hanna Hadler, Peter Fischer and Timo Willershäuser from the Institute of Geography, Johannes Gutenberg-Universität Mainz, for the drilling survey and subsequent analysis they undertook at Dornum. Furthermore, we appreciate the advice and guidance on sea-level rise, coastal development, vegetation history and peat growth given by our colleagues Friederike Bungenstock, Martina Karle and Frank Schlütz at the NIhK as well as Peter C. Vos from the Department of Applied Geology and Geophysics at Deltares, Delft, the Netherlands. Last but not least, we would like to express our thanks to two anonymous reviewers, whose critical input and suggestions markedly improved the quality of this paper.
Maps used in this study
BDNBD: Bohrungen der Bohrdatenbank von Niedersachsen (BDN), Landesamt für Bergbau, Energie und Geologie (LBEG). Geologische Bohrungen: https://nibis.lbeg.de/net3/public/ikxcms/default.aspx?pgid=434 and Bodenkundliche Kartierung des Küstenraumes: https://nibis.lbeg.de/net3/public/ikxcms/default.aspx?pgid=451, accessed 29 May 2020.
BK50: Bodenkarte von Niedersachsen 1:50000, Landesamt für Bergbau, Energie und Geologie (LBEG). https://nibis.lbeg.de/net3/public/ikxcms/default.aspx?pgid=989, accessed 29 May 2020.
GHBK25: Geologische Küstenkarte von Niedersachsen 1:25 000 – Relief der Holozänbasis, Landesamt für Bergbau, Energie und Geologie (LBEG). https://nibis.lbeg.de/net3/public/ikxcms/default.aspx?pgid=151, accessed 29 May 2020.
GK50: Geologische Karte von Niedersachsen 1:50 000 – Grundkarte, Landesamt für Bergbau, Energie und Geologie (LBEG). https://nibis.lbeg.de/net3/public/ikxcms/default.aspx?pgid=146, accessed 29 May 2020.
GPTK25: Geologische Küstenkarte von Niedersachsen 1:25 000 – Profiltypen des Küstenholozäns, Landesamt für Bergbau, Energie und Geologie (LBEG). https://nibis.lbeg.de/net3/public/ikxcms/default.aspx?pgid=149, accessed 29 May 2020.


 Open access

