


The expectation that other citizens contribute to the collective is imperative for the well-functioning of society. If some citizens are not expected to contribute, other citizens are likely to refrain from contributing as well (Axelrod and Hamilton Reference Axelrod and Hamilton1981; Fischbacher et al. Reference Fischbacher2001; Habyarimana et al. Reference Habyarimana2007, Reference Habyarimana2009). This poses a potential challenge in ethnically diverse and diversifying societies as members of the ethnic minority are often viewed, in the eyes of the ethnic majority, as ‘free riders’ who are less likely to pay their fair share (for example, Gilens Reference Gilens1999; Hainmueller and Hopkins Reference Hainmueller and Hopkins2015; Soroka et al. Reference Soroka2017; van Oorschot Reference van Oorschot2008). Such negative expectations toward ethnic out-group members’ contributions have been identified as a key component in the failure of public goods provision in diverse societies and in explaining welfare discrimination against immigrants (for example, Habyarimana et al. Reference Habyarimana2007, Reference Habyarimana2009; Kootstra Reference Kootstra2016; Magni Reference Magni2022). Jointly, these patterns have raised a more general concern for the survival of the benign European welfare states in times of increasing immigration (Alesina and Glaeser Reference Alesina and Glaeser2004).
In this article, I contribute to this burgeoning debate by asking: why do members of the ethnic majority expect ethnic out-group members to be less likely to contribute to the collective than ethnic in-group members in increasingly diversifying Europe? According to one line of argumentation, such negative expectations could arise simply because out-group members are ethnically different as suggested, in various guises, in social identity theory (Tajfel and Turner Reference Tajfel and Turner1979), models of ethnocentrism (Kinder and Kam Reference Kinder and Kam2010), and taste-based discrimination (Becker Reference Becker1957; see for example, Hangartner et al. Reference Hangartner2021). In contrast to these classic models, however, I argue that the ethnic majority uses ethnic cues as a bundled signal to draw conclusions about citizens’ expected contributions. Specifically, I argue that ethnic cues not only send a signal about the ethnic group membership of citizens but also their socioeconomic resources, cultural values, and compliance with social norms, and that the majority-minority expectation gap is explained by these social factors. These complementary factors point to different motivations underlying an ethnic bias in such expected cooperation related i) to more objective considerations about citizens’ (lack of) resources necessary to contribute; ii) to a preference for ideational similarity in order to expect citizens to act in pro-social ways; and iii) for the importance of behavioural compliance with social norms. With this theoretical framework, I thus move beyond the notion that ethnic biases exist toward a more comprehensive investigation of the different mechanisms driving ethnic biases, which is a demanding but essential task (Choi et al. Reference Choi2019, Reference Choi2021; Conroy-Krutz Reference Conroy-Krutz2013; Elder and Hayes Reference Elder and Hayes2023; Portmann Reference Portmann2021; Sen and Wasow Reference Sen and Wasow2016). Here, I understand ethnicity as an identity category in which membership is determined by attributes (believed to be) associated with descent, such as a person’s skin colour or place of birth (for example, Chandra Reference Chandra2006). I use the term ‘ethnic bias’ to denote a difference in expected contributions from ethnic in-group compared to out-group members.
To test this argument, I designed a novel, pre-registered conjoint experiment conducted among the ethnic majority in Denmark (Nindividuals=4,368; Neffective=65,520). In the conjoint experiment, respondents were tasked with observing a subset of hypothetical participants in a public goods game and predicting their expected contributions to a common pool. Importantly, the information available about these participants varied across the respondents: Whereas all respondents saw the name and immigrant status of the participants as well as a few background attributes, a second layer of randomization was added such that some respondents had additional information about participants’ socioeconomic status, cultural values (specifically related to gender roles and homosexuals’ rights), and/or norm compliance as well. This augmented conjoint experiment makes it possible to distinguish the effect of ethnic attributes from the effects of each of the randomly assigned information-based mechanisms, as well as to estimate the reduction in ethnic bias once these mechanisms are accounted for (Acharya et al. 2018).
The findings provide evidence in favour of the theoretical argument. First, when little information is available, the ethnic majority expects that men with typical Middle Eastern names contribute substantially less to public goods than men with typical Danish names. The baseline difference is 9.2 percentage points corresponding to around 0.2 SD. Second, people with higher socioeconomic status, similar cultural values, and norm-compliant behaviour are expected to contribute more than those with lower socioeconomic status, dissimilar cultural values, and norm-deviant behaviour. Finally, once information on one or more of these social factors is available, ethnic bias is reduced, and in a full information condition, it is explained away suggesting that the three social factors jointly erase the majority-minority expectation gap. This indicates that ethnic bias in these empirical beliefs operates via several channels based on more objective considerations about citizens’ resources and their opportunity structures for contributing, on more subjective preferences for cultural similarity, and on their expected behavioural norm compliance.
This finding contributes to our current knowledge in several ways. First, it contributes to our understanding of the nature of ethnic bias in recently diversifying societies. Despite the overwhelming evidence of ethnic biases, we have limited knowledge as to whether such bias is driven by more immutable ethnic attributes or by more malleable social factors often bundled with such ethnic attributes. The findings support the latter perspective showing that the minority-majority expectation gap is jointly driven by different, non-competing social factors often correlated with ethnicity rather than ethnic identities per se. Second, using a novel measurement approach, the findings provide direct evidence that the ethnic majority in welfare state Denmark expects less contributions, on average, from ethnic minorities than the native population. This supports an important, but often more indirectly validated, premise in welfare studies that the lack of solidarity toward out-group members arises since out-group members are not expected to reciprocate (for example, Kootstra Reference Kootstra2016; Magni Reference Magni2022; van Oorschot Reference van Oorschot2008). Third, the study contributes to the literature linking ethnic diversity to lower public goods provisions in which a key mechanism is negative expectations toward ethnic out-group members’ contributions (Habyarimana et al. Reference Habyarimana2007, Reference Habyarimana2009). The finding in this article, that these negative expectations are driven by the correlates of ethnicity more than ethnicity itself, provides novel insight into the divergent psychological underpinnings of these negative expectations. Fourth, the findings have implications for the broader public opinion literature. They suggest that bias based on cues of group belonging may be driven by related characteristics signalled by such group belonging. This emphasizes the importance of unravelling bundled treatments, not just for methodological purposes (Landgrave and Weller Reference Landgrave and Weller2021) but to deepen our understanding of the causal mechanisms underlying group-based biases.
Negative Expectations toward Ethnic Minorities
Expectations toward other citizens are essential in modern societies. Citizens tend to be conditionally cooperative such that they are more likely to contribute to the collective if those who are part of the collective also contribute (for example, Axelrod and Hamilton Reference Axelrod and Hamilton1981; Bechtel and Scheve Reference Bechtel and Scheve2017; Fischbacher et al. Reference Fischbacher2001; Thöni and Volk Reference Thöni and Volk2018; Yamagishi and Kiyonari Reference Yamagishi and Kiyonari2000). People rarely know whether other citizens or groups of citizens are cooperators or free riders, however. Instead, they make decisions based on what they expect them to do (Habyarimana et al. Reference Habyarimana2007, Reference Habyarimana2009). For example, citizens might refrain from investing their resources in their local environment such as the local school or local sports club if they anticipate that other citizens are not going to ‘chip in’ and cooperate as well. Similarly, if other citizens are expected to free-ride at the societal level, such as in paying their taxes, this may challenge the more general willingness to support (universal) welfare programmes.
Such expectations are particularly important in ethnically diverse societies. Members of the ethnic majority often view members of ethnic out-groups as free riders who are less willing to reciprocate and contribute to the collective (for example, Alesina and Glaeser Reference Alesina and Glaeser2004; Gilens Reference Gilens1999; van Oorschot Reference van Oorschot2008). Such negative expectations constitute an important component in understanding the lack of pro-sociality among the ethnic majority toward immigrants and ethnic minorities more generally (for example, Magni Reference Magni2022; Soroka et al. Reference Soroka2017; van Oorschot Reference van Oorschot2008). Further, negative expectations toward out-group members have been identified as a key reason why ethnic diversity can challenge public goods provision (Habyarimana et al. Reference Habyarimana2007, Reference Habyarimana2009: on the negative effect of diversity on public goods provision, see, for example, Alesina et al. Reference Alesina1999; Banerjee et al. 2005; Hopkins Reference Hopkins2009; Miguel and Gugerty Reference Miguel and Gugerty2005; Tajima et al. Reference Tajima2018). Ethnic in-group members generally cooperate less with ethnic out-group members (for example, Balliet et al. Reference Balliet2014; Enos and Gidron Reference Enos and Gidron2018; Romano et al. Reference Romano2021), and an important reason is that out-group members are expected to contribute less than in-group members. As Habyarimana and colleagues note: ‘[If] all individuals expect that co-ethnics will cooperate and non-co-ethnics will not, then, under the Nash equilibrium solution concept, these expectations will be self-fulfilling’ (Habyarimana et al. Reference Habyarimana2007, 711).
These perspectives emphasize the importance of expectations and indicate that there are good reasons to predict that ethnic majority citizens expect less cooperation and thus contributions from ethnic out-group members. Though such negative expectations may vary across ethnic hierarchies such that ethnic bias is largest toward more socially and culturally distant groups, the simple prediction here is that, at baseline, the native majority expects less contribution from ethnic out-group members than in-group members in general. This leads to the first hypothesis:
H1: Members of the ethnic majority expect less cooperation from ethnic minorities compared to the ethnic majority.
In this article, I refer to this minority-majority expectation gap as an ethnic bias. Ethnic bias, thus, refers to differences in empirical beliefs about how others contribute and is not necessarily grounded in differences in perceived human worth.
Ethnicity as a Bundled Signal: Explaining Negative Expectations toward Ethnic Minorities
Why do members of the ethnic majority expect ethnic minorities to be less likely to cooperate and thus contribute than members of the ethnic majority? Though a plethora of studies have uncovered ethnic biases in different fields, the mechanisms through which such biases operate are far less studied and challenging to identify (for example, Choi et al. Reference Choi2019; Conroy-Krutz Reference Conroy-Krutz2013; Elder and Hayes Reference Elder and Hayes2023; Portmann Reference Portmann2021; Sen and Wasow Reference Sen and Wasow2016).
On the one hand, the expectation that ethnic out-group members contribute less to the collective than the ethnic majority may be driven by ethnic identity traits such as skin tone or country of origin. From the perspective of ethnocentrism (Kinder and Kam Reference Kinder and Kam2010) and social identity theory (Tajfel and Turner Reference Tajfel and Turner1979), group identities are important causal factors. As argued in social identity theory, belonging to a social group, and distinguishing this social group from other social groups, provides individuals with self-esteem and a positive self-concept. From this perspective, ethnic bias is a function of ethnic identities per se, implying that negative expectations toward minorities occur simply because they constitute an out-group to the majority in-group. This conclusion is echoed in models of taste-based discrimination predicting that differential treatment is grounded on ethnic animus based on peoples’ ethnic group membership (Becker Reference Becker1957).
On the other hand, ethnic attributes are often bundled, either empirically or psychologically, with a series of other characteristics (for example, Crabtree et al. Reference Crabtree2022; Elder and Hayes Reference Elder and Hayes2023; Landgrave and Weller Reference Landgrave and Weller2021; Sen and Wasow Reference Sen and Wasow2016). Following this logic, ethnic attributes not only signal ethnic group membership but may, at the same time, send signals about and operate through other social factors correlated, or believed to correlate, with ethnic group membership. From this perspective, more negative expectations toward out-group members may not necessarily be explained by matters of ethnic identities per se but by more malleable social factors associated with ethnicity.
My argument aligns with this second model. Specifically, I argue that, in societies undergoing recent diversification resulting from contemporary immigration trends, the negative expectations held by the ethnic majority toward ethnic minorities operate via three distinct channels: via perceptions of citizens’ (lack of) socioeconomic resources and thus ability to contribute; via preferences for ideational, in particular, cultural, similarity; and via perceptions of citizens’ (non-)compliance with socially agreed-upon norms. Each of these factors – socioeconomic status, cultural values, and norm compliance – have been discussed across different literatures (for example, Baldwin and Huber Reference Baldwin and Huber2010; Dinesen and Hjorth Reference Dinesen and Hjorth2020; Gilens Reference Gilens1999; Hainmueller and Hopkins Reference Hainmueller and Hopkins2015; Hopkins Reference Hopkins2015; Kustov and Pardelli Reference Kustov and Pardelli2018; Sniderman et al. Reference Sniderman2004; Valentino et al. Reference Valentino2019). Combining them in a joint theoretical framework makes it possible to differentiate between a more objective resource-based explanation, a more subjective culture-based explanation, and a more behavioural norm-based explanation. This is important to gain a deeper insight into the psychological motivations underlying ethnic bias in general and negative expectations toward ethnic minorities in particular. I discuss each of the three potential mechanisms in turn before summarizing and formalizing the theoretical expectations.
Socioeconomic Status
One potential reason why the ethnic majority expect fewer contributions from ethnic minorities is that ethnic minorities may lack the socioeconomic resources to do so. First, ethnic group membership and socioeconomic factors are often correlated (for example, Baldwin and Huber Reference Baldwin and Huber2010; Kustov and Pardelli Reference Kustov and Pardelli2018; Landgrave and Weller Reference Landgrave and Weller2021; Letki Reference Letki2008), and studies show that people use ethnic cues to infer the social class to which the individual belongs (for example, Fryer and Levitt Reference Fryer and Levitt2004; Landgrave and Weller Reference Landgrave and Weller2021). This suggests that, even though ethnicity and socioeconomic status have distinct effects (for example, Hainmueller and Hopkins Reference Hainmueller and Hopkins2015; Zhang et al. Reference Zhang2019), they are often (believed to be) intertwined. Second, a person’s socioeconomic status is theoretically relevant for the expectation that the person cooperates. Having a lower socioeconomic status implies having fewer resources and being more likely to value immediate rewards (Schaub et al. Reference Schaub2020; Gereke et al. Reference Gereke2021; see also Haushofer and Fehr Reference Haushofer and Fehr2014). If a person has fewer socioeconomic resources, the ‘ability to pay’ is simply lower and the costs of co-operating under uncertainty are higher. For this reason, it may be rational to anticipate that a person with fewer socioeconomic resources is less able, and thus less likely, to contribute to the collective. Hence, if the ethnic majority uses ethnic cues to infer that ethnic minorities have fewer socioeconomic resources than the ethnic majority and that the level of socioeconomic resources directly affects citizens’ expected contributions, socioeconomic status is one reason why the ethnic majority expects less cooperation from the ethnic minority.
Shared Cultural Values
A complementary explanation relates to preferences for shared cultural values. First, ethnic out-group members are often perceived to be culturally different from the ethnic majority. Ethnic minorities, one stereotypical argument goes, hold illiberal and anti-democratic values and ways of life that are incompatible with the dominant lifestyle among the majority population (for example, Choi et al. Reference Choi2021). Such perceived cultural distance constitutes an ideational threat to the native population and draws a clear ‘us-them’ distinction (for example, Sniderman et al. Reference Sniderman2004; Sides and Citrin Reference Sides and Citrin2007). Second, the fact that sharing values and ideas is important for cooperation extends to the field of evolutionary social psychology (for example, Chudek and Henrich Reference Chudek and Henrich2011), political theory (for example, Miller Reference Miller2014; Kymlicka Reference Kymlicka2020), and public goods provision (for example, Alesina et al. Reference Alesina1999; Habyarimana et al. Reference Habyarimana2007). Citizens tend to have higher expectations toward in-group than out-group members (Habyarimana et al. Reference Habyarimana2009; see also Fearon and Laitin Reference Fearon and Laitin1996), and dislike those who are ideationally dissimilar (Choi et al. Reference Choi2021). As sharing values binds people together and fosters a sense of normative community and commitment to that community, those who hold fundamentally divergent cultural values should be expected to act in less pro-social ways than those who share the person’s ideational values. Thus, citizens for whom, say, gender equality is important should ultimately expect that those who hold conservative gender values are less likely to be ‘team players’ and contribute to the collective. In sum, certain cultural values may be associated with ethnic group membership, and if sharing cultural values has a direct effect on the expectation that people are pro-social cooperators, cultural values constitute another channel through which ethnicity could affect expected cooperation.
Compliance with Social Norms
A third reason why members of the ethnic majority may expect fewer contributions from ethnic minorities is that out-group members can be perceived as violating social norms, such as disobeying the law (for example, Peffley et al. Reference Peffley1997; Ceobanu Reference Ceobanu2011) or receiving welfare benefits instead of taking a job (for example, Hainmueller and Hopkins Reference Hainmueller and Hopkins2015). First, studies have shown that signalling norm compliance in everyday interactions reduces discrimination against immigrants indicating that norm compliance is both correlated with ethnic group membership and a relevant explanation underlying ethnic bias (Choi et al. Reference Choi2019). In relation to expected cooperation, immigrants and ethnic minorities are, for example, often stereotyped as welfare-dependent and lazy who do not seek out a job and therefore do not pay taxes thus signalling a disregard for a key social norm in welfare states (for example, Gilens Reference Gilens1999; Kruse Reference Kruse2023; Soroka et al. Reference Soroka2017; van Oorschot Reference van Oorschot2000). Second, given that individual non-compliance with norms is punished (for example, Choi et al. Reference Choi2019; Winter and Zhang Reference Winter and Zhang2018), the general perception that an out-group deviates from norms may have implications for the expectation that they will cooperate. Reputations are essential for cooperation (for example, Andreoni and Miller Reference Andreoni and Miller1993; Nowak and Sigmund Reference Nowak and Sigmund2005), and signals of non-compliance damage such reputations. If this is the case, then the ethnic majority should expect more cooperation from those who comply with the socially agreed-upon norms of ‘good’ behaviour. Thus, if ethnic group membership is bundled with norm compliance and such perceived behaviour affects expectations of cooperation, norm compliance constitutes a third complementary channel through which ethnicity can affect expected cooperation.
Formalizing the Broader Framework
These three channels have different theoretical implications for how to understand the minority-majority expectation gap. The socioeconomic explanation implies that it is based on more rationale considerations about citizens’ (not) having the necessary resources to contribute, the cultural values explanation focuses on perceived ideational differences and the perception that culturally dissimilar people are less likely to act in pro-social ways, and the norm-based explanation indicates that it is the lack of upholding social norms particularly important in (European) welfare states.
The broader implication is that ethnic bias in expectations should wane when socioeconomic status, cultural values, and/or norm compliance are accounted for in line with models of statistical discrimination. According to such models, agents will, in the face of imperfect information, rely on weighted averages of the group to which an individual belongs to predict that individual’s behaviour (Arrow Reference Arrow, Ashonfelter and Rees1973; Phelps Reference Phelps1972; see also, for example, Guryan and Charles Reference Guryan and Charles2013; Quillian and Midtbøen Reference Quillian and Midtbøen2021). I argue that the same dynamic underlies the minority-majority expectation gap. When information is sparse, people use group averages to estimate the likelihood that a given group member will contribute to the collective. If ethnic group membership is perceived to bundle with a series of social factors that are relevant for predicting cooperative behaviour, as I have argued above, it may be rational to expect less cooperation from ethnic out-group members if little relevant information is available. When more relevant information is available and such information indicates that ethnic group membership is not correlated with these social factors, less weight should be given to the ethnic attributes in judging whether people are cooperators or free riders, at least if ethnicity operates via the proposed channels. The overall theoretical argument can be articulated in the hypotheses below.
H2a-c: Members of the ethnic majority expect people with high socioeconomic status (a), progressive values (b), or norm-compliant behaviour (c) to cooperate more than people with low socioeconomic status, conservative values, or norm-deviant behaviour, respectively.Footnote 1
H3a-d: Ethnic bias in expected cooperation held by members of the ethnic majority is reduced once information on socioeconomic status (a), cultural values (b), or norm-compliance (c) is available, as well as when all of these factors are simultaneously available (d).
Note that these different mechanisms are not necessarily competing but may be complementary. This implies that the broader argument is relevant even in cases where the minority group is not characterized, for example, only by lower socioeconomic status (see discussion in Appendix J).
Methods
To test the theoretical argument, I use a novel, pre-registered experimental design fielded in Denmark that combines the measurement validity of the public goods game with the advantages of testing multiple parameters in the conjoint analysis. In the following, I present how I use a version of the public goods game to measure expected cooperation, elaborate on how this setup is incorporated into a conjoint design, discuss the case of Denmark, and describe the data.
Measuring Expected Cooperation through a Public Goods Setup
The public goods game is the conventional behavioural measure of large-N cooperation – or lack thereof. The classic game reflects the challenges for societies in providing public goods by tapping the dilemma between acting out of self-interest and acting for the well-being of the group (for example, Baldassarri Reference Baldassarri2015; Enos and Gidron Reference Enos and Gidron2018; Grossman and Baldassarri Reference Grossman and Baldassarri2012). The basic setup consists of a series of participants, each of whom is given an amount of money. Each participant decides how much money they will give to a common pool and how much to keep for themself without knowing the other participants’ decisions. The common pool is multiplied by a fixed, positive factor and distributed equally between the participants. The final amount of money that each participant has is a product of how much each kept initially and how much they received from the common pool. From a self-interest perspective, it is rational to free-ride and keep all the money, letting the other participants pay into the common pool. From a collective perspective, the optimal strategy is that everyone contributes all their money to the common pool.
I use this general setup and measure expected cooperation by letting respondents act as observers who make predictions about other participant’s behaviour in the game. Specifically, respondents were introduced to the public goods game and told that one hundred hypothetical persons were participating, fifteen of whom they would be observing (see Appendix A). After answering two factual manipulation checks,Footnote 2 each respondent observed three participants at a time. The reason they saw three participants is that public goods games are typically played with more than two people, as they are intended to capture large-scale rather than dyadic cooperation. Respondents were then asked to choose which of the three participants they thought would give the most money to the common pool (forced choice). Respondents were next asked how much money they expected that each participant would give to the common pool on a scale from 0 Danish kroner to DKK 1,000, with DKK 100 as the interval, equivalent to US$14.7 or €13.4 (see distribution in Appendix A). Given the focus on expectations in this article, these measures intentionally capture attitudes rather than behaviour. In Appendix A, I discuss the measurement validity of this approach in depth showing that though there are deviations, respondents generally agreed with the statement that people who contribute to the common pool are cooperative.
While I conduct all of the analyses with both the forced choice and continuous measures, I mainly report the results from the forced choice measure below (see for example, Enos and Gidron Reference Enos and Gidron2018). The reasons are that this avoids redundancy as the main results replicate for the continuous measure (see Appendix E), that the forced choice measure is theoretically important as it captures citizens’ preferences when they have to choose who they believe is more cooperative, and as it is the standard outcome in conjoint analyses and the outcome used for power calculations in the pre-registration.
An Augmented Conjoint Experiment
I embed this public goods setup in an augmented conjoint experiment. The general logic of the conjoint experiment is to show respondents a set of individual profiles. Each profile has the same attributes (for example, a name), but the specific attribute level is randomly assigned to each profile (for example, Peter or Mohammad). Respondents evaluate several profiles with randomly assigned attribute levels, which creates the standard within-respondent-across-profile variation. In this article, a profile is a hypothetical participant in the public goods game.
I augment this standard conjoint approach by adding a second layer of randomization that varies which and how many profile attributes that are available to respondents. The idea of providing and withholding information in conjoint experiments to study causal mechanisms builds on the approach by Acharya et al. (2018) and extends this reasoning in two ways (see also Conroy-Krutz (Reference Conroy-Krutz2013) and Peterson (Reference Peterson2017) for related approaches). First, the framework incorporates multiple information conditions simultaneously, which is advantageous when the aim is to test different theoretical explanations. Second, as I return to below, the framework incorporates a placebo test which makes it possible to evaluate whether potential changes in effects across theoretically relevant information conditions are driven by simply adding any type of information.
Figure 1 presents the study design and shows that respondents were randomly assigned, with equal probability, to one of six information conditions: a control condition, a socioeconomic condition, a cultural-values condition, a norms-compliance condition, a full-information condition, and a placebo condition. In the control condition, information on the participant’s name, immigration status, religiosity, and age was available to the respondents (see a discussion of the attributes in Appendix B). Whereas age and religiosity serve as background variables, I use names and immigration status as related but theoretically distinct ethnic attributes (for example, Soroka et al. Reference Soroka2017). In line with prior studies on ethnic discrimination (for example, Bertrand and Mullainathan Reference Bertrand and Mullainathan2004; Olsen et al. Reference Olsen2020), I use typical ethnic-Danish male names to signal an ethnic in-group participant and typical Middle Eastern male names to signal an ethnic out-group participant. To avoid dependency on a few particularly stereotypical names (Elder and Hayes Reference Elder and Hayes2023), I use eighteen common Danish male names and eighteen common Middle Eastern male names and create a dummy that takes the value 0 for ethnic Danish names and 1 for Middle Eastern names (see Table A2 in Appendix A and Appendix B). No respondent saw the same name more than once. I focus on participants with a Middle Eastern background because contemporary political debates on integration and public stereotypes in Europe tend to relate disproportionately to minorities with Middle Eastern (and North African) backgrounds, and because immigration to Europe largely occurs from these regions. Though ethnic bias is plausibly larger toward people with Middle Eastern roots compared to, say, people with roots in other Western countries, the former is thus both a more politically salient and more geographically predominant group in Denmark. I focus only on male participants as men are often discriminated against more (for example, Fershtman and Gneezy Reference Fershtman and Gneezy2001) and trusted less (Gereke et al. Reference Gereke2020) than women, and since larger shares of young migrant men are in particular viewed as constituting a threat to society (Ward Reference Ward2019). This focus further retains sufficient statistical power (see more in Appendix B). I operationalize immigration status by manipulating whether the participant was born in Denmark. In the analyses below, I mainly focus on the name-base cue, which is the standard measure of ethnicity, and present the results from the immigrant attribute in Appendix E.
Study design: between-respondent assignment to information conditions in the conjoint experiment.

These four attributes – name, immigrant status, religiosity, and age – appear in all the between-respondent information conditions. For each of the mechanism conditions, I added two additional attributes. In the socioeconomic condition, I added the participant’s education level and type of residence. In the cultural-values condition, I added attitudes on gender equality and homosexuals’ right to marriage. In the norm compliance condition, I added information on undeclared work and work status. In the full-information condition, I added all the mechanism attributes. Table 1 shows the full list of attribute levels, and Appendix B discusses the operationalization of the attributes in greater detail.Footnote 3 Finally, as I return to below, I included a placebo condition that contains the same four attributes as the control condition but adds six additional arbitrary attributes (see Appendix B). As Figure 1 shows, this creates six independent conjoint experiments. There is balance on the pre-treatment covariates across these six experiments (see Appendix C).
The List of Possible Attribute Levels in Information Conditions #1–5

Note: The numbers (for example, ‘#1’), refer to Figure 1 and indicate in which information condition the attributes are available. The value on the name attribute was randomly drawn from a 36-name pool (see Appendix A).
a In the analyses, I term short-cycle tertiary education as ‘short, further education’ and University education as ‘long, further education’. ‘Elementary school’ implies completing 9th grade.
To avoid order effects, profile order was randomized within respondents. Except the name of the profile, which always appeared at the top of the conjoint table, the order of the remaining attributes was randomized between respondents. With the exception of immigration status for profiles with Danish names, in which 90 per cent were described as being born in Denmark, the attribute levels are fully randomized with a uniform distribution. This, for example, implies that a third of the profiles evaluated were described as having completed only elementary school, though the actual share in the Danish population between thirty and sixty-nine years old is around 17 per cent. It also implies that some combinations of profiles are less realistic. Still, the (nearly) fully randomized conjoint design and the presence of atypical profiles is to some extent a ‘feature rather than a bug’ that exactly makes it possible to distinguish the effect of one attribute from another (Bansak et al. Reference Bansak, Druckman and Green2021, 38). This is particularly relevant in this study given the main aim of isolating the effect of ethnicity from other factors that are typically correlated with ethnicity (see De La Cuesta et al. Reference De La Cuesta2021; see more in Appendix B).
This design is advantageous in testing the theoretical argument for two reasons. First, the conjoint experiment reduces social desirability bias (Horiuchi et al. Reference Horiuchi2022) and makes it possible to estimate the effect of a series of different attributes; in this case, the average marginal component effect of ethnic attributes (H1) and the average marginal component effect of each of the three mechanisms (H2).Footnote 4 Second, randomly assigning the information-based mechanisms between respondents removes demand effects in these analyses and increases compliance with the information equivalence assumption (for example, Dafoe et al. Reference Dafoe2018; Gaddis Reference Gaddis2017; Landgrave and Weller Reference Landgrave and Weller2021). More importantly, it allows testing whether a reduction in ethnic bias is caused by introducing information on the proposed mechanisms (H3). Formally, H3 is tested by estimating the average marginal component interaction effects (AMCIE), which are difference-in-differences estimates testing how much of the total effect of ethnic attributes that is eliminated once one or more of the mechanisms are accounted for (see also Acharya et al. 2018).
The Danish Case
I fielded the experiment in Denmark: a small country with a universal welfare state and a historically homogenous population. During the second half of the twentieth century, the population became more ethnically diverse. The first guest workers, most with Turkish roots, arrived in the 1960s, and, today, 15.4 per cent of the population are immigrants or descendants of immigrants, and 10 per cent have roots in non-Western countries. Alongside these demographic changes, political far-right parties were elected to the national parliament and steered the public debate toward the alleged challenges of (non-Western) integration. Neither of these changes is unique to the Danish case, however. As I discuss in Appendix D, Denmark is fairly comparable to other European countries both in terms of the increase in immigration and in the populations’ attitudes toward immigrants.
Still, the fact that immigration to Denmark is a comparatively recent phenomenon implies that intergroup tension does not have its roots in historical grievances or enduring conflicts that, for example, underlie racial relations in the USA. This might suggest that, in comparison to such contexts, ethnic bias in Denmark and similar European countries may be easier to reduce if bias is less deep-seated and driven more by contemporary material concerns (for example, Crabtree et al. Reference Crabtree2022). Still, Denmark has, and has historically had, a large welfare state providing universal health care, tuition-free post-secondary education, and welfare benefits for all residents. As a result of this universal welfare state, cooperating with free riders is exceptionally costly. Further, compared to other Scandinavian countries, Denmark has experienced a ‘return of nationalism’ over the last decades (Mouritsen and Olsen Reference Mouritsen and Olsen2013), in which the idea of how social cohesion and welfare state sustainability comes about is based on ‘a society-centered and bottom-up perspective … which sees (pre)existing cultural homogeneity as indispensable’ (Borevi et al. Reference Borevi2017, 6). Thus, compared to other European countries experiencing recent diversification, Denmark is not likely to be an easy case.
Data
In total, a sample of 4,530 adult respondents in Denmark participated in the experiment. Respondents were recruited via YouGov, and the sample is representative of gender, age, and geography. The survey was conducted from 17 February to 16 March 2022 via the Internet using YouGov’s panel in Denmark. In accordance with the pre-registration, respondents without an ethnic Danish background are dropped from the analysis (N = 162, 3.58 per cent). The final sample consists of 4,368 adults with an ethnic Danish background who were evenly distributed across the six information conditions (around 720 in each condition). Since all respondents evaluate fifteen hypothetical participants, the effective sample is 65,520 observations.Footnote 5 In all analyses, I rely on linear regression and cluster the standard errors at the respondent level. As immigrant status correlates with profile names by design, these attributes were always included together in the statistical models.
Results
Do ethnic majority citizens expect that ethnic minorities are less willing to cooperate and thus contribute than ethnic majority members? Figure 2 presents the AMCE based on the control condition in which both Panel A (forced choice) and Panel B (continuous measure) offer consistent support for an ethnic bias in line with H1: participants with Middle Eastern names are expected to contribute significantly less than those with ethnic Danish names. The negative effect is substantial corresponding to 9.2 percentage points (0.2 SD) and DKK 64 (ca. US$9.5 or €8.7). Though research shows that different names might trigger different stereotypes even in the same country setting (for example, Crabtree et al. Reference Crabtree2022; Elder and Hayes Reference Elder and Hayes2023), the results are not driven by a few stereotypical names (see Figure F5 in Appendix F). The general finding replicates for the immigrant cue: those who are foreign-born are expected to contribute substantially less than those who are native-born. This pattern holds even for people with Danish-sounding names only thus indicating a bias against (presumedly) Western immigrants as well (see Figure F6 in Appendix F). Still, though immigrants are generally expected to contribute less to the collective, Middle Eastern immigrants are expected to contribute the very least suggesting some sense of ethnic hierarchies in the ethnic majority’s expectations toward minorities (see Figure F7 in Appendix F). In addition, ethnic majority citizens expect more cooperation from those who are described as religious, a pattern that is consistent across the name-based attribute and immigrant status, and, though interpreted very cautiously, the main results do not seem to replicate among the excluded sample of minority respondents (see Appendix I).
Average marginal component effects, control condition.
Note: Results are based on the ‘control’ model in Tables E1 and E2 in Appendix E. Estimates in Panel A report differences in probability. Estimates in Panel B report differences in DKK 100 on a scale from 0 to 10. The bars show 90 and 95 per cent confidence intervals. Neffective = 11,040.

Why do members of the ethnic majority expect less cooperation from ethnic out-group than in-group members? I have argued that citizens’ socioeconomic status, cultural values, and norm compliance each have a direct effect on expected cooperation (H2) and that the negative expectations toward out-group members wanes once one or more of these factors are available (H3). I examine these predictions in turn.
Figure 3 displays the results from the socioeconomic, cultural values, and norm compliance information conditions, respectively. All three factors have a substantial, direct effect on expected cooperation in line with H2. For socioeconomic status, both education level and type of residence have a positive effect: those who are more educated and signal financial robustness are expected to contribute more than those who are lower educated and are less financially robust. Though the effect of residence is somewhat weak, there are indications that the effect is stronger when the hypothetical person described is younger, in which case, the attribute more clearly signals wealth.
Average marginal component effects of socioeconomic status (SES), cultural values, and norm compliance on expected cooperation, forced choice.
Note: ‘SES’ shows the results from the socioeconomic status condition (#2); ‘Cultural Values’ shows the results from the cultural values condition (#3), and ‘Norm Compliance’ shows the results from the norm compliance condition (#4). The results are based on Table E1 in Appendix E. Figure E1 in Appendix E shows the full figures. The bars show 90 and 95 per cent confidence intervals. Neffective = 10,980, 10,860, and 10,695, respectively.

Cultural values also have a strong effect. People abiding by progressive values (specifically: gender equality and the right to marriage for homosexuals) are expected to contribute more than those who hold more conservative values on these issues. Compared to people with more conservative values, those signalling progressive values are expected to be around 25 percentage points more likely to cooperate. As I elaborate below, it is the sharing of values rather than the values themselves that underlies this effect. Thus, the average positive effect of progressive values on expected cooperation is observed because a significant fraction of ethnic majority citizens in Denmark themselves hold progressive values on matters of gender equality and homosexuals’ rights (92.42 per cent and 78.74 per cent, respectively).
Finally, signalling norm-deviant behaviour significantly reduces the likelihood of being perceived as a cooperator. Those who have conducted undeclared work and are on social welfare are expected to cooperate much less than those who have never conducted undeclared work and are employed. As I discuss in Appendix B, the findings related to the work status attribute could be interpreted both as evidence for a resource-based motivation and a social-norms-based motivation. In line with the former interpretation, those who are working hard to find a job are perceived to be less likely to contribute than those who already have a job. Thus, even when intentions to work are high, those with fewer resources, in this case not having a job, are expected to contribute less. In line with the norm-based motivation, however, the expectation is even lower regarding those who are not even making an effort and looking for a job. This more clearly signals a break with societal norms of trying to be employed and contribute to society, norms that are strong in most welfare states (for example, Hainmueller and Hopkins Reference Hainmueller and Hopkins2015).
In sum, there is strong support for the first part of the broader argument: that both resource-based, value-based, and norm-based factors have a direct effect on expected cooperation. These results replicate for participants with ethnic Danish and Middle Eastern names alike (see Appendix F) as well as for the continuous measure of expected cooperation (see Table and Figure E2 in Appendix E).
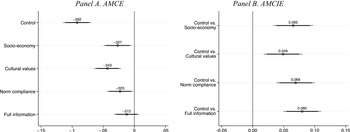
To assess whether these different factors reduce ethnic bias in expected cooperation, Figure 4 shows the AMCE of a name across the information conditions (Panel A) and the AMCIE between a name and the information conditions (Panel B). In the control condition, where relevant information is sparse, the minority-majority expectation gap is substantial. Yet, once information is available that indicates that there is no correlation between ethnic group membership and people’s socioeconomic status, cultural values, or norm compliance, ethnic bias is substantively reduced in line with H3. For example, having access to respondents’ education level and socioeconomic resources reduces ethnic bias by 6.5 percentage points, from a difference of -9.2 to a difference of -2.7. This corresponds to a 71 per cent reduction in the effect of the name-based cue once information on socioeconomic status is available. More generally, no specific explanation seems to underlie the reduction in bias, however: despite the difference in magnitude of the direct effects on expected cooperation of these social factors, the size of the reduction in bias is quite comparable across the different mechanisms.
Average marginal component effects and average marginal component interaction effects of names across information conditions, forced choice.
Note: In Panel A, the reference category is participants with an ethnic Danish name. Estimates in this panel report the level of ethnic bias within each of the five information conditions. Panel B reports the average marginal component interaction effects. These are difference-in-differences estimates reporting ethnic bias in the control condition subtracted from ethnic bias in each of the remaining information conditions. All results are based on model 1 in Table E3 in Appendix E. The bars show 90 and 95 per cent confidence intervals. Neffective = 54,360.

These findings demonstrate that ethnic bias in expectations operates via several complementary channels and is based on different underlying motivations. These motivations relate both to more rational expectations about citizens’ resources and abilities to contribute, to a preference for ideational similarity and the expectation that culturally similar citizens act in more pro-social ways, and to the importance of complying with social norms in order to be perceived as a cooperator. All of these underlying motivations matter individually, and, in tandem, they render the name-based attribute virtually irrelevant when evaluating the extent to which a person is likely to contribute to the collective. This rejects a taste-based account of ethnic bias and provides strong support for more statistical and belief-based perspectives. This also indicates that though negative expectations are reduced when socioeconomic resources are accounted for, ethnic bias is not necessarily erased simply by holding constant the resources people have (see discussion in Appendix J).
The main results replicate for the continuous measure of expected cooperation (see Figure E4 and Table E3 in Appendix E). The results also generally replicate for the immigrant-cue, though this bias is predominantly reduced by information related to norm compliance and is not erased in the full information condition once the continuous measure is used (see Figures E3 and E4 in Appendix E). Further, there is even suggestive evidence that the reduction in bias is greatest among majority citizens who vote for right-wing, anti-immigrant parties (see Appendix F).
Exploring the Psychological Drivers Further
In the following, I provide exploratory analyses of two nuances to these main results. First, a key assumption in the preference for cultural values-explanation is that expectations are driven by the sharing, not the content, of cultural ideas. To explore this assumption, I use pre-treatment questions to match respondents with each of the hypothetical participants in the public goods game on all the attributes used to test mechanisms (see Appendix G for question-wording). Figure 5 presents the relationship between sharing a trait and expected cooperation and corroborates the assumption: despite the content, ethnic majority citizens expect those sharing their cultural values to be more likely to contribute to the collective than those who do not. The importance of sharing traits is not prevalent to the same degree and with the same consistency for factors related to socioeconomic status and norm compliance (see more in Appendix G).
The relationship between sharing a trait and expected cooperation, forced choice.
Note: The figure is based on Table G1 in Appendix G. Sharing a trait is measured as a dummy that takes the value 1 if the respondent and hypothetical participant shared the same response on a particular attribute (0 otherwise). The bars show 90 and 95 per cent confidence intervals. Due to missing data on the respondent variable, Neffective varies across the different models from 8,835 in the work-status attribute to 10,905 on the education-level attribute.

Second, in Figure 6, I explore whether the reduction in ethnic bias over the information conditions is driven by the correction of in-group or out-group stereotypes (for example, Portmann Reference Portmann2021). Based on the marginal means across the information conditions using the continuous measure, the figure shows that, compared to the control condition, the ethnic majority expects less cooperation from ethnic in-group members and more cooperation from ethnic out-group members once socioeconomic and cultural factors are available. This indicates that, in information-sparse environments, ethnic majority citizens hold relatively more positive in-group stereotypes and relatively more negative out-group stereotypes in relation to socioeconomic resources and cultural values. In the norm compliance condition and in the full information condition, the expectations toward both groups decline relative to the control condition,Footnote 6 but most notably for the in-group: once a substantial fraction of the in-group is on social welfare or has conducted undeclared work, expectations to the in-group’s level of cooperation wane substantially. This suggests that in-group members are, in particular, expected to comply with these social norms a priori and that the updating of beliefs after receiving information is related more to in-group members than to out-group members, as out-group members might already be perceived to comply comparatively less with these norms at the baseline. In sum, providing information on these mechanisms appears to work both by reducing in-group favouritism and out-group derogation, although the former is stronger than the latter in relation to norm compliance.
Marginal means for names across information conditions, continuous measure.
Note: Estimates report the mean level of expected cooperation measured in DKK 100 on a scale from 0 to 10. The figure is based on model 2 in Table E3 in Appendix E. The bars show 90 and 95 per cent confidence intervals. Neffective = 54,360.

Robustness
One potential challenge to the main findings is that the reduction in ethnic bias could occur mechanically simply by including any attributes as this increases cognitive load. To evaluate this potential concern, I included a placebo condition in the experiment, which contained the same four attributes as the control condition as well as six arbitrary attributes such as whether the hypothetical participant liked sunrises, sunsets, or had no strong preference (see Appendix B and Appendix E). Figure 7 shows the AMCE and AMCIE where the placebo-condition is the comparison group. Although ethnic bias is larger in the control condition than in the placebo condition, the results generally replicate: comparing the full information condition to the placebo condition, in which the number of attributes and thus the amount of information is the same, shows that ethnic bias is reduced significantly more when theoretically relevant information is available; a finding that replicates for the continuous measure (see Table E5 and Figure E6 in Appendix E).Footnote 7 This suggests that the reduction in ethnic bias is driven more by theoretically relevant information than by any random information. Note, further, that if learning that people prefer dogs and enjoy sunrises humanizes them, the placebo condition would not only increase cognitive load but also contain somewhat relevant information, against the intention. In this case, the differences between the placebo condition and the other two conditions (control and full information) are biased toward 0.
Average marginal component effects and average marginal component interaction effects of names across the control, full information, and placebo treatment conditions, forced choice.
Note: In Panel A, the reference category is participants with an ethnic Danish name. Estimates in this panel report the level of ethnic bias within each of the three information conditions. Panel B reports difference-in-differences estimates; that is, the change in ethnic bias across the different information conditions, with the placebo condition as the reference category. Results are based on Table E5 in Appendix E. The bars show 90 and 95 per cent confidence intervals. Neffective = 32,985.

Another potential concern is that the results are driven by social desirability bias. There are two reasons why this does not appear to be a main threat to the validity of the results. First, one of the strengths of the conjoint experiment is that it allows a more accurate measure of socially sensitive attitudes (Horiuchi et al. Reference Horiuchi2022). When respondents engage with several, varying attributes simultaneously, ‘they may be less concerned that researchers will connect their choices to one specific attribute’ (Bansak et al. Reference Bansak, Druckman and Green2021, 24). The empirical results suggest that ethnic bias is substantial in the baseline condition where few attributes are available, and decreases in conditions where more attributes are available. From a social desirability perspective, we would expect the opposite pattern as respondents’ responses become more disguised the more attributes that are present. Second, as I show and thoroughly discuss in Appendix H, there is no indication that respondents are more biased in the first conjoint task compared to the following conjoint task, which could indicate that respondents become acquainted with the attributes and learn to respond in more socially desirable ways. On the contrary, ethnic bias becomes larger after the first round, on average. In Appendix H, I argue that this pattern is not a product of demand effects and suggest that respondents voting for left-leaning parties – who drive this pattern – may in fact act in socially desirable ways in the first conjoint round. Though this task contingency violates the assumption of stability across conjoint tasks (Hainmueller et al. Reference Hainmueller2014), the implication is that the estimates of ethnic bias, and the reduction in ethnic bias, may be underestimated and conservative.
Concluding Discussion
Members of the ethnic majority tend to view immigrants and ethnic minorities as ‘free riders’ who are less willing to contribute to the collective. Why is this the case? In this article, I have argued that negative expectations toward ethnic minorities are not driven by fixed ethnic attributes and ethnic identities per se but are explained by the correlates of ethnicity, in particular stereotypes related to citizens’ socioeconomic status, cultural values, and norm-compliance. Using an augmented conjoint experiment fielded among ethnic majority citizens in Denmark, I found support for the theoretical argument. When limited information was available, members of the ethnic majority expected substantively less contribution from minority members relative to majority members: people with typical Middle Eastern names as well as foreign-born were expected to cooperate less than people with typical Danish names and native-born. However, once information on people’s socioeconomic status, cultural values, and norm compliance was provided, and these factors were uncorrelated with ethnic group membership, the expectation gap was reduced and, jointly, explained away. This indicates that the minority-majority expectation gap exists as a result of more rational motivations related to people’s resources, of more preference-based motivations for cultural similarity, and of motivations related to in-group and out-group members’ behavioural compliance with social norms. There is, thus, not one grand explanation for the negative expectations toward out-group members but, instead, multiple and mutually compatible psychological mechanisms operating in conjunction with each other.
Several considerations related to the study design and the generalizability of findings are worth discussing. First, as with most studies of bias and discrimination, the study design relies on the assumption that the reduction in ethnic bias toward single out-group members generalizes to unobserved out-group members more broadly. Though this remains an assumption, ethnic bias in the study is very similar across all the eighteen ethnic minority names suggesting that bias and the reduction in bias is related to a broader minority category and collectively held attitudes toward members of that category (see Figure F5 in Appendix F). Second, the measure of social norms used is less conventional. Other measures of social norms, such as littering, or civic behaviour more broadly, such as volunteering, would be very relevant to use in future studies. Third, though the experimental manipulation of ethnic attributes and the information-based mechanisms ensure high internal validity, certain profile combinations are less realistic, and ethnicity is always uncorrelated from the mechanisms, both of which may reduce the external validity of the experiment. Though this is partly a feature rather than a bug in the conjoint setup, teasing apart the correlates of ethnicity in more real-world scenarios would be relevant. Fourth, the specific theoretical framework on socioeconomic resources, cultural values, and norm-compliance likely has most explanatory power in cases of historically recent immigration, such as in Europe. Still, the more general argument that negative expectations towards ethnic out-group members are rooted in malleable stereotypes rather than fixed ethnic attributes may apply more broadly even to contexts where ethnic and racial cleavages are intertwined with historical grievances, especially if such cleavages are related to stereotypes relevant to the expected pro-social behaviour of group members (see Appendix J). Fifth, the main findings are compatible with recent studies showing that stereotypes related to norms and ideas can explain everyday discrimination against immigrants in Europe (Choi et al. Reference Choi2019, Reference Choi2021) and studies showing that the unwillingness to help ethnic out-group recipients depends on recipients’ characteristics (for example, Kootstra Reference Kootstra2016; Magni Reference Magni2022). Still, in most of these studies, as well as studies on discrimination, bias can be reduced but is rarely erased (for example, Neumark Reference Neumark2018). One potential reason that ethnic bias is erased in this study may be due to the type of bias studied that relates to differences in empirical beliefs rather than (intended) behaviour. This also sets apart the current study from other studies that measure actual cooperation or public goods provision (for example, Gereke et al. Reference Gereke2021; Enos and Gidron Reference Enos and Gidron2018).
Despite these considerations, the findings provide important contributions. First, the findings provide important knowledge about ethnic politics and the nature of ethnic bias in diversifying societies. The results indicate that ethnic majority citizens use ethnic cues to draw inferences about other relevant citizen-characteristics and that ethnic bias in expected cooperation operates through these characteristics. While this does not imply that ethnic bias is not real, it does suggest that ethnic attributes work as placeholders of other pieces of information rather than as inherently meaningful categories. The fact that the root causes of ethnic bias are both resource-based, preference-based, and behaviour-based provides novel insight into the black box of ethnicity and reveals that there are qualitatively different, though complementary, motivations underlying the negative expectations toward ethnic minorities. That the multiple channels operate simultaneously may at the same time indicate a resilience of ethnic biases in expectations, as witnessed by the enduring bias in cases where only one of the three mechanisms is accounted for. Second, the results contribute to the literature on welfare discrimination in which the lack of solidarity towards immigrants and ethnic minorities is often explained with reference to their presumed lack of reciprocity (for example, Soroka et al. Reference Soroka2017; van Oorschot Reference van Oorschot2008). This article provides direct evidence of the relevance of this explanation showing that the ethnic majority does indeed, at baseline, expect ethnic minorities and immigrants to be less likely to contribute to the collective. Third, the findings provide new insight into the relationship between ethnic diversity and public goods provision. In their seminal work, Habyarimana and colleagues show that one of the key reasons that ethnic diversity challenges public goods provision is that ethnic in-group members expect more cooperation from in-group members than out-group members, and that they select cooperative strategies based on these expectations (Habyarimana et al. Reference Habyarimana2007; Habyarimana et al. Reference Habyarimana2009). This article furthers our understanding of the strategy selection mechanism by showing that negative expectations toward out-group members are driven by a series of ethnic stereotypes rather than fixed ethnic traits. This provides an important insight into the psychological motivations that underlie the diversity-public-goods nexus.
From a policy perspective, the fact that the expectation gap is driven by stereotypes related to resources, values, and norms, and that breaking with these stereotypes can reduce the expectation gap, indicates that ethnic bias in these empirical beliefs is malleable and contingent on citizens’ information environment. Though the multiplicity of mechanisms underlying negative expectations toward ethnic minorities suggests that the expectation gap may be more demanding to erase, correcting stereotypes through information appears to be one way in which ethnically biased expectations can be counteracted.
Supplementary material
The supplementary material for this article can be found at https://doi.org/10.1017/S0007123425000092.
Data availability statement
Replication data for this article can be found in Harvard Dataverse at: https://doi.org/10.7910/DVN/XKY5PI.
The pre-registration is available here: https://osf.io/5e7gb.
Acknowledgements
I thank participants at the 2022 EPSA Annual Meeting, members of the Political Behaviour and Institutions section at Aarhus University, and participants at the workshop on Inequality and Discrimination 2022 for providing high-quality inputs to this project. A special thanks goes to Kim Mannemar Sønderskov, Lasse Laustsen, Kristina Bakkær Simonsen, Martin Vinæs Larsen, Andreas Videbæk Jensen, Matias Engdal Christensen, Nicholas Haas, Antje Ellermann, Arnfinn Midtbøen, Henning Finseraas, and Matthew Wright.
Financial support
Support for this research was provided by Aarhus University. The author was funded by the Danish National Research Foundation (grant no. DNRF144).
Competing interests
The author declares none.


 Open access