


Introduction
Rift Valley fever (RVF) is a zoonotic disease that mainly affects sheep, goats, cattle and camels with a high potential to cause life-threatening hemorrhagic fevers in humans [Reference Njenga1] and severe economic impacts in livestock [Reference Rich and Wanyoike2, Reference Cagnolati, Tempia and Abdi3]. In East Africa, the RVF epidemics often occur following periods of widespread and above-normal precipitation, especially in savanna grasslands, flat terrains and low lying areas that are susceptible to flooding [Reference Hightower4]. Endemic RVF virus (RVFv) transmissions have also been observed in riverine or irrigated areas [Reference Mbotha5] and forested habitats. Its geographical range has slowly expanded from sub-Saharan Africa to the Arabian Peninsula [Reference Abdo-Salem6], Madagascar [Reference Andriamandimby7] and Mayotte [Reference Lernout8] and recent risk analyses suggest that there is potential for the disease to spread northwards to Europe [9].
Many studies have been carried out to determine the prevalence and risk factors of RVF especially in sub-Saharan Africa [Reference Evans10–Reference Soumare15]. Whereas RVFv seroprevalences determined in these studies vary depending on the region, risk factors identified tend to be somewhat similar and associated with the two main modes of RVFv transmission – (i) mosquito-borne infections and (ii) direct transmission that occurs when humans come into contact with infected livestock. Exposure through inhalation of aerosolised viral particles especially during outbreaks is also thought to contribute to human exposure [Reference Bird16]. Factors associated with RVFv exposure in livestock include semi-nomadic pastoralism [Reference Anderson17], advanced age and exotic and crossbreeds compared with local breeds [Reference Umuhoza18]. Those associated with exposure in people are advanced age [Reference Grossi-Soyster19], history of animal contact [Reference LaBeaud20] for instance through animal slaughtering [Reference Anderson17–Reference Cook21]. Most of the RVFv exposures in people result in transient febrile infections but a few of these, such as those associated with handling or consumption of products from infected animals and touching fetuses from aborted animals, leads to severe hemorrhagic disease [Reference Anyangu22].
While many studies have demonstrated that RVFv infections in people are closely linked to those of livestock [Reference de La Rocque and Formenty23], there are no data that can be used to estimate the proportion of human risk attributable to livestock infection. Similarly, few studies have been carried out to quantify the distribution of RVFv cases at multiple levels of aggregation such as communal grazing units, villages and households. There is evidence for RVFv seroprevalence clustering at the village level but its magnitude has not been determined [Reference Soumare15, Reference Grossi-Soyster19]. We conducted a linked livestock-human cross-sectional study in an RVF endemic site in Kenya that was the epicenter of the 1997–1998 and 2006–2007 outbreaks. The study was designed to determine RVFv seroprevalences in livestock and humans and estimate the odds of exposure in humans due to the presence of at least one seropositive livestock in the household. The study also quantified intra-cluster correlation coefficients (ICCs) of the RVFv seroprevalences at household and village levels.
Methods
Study area
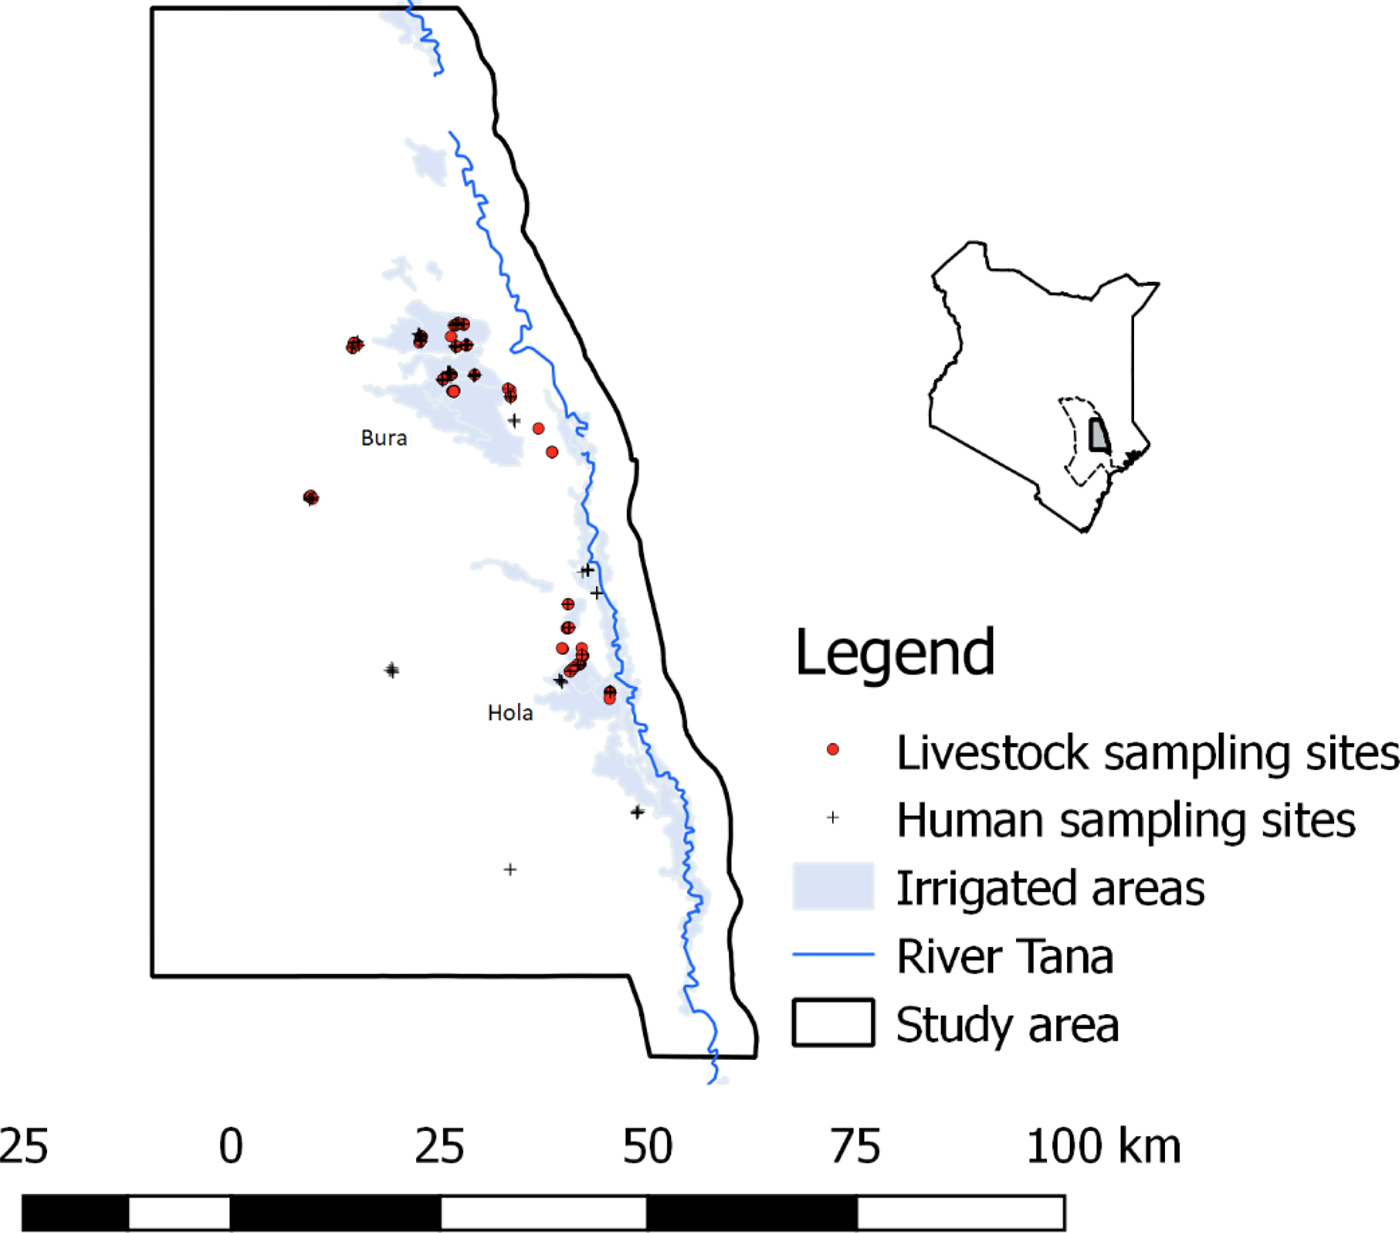
The study was carried out in Bura and Hola irrigation schemes in Tana River County; their geographical locations are illustrated in Figure 1. These sites are about 30 km apart and have been described previously [Reference Bett24]. Briefly, Bura irrigation and settlement scheme covers 2100 hectares with a tenant population of slightly over 2000 households settled in 10 villages, while Hola irrigation and settlement scheme covers 1011 hectares and has 700 farming households settled in six villages. Their annual rainfall averages 460 mm and it has a trimodal distribution with a major peak in October–December and subsidiary peaks in March–May and August–September. The average daily temperature ranges between 32 and 37 °C. Data collection was carried out between September 2013 and March 2014.
The distribution of livestock and human sampling sites used in the study (September 2013–March 2014). A map of Kenya is given in the inset figure illustrating the location of Tana River county, with a dotted boundary line and the study area with a bolded boundary line and shaded region.
Study design
A cross-sectional study design that sampled livestock (cattle, sheep and goats) and humans in randomly selected households were used. In this context, a household was defined as a group of people who lived together and shared common livelihood activities under a common household head, while a herd was defined as a group of animals owned by a household. Livestock of all ages and people that were greater than 5-years-old were eligible for recruitment.
The sample size required was determined using the algorithm described by Humphry et al. [Reference Humphry, Cameron and Gunn25]. Inputs used included a priori seroprevalence in cattle, sheep and goats of 25.8%, 32.2% and 33.3%, respectively, which were obtained from a previous study conducted in the same region [Reference Nanyingi26] and 13% in humans [Reference Labeaud11]. Other inputs included desired precision of the test, assumed to be 5%, a confidence level of 95% and the sensitivity and specificity of the RVF enzyme-linked immunosorbent assay (ELISA) test used in the survey, both assumed to be similar to those of immunoglobulin G (IgG) sandwich ELISA evaluated by Paweska et al. [Reference Paweska27]. Livestock and humans from the same households were expected to have similar exposure factors and hence their RVFv exposure status was likely to be correlated. The estimated sample sizes were therefore adjusted for the design effect assuming an intra-household correlation coefficient of 0.04 and herd/household sizes of cattle, goats, sheep and humans of 10, 20, 15 and 10, respectively. No studies have been done to estimate ICC for RVFv but recommendations given by Otte and Gumm [Reference Otte and Gumm28] suggest that, for most infectious diseases, ICC values range between 0.04 and 0.42, with most values being less than 0.2. From this analysis, at least 312 cattle, 356 goats, 351 sheep and 190 humans were required for the study.
A sampling frame comprising a list of households in the study sites was drawn up with the help of village leaders and the managers of the Bura and Hola irrigation schemes. These were then used for random selection of households and herds.
Animal and human sampling
Animal sampling was carried out by animal health experts from the Department of Veterinary Services. Data collected from each animal during blood sampling included age (described as calf/kid/lamb (referred to as juveniles), weaner or adult), sex, breed and body condition score. These data were collected using electronic forms designed using Open Data Kit (ODK) tools (https://opendatakit.org/) deployed in Android smartphones. Up to 20 animals were selected in each herd for sampling using systematic sampling technique where every 3rd–5th animal was recruited depending on the size of the herd.
Selected animals were manually restrained and blood collected through jugular venipuncture using a vacutainer needle. Plain and ethylenediaminetetraacetic acid (EDTA)-coated bar-coded vacutainer tubes were each used to collect 5–10 ml of blood. Serum was extracted from the plain vacutainer tube at the end of each day at the local livestock office by centrifuging clotted blood at 3000 rotations per minute for 5 min. An extracted serum sample was transferred using sterile Pasteur pipette into 2 ml sterile bar-coded cryovials. Whole blood from EDTA-coated vacutainer tubes was also transferred to 2 ml sterile bar-coded cryovials. These samples were stored and transported in dry ice to International Livestock Research Institute (ILRI) Biorepository Unit in Nairobi.
In humans, blood was collected from the forearm veins by medical professionals using 5 ml plain and EDTA-coated vacutainers. Up to five individuals could be sampled per household – the specific individuals sampled were identified conveniently with assistance from the head of the household. Whole blood from EDTA-coated tubes and serum extracted from plain vacutainer tubes were each transferred to 2 ml sterile bar-coded cryovials at the local health centres. Serum and blood samples for each subject were prepared in duplicates. They were kept and transported in dry ice to ILRI Biorepository Unit.
Questionnaires
After obtaining an informed consent, a questionnaire was administered to each subject to obtain data on age, sex, occupation – farmer, pastoralist (which also included hired herders), student and others which included local administrators, traders, etc.– and the highest level of education attained. Farmers included individuals who grew crops or kept livestock under sedentary production system particularly in the irrigated areas; pastoralists included individuals who kept livestock as the main source of livelihood and grazed them in communal grazing sites; herders included people that were employed to look after other people's livestock; and students included household members who were in school or college at the time of sampling. The questionnaire also collected data on livestock ownership, herd size and type of livestock owned. The questionnaire was designed using ODK tool. At the time of blood sampling, about 20% of the households declined to participate; these were replaced by running an additional random selection procedure focusing on the households that had not been selected earlier in the sampling frame.
Laboratory screening
Human and animal sera were tested for anti-RVFv IgG using ELISA test (BDSL, National Institute for Communicable Diseases, Centre for Emerging and Zoonotic Diseases, Johannesburg, South Africa). Positive human samples and an equal number of randomly selected negative samples were further screened using virus neutralisation test (VNT) at 1:20 dilution using the RVFv MP12 strain as described previously [Reference Warimwe29]. The sensitivity and specificity of the BDSL ELISA were calculated with reference to the VNT.
Data management and analysis
Data collected during sampling as well as those from the household questionnaire survey were uploaded to the ILRI server at the end of each day. Each data file was saved as a comma delimited file. They were exported to Microsoft Access 2010 for cleaning and merging and finally to STATA version 13 for analysis.
Descriptive analyses commenced with the determination of RVFv seroprevalences (with 95% confidence interval) in animals and humans. These estimates were further stratified by all the categorical variables. For livestock data, categorical variables considered were species (cattle, sheep or goats), sex, age (juveniles, weaner or adult), area (Bura or Hola) and land use (pastoralism or irrigation), while for human data these were sex, age (⩽7 years, 18–40 years or >40 years), occupation (categorised as pastoralism, farmer, student and other), area and land use. To determine the relationship between RVFv exposure in livestock and humans at the household level, a dummy variable was created from livestock seropositivity data to indicate whether there was at least one seropositive animal in a given herd/household (value = 1) or not (value = 0). This was then merged with the human data using the household ID as the primary key. Herd-level RVFV prevalence was also used to analyze the association between human and livestock exposures but the dummy variable described above (that captured herd exposure based on the presence of at least one seropositive animal) fitted the data better. True RVFv seroprevalence in humans was determined based on the sensitivity and specificity of the BDSL ELISA estimated above.
Univariable logistic regression models were fitted to each dataset to identify an unconditional association between each of these variables with their respective outcomes (RVFv exposure status in animals and humans). Multivariable random effects logistic regression models were fitted to these data through a combination of backward-forward variable selection technique with α = 0.05. Two-way interaction terms were also tested. The analysis used melogit command in STATA, with default integration method and points (i.e. mean-variance adaptive Gauss–Hermite quadrature and 7, respectively). The analyses commenced with a saturated model that was systematically reduced by removing variables (both fixed and random effects) that had a P value > 0.05 based on likelihood ratio test (lrtest). Variance estimates associated with the random effects, household and village were used to estimate the ICC following the latent variable approach described by Dohoo et al. [Reference Dohoo, Martin and Stryhn30]. The ICCs were generated using the command estat icc. Deviance residuals and fitted values were generated and used to evaluate the final models developed. A detailed description of these approaches, including the definitions of random effects and ICCs is provided by Kadohira et al. [Reference Kadohira31] and Dohoo et al. [Reference Dohoo, Martin and Stryhn30]. Finally, an estimate of adjusted population attributable fraction (PAF) of RVFv exposure in animals on human seropositivity was estimated using punaf command based on the adjusted odds ratio from the multivariable model.
Ethics statement
The ethical review and approval for the study were provided by the African Medical Research Foundation's Ethics and Scientific Review Committee (approval number P65-2013).
Human subjects gave informed consent before being sampled. The consents were read to them in the presence of a witness. They were asked to sign the consent forms after they confirmed that they had understood the information provided. If the subject was a child aged 5–12 years, only the parent's consent was obtained. If the selected individual was a child between 13 and 17 years of age, the subject's assent was taken together with that of the parent or guardian. For adults (⩾18 years), personal consents were required. Forms used for these consents are provided as Supporting documents S2, S3 and S4, respectively. Briefly, information on the objectives of the study, how the participant was identified, freedom to accept or decline participation, benefits and risks of the study was provided. All these processes required the presence of a witness who verified that adequate information on the research was provided and subjects participated in the research voluntarily.
Livestock sampling protocols were reviewed and approved by the ILRI Institutional Animal Care and Uses Committee (IACUC) (approval number 2014.02). ILRI IACUC is registered in Kenya and complies with the UK's Animals (Scientific Procedures) Act 1986 (http://www.homeoffice.gov.uk/science-research/animal-research/) that contains guidelines and codes of practice for the housing and care of animals used in scientific procedures. The study adhered to the IACUC's 3R principles of (i) replacement of animal with non-animal techniques, (ii) reduction in the number of animals used and (iii) refinement of techniques and procedures that reduce pain and distress. Consent was obtained from livestock owners before sampling.
Results
Descriptive analyses
A total of 1932 animals comprising 450 cattle, 924 goats and 558 sheep from 152 households in 20 villages were sampled. The distribution of the number of animals sampled by area and other independent factors considered is shown in Table 1. The average herd size (for all the livestock species combined) was 12.71 (s.d. 11.30) animals per household. For the human data, samples from 552 people from 170 households in 24 villages were collected. The overall mean number of people sampled per household was 3.25 (s.d. 1.41). A total of 141 households had at least two people sampled. The distribution of these subjects by the various independent factors considered in the study is shown in Table 2. The mean numbers of livestock and humans sampled per village were 96.60 (s.d. 21.20) and 22.42 (s.d. 11.44), respectively.
RVFv seroprevalence in the three livestock species sampled in Tana River County, Kenya (September 2013 – March 2014)
n, number of animals; CI, confidence interval.
RVFv seroprevalence in people sampled in Tana River County, Kenya (September 2013 – March 2014)
n, number of subjects; CI, confidence interval.
a Data are sparse, and estimates obtained are not reliable for this category.
b Indicates whether there was at least one seropositive animal in the household sampled.
Sensitivity and specificity of RVF ELISA kit
Of the 322 human samples tested using VNT, 153 turned positive and the remaining 169 were negative. The BDSL ELISA kit had identified 148 out of the 153 VNT positive samples as being positive, representing a sensitivity of 96.73% (95% CI 92.54–98.93%). Similarly, 156 out of the 169 negative VNT cases were negative on BDSL ELISA, giving a specificity of 92.31% (95% CI 87.21–95.84).
RVFv seroprevalence
Of the 1932 animals sampled, 491 (25.41%; 95% CI 23.49–27.42) were positive for anti-RVF virus IgG antibodies. This seropositivity did not vary significantly by species (χ 2 = 1.38, P = 0.50) as the respective mean seroprevalences in cattle, sheep and goats were 26.00% (95% CI 22.00–30.31), 24.24% (95% CI 21.51–27.14) and 26.88 (95% CI 23.24–30.77). The associations between the independent categorical factors – age and sex of an animal, and area – and RVFv seropositivity in each of the three animal species used in the study are shown in Table 1. In general, females and older animals had significantly higher RVFv seroprevalences compared with males and younger animals, respectively. There was no difference in RVFv seropositivity between Bura and Hola. At the herd level, 38 herds (23.03%; 95% CI 16.84–30.21%) out of 165 were positive.
In humans, 170 out of the 552 (21.20%; 95% CI 17.86–24.85) subjects were positive for anti-RVF virus IgG antibodies. Forty-six households (26.74%) had one person being seropositive, 18 (10.47%) had two, nine (5.23%) had three and one (1.16%) had four. Table 2 illustrates the distribution of seropositive individuals by five categorical factors. Results of the χ 2 tests used to analyse these data show that males had significantly higher seroprevalence than females, as did pastoralists compared with farmers and students, older people compared with the young, people from Bura compared with those from Hola and people who came from households that had at least one seropositive animal compared with those who did not. The true RVFv seroprevalence was determined to be 15.16%.
Univariable analyses
Results from univariable models demonstrated similar trends on the association between the independent factors and RVF virus seropositivity as those obtained from χ 2 tests illustrated in Table 1 except for the herd size which turned out also to be significant. Animals that came from herds with >50–100 and >100 animals had higher odds of seropositivity (i.e. 1.27; 95% CI 0.90–1.63 and 1.39; 95% CI 1.08–1.78, respectively) compared with those that came from herds with ⩽50 animals. No difference was observed between using all the livestock species in a household to determine herd size vs. using the small ruminants alone. An animal's body condition score was also fitted in these models but it was found to be non-significant.
Univariable analyses on the human data produced similar results (patterns of associations) as those obtained from the χ 2 tests. Herd-level exposure was positively associated with increased odds of seropositivity in humans.
Multivariable analysis
Two fixed effects, i.e. age and sex of an animal and two random effects, i.e. herd and village, were significant in the final random effects logistic regression model used to analyse livestock RVFv seroprevalence (Table 3). Herd size became insignificant in the model when the village random effect was included. The model shows that when controlling for the effects of confounders, juveniles, as well as weaners, had lower odds of exposure to RVFv compared with adults. Similarly, males had lower odds of exposure compared with females. The random effects show that variation (in RVFv seroprevalence) at the village level was about three times higher than that at the herd level. ICCs estimates between two observations from the same herd as well as those from different herds in the same village were 0.30 (95% CI 0.19–0.44) and 0.22 (95% CI 0.12–0.38), respectively.
Outputs from a random effects logistic regression model used to analyse RVFv seroprevalence data from livestock from Tana River County, Kenya (September 2013 – March 2014)

Log likelihood −921.06; number of observations 1905; number of herds 151; number of villages 20.
A multivariable model fitted to the human data identified age, sex and herd-level exposure as significant predictors for RVFv seropositivity (Table 4). The model showed that there was an ordinal increase in the odds of RVFv exposure with age when other factors were controlled for. Similarly, males had higher odds of RVFv seropositivity compared with females. These results further showed a positive association between RVFv exposure in livestock and people at the household level. Odds of RVFv in people who belonged to households with at least one seropositive animal were at least two times higher than in those who came from households with unexposed livestock. This was associated with a PAF of 32.74% (95% CI 0.00% and 55.37%).
Outputs from a random effects logistic regression model used to analyse RVFv seroprevalence data from people from Tana River County, Kenya (September 2013–March 2014)

Log-likelihood −153.57; number of observations 362.
The random effects (household ID) and area (Hola vs. Bura) had mutually exclusive effects and both could not be kept in the model. Variance associated with the household random effect of 0.45 provided an intra-household correlation coefficient of 0.12 (95% CI 0.02–0.49). The random variable was however not significant in the model.
Discussion
This study determined seroprevalences of RVFv in livestock and humans, as well as their variance at herd or household and village levels. We found a strong association between RVFv seroprevalence in livestock and humans, and larger variation in RVFv exposure between animals from different herds than that between animals within the same herds. The random effects logistic regression models used for the analyses also identified sex and age as being significant predictors in both livestock and humans. The main strengths of this work include (i) joint screening of humans and livestock at the household level, (ii) validation of ELISA test used to screen human sera using VNT as the gold standard and (iii) the use of random effects logistic regression models to determine ICCs, which influence patterns of clustering of RVFv seroprevalences at various levels of aggregation. The study also estimated PAF of livestock infection on human exposure. Results from VNT assays demonstrated that the ELISA kit used to screen human samples had sufficiently high specificity and sensitivity required to reliably determine RVFv exposure. To enable more efficient meta-analyses of published RVFv seroprevalences, the sensitivity and specificity of all the tests used should be published.
RVFv seroprevalences and risk factors in livestock
In livestock, the observed RVFv seroprevalences were comparable across the species sampled. These findings are in agreement with other studies conducted in Kenya and Tanzania [Reference Sumaye14, Reference Nanyingi32]. Age was significant in the multivariable models used given that older animals had higher RVFv seroprevalence than younger ones. Generally, advanced age is a consistent risk factor for RVF virus exposure in a wide range of hosts. Surveys that involved the African buffalo in the Kruger National park, for example, established that older animals were more likely to be more seropositive for RVFv than younger ones [Reference Beechler33]. Age captures exposure time and older subjects are expected to have had more exposures than younger ones [Reference Kadohira31]. Anecdotal reports also indicate that anti-RVFv IgG antibodies persist in circulation for life; positive cases observed could have therefore included cumulative infections, but as discussed below, the high human and livestock population turn-over in the area limits the frequencies of historical exposures. Kids and lambs had higher seroprevalences than weaners probably because of maternal antibodies that usually persist for about 7 months after birth [Reference Sumaye14].
Sex of an animal also had a significant effect. The odds of RVFv exposure in females was high than that of males. These findings are similar to those reported from a cross-sectional survey conducted in southern Tanzania [Reference Sumaye14] but varied from those from a survey conducted in Rwanda [Reference Umuhoza18] which did not find any differences in exposure levels by sex. No studies have been done to determine how sex influences RVFv exposure in animals. We postulate that the high proportion of females compared with males in the study population might have increased their chances of being bitten by mosquitoes. About 22% of the households sampled kept female animals only and in households where both males and females were kept, 26% of the animals comprised males. Some of the transmission models for vector-borne diseases that have been published weight the relative force of infection in males vs. females based on their relative numbers. In this case, host groups with higher population proportions often stand a higher chance of being exposed to a pathogen of interest.
RVFv exposure varied more between animals from different herds than that between animals within the same herds. Clustering of RVFv seroprevalence at the herd level was an unexpected finding because patterns of RVF occurrence, like those of other vector-borne diseases, are determined by vector distribution. Risk maps that have been developed for RVF based on data collected during epidemics to determine spatial patterns, identified high-risk areas based on rainfall patterns and soil types [Reference Munyua34]. In this case, livestock herds from the same areas are often assumed to have similar exposure patterns. The clustering patterns observed in this study, therefore, imply that RVFv exposures are influenced more by livestock management practices (e.g. grazing patterns, use of insecticide sprays to control vectors, etc.) compared with area-level factors. Insecticide sprays, for example, are commonly used to control ticks. These sprays are also effective against mosquitoes and any differences in application frequencies, dosing etc. between herds would inevitably introduce a lot of variability on mosquito–host contact and hence the herd-to-herd variation in RVFv exposure.
ICCs are important parameters for designing observational designs. They should also be used to develop more effective sentinel surveillance programs. The high ICC estimates for RVFv seropositivity within livestock herds obtained in this study (given that most ICCs for infectious diseases are less than 0.2 [Reference Otte and Gumm28]) indicates that RVFv observational surveys should use animals from multiple herds in an area to reliably determine risk of endemic RVF risk, rather than using many animals in few herds. This is because RVFv exposure status of animals within herds would be highly correlated, and therefore additional samples from the same herds are unlikely to provide more beneficial information [Reference Kadohira31]. Although our results (on ICCs) are more applicable to endemic RVFv infections, they suggest the need to re-examine patterns of epidemic RVFv infections so as to design more effective sentinel surveillance systems. It is likely that data obtained from sentinel herds also cluster at the herd level since these herds are often raised at the farm level. In many countries, though, these herds are often thinly distributed in RVFv endemic areas, therefore increasing their chances of mis-representing the prevailing RVFv risk. There is a need to determine patterns of RVFv exposure in these herds and use the results obtained to determine the optimal number and distribution of sentinel herds in an area to improve the sensitivity of this surveillance system (for RVF). More importantly, endemic RVFv infections develop into epidemics when ideal climatic conditions prevail. Information on endemic RVFv infection patterns should therefore be used in risk assessments to determine areas and host populations that would experience greater risk of the disease if epidemics were to occur.
RVFv seroprevalences in humans
The observed RVFv seroprevalences in humans (which ranged between 17.86 and 24.85%) were comparable with those reported for livestock (of 23.49–27.42%). A parallel study conducted in the area showed that there was endemic circulation of RVFv especially in the irrigated areas [Reference Mbotha5] which probably sustained continued exposure of livestock and humans to the virus. A major outbreak of RVF occurred in the area in 2006–2007, about 6 years prior to this study. Given the high livestock population turnover and immigration of people from various areas to these sites for agriculture and settlement, it is likely that exposures acquired during that outbreak represented a negligible proportion of cases observed in this study. The areas used in the study also served as dry season grazing grounds for a wide range of livestock that might have contributed in sustaining endemic RVFv transmission. We envisage that such RVF infected environments serve as reservoirs of the virus especially during the inter-epidemic periods. Following periods of heavy rainfall and flooding, the virus is spread to adjoining areas by mosquitoes that develop, but with the threat of further spread through livestock movements. Studies have shown that the RVF virus strains circulating in such endemic areas are genetically similar but they differ from those in other endemic areas [Reference Nderitu35].
Risk factor analyses revealed that being a male or advanced age were associated with higher odds of RVFv exposure compared with being a female or younger age, respectively. The gender effects observed could be attributed to livelihood practices. In most African societies, males engage in practices such as animal slaughtering, disposal of carcasses and herding which are likely to increase their chances of exposure to RVFv. Studies conducted in Senegal by Murrama et al. [Reference Marrama36], however, did not find significant differences in RVFv exposure by gender. They observe that chores such as animal slaughtering involve all gender groups – adult men are involved in the slaughter of animals, children of both genders take a part in the skinning and butchering while women cook the meat.
There was no significant clustering on the human cases at the household or village levels. This might be attributed to the fact that humans have multiple exposure pathways with varying risk profiles determined by socio-economic practices, unlike those for livestock where animals in a herd share similar environments with more or less equal odds of exposure. In addition, humans are mainly dead-end hosts for RVFv and so the presence of one infected individual in a household would not increase the risk of infection for the other household members. There is no evidence indicating human-to-human transmission of RVFv.
Human–livestock interactions
No studies have been done to quantify the proportion of human RVFv exposures attributable to livestock infection, yet this estimate is required to determine the potential impacts of One Health interventions for RVF. The analyses conducted suggest that within the study population, there was a strong association between livestock and human seroprevalences at the household level – RVFv exposure in livestock was associated with increased odds of RVFv seropositivity in humans by 2.23 (95% CI 1.03–4.84). PAF was also calculated to determine the proportion of human exposure at the population level that could be associated with RVFv exposure in livestock. The PAF derived was however low (32.74%) and highly variable (with 95% CI 0.00–55.37%). This probably represents the complex RVFv transmission patterns, particularly at the animal–human interface. Humans acquire RVFv infections through two main modes of transmission: (i) direct contact with infected animals or tissues, consumption of contaminated animal products, or inhalation of aerosolized viral particles and (ii) a bite of an infected mosquito [Reference Archer37]. All these mechanisms are expected to occur at the population level. In this area, people worked in irrigated farms infested with competent vectors for RVFv, and hence the presence of an infected herd in a household would introduce a marginal effect on RVFv seropositivity in humans. It is possible, however, that clinical RVF cases in humans are associated with higher PAF values given that cases can be directly traced back to infected herds.
The study had a few limitations. The main one was the use of antibody detection technique to infer RVFv exposure; anti-RVFv IgGs can persist in body tissues for many years and it is likely that some of the cases detected were historical exposures. This might have therefore yielded higher ICCs estimates than those expected from active RVFv infections. The study also used a cross-sectional study design which limits our ability to detect cause-effect relationships. All the statistical relationships obtained only represent associations. Some of the variables used in the analysis were also not accurately defined and might have introduced misclassification biases. The use of wide qualitative age categories in livestock, for example, might have limited our ability to control for confounding associated with the age of an animal. Furthermore, herd-level exposure was determined based on the presence of at least one seropositive animal in a herd. This is expected to increase the sensitivity of exposure classification system but reduce its specificity. Nonetheless, the observations made provide a background that can be used to design more studies on zoonotic diseases at the human–livestock interfaces.
Conclusion
The study made two important observations; first, RVFv exposures in livestock had greater variation between herds in a village than between animals in a herd, indicating that herd-level management factors substantially influence exposure even in areas where environmental drivers are expected to be dominant. Related to this finding, the study estimated ICCs for RVFv seroprevalence in livestock that would be relevant for designing future epidemiological studies. Second, RVFv exposure in livestock was associated with increased odds of exposure in humans in the same households. Finally, the study estimated PAF of livestock infection on human exposure. This was however determined to be low (32.74%) and highly variable (ranging between 0.00 and 55.37%). The low PAF estimate could be associated with multiple RVFv exposure pathways through which people could get clinical and non-clinical RVFv cases. We expect that PAFs of clinical RVF cases (not studied here) would be higher than those generated here since they are often linked to infected herds.
Author ORCIDs
B. Bett, http://orcid.org/0000-0001-9376-2941 and M. Wainaina http://orcid.org/0000-0002-4938-2543.
Acknowledgements
We thank all the people who participated in the study including livestock owners, veterinarians from Tana River Counties, clinicians from Bura and Hola health centres and the local administrative officers. The serosurveillance data were collected by John Muriuki, Damaris Mwololo and Millicent Liani. This paper is published with permission from the Director of the Kenya Medical Research Institute (KEMRI). This study was part of a project entitled Dynamic Drivers of Disease in Africa: Ecosystems, livestock/wildlife, health and wellbeing NE-J001570–1 that was jointly funded by the Ecosystem Services for Poverty Alleviation Programme (ESPA) and the CGIAR Research Program Agriculture for Nutrition and Health. The ESPA programme was funded by the Department for International Development (DFID), the Economic and Social Research Council (ESRC) and the Natural Environment Research Council (NERC).
Conflict of interest
None.


 Open access