

The corpus callosum develops until early in the third decade and is the last brain structure to complete myelination Reference Keshavan, Diwadkar, DeBellis, Dick, Kotwal and Rosenberg1 during a period that includes the peak onset of bipolar disorder. The importance of the corpus callosum in mood disorders is increasingly recognised. Reference Atmaca, Ozdemir and Yildirim2-Reference Brambilla, Nicoletti, Sassi, Mallinger, Frank and Keshavan4 It has a role in cognitive functions that are impaired in bipolar disorder. Reference Thompson, Gallagher, Hughes, Watson, Gray and Ferrier5,Reference Robinson and Ferrier6 Previous magnetic resonance imaging (MRI) studies have shown reduced corpus callosum midsagittal area Reference Bearden, Hoffman and Cannon7-Reference Brambilla, Nicoletti, Sassi, Mallinger, Frank and Kupfer10 and thickness Reference Bearden, Hoffman and Cannon7,Reference Walterfang, Wood, Barton, Velakoulis, Chen and Reutens9,Reference Walterfang, Malhi, Wood, Reutens, Chen and Barton11 in individuals with bipolar disorder, most frequently or of greatest magnitude in the splenium, midbody and, in some studies, the genu. A meta-analysis of callosal area analysed data from five studies Reference Arnone, McIntosh, Chandra and Ebmeier12 and showed a reduction in patients with bipolar disorder compared with controls with a significant effect size (–0.52, 95% CI –0.82 to –0.21). There has been a single study of first-episode, treatment-naive patients Reference Atmaca, Ozdemir and Yildirim2 that, although participant numbers were limited (12 in each group), showed reduced corpus callosum area in those with bipolar disorder compared with controls. Although the demographics of participants are well-described in most studies, generally the clinical features of patients and their mood state at the time of testing are less well defined with the exception of one, Reference Walterfang, Wood, Barton, Velakoulis, Chen and Reutens9 which found reduced callosal area and thickness in individuals whose bipolar disorder had remitted. Callosal MRI T 1-signal intensity reduction has also been described. Reference Brambilla, Nicoletti, Sassi, Mallinger, Frank and Keshavan4 Proposed mechanisms include altered myelination (possibly due to glial dysfunction) Reference Brambilla, Nicoletti, Sassi, Mallinger, Frank and Keshavan4,Reference Bearden, Hoffman and Cannon7,Reference Brambilla, Nicoletti, Sassi, Mallinger, Frank and Kupfer10 and reduced fibre number. Reference Bearden, Hoffman and Cannon7 Diffusion tensor imaging studies provide evidence of microstructural change and disruption to white matter integrity in the corpus callosum of patients with bipolar disorder Reference Macritchie, Lloyd, Bastin, Vasudev, Gallagher and Eyre13,Reference Benedetti, Yeh, Bellani, Radaelli, Nicoletti and Poletti14 with regional distribution similar to gross structural change as reported above. No previous study has considered area, thickness and signal intensity together in the same participants.
We examined corpus callosum midsagittal area, thickness and signal intensity in patients and matched controls prospectively verified as euthymic for 1 month prior to data acquisition and who comprised a subset of patients recruited into the Newcastle euthymic bipolar disorder study. Reference Thompson, Gallagher, Hughes, Watson, Gray and Ferrier5
We hypothesised that individuals with bipolar disorder would have reduced callosal midsagittal areas, reduced callosal thickness and also reduced T 1-signal intensity in co-incident regions of the corpus callosum. We explored the relationship between imaging findings and clinical variables.
Method
Participants
A total of 49 patients with bipolar disorder were recruited to the imaging study from secondary and tertiary clinical psychiatry services and 47 controls were recruited from the community by advertisement. The Newcastle and North Tyneside Joint Ethics Committee approved the study and following a full explanation participants gave written informed consent to take part. Patient and control groups were matched via recruitment for age, gender, social/occupational class. Premorbid IQ was assessed with the National Adult Reading Test (NART). Reference Nelson15
Following screening for exclusion criteria and contraindication for MRI, all participants underwent a detailed examination by experienced psychiatrists to confirm diagnosis and current mood state. Clinical and demographic details were obtained from interview and case-note review for the bipolar group. The inclusion criteria for the bipolar group were: Structured Clinical Interview for DSM-IV (SCID)-defined bipolar disorder type I or II; Reference First, Spitzer, Gibbon and Williams16 euthymia was verified prospectively at baseline, 4 weeks later and on the date of MRI scan (scores of seven or less on both the 17-item Hamilton Rating Scale for Depression (HRSD) Reference Hamilton17 and Young Mania Rating Scale (YMRS) Reference Young, Biggs, Ziegler and Meyer18 with no subjective report of symptoms of mood disorder). Mood stability was confirmed by patients completing the Beck Depression Inventory (BDI) Reference Beck, Ward, Mendelson, Mock and Erbaugh19 and Altman Mania Rating Scale (AMRS) Reference Altman, Hedeker, Peterson and Davis20 weekly for 4 weeks prior to scanning. The control group were assessed with the AMRS and BDI 1 week prior to scanning and the HRSD and YMRS on the day of scanning. Psychiatric exclusion criteria were evidence of Axis I or II conditions other than bipolar disorder, intellectual disability, electroconvulsive therapy within 1 year of scan, evidence of cognitive impairment on the Mini-Mental State Examination (MMSE) Reference Folstein, Folstein and McHugh21 or substance/alcohol misuse in the previous 6 months. Cerebrovascular disease, neurodegenerative disorders, severe head injury, epilepsy, idiopathic Parkinson’s disease, systemic illness with cerebral consequences or the presence of focal neurological abnormalities led to exclusion as did hepatic disorders, cardiovascular disease, renal failure, hypertension (blood pressure >150/100 mmHg or antihypertensive medication), endocrine disorders (excluding corrected hypothyroidism) and corticosteroid medication. The control group were subject to the same exclusion criteria, but were also required to be medication-free with the exception of oral contraceptives, to have no current Axis I or II psychiatric diagnoses, psychiatric history or family history of psychiatric illness in first-degree relatives.
MRI acquisition
Image acquisition was with a General Electric Signa 1.5 Tesla scanner. Whole brain volume was acquired as 120 contiguous slices (thickness 1.7 mm) using a three-dimensional fast spoiled gradient recall (3D-FSPGR) T 1-weighted coronal sequence (repetition time (TR) = 12.4 ms, echo time (TE) = 4.2 ms, inversion time (TI) = 650 ms, number of excitations 1.0, matrix 256×192, flip angle 15° and field of view 20 cm×20 cm).
MRI analysis
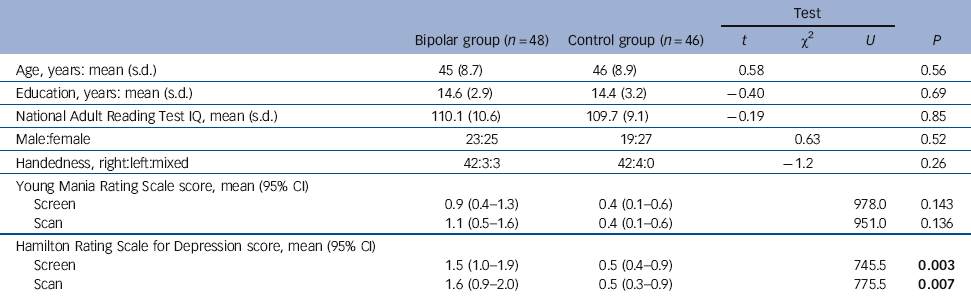
Corpus callosum area was measured by semi-automated segmentation of the midsagittal slice of the callosum using Analyze 4.0 on Windows with subsequent division of the callosum into subregions as defined by Witelson Reference Witelson22 (Fig. 1).
Callosal subregions illustrating geometric callosal divisions (after Witelson, 1989) Reference Witelson22 and central region of each area used for image intensity measurement.
ACC, anterior-most point of corpus callosum; PCC, posterior-most point of corpus callosum; G, point of anterior-most division defined by apex of inner curve of genu. Witelson areas: 1, rostrum; 2, genu; 3, rostral body; 4, anterior midbody; 5, posterior midbody; 6, isthmus; 7, spelnium.

Regions of interest were placed approximately centrally within the limits of each Witelson area to minimise partial volume effects at tissue boundaries (Fig. 1). T 1 image intensity for each region of interest and for all regions summed was compared between groups. Normalisation in previous work has been undertaken using vitreous humour T 1 signal intensity (VHI). Reference Brambilla, Nicoletti, Sassi, Mallinger, Frank and Keshavan4 There are few data to confirm the validity of this measure in terms of VHI consistency in relation to brain and thus results were considered for both raw data and with covariation for VHI to allow direct comparison with previous literature.
Callosal widths were generated using CALLMEA software, Reference Peters, Oeltze, Seminowicz, Steinmetz, Koeneke and Jancke23 with permission from the authors, operating under Matlab 6.1. Briefly, following segmentation of the callosal midsagittal slice, anatomically defined points are selected and used to divide the callosum into 99 percentile widths based on the technique of Denenberg et al: Reference Denenberg, Kertesz and Cowell24 a midline is constructed along the length of the callosum about which the sum of the percentile widths is the minimum possible (see Peters et al Reference Peters, Oeltze, Seminowicz, Steinmetz, Koeneke and Jancke23 for details). Percentile widths were analysed between groups to generate a profile of the corpus callosum.
Statistical analysis was carried out using SPSS v19 on Windows. Demographic variables were compared using independent sample t-tests (2-tailed) or χ2/Fisher’s exact test as appropriate. Normality of distribution (examination of Q-Q plots and Schapiro-Wilks test) was assessed and ANOVA or MANOVA were used as appropriate. Deviations from normal distribution were limited and infrequent and were tolerated within the analysis. The χ2/Fisher’s exact test were used for categorical variables. Pearson’s correlation coefficient (r) was used when data were confirmed as normally distributed, Spearman’s rank order coefficient (ρ) when this was not the case. Partial correlations were based on either r or ρ as appropriate. Results were considered significant at P⩽0.05 for between-group comparisons and at a more conservative level of P⩽0.01 for correlations. Bonferroni adjustments to significance levels were applied where appropriate. Formal correction for multiple comparisons was not undertaken for callosal widths because of the possibility of differences on any one measure being the result of a generalised effect, and differences in individual measures not being independent of one-another.
Results
One participant from each group had imaging data that were not of sufficient quality for the analyses presented here: thus, there were data available for 48 individuals in the bipolar group and 46 in the control group.
Reliability
Intrarater reliability (ten scans rated twice on different occasions) was high, with an intraclass correlation of α = 0.98 for callosal area, α = 0.99 for midsagittal intracranial area and a mean α = 1.0 (range 0.99-1.0) for callosal signal intensity. Mean α for callosal widths was 0.91 (range 0.69-0.99). All but 13 widths had values α⩾0.85, with 10 of the 13 widths with α<0.85 being consecutive and anterior (widths 4-13).
Demographic and clinical details
There was no significant between-group difference in age, years of education, premorbid IQ, gender ratio or handedness (Table 1). Groups did not differ on YMRS at screening or scanning. Score on the HRSD was significantly higher in patients than controls on both occasions; however, the magnitude of the difference was of approximately one unit and not of clinical significance.
The participants in the bipolar group showed little change in BDI or AMRS over the 4 weeks, indicating stability of mood. In fact a slight reduction in mean scores was observed from week 1 to week 4 (BDI week 1: 6.3, range 4.4-7.9, BDI week 4: 4.7, range 3.0-6.0; AMRS week 1: 3.4, range 2.2-4.2, AMRS week 4: 2.4, range 1.5-2.9). In the control group the BDI was 1.8 (range 1.3-2.7) and AMRS was 1.7 (range 1.5-2.6).
Illness characteristics of the bipolar group
The mean age at onset was 25.8 years (s.d. = 7, range 12-40). The mean total years of illness duration was 19.2 (s.d. = 10.1, range 1-39). The median number of manic episodes was 5 (range 1-98); the median number of depressive episodes was 6 (range 0-68), the median lifetime months of mania was 5 (range 1-121) and median lifetime months of depression was 16 (range 0-150).
Demographic and clinical detailsFootnote a
| Test | ||||||
|---|---|---|---|---|---|---|
| Bipolar group (n = 48) | Control group (n = 46) | t | χ2 | U | P | |
| Age, years: mean (s.d.) | 45 (8.7) | 46 (8.9) | 0.58 | 0.56 | ||
| Education, years: mean (s.d.) | 14.6 (2.9) | 14.4 (3.2) | −0.40 | 0.69 | ||
| National Adult Reading Test IQ, mean (s.d.) | 110.1 (10.6) | 109.7 (9.1) | −0.19 | 0.85 | ||
| Male:female | 23:25 | 19:27 | 0.63 | 0.52 | ||
| Handedness, right:left:mixed | 42:3:3 | 42:4:0 | −1.2 | 0.26 | ||
| Young Mania Rating Scale score, mean (95% CI) | ||||||
| Screen | 0.9 (0.4-1.3) | 0.4 (0.1-0.6) | 978.0 | 0.143 | ||
| Scan | 1.1 (0.5-1.6) | 0.4 (0.1-0.6) | 951.0 | 0.136 | ||
| Hamilton Rating Scale for Depression score, mean (95% CI) | ||||||
| Screen | 1.5 (1.0-1.9) | 0.5 (0.4-0.9) | 745.5 | 0.003 | ||
| Scan | 1.6 (0.9-2.0) | 0.5 (0.3-0.9) | 775.5 | 0.007 | ||
U, Mann-Whitney U-test.
a. Results in bold are significant.
Participants had no medication changes for at least 8 weeks prior to scanning. Two were medication-free, 19 were taking one medication only, 21 were taking two, 5 were taking three and 1 was taking four medications. A total of 43 were taking mood-stabilising/antipsychotic medication (32 lithium, 4 second-generation antipsychotics, 7 first-generation antipsychotics, 13 carbamazepine, 6 valproate, 5 lamotrigine, 1 gabapentin), 12 were taking antidepressants and 2 benzodiazepines. Twenty-four patients had received previous electroconvulsive therapy, all more than 3 years previously.
Imaging
Midsagittal intracranial area
For midsagittal intracranial area (Table 2) there was no interaction between gender and diagnostic group (F(1,90) = 2.5, P = 0.118). There was a main effect of gender (F = 39.2, P⩽0.001), men having a larger area than women, but no main effect of diagnostic group (F = 1.1, P = 0.291).
Callosal total midsagittal area
Callosal total midsagittal area correlated positively with intracranial midsagittal area (control group: r = 0.469, P= 0.001; bipolar group: r = 0.436, P = 0.002; all participants: ρ = 0.357, P<0.001). This was entered as a covariate in further analysis.
Callosal Witelson areas
For callosal Witelson areas, covarying for midsagittal intracranial area, no group×gender interaction was demonstrated for total callosal area or any subregion (P⩾0.101). There was a main effect of diagnostic group on area for the whole corpus callosum and for subregions 1, 2, 5, 6 and 7, areas being smaller in the bipolar group than in the control group. There was no main effect of gender (Table 3). Inclusion of HRSD scores as an additional covariate did not affect this pattern of results, leading to only minimal alterations in P-values.
In the bipolar group no significant correlation of total callosal area (controlling for midsagittal intracranial area) was found with number of manic, depressive or total illness episodes. Age did not correlate with total area or any subregional area of the callosum in the bipolar group. In controls, by contrast, age correlated negatively and significantly at the P=0.01 level with total callosal area (partial correlation –0.39, P = 0.009) and areas 2 (partial correlation –0.46, P = 0.002) and 4 (partial correlation –0.40, P = 0.007).
Total midsagittal intracranial area and callosal area measurements
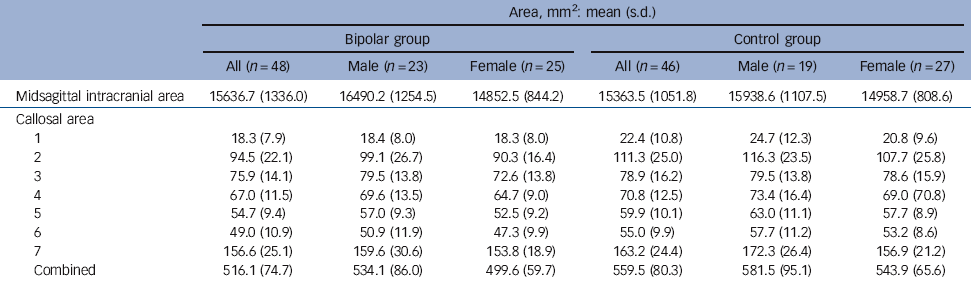
| Area, mm2: mean (s.d.) | ||||||
|---|---|---|---|---|---|---|
| Bipolar group | Control group | |||||
| All (n = 48) | Male (n = 23) | Female (n = 25) | All (n = 46) | Male (n = 19) | Female (n = 27) | |
| Midsagittal intracranial area | 15636.7 (1336.0) | 16490.2 (1254.5) | 14852.5 (844.2) | 15363.5 (1051.8) | 15938.6 (1107.5) | 14958.7 (808.6) |
| Callosal area | ||||||
| 1 | 18.3 (7.9) | 18.4 (8.0) | 18.3 (8.0) | 22.4 (10.8) | 24.7 (12.3) | 20.8 (9.6) |
| 2 | 94.5 (22.1) | 99.1 (26.7) | 90.3 (16.4) | 111.3 (25.0) | 116.3 (23.5) | 107.7 (25.8) |
| 3 | 75.9 (14.1) | 79.5 (13.8) | 72.6 (13.8) | 78.9 (16.2) | 79.5 (13.8) | 78.6 (15.9) |
| 4 | 67.0 (11.5) | 69.6 (13.5) | 64.7 (9.0) | 70.8 (12.5) | 73.4 (16.4) | 69.0 (70.8) |
| 5 | 54.7 (9.4) | 57.0 (9.3) | 52.5 (9.2) | 59.9 (10.1) | 63.0 (11.1) | 57.7 (8.9) |
| 6 | 49.0 (10.9) | 50.9 (11.9) | 47.3 (9.9) | 55.0 (9.9) | 57.7 (11.2) | 53.2 (8.6) |
| 7 | 156.6 (25.1) | 159.6 (30.6) | 153.8 (18.9) | 163.2 (24.4) | 172.3 (26.4) | 156.9 (21.2) |
| Combined | 516.1 (74.7) | 534.1 (86.0) | 499.6 (59.7) | 559.5 (80.3) | 581.5 (95.1) | 543.9 (65.6) |
Analysis of callosal areas covarying for midsagittal intracranial areaFootnote a
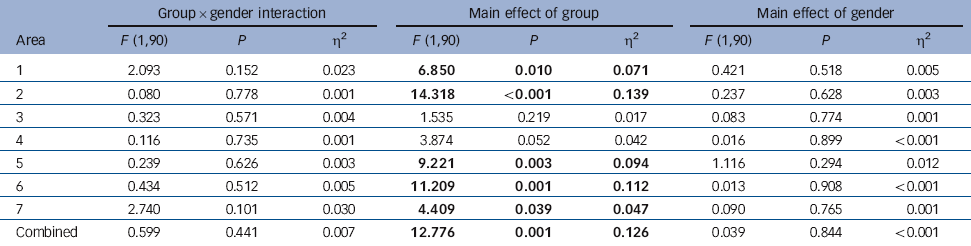
| Group×gender interaction | Main effect of group | Main effect of gender | |||||||
|---|---|---|---|---|---|---|---|---|---|
| Area | F (1,90) | P | η2 | F (1,90) | P | η2 | F (1,90) | P | η2 |
| 1 | 2.093 | 0.152 | 0.023 | 6.850 | 0.010 | 0.071 | 0.421 | 0.518 | 0.005 |
| 2 | 0.080 | 0.778 | 0.001 | 14.318 | <0.001 | 0.139 | 0.237 | 0.628 | 0.003 |
| 3 | 0.323 | 0.571 | 0.004 | 1.535 | 0.219 | 0.017 | 0.083 | 0.774 | 0.001 |
| 4 | 0.116 | 0.735 | 0.001 | 3.874 | 0.052 | 0.042 | 0.016 | 0.899 | <0.001 |
| 5 | 0.239 | 0.626 | 0.003 | 9.221 | 0.003 | 0.094 | 1.116 | 0.294 | 0.012 |
| 6 | 0.434 | 0.512 | 0.005 | 11.209 | 0.001 | 0.112 | 0.013 | 0.908 | <0.001 |
| 7 | 2.740 | 0.101 | 0.030 | 4.409 | 0.039 | 0.047 | 0.090 | 0.765 | 0.001 |
| Combined | 0.599 | 0.441 | 0.007 | 12.776 | 0.001 | 0.126 | 0.039 | 0.844 | <0.001 |
a. Results in bold are significant.
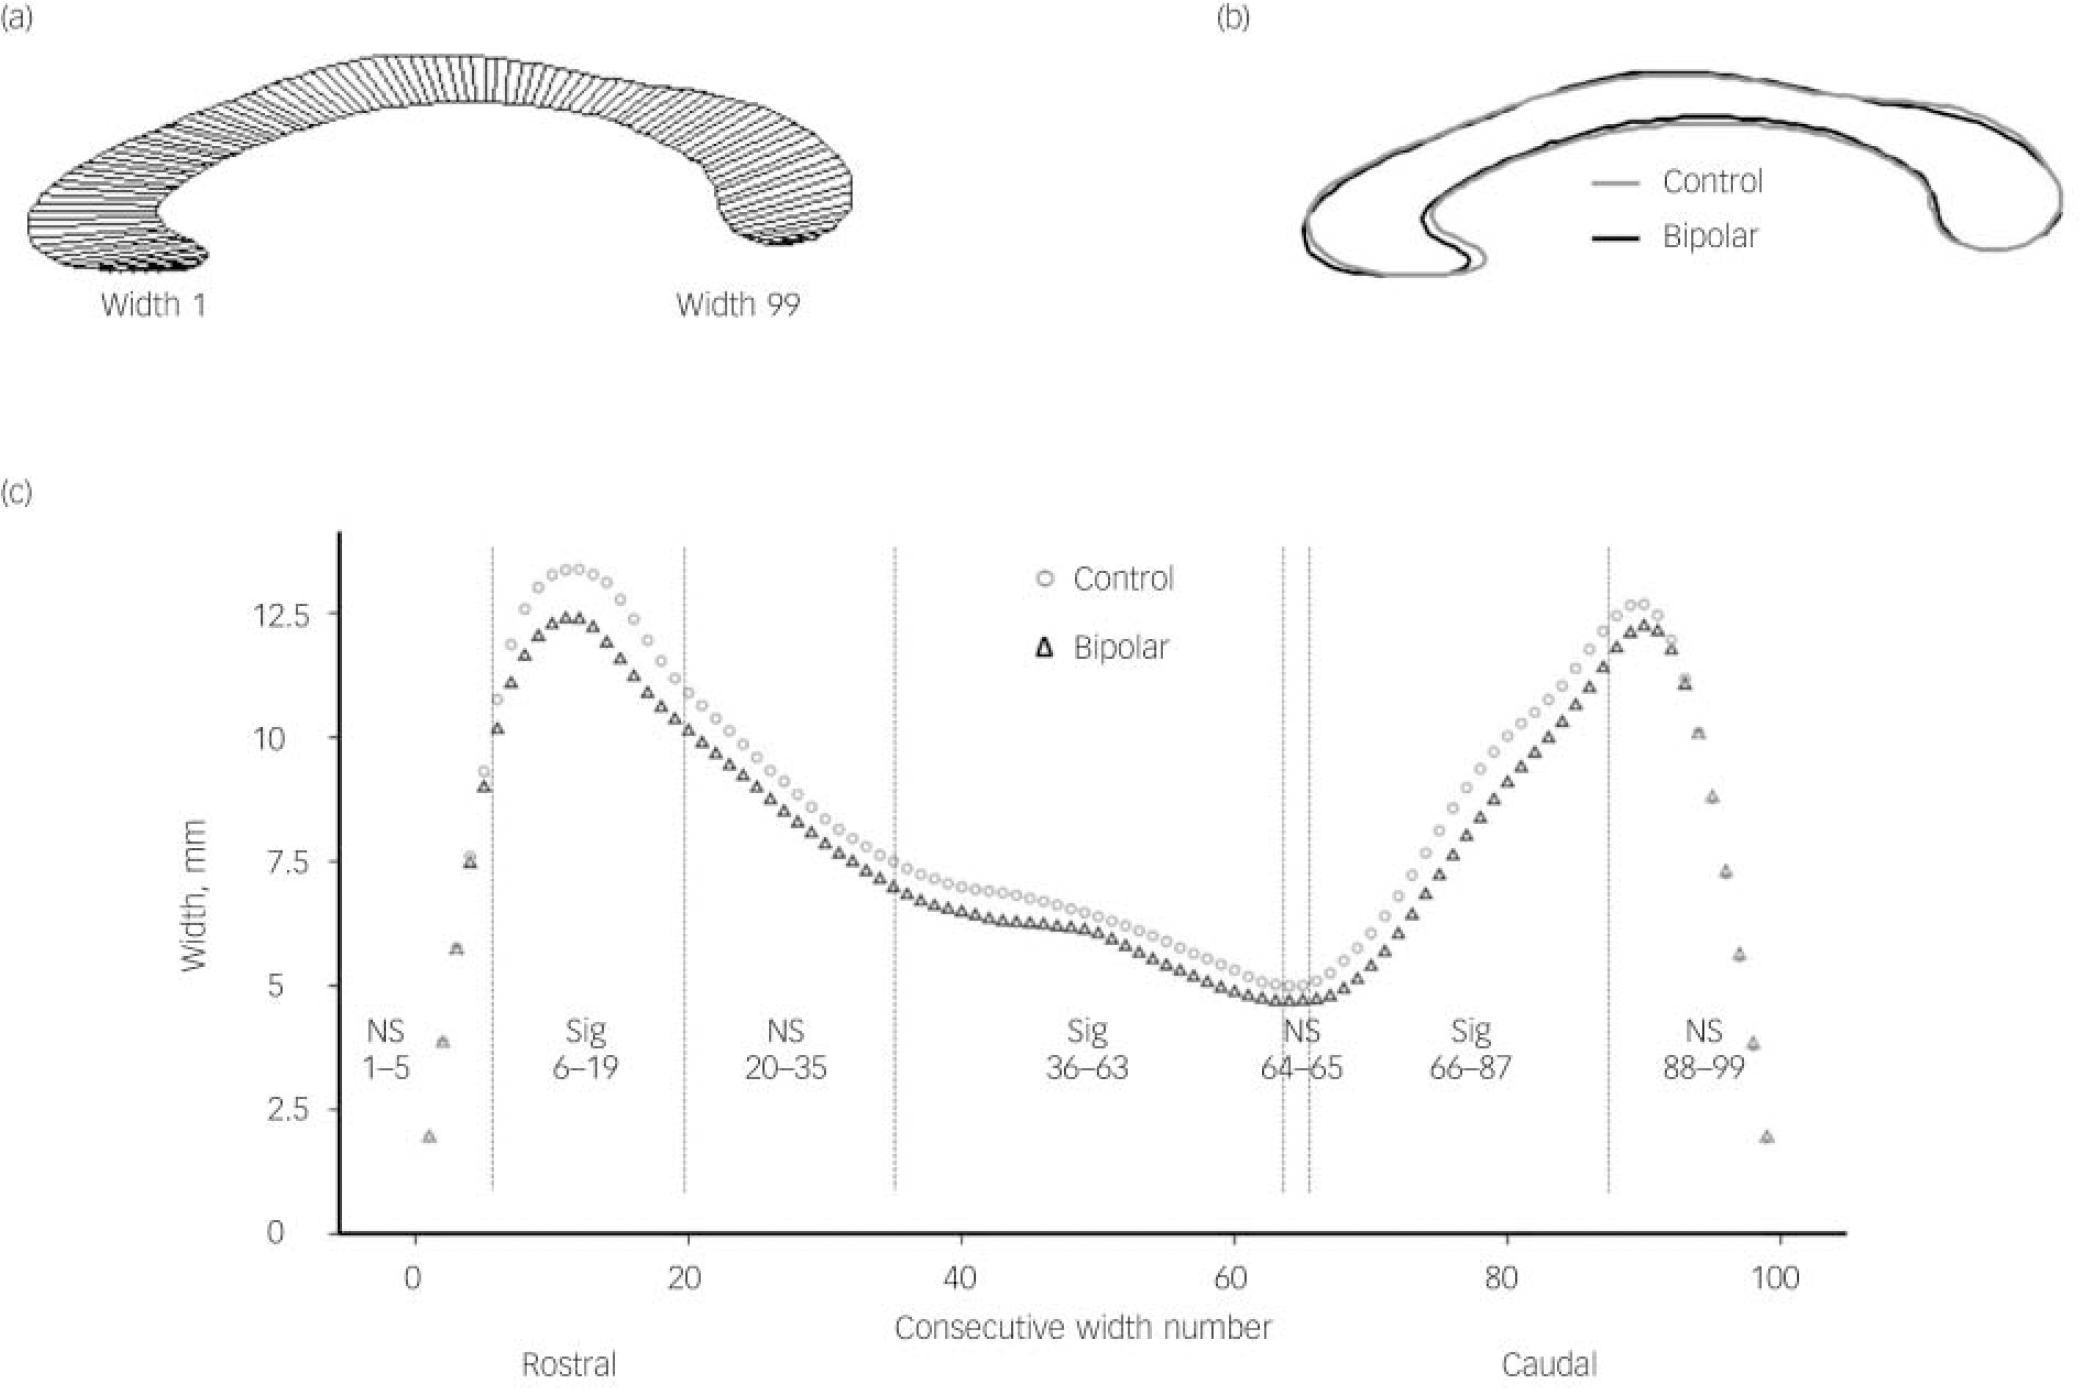
Callosal Denenberg widths
The profiles of the averaged callosa for each group are illustrated in Fig. 2 as superimposed callosal outlines (Fig. 2(b)) and as graphed profiles showing each of the 99 widths (Fig. 2(c)). The width of the corpus callosum was significantly reduced (P⩽0.05) for widths in the ranges 6-19 (approximating to genu), 36-63 (midbody) and 66-87 (isthmus and splenuim). No significant difference was detected in widths 1-5 (rostral-most rostrum), 20-35 (rostral body), 64-65 (isthmus) and 88-99 (caudal splenium). Full data are included in online Table DS1.
Callosal T 1 image intensities
Correlation in signal intensity was positive between corpus callosum and vitreous humour (control group: r = 0.481, P = 0.001; bipolar group: r = 0.348, P = 0.015; all participants: r = 0.446, P<0.001).
The T 1 image intensity was numerically lower in the bipolar group (mean 82, s.d. = 9.8) than in the control group (mean 87, s.d. = 13.2) for the whole corpus callosum and for all individual areas (Table 4). This difference was statistically significant for raw data for area 1 (F = 4.928, P = 0.029) and area 4 (F = 4.082, P = 0.046) but with covariation for VHI all comparisons became non-significant (F<2.69, P>0.10).
There was a significant group×gender interaction for raw signal intensity for area 1 (F = 5.3, P = 0.024), area 2 (F = 4.0, P = 0.048) and area 4 (F = 0.039, P = 0.034). When VHI was entered as a covariate, the interaction remained significant in area 1 (F = 4.4, P = 0.038) but with area 2 (F = 3.0, P = 0.085) and area 4 (F = 3.9, P = 0.051) having only a trend towards significance. Adding HRSD as an additional covariate resulted in marginal reductions in P-values, with area 7 becoming significant for raw data (F = 4.4 P = 0.038) and, following correction for VHI, area 4 remaining significant (F = 4.4 P = 0.039) and area 7 just reaching significance also (F = 3.9 P = 0.05). These data were further investigated with a simple main effects model: men had significantly lower signal intensity than women in both diagnostic groups (Table 5). Interestingly, although there was no significant effect of diagnosis on callosal signal intensity in men, women with bipolar disorder had significantly lower signal intensity than women in the control group across all areas. Entering VHI as a covariate made little difference to this pattern of results, although some reduction in significance level was observed (Table 5). The inclusion of HRSD scores as an additional covariate resulted in minor changes only in P-values, with no alteration to the pattern of significance of results.
There was no correlation between age and T 1 signal intensity in either group. In the bipolar group there was no correlation of signal intensity with number of manic episodes, depressive episodes, total number of illness episodes or illness duration.
Lithium use
A total of 32 patients were taking lithium, 16 were not. Covarying for midsagittal intracranial area, callosal areas were smaller in lithium-treated than in lithium-free patients in area 1 (lithium: mean 16.6 mm2 (s.d. = 7.5), non-lithium: mean 21.8 mm2 (s.d. = 7.7), F= 4.8, P= 0.034) and area 2 (lithium: mean 88.7 mm2 (s.d. = 19.5), non-lithium: mean 106.2 mm2 (s.d. = 23.1), F = 8.1, P = 0.007) but in no other subregion or in the callosum as a whole (P⩾0.123). Corpus callosum signal intensity showed little evidence of difference between patients taking lithium and those who were not for any area for either raw data (P⩾0.70) or with covariation for VHI (P⩾0.111). Neither VHI nor midsagittal intracranial area differed significantly between lithium and non-lithium-treated subgroups (P = 0.377 and P = 0.763 respectively). The proportion of patients taking lithium did not differ significantly between men (15/23, 65%) and women (18/26, 69%; χ2 = 0.089, P = 0.765).
Profile of averaged corpus callosum and measured callosal widths in the control and bipolar groups.
(a) Averaged callosal profile illustrating position of widths (control group); (b) superimposed profiles of averaged callosa of bipolar and control groups; (c) plots of callosal widths 1-99 for bipolar and control groups. NS, non-significant difference between widths in range specified; Sig, significant difference between widths in range specified. Vertical lines on chart indicate boundaries of significant/non-significant width ranges.
Discussion
These data show that callosal size was reduced in people with bipolar disorder compared with controls on both Witelson areas and Denenberg widths as predicted and consistent with previous literature. Reference Atmaca, Ozdemir and Yildirim2,Reference Walterfang, Wood, Barton, Velakoulis, Chen and Reutens9-Reference Walterfang, Malhi, Wood, Reutens, Chen and Barton11 The greatest (moderate) effect sizes were in area 2 (genu) Cohen’s d = –0.7, area 5 (posterior midbody) d = –0.5 and area 6 (isthmus) d = –0.6; these findings withstand Bonferroni correction (P⩽0.007).
Group mean values for signal intensity
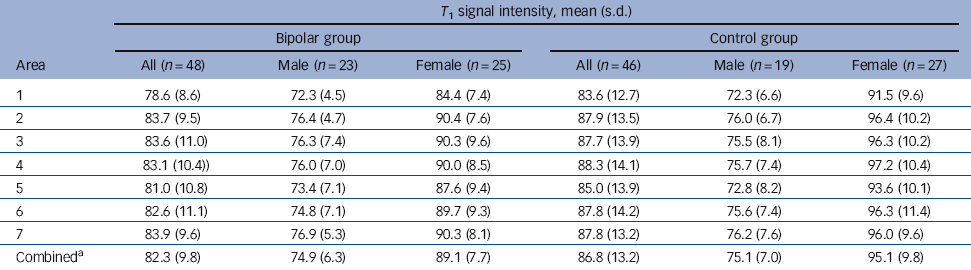
| T 1 signal intensity, mean (s.d.) | ||||||
|---|---|---|---|---|---|---|
| Bipolar group | Control group | |||||
| Area | All (n = 48) | Male (n = 23) | Female (n = 25) | All (n = 46) | Male (n = 19) | Female (n = 27) |
| 1 | 78.6 (8.6) | 72.3 (4.5) | 84.4 (7.4) | 83.6 (12.7) | 72.3 (6.6) | 91.5 (9.6) |
| 2 | 83.7 (9.5) | 76.4 (4.7) | 90.4 (7.6) | 87.9 (13.5) | 76.0 (6.7) | 96.4 (10.2) |
| 3 | 83.6 (11.0) | 76.3 (7.4) | 90.3 (9.6) | 87.7 (13.9) | 75.5 (8.1) | 96.3 (10.2) |
| 4 | 83.1 (10.4)) | 76.0 (7.0) | 90.0 (8.5) | 88.3 (14.1) | 75.7 (7.4) | 97.2 (10.4) |
| 5 | 81.0 (10.8) | 73.4 (7.1) | 87.6 (9.4) | 85.0 (13.9) | 72.8 (8.2) | 93.6 (10.1) |
| 6 | 82.6 (11.1) | 74.8 (7.1) | 89.7 (9.3) | 87.8 (14.2) | 75.6 (7.4) | 96.3 (11.4) |
| 7 | 83.9 (9.6) | 76.9 (5.3) | 90.3 (8.1) | 87.8 (13.2) | 76.2 (7.6) | 96.0 (9.6) |
| CombinedFootnote a | 82.3 (9.8) | 74.9 (6.3) | 89.1 (7.7) | 86.8 (13.2) | 75.1 (7.0) | 95.1 (9.8) |
a. All callosal subregions combined.
The greatest absolute differences in callosal widths approximate to the most robust differences in Witleson areas (areas 2, 5 and 6), both of these findings being consistent with those of other studies and suggesting that parts of the corpus callosum that connect with prefrontal and temporal/parietal cortex are those most affected by bipolar disorder.
The negative correlation of areas with age in our controls and in previous healthy samples Reference Brambilla, Nicoletti, Sassi, Mallinger, Frank and Kupfer10,Reference Woodruff, Phillips, Rushe, Wright, Murray and David25 was not present in the bipolar group, consistent with an illness-related process having greater impact on callosal structure relatively early in the disorder and masking the effect of normal ageing. Brambilla et al also describe the relationship between callosal size and age being lost in adults with bipolar disorder; Reference Brambilla, Nicoletti, Sassi, Mallinger, Frank and Kupfer10 Walterfang et al found no relationship between callosal measurements and age in patients with bipolar disorder or controls in one study Reference Walterfang, Malhi, Wood, Reutens, Chen and Barton11 but a reduction in thickness in a section of the anterior body with increasing age in participants with bipolar disorder (but not controls) in another. Reference Walterfang, Wood, Barton, Velakoulis, Chen and Reutens9
Simple main effect comparisons for signal intensityFootnote a
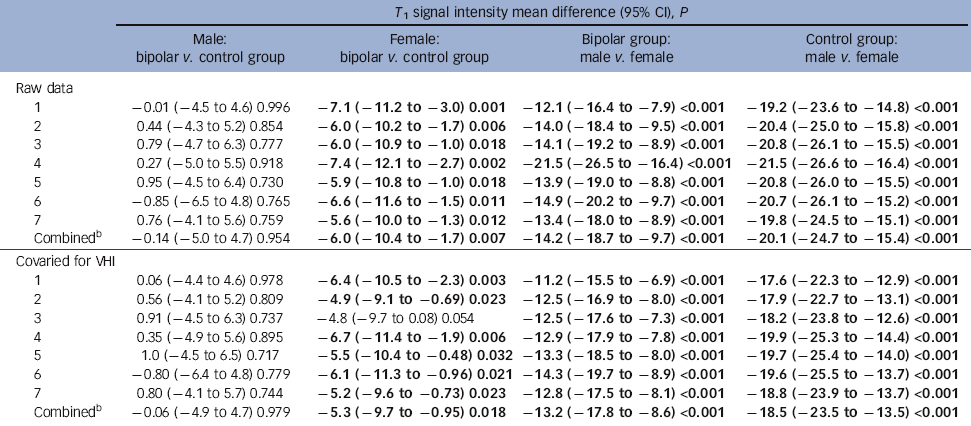
| T 1 signal intensity mean difference (95% CI), P | ||||
|---|---|---|---|---|
| Male: bipolar v. control group |
Female: bipolar v. control group |
Bipolar group: male v. female |
Control group: male v. female |
|
| Raw data | ||||
| 1 | −0.01 (−4.5 to 4.6) 0.996 | −7.1 (−11.2 to −3.0) 0.001 | −12.1 (−16.4 to −7.9) <0.001 | −19.2 (−23.6 to −14.8) <0.001 |
| 2 | 0.44 (−4.3 to 5.2) 0.854 | −6.0 (−10.2 to −1.7) 0.006 | −14.0 (−18.4 to −9.5) <0.001 | −20.4 (−25.0 to −15.8) <0.001 |
| 3 | 0.79 (−4.7 to 6.3) 0.777 | −6.0 (−10.9 to −1.0) 0.018 | −14.1 (−19.2 to −8.9) <0.001 | −20.8 (−26.1 to −15.5) <0.001 |
| 4 | 0.27 (−5.0 to 5.5) 0.918 | −7.4 (−12.1 to −2.7) 0.002 | −21.5 (−26.5 to −16.4) <0.001 | −21.5 (−26.6 to −16.4) <0.001 |
| 5 | 0.95 (−4.5 to 6.4) 0.730 | −5.9 (−10.8 to −1.0) 0.018 | −13.9 (−19.0 to −8.8) <0.001 | −20.8 (−26.0 to −15.5) <0.001 |
| 6 | −0.85 (−6.5 to 4.8) 0.765 | −6.6 (−11.6 to −1.5) 0.011 | −14.9 (−20.2 to −9.7) <0.001 | −20.7 (−26.1 to −15.2) <0.001 |
| 7 | 0.76 (−4.1 to 5.6) 0.759 | −5.6 (−10.0 to −1.3) 0.012 | −13.4 (−18.0 to −8.9) <0.001 | −19.8 (−24.5 to −15.1) <0.001 |
| CombinedFootnote b | −0.14 (−5.0 to 4.7) 0.954 | −6.0 (−10.4 to −1.7) 0.007 | −14.2 (−18.7 to −9.7) <0.001 | −20.1 (−24.7 to −15.4) <0.001 |
| Covaried for VHI | ||||
| 1 | 0.06 (−4.4 to 4.6) 0.978 | −6.4 (−10.5 to −2.3) 0.003 | −11.2 (−15.5 to −6.9) <0.001 | −17.6 (−22.3 to −12.9) <0.001 |
| 2 | 0.56 (−4.1 to 5.2) 0.809 | −4.9 (−9.1 to −0.69) 0.023 | −12.5 (−16.9 to −8.0) <0.001 | −17.9 (−22.7 to −13.1) <0.001 |
| 3 | 0.91 (−4.5 to 6.3) 0.737 | −4.8 (−9.7 to 0.08) 0.054 | −12.5 (−17.6 to −7.3) <0.001 | −18.2 (−23.8 to −12.6) <0.001 |
| 4 | 0.35 (−4.9 to 5.6) 0.895 | −6.7 (−11.4 to −1.9) 0.006 | −12.9 (−17.9 to −7.8) <0.001 | −19.9 (−25.3 to −14.4) <0.001 |
| 5 | 1.0 (−4.5 to 6.5) 0.717 | −5.5 (−10.4 to −0.48) 0.032 | −13.3 (−18.5 to −8.0) <0.001 | −19.7 (−25.4 to −14.0) <0.001 |
| 6 | −0.80 (−6.4 to 4.8) 0.779 | −6.1 (−11.3 to −0.96) 0.021 | −14.3 (−19.7 to −8.9) <0.001 | −19.6 (−25.5 to −13.7) <0.001 |
| 7 | 0.80 (−4.1 to 5.7) 0.744 | −5.2 (−9.6 to −0.73) 0.023 | −12.8 (−17.5 to −8.1) <0.001 | −18.8 (−23.9 to −13.7) <0.001 |
| CombinedFootnote b | −0.06 (−4.9 to 4.7) 0.979 | −5.3 (−9.7 to −0.95) 0.018 | −13.2 (−17.8 to −8.6) <0.001 | −18.5 (−23.5 to −13.5) <0.001 |
VHI, vitreous humour T 1 signal intensity
a. Results in bold are significant.
b. All callosal subregions combined.
Relationship to maturation
Callosal midbody and posterior areas appear to reduce with increasing age in children and adolescents with bipolar disorder but, in contrast to studies in adults, the anterior regions do not. Reference Lopez-Larson, Breeze, Kennedy, Hodge, Tang and Moore8 This difference, plus the absence in the bipolar group of what appears to be a normal age-related reduction in callosal size in adulthood, suggests callosal maturational abnormalities in bipolar disorder.
In adolescents, callosal signal intensity reduces with increasing age in controls Reference Keshavan, Diwadkar, DeBellis, Dick, Kotwal and Rosenberg1 but this effect appears to be lost in individuals with bipolar disorder who also show reduced signal intensity compared with controls. Reference Caetano, Silveira, Kaur, Nicoletti, Hatch and Brambilla26 In neither the current nor the previous study in adults Reference Brambilla, Nicoletti, Sassi, Mallinger, Frank and Keshavan4 did signal intensity correlate with age in either patients or controls. This suggests that in childhood-onset bipolar disorder normal maturational changes - potentially myelination - are overridden by the effect of the illness, and that in adults signal intensity changes are the result of mechanisms other than ageing.
Evidence that changes of this nature occur in bipolar disorder during a phase of ongoing neural maturation is consistent with observations that outcomes in this illness, particularly in terms of cognitive function and the effects of this on function more broadly, are often worse with greater illness exposure. Reference Robinson and Ferrier6 It also follows that earlier (for example adolescent) onset might have a greater impact on outcome because of a greater interference with normal development.
Relationship to gender
The lack of between-gender difference in areas in the control or bipolar group is in keeping with the finding that gender accounts for only 1-2% of variance in raw callosal size and has no impact when brain size is taken into account, Reference Bishop and Wahlsten27 thus our participants do not have an unexpected gender-related change in gross callosal anatomy.
The lack of difference in signal intensity between diagnostic groups in men and the contrast with women where signal intensity was lower in the bipolar group across the corpus callosum suggests that an additional change may be present in the corpus callosum of women with bipolar disorder - possible mechanisms are discussed below.
Signal intensity
Limited intensity differences present in raw data were lost with covariation for VHI. This contrasts with Brambilla et al, who found reduced signal intensity in participants with bipolar disorder in all areas of the corpus callosum. Reference Brambilla, Nicoletti, Sassi, Mallinger, Frank and Keshavan4 Our groups were matched for age and gender and Brambilla et al covaried for these factors, however differences between the studies may be relevant when comparing results: (a) our patients were all euthymic, whereas Brambilla et al’s were in a variety of illness phases; (b) our bipolar group were almost all taking medication, with a number taking combined medications, whereas 11 of 29 in Brambilla et al’s study had been medication-free for 2 weeks, the remainder being on lithium monotherapy; (c) mean participant age was almost 10 years older in the current study. Both studies are similar in finding no relationship between T 1 signal intensity and clinical variables in the patient group.
Reduced T 1 signal intensity may reflect myelin reduction. Diffusion tensor MRI studies of bipolar disorder in adults and children indicate decreases in fractional anisotropy and/or increases in apparent diffusion coefficient and mean diffusivity in the corpus callosum and other, particularly dorsolateral prefrontal, white matter tracts Reference Yurgelun-Todd, Silveri, Gruber, Rohan and Pimentel3,Reference Macritchie, Lloyd, Bastin, Vasudev, Gallagher and Eyre13,Reference Versace, Almeida, Hassel, Walsh, Novelli and Klein28,Reference McIntosh, Munoz, Lymer, McKirdy, Hall and Sussmann29 consistent with microstructural changes that may include altered neuronal number, size or myelination, or changes in the supporting glial structure. Neuropathological evidence remains limited in bipolar disorder, but includes evidence of glial reduction in anterior cingulate cortex regions Reference Ongur, Drevets and Price30,Reference Benes and Berretta31 and myelin pallor in dorsolateral prefrontal deep white matter. Reference Regenold, Phatak, Marano, Gearhart, Viens and Hisley32
Effects of lithium
Our data suggest that lithium use may be related to reduced callosal area anteriorly but without evidence of altered signal intensity. Previous studies have mostly described no effect of lithium on white matter volumes in general Reference Bearden, Thompson, Dalwani, Hayashi, Lee and Nicoletti33-Reference Cousins35 and Brambilla et al Reference Brambilla, Nicoletti, Sassi, Mallinger, Frank and Kupfer10 found no correlation between callosal area and lithium dose or duration. Our patients were established on lithium prior to this study and it may be that the participants on lithium had different illness characteristics to those not taking it, rather than lithium being causative of the observed difference. A definitive conclusion cannot be drawn in this regard as clinical parameters tested did not differ between the lithium and non-lithium groups, but neither can the presence of more subtle subgroup differences be excluded. Lithium reduces MRI T 1 and hence increases signal intensity in grey matter Reference Cousins35,Reference Rangel-Guerra, Perez-Payan, Minkoff and Todd36 but a similar effect in white matter is not reported. Reference Cousins35 It would be predicted from this that any tissue misclassification would result in non-white matter tissues of increased intensity erroneously increasing the size of the corpus callosum. Use of the midsagittal callosal section, bounded mostly by cerebrospinal fluid, minimises this risk and furthermore callosal size in patients treated with lithium was smaller than in those who were lithium-free, not larger, indicating that an error of this type is unlikely to account for our findings.
The lack of signal intensity difference with lithium use is consistent with the limited data available that suggest that lithium does not significantly reduce T 1 in white matter. Reference Cousins35 This, combined with the close matching of the proportion taking lithium in both the male and female patient groups, indicates that lithium again is unlikely to account for the finding of reduced signal intensity in the female participants with bipolar disorder compared with the controls, and the contrasting absence of this in male patients.
Strengths and limitations
Strengths of the current study were good sample numbers, the prospective definition of euthymia in the patients with bipolar disorder and reliability of callosal measures. Although the HRSD score differed statistically significantly between groups this reflects the limited range of scores as defined by inclusion criteria; the actual numerical difference being of approximately one unit, which is not of clinical significance. This is reflected in the minimal effect that inclusion of HRSD as a covariate had on the results. Groups were well matched on potential confounders of age, gender, handedness and educational attainment.
Limitations to be considered are that inclusion of a small number of participants with bipolar II disorder may have reduced sample homogeneity. Segmentation was not fully automated but reliability was very good. Patients were taking a variety of different medications which are difficult to control for in a meaningful way in analyses, although it was possible to consider groups on and off lithium. Estimation of clinical variables was from history and by review of available notes but without systematic chart review methodology. The lack of any strong correlation with these variables thus needs to be considered with caution. The number of episodes was used for analysis rather than total duration of time in either pole of illness: number of episodes being a more robust estimate using the above method than time in illness state, which would appear superficially precise but would have a potentially significant measurement error of uncertain magnitude.
Possible mechanisms
Callosal abnormalities in bipolar disorder appear to be disease-related rather than a marker of a predisposition to illness: twin studies show altered callosal morphology in adult probands with bipolar disorder but not their co-twins. Reference Bearden, van, Dutton, Boyle, Madsen and Luders37 There are conflicting data with regard to first-episode bipolar disorder, with an absence of callosal change being reported in patients with psychotic bipolar disorder (who had unclear medication status, were between 16 and 30 years of age and had mean illness duration of approximately 1 month) Reference Walterfang, Wood, Reutens, Wood, Chen and Velakoulis38 and both generalised and subregional size reductions being reported in slightly older but treatment-naive participants with bipolar disorder with mean illness length of 3 months. Reference Yurgelun-Todd, Silveri, Gruber, Rohan and Pimentel3 In both adults and children with established bipolar disorder, by contrast, callosal changes are consistently defined (paediatric patients with bipolar disorder in Caetano et al Reference Caetano, Silveira, Kaur, Nicoletti, Hatch and Brambilla26 had a mean illness duration of 3.9 years). These studies suggest that callosal size changes may not be present at the immediate onset of illness but that they may become apparent in the first few weeks following presentation. Once established, the corpus callosum abnormalities appear fixed and not mood-state-related as the participants in the current study were euthymic for a minimum of 4 weeks and, in many cases, much longer. Similarly, callosal size reduction was found in the one other study that considered remitted pateints. Reference Walterfang, Wood, Barton, Velakoulis, Chen and Reutens9 The morphometric and signal intensity data from this and other studies provide evidence for gender differences in nature and/or degree of callosal abnormalities in bipolar disorder, which, given the role of the callosum as the main inter-hemispheric pathway, may be relevant to other gender-related abnormal findings such as brain asymmetry that has been described previously in these participants Reference Mackay, Roddick, Barrick, Lloyd, Roberts and Crow39 but as yet without evidence of a causal relationship. Given the convergence of evidence of reduced callosal size, reduced T 1 signal intensity, altered diffusion tensor imaging findings and limited but consistent neuropathological data, it appears reasonable to consider altered callosal myelination as a candidate pathology occurring relatively early after the onset of bipolar disorder. It appears also that there may be a differential effect of gender superimposed on the broader diagnosis-dependent changes.
A candidate mechanism for gender differences may be the effect of sex hormones, which are important in developmental myelination, re-myelination following an insult and differentiation of oligodendrocytes from their precursors. These processes are in part dependent on local neuronal autocrine production of progestogen, on circulating gonadal and adrenal progestogen and on its metabolite allopregnanolone (see Schumacher et al Reference Schumacher, Hussain, Gago, Oudinet, Mattern and Ghoumari40 for a review). If differences in myelination do account for our observed reduction in callosal signal intensity in women with bipolar disorder, which is absent in men with bipolar disorder, it may be that differences in progestogen exposure have a role to play in addition to other mechanisms that lead to structural callosal changes in both genders. This underlying and generalised gender difference is consistent with observations of reduced signal intensity in healthy women compared with men. The data from this study are limited in the extent to which they allow these hypotheses to be developed, but suggest that further exploration of this area may be worthwhile.
Ideally, longitudinal studies of callosal structure and function are needed to track progression of changes between adolescence and adulthood and between episodes of acute illness and euthymia, particularly given the evidence that abnormalities appear to be consequent on, rather than predictors of, illness. In the absence of longitudinal studies there may be merit in comparing callosal changes between adults who have had onset of illness before and following completion of callosal myelination in the mid-20s with combined structural, diffusion and functional imaging modalities.
Acknowledgements
Dr Patti Cowell (University of Sheffield) for supplying CALLMEA; Dr Steffen Oeltze (University of Magdeburg) and Dr Michael Peters (University of Guelph) for permission to use the software.


eLetters
No eLetters have been published for this article.