

1. INTRODUCTION
Discharge of ice from tidewater glaciers is a major contributor to sea-level rise (Gardner and others, Reference Gardner2013; Enderlin and others, Reference Enderlin2014). Predictions of future mass loss depend critically on reliable calving laws for ice-sheet models, but those currently in use are based on simplified physics and do not reflect the diversity of calving processes (Benn and others, Reference Benn, Warren and Mottram2007a; James and others, Reference James, Murray, Selmes, Scharrer and O'Leary2014; Truffer and Motyka, Reference Truffer and Motyka2016). To be effective, calving laws must be grounded in a sound understanding of how calving actually works. In this paper, we conduct a systematic investigation of calving processes and their controls, using the Helsinki Discrete Element Model (HiDEM: Åström and others, Reference Åström2013) to simulate fracturing and the finite element model Elmer/Ice (Gagliardini and others, Reference Gagliardini2013; Todd and Christoffersen, Reference Todd and Christoffersen2014) to analyze dynamic processes and stress conditions associated with calving events. The combination of HiDEM and Elmer/Ice allows us to establish a unified framework for understanding the spectrum of calving processes, and to develop new strategies for formulating reliable calving laws.
2. CALVING LAWS AND CALVING PROCESSES
The current generation of calving laws can be divided into two broad categories: (1) those that predict calving rates using empirically tuned strain rate or stress criteria (e.g. Levermann and others, Reference Levermann2012; Morlighem and others, Reference Morlighem2016); and (2) those that predict calving position from the penetration depth of surface and basal crevasses, calculated from stress, water pressure and ice geometry (e.g. Benn and others, Reference Benn, Hulton and Mottram2007b; Nick and others, Reference Nick, van der Veen, Vieli and Benn2010; Krug and others, Reference Krug, Weiss, Gagliardini and Durand2014). The latter have been used to predict the future sea-level contribution from major Greenland outlet glaciers (Church and others, Reference Church and Stocker2013; Nick and others, Reference Nick2013), and variants of the crevasse-depth approach have been used in numerous other studies (e.g. Otero and others, Reference Otero, Navarro, Martin, Cuadrado and Corcuera2010; Enderlin and others, Reference Enderlin, Howat and Vieli2013; Cook and others, Reference Cook2014; Krug and others, Reference Krug, Weiss, Gagliardini and Durand2014; Lea and others, Reference Lea2014; Todd and Christoffersen, Reference Todd and Christoffersen2014; Pollard and others, Reference Pollard, DeConto and Alley2015).
Crevasse-depth laws have a more solid physical basis than empirical calving rate laws but, as currently formulated, they have a number of shortcomings that limit their usefulness. Most fundamentally, they are based on the assumption that calving occurs in response to longitudinal stretching (Benn and others, Reference Benn, Warren and Mottram2007a). Although this process undoubtedly contributes to some calving events (Joughin and others, Reference Joughin2008; Walter and others, Reference Walter2010), calving from tidewater glaciers typically involves other processes. For example, numerous recent studies have demonstrated that melt under-cutting is an important driver of tidewater glacier calving (e.g. Motyka and others, Reference Motyka, Dryer, Amundson, Truffer and Fahnestock2013; Luckman and others, Reference Luckman2015; Rignot and others, Reference Rignot, Fenty, Xu, Cai and Kemp2015; Truffer and Motyka, Reference Truffer and Motyka2016). Melting at or below the waterline undercuts the glacier terminus, triggering collapse of the upper overhanging part. Melt under-cutting is facilitated by plumes of buoyant meltwater emerging from below glaciers, which entrain warm sea water and bring it into contact with the submerged ice front (Cowton and others, Reference Cowton, Slater, Sole, Goldberg and Nienow2015). Under-cutting rates are a function of sea-water temperatures, meltwater discharge and plume geometry (Jenkins, Reference Jenkins2011; Slater and others, Reference Slater, Nienow, Cowton, Goldberg and Sole2015), but relationships between under-cutting rates and calving remain uncertain. Modelling studies by O'Leary and Christoffersen (Reference O'Leary and Christoffersen2013) suggested that calving lengths (measured up-glacier from the front) may be ~2–4 times subaqueous undercut lengths due to stress migration effects. This ‘calving multiplier effect’ implies that long-term calving rates may be several times greater than subaqueous melt rates, although this remains untested against observations.
Calving can also occur in response to net upward-directed buoyant forces on glacier tongues. Buoyancy-driven calving was first described for lake-calving glaciers, where rapid surface melting or lake-level rise can force glacier tongues out of hydrostatic equilibrium (e.g. Howarth and Price, Reference Howarth and Price1969; Warren and others, Reference Warren, Benn, Winchester and Harrison2001; Boyce and others, Reference Boyce, Motyka and Truffer2007). More recently, a spectacular variant of buoyancy-driven calving has been observed at several Greenland outlet glaciers (e.g. James and others, Reference James, Murray, Selmes, Scharrer and O'Leary2014; Medrzycka and others, Reference Medrzycka, Benn, Box, Copland and Balog2016; Xie and others, Reference Xie2016). Rapid ice flow into deep water can result in hydrostatic disequilibrium (‘super-buoyancy’), leading to upward rotation of the terminus and detachment and overturning of blocks hundreds of metres in thickness and lateral extent (James and others, Reference James, Murray, Selmes, Scharrer and O'Leary2014; Murray and others, Reference Murray2015). Analytical models of super-buoyant glacier termini have been developed by Wagner and others (Reference Wagner, James, Murray and Vella2016), although these do not allow calving losses to be predicted.
The problem of predicting melt-under-cutting and buoyancy-driven calving is particularly acute for ice flow models that adopt simplified stress formulations. Most predictive calving models are either 1-D (flowline) or 2-D (map plane) and adopt vertically integrated stresses. These shallow-shelf, shallow-stream models therefore cannot represent the downward or upward bending processes implicated in melt-under-cutting and buoyancy-driven calving. There is considerably greater potential for representing these processes in models that solve the full set of Stokes equations and use calving criteria based on all stresses (Todd J, Christoffersen P, Zwinger T, Luckman A and Benn DI, unpublished data).
Explicit simulation of calving processes can be achieved using discrete element models, which represent ice as assemblages of particles linked by breakable beams. Discrete element models can exhibit brittle, elastic and in certain formulations also viscous behaviour, and allow simulation of the full range of calving processes observed in nature (e.g. Faillettaz and others, Reference Faillettaz, Sornette and Funk2011, Reference Faillettaz, Funk and Vincent2015; Åström and others, Reference Åström2013; Bassis and Jacobs, Reference Bassis and Jacobs2013; Riikilä and others, Reference Riikilä, Tallinen, Åström and Timonen2015). Due to their high computational cost, discrete element models are unsuitable for simulating glacier evolution on timescales longer than a few hours. However, they offer unrivalled opportunities to develop the solid theoretical underpinning required to develop the reliable calving laws required for predicting the evolution of glaciers and ice sheets over decades and centuries.
In this paper, we use the Helsinki Discrete Element Model (HiDEM) to explicitly model fracture and calving processes, and the finite element model Elmer/Ice to identify the associated critical stress states. We use the results to identify criteria for predicting melt- and buoyancy-driven calving events, opening the way to developing reliable calving laws that reflect the diversity of calving processes.
3. METHODS
The HiDEM is described in detail by Åström and others (Reference Åström2013, Reference Åström2014). Ice is represented as particles connected by breakable elastic beams, stacked together to form specified 3-D glacier geometries. Although individual particles are rigid, in bulk the material is compressible and elastic. At the beginning of a simulation, the ice is assumed to have no internal stresses and contains a low density of randomly scattered small pre-existing cracks. During the simulation, the dynamics of the ice is computed using a discrete version of Newton's equation of motion, using inelastic potentials to calculate the interactions of individual particles and beams. As the ice deforms under its own weight, stresses on the beams increase. If stress reaches a failure threshold the beam breaks and particles (or aggregates) become disconnected but continue to interact as long as they are in contact. In this way cracks in the modelled ice body are formed and propagated, and may result in the detachment and release of calved blocks.
In this study, we varied particle size from 5 to 20 m in diameter, depending on glacier thickness. For computational efficiency, we adopted a densely packed face-centred cubic (fcc) lattice of spherical blocks of equal size. This introduces a weak directional bias in the elastic and fracture properties of the ice, but the symmetry of the underlying fcc-lattice is easily broken by propagating cracks (Åström and others, Reference Åström2013). Particles in contact with the elastic bed experience frictional drag proportional to velocity (Weertman-type ice-to-bed friction), which can vary spatially. The beams are assumed to be linear-elastic with a Young's Modulus (E) of 109 Pa. This is about an order of magnitude lower than real values for ice (Hooke, Reference Hooke2005), and was chosen to compensate for the decrease in crack-tip stress concentrations for large particles compared with real ice grains. In HiDEM, Poisson's ratio (ν) is not a free parameter, but emerges as a consequence of the packing of particles and their connections. For the configurations adopted here, ν = 0.3. The stress threshold required to break beams was varied between 0.1 and 1 MPa, and the density of discontinuities was varied from 0 to 10%, chosen to match model behaviour to observed ice properties (Schulson, Reference Schulson1999). Particle trajectories were computed using Velocity Verlet integration, with a time step of 10−4 s.
Elmer/Ice is an open-source continuum ice-dynamic model that solves the Stokes equations using the finite element method (Gagliardini and others, Reference Gagliardini2013). For time-evolving simulations, advance and calving of the ice front are achieved using the methods of Todd and Christoffersen (Reference Todd and Christoffersen2014), which efficiently re-mesh the model domain at each time step and hence permit multiple runs at low computational cost. For the experiments described in this paper, we set a Dirichlet basal boundary condition in the normal direction (normal velocity = zero), and a Robin condition in the tangential direction, linking traction to the tangential velocity. Spatial discretization was done using linear quadrilateral elements arranged in an initially vertically structured terrain-following pattern, which was allowed to distort during the runs. Mesh deformation was accounted for by an Arbitrary Lagrangian Eulerian (ALE) formulation of the advection parts of the continuum equations. Time stepping is by a first-order Backward Differentiation Formula (BDF), equivalent to backward Euler methods. The nonlinear solution was accepted after the relative change of the norm fell below 1/100 000 and the linear system was solved using a direct solver, hence no check for convergence was needed. The direct solution method was provided by the external package UMFPACK, which is a multi-frontal direct matrix solver for sparse systems.
Our use of HiDEM and Elmer/Ice to investigate calving processes is based on the distinct relaxation timescales for flow and fracture of ice. The lower limit of the viscous relaxation timescale is set by η/E, where η(τ) is the shear stress dependent viscosity of ice, and E is Young's modulus. Typical values of these variables for ice indicate η/E in the range ~102–106 s, while the fracture relaxation timescale can be roughly estimated by the crack propagation time across a unit volume in HiDEM ~10−2 s. This separation of viscous and fracture timescales means that viscous deformation during a fracture/calving event can be largely ignored, and therefore numerical simulation of the flow of glaciers using Elmer/Ice can be separated from the simulation of fracture and calving using HiDEM.
The governing equation for stress in an elastic and/or viscous body is the tensor variant of Newton's equation of motion:
 $$\nabla \cdot {\bf \sigma} + {\bf f} = \rho {\rm d}^2{\bf u}/{\rm d}^2{\bf t}$$
where σ is the Cauchy stress tensor, f is the sum of the applied forces, u is displacement and the right-hand side is the acceleration of a mass with density ρ as a response to the total force acting on it on the left-hand side. In glacier flow, the acceleration term is typically ignored (i.e. set to zero) resulting in the equation for Stokes flow. For linear elasticity, the corresponding equation holds the solution for elastic equilibrium. In HiDEM, elastic equilibrium is obtained by introducing an additional damping term (−c du/dt) in the equation of motion, where c is a damping coefficient. Only after equilibrium is reached is fracture allowed in HiDEM.
In our experiments we compute the viscous flow of ice using Elmer/Ice and then at suitable instants in time export the glacier geometry and boundary conditions from Elmer/Ice into HiDEM, and compute possible fractures and calving. If the ice geometry, boundary conditions and the governing equations are the same in both cases, the resulting stress fields are, by definition, equivalent. In practice, however, a deviation in geometry appears when HiDEM relaxes into elastic equilibrium starting from the Elmer/Ice geometry. The magnitude of the deviation of the stress field is determined by the different rheology in the two models, and is generally small. For our present purposes, the difference between the stress fields is not important. Our aim is to look for calving identifiers in the Elmer/Ice stress field as a means of developing improved calving laws, rather than defining the stresses associated with calving in HiDEM. Furthermore, the stress field in Elmer/Ice is static for a given ice geometry, whereas that in HiDEM evolves continuously during a simulation as fractures propagate. Rather than attempt precise matching of the initial stress fields, we focus on the more practical issue of identifying Elmer/Ice stress fields that can be used to diagnose calving.
To analyze the Elmer/Ice stress fields associated with HiDEM calving events, we use a generalized form of the Nye crevasse criterion (Nye, Reference Nye1957). In its original plane strain form, it assumes that closely spaced crevasses will penetrate to a level where the tensile stress in the along-flow direction is exactly balanced by the lithostatic pressure. This can be rewritten such that crevasses exist wherever:
 $$\sigma _{xx} \gt 0$$
where σ xx is the normal stress along-flow. Generalizing to allow crevasses to open in response to tensile stress in any direction, and accounting for the effect of water pressure (P w) this becomes:
 $$\sigma _{\rm 1} + \sigma _{\rm w} \gt 0$$
where σ1 is the largest principal component of the Cauchy stress tensor (Todd, Reference Todd2016; Todd J, Christoffersen P, Zwinger T, Luckman A and Benn DI, unpublished data). We do not consider the effect of water in surface crevasses, but assume that water will penetrate any cracks that might exist in the submerged part of the glacier, with P w determined by the surface of the proglacial water body. Herein, we refer to (σ1 + P w) as the Effective Principal Stress (EPS), with areas of potential fracturing indicated by positive values. This can be interpreted as a maximum principal stress yield criterion with the elastic limit set to zero.
Following Nick and others (Reference Nick, van der Veen, Vieli and Benn2010) and Todd (Reference Todd2016), we define two crevasse-depth calving laws: (1) surface crevasses penetrate to the waterline; and (2) surface and basal crevasses together penetrate the full thickness of the glacier. In addition to implementing these calving laws in Elmer/Ice, we also use EPS to analyze stress distributions associated with HiDEM calving events.
4. MODEL EXPERIMENTS AND RESULTS
In this paper, we present the results of two sets of model experiments. First, we use a set of idealized ice-front geometries to investigate the controls on melt-under-cutting and buoyancy-driven calving processes, using HiDEM to simulate calving events and Elmer/Ice to analyze the associated stress distributions. Second, we investigate dynamic processes leading to buoyancy-driven calving, using Elmer/Ice to simulate the evolving geometry and stress distributions, and HiDEM to simulate calving for selected time steps. For both sets of experiments, we test the performance of crevasse-depth calving laws against the HiDEM results and identify criteria for predicting calving events in continuum models.
4.1. A calving process spectrum: under-cutting, buoyancy and cliff failure
4.1.1. Experimental setup
To investigate the influence of buoyancy conditions and under-cutting on calving processes, we conducted HiDEM runs and Elmer/Ice stress analyses for a matrix of idealized glacier geometries. The Elmer/Ice simulations were 2-D plane strain (along-flow and vertical), consistent with the 3-D HiDEM simulations of a 1500 m wide glacier with no side friction. For the runs described here, we prescribed glacier length of 2 km, ice-front thickness of 100 m, and constant basal friction of 110 kPa, except where the ice is fully buoyant where basal friction is zero. To reduce computational cost, we simulated only the lowermost 1 km of the glaciers in HiDEM. Flow law parameters were set to n = 3 and rate factor of A = 5.016 × 10⁻²⁴ s−1 Pa−3, values appropriate for temperate ice. Mesh size was 0.5 m (horizontal) and 1 m (vertical) at the terminus, increasing to 18 m (horizontal) and 3 m (vertical) at the inflow. In the HiDEM simulations, we used a particle diameter of 6 m and a fracture stress of 0.3 MPa. These configurations are similar to those used in the pioneering work of Hanson and Hooke (Reference Hanson and Hooke2003), and are broadly representative of small tidewater glaciers in regions such as Alaska and Svalbard.
We varied water depth at the terminus D W relative to that required for ice flotation D F, such that relative buoyancy D W/D F, ranged between 0.61 (well grounded) and 1.1 (super-buoyant). The flotation water depth D F is defined as:
 $$D_{\rm F} = \displaystyle{{\rho _{\rm i}} \over {\rho _{\rm w}}}H_{\rm I}$$
where ρ i and ρ w are the densities of ice and sea water, respectively, and H I is ice thickness.
The applied undercuts have a simple, linear form with maximum length U L at the glacier bed and height U H equal to the water depth D W (Fig. 1). In HiDEM, the undercuts have a stepped form, due to the finite particle size. Sets of experiments were also conducted using undercuts extending halfway to the waterline (U H = 0.5 D W). All sets of experiments produced closely similar results with calving magnitudes differing only slightly for the different cases, and only the results for full-depth undercuts are described here.
Definitions of undercut length (U L) and height (U H), water depth (D W) and flotation depth (D F).
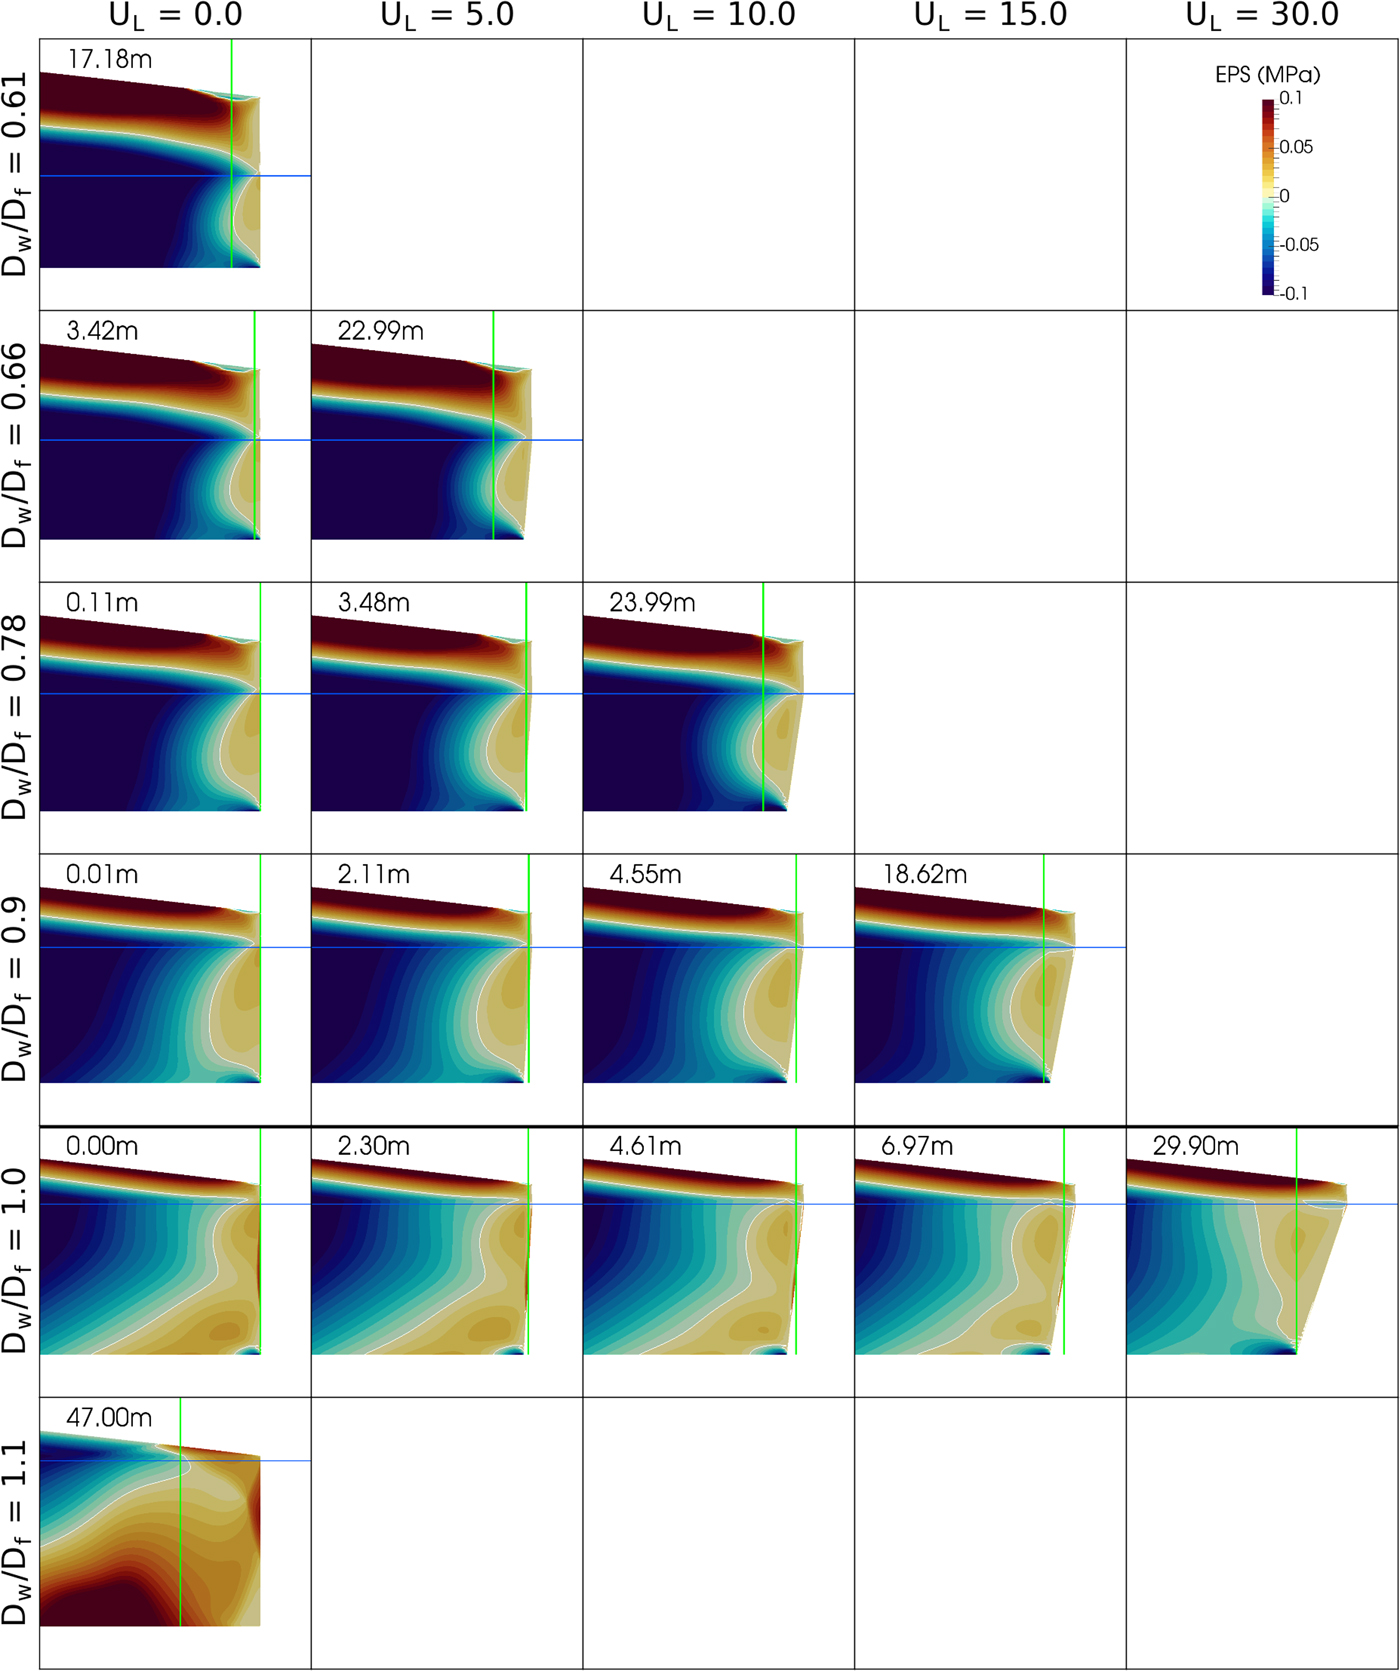
For each simulation, we quantified the amount of ice calved using a calving length index: CL = (M C + M U)/(W × H), where M C is the calved volume, M U is the volume of any undercut below the ice prior to the calving event, and W and H are the width and mean thickness of the glacier front (including undercut). This index provides a consistent means of quantifying calving events, smoothing out the effects of irregular, non-planar failure surfaces. The matrix of tested glacier geometries is shown in Figure 2, together with the EPS fields calculated in Elmer/Ice and calving length indices simulated in HiDEM.
Matrix of ice-front geometries used in the melt-under-cutting experiments, showing Effective Principal Stresses (EPS calculated in Elmer/Ice and HiDEM calving length indices (vertical green lines and figures in each panel).
4.1.2. The calving process spectrum in HiDEM
For zero under-cutting, significant calving occurs under super-buoyant conditions (D W/D F = 1.1) and for well-grounded conditions (D W/D F = 0.61). For the well-grounded case, calving begins with the spalling of slabs of ice below the waterline and the detachment of a large flake above the waterline (Fig. 3a). The flake topples forward and down, while the subaqueous slabs rise buoyantly towards the surface. In HiDEM experiments we find that spalling below the waterline is typically triggered by seismic signals, i.e. elastic wave impulses from other events that create stress peaks at the free surface of the ice cliff. This style of calving is a variant of the ‘cliff failure’ mechanism proposed by Hanson and Hooke (Reference Hanson and Hooke2003) and Bassis and Walker (Reference Bassis and Walker2012).
Contrasting calving styles modelled in HiDEM. (a) Ice-cliff failure modelled using D W/D F = 0.61 and U L = 0. The subaerial ice face is 44 m high. (b) Buoyancy-driven calving with D W/D F = 1.1, U L = 0, showing upward growth of basal fracture and block rotation. (c) Melt-undercut calving with D W/D F = 0.9, U L = 20.
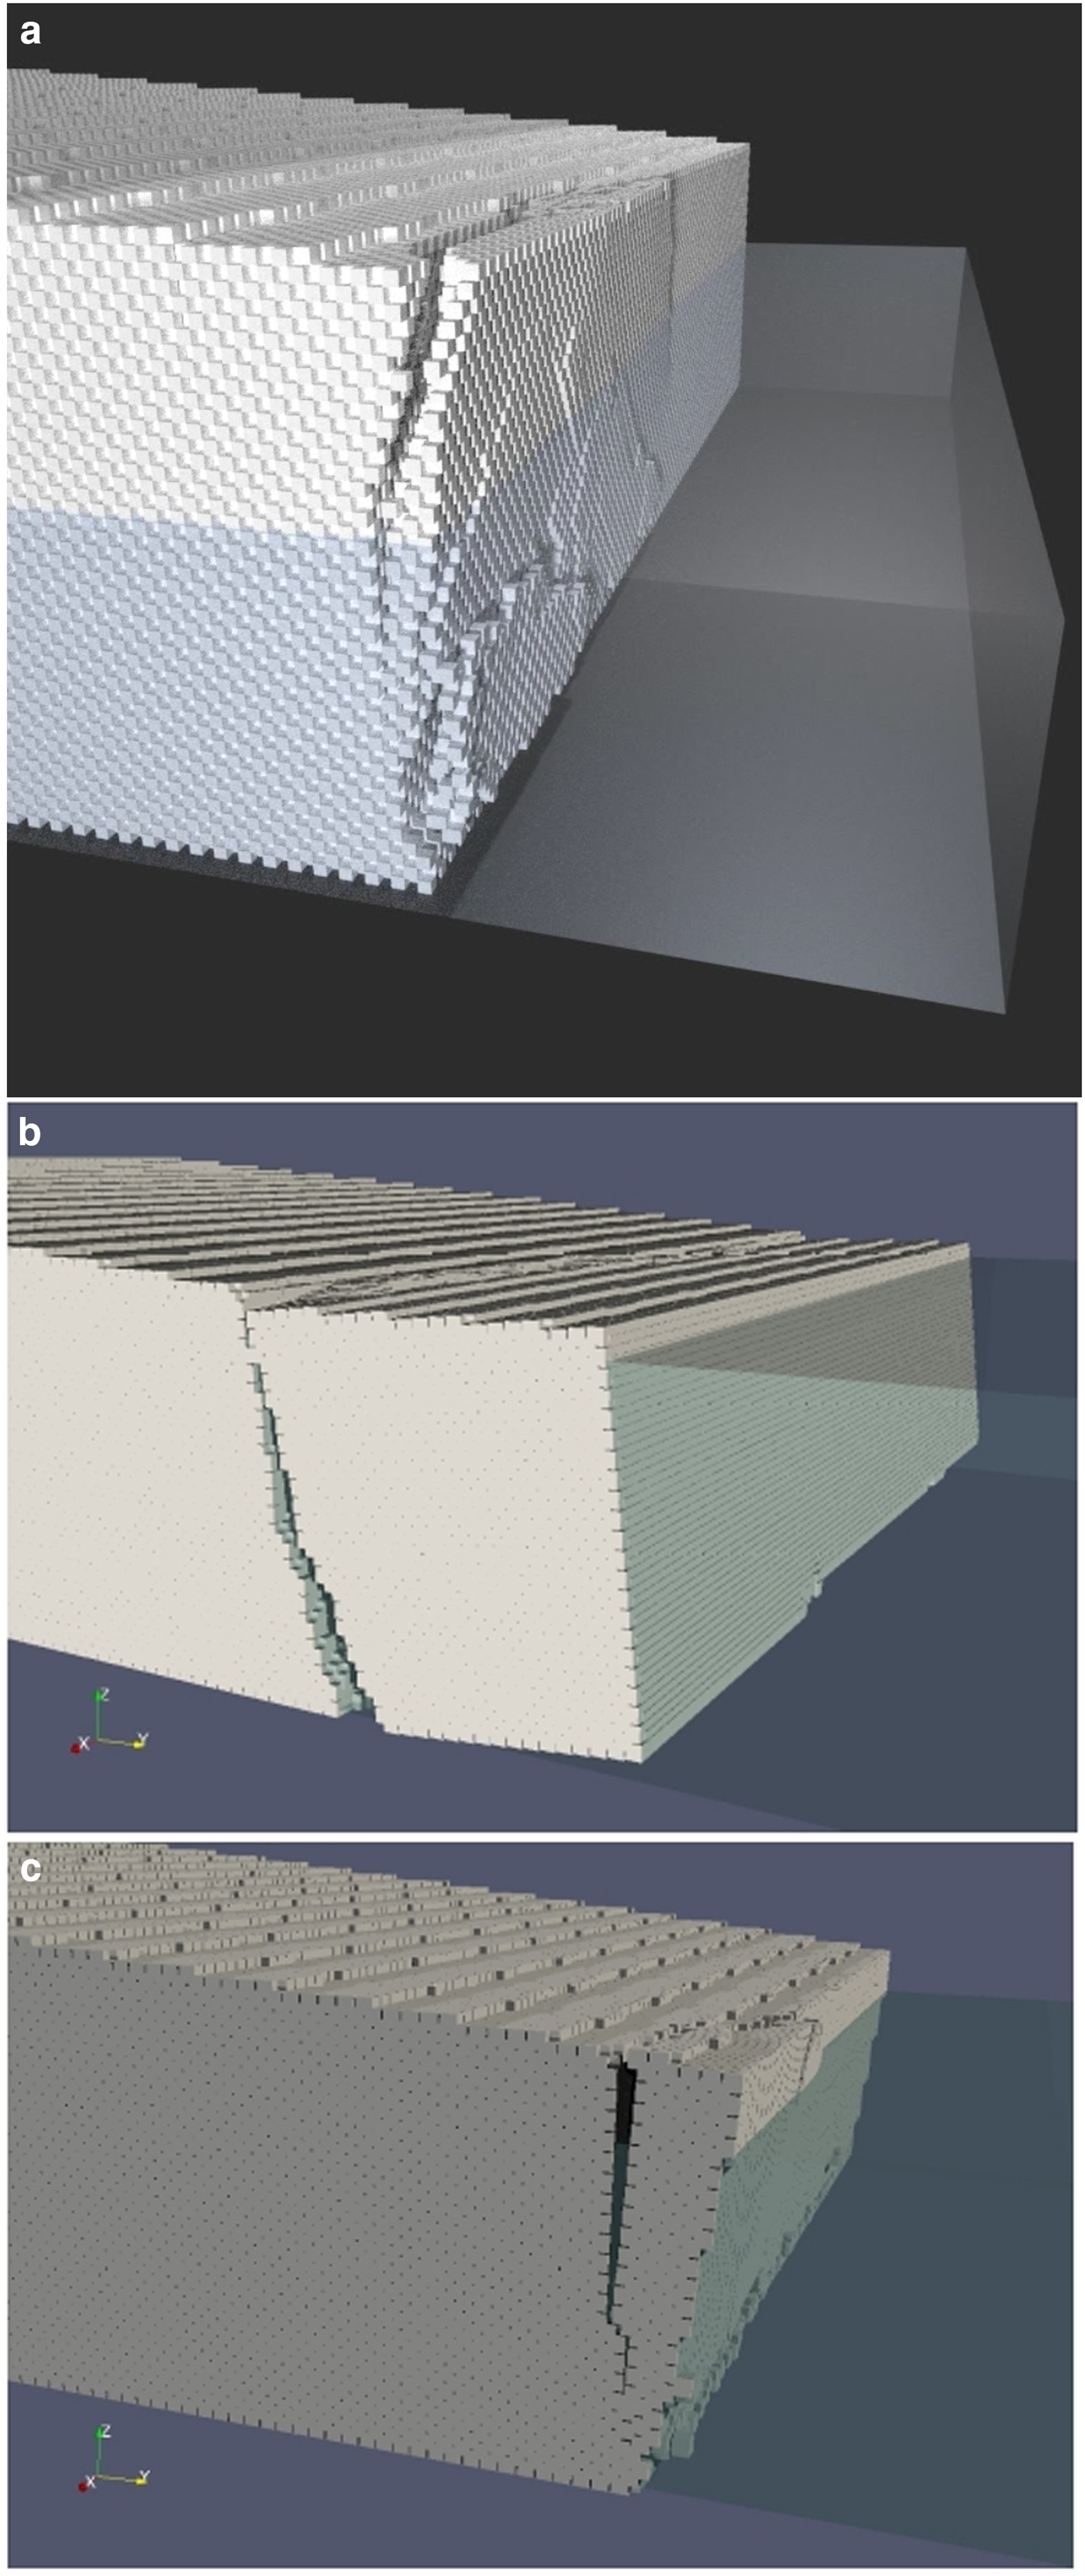
For the super-buoyant case, calving occurs by the upward propagation of a basal crevasse, followed by backward rotation and detachment of a large block (Fig. 3b). The block breaks up as it rises to the surface, forming numerous fragments analogous to iceberg mélange. Although highly idealized, the results of this simulation are closely similar to buoyancy-driven calving events described in detail by James and others (Reference James, Murray, Selmes, Scharrer and O'Leary2014) and Murray and others (Reference Murray2015). The mechanics of buoyancy-driven calving are discussed in greater detail in Section 4.2.
Where undercuts are applied, two magnitudes of calving event are apparent: (1) low-magnitude events, with mean calving lengths less than the undercut length, and (2) high-magnitude events, with mean calving lengths greater than the undercut length (Fig. 2; Table 1). The low-magnitude events affect only part of the ice front width, and occur in response to random variations in pre-existing cracks. Where suitably oriented cracks occur, removal of support by under-cutting is sufficient to cause localized failure, while elsewhere the undercut ice front remains intact. High magnitude events remove the entire overhanging part plus additional ice (Fig. 3c). These events thus exhibit the calving multiplier effect proposed by O'Leary and Christoffersen (Reference O'Leary and Christoffersen2013). In the high-magnitude events, fractures form at the ice surface and propagate downward as the overhanging ice front bends forward and down.
Linear calving magnitude (bold) in HiDEM (top) and Elmer/Ice (bottom) for different combinations of undercut length and ratio of water depth to flotation depth (D W/D F).
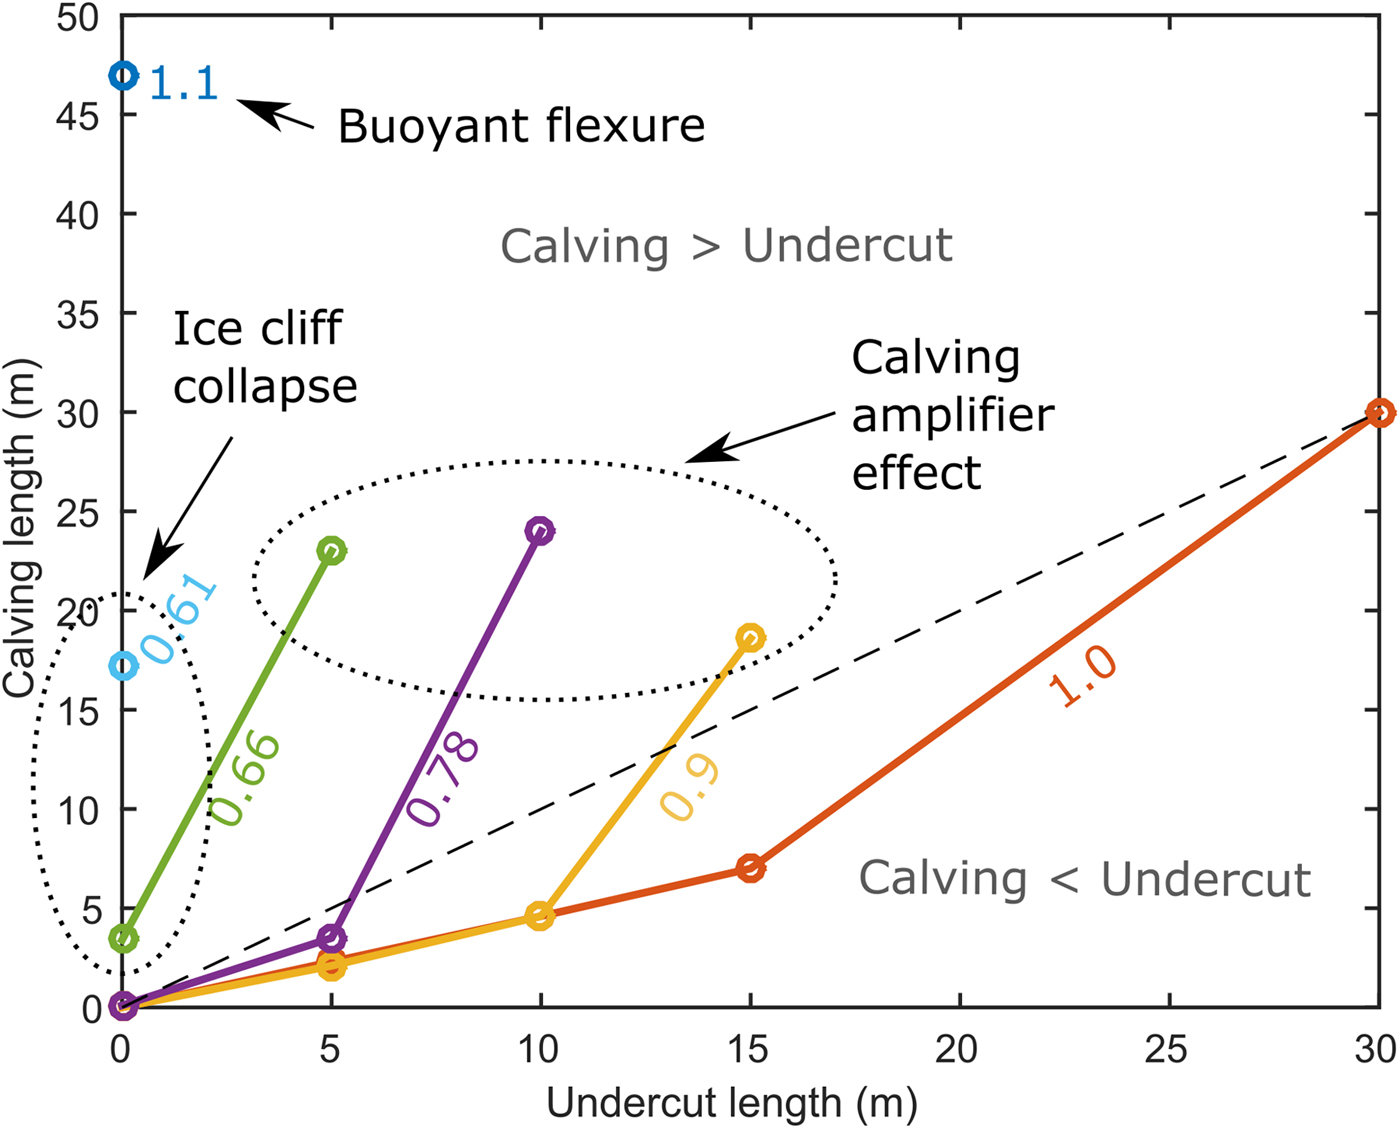
The threshold undercut length between low and high magnitude calving events increases with D W/D F (Fig. 4). That is, as relative buoyancy increases, increasingly deep undercuts are required to trigger high magnitude calving events. In contrast with the conclusions of O'Leary and Christoffersen (Reference O'Leary and Christoffersen2013), we find that the calving multiplier effect decreases with increasing relative buoyancy (Table 2). For D W/D F = 0.66 and U L = 5 m, calving length is 4.6 times undercut length, whereas for D W/D F = 1 and U L = 30 m, calving length is approximately equal to undercut length. The reasons for this are discussed in Section 5.
HiDEM calving lengths as a function of undercut length for different relative buoyancies (D W/D F = 0.61, 0.66, 0.78, 0.9, 1.0 and 1.1). The lines are intended to aid visual grouping of results, and do not imply linear variation between plotted points. Each set of connected points represents one row on Figure 2, and can be viewed as an evolutionary sequence. For each value of relative buoyancy, increasing the undercut length produces larger calving events.
Calving multiplier values (calving length divided by undercut length) for a range of undercut lengths and water depths
Ice-front retreat is 4.6 times undercut length for well-grounded ice (D W/D F = 0.66), diminishing with increasing water depth.
4.1.3. Stress analysis
Figure 2 shows effective principal stresses (EPS), as defined in Eqn (3), calculated in Elmer/Ice for the matrix of geometries. Where D W/D F ≤ 1, all geometries exhibit a surface layer of positive EPS (i.e. tensile stress) that slopes down to reach the waterline almost exactly at the glacier front. These surface tensile layers form in response to the unopposed stresses at the subaerial frontal cliff, and are the reason for the surface crevasse fields that typically occur at the termini of tidewater glaciers. Maximum values of positive EPS occur at the ice surface, ~1.5 ice thicknesses back from the terminus. With increasing relative buoyancy, maximum EPS decreases in magnitude and the tensile layers diminish in thickness. When D W/D F = 1, the EPS maximum shifts forward to slightly less than one ice thickness from the terminus.
If the effect of water pressure is excluded, all ice in the glacier interior beneath the surface layer is under net compression. However, if water is assumed to penetrate cracks, concave regions of positive EPS occur at the submerged parts of the glacier fronts (Fig. 2). In addition, for the buoyant and super-buoyant cases (D W/D F = 1 & 1.1), wedge-shaped zones of positive EPS occur at the glacier bed near the glacier termini. For D W/D F = 1.1, U L = 0, and D W/D F = 1.0, U L = 30 m, Elmer/Ice predicts fracture penetration (i.e. EPS > 0) through the full-thickness of the glacier fronts close to the position of the high-magnitude HiDEM calving events. In most cases, however, neither the full-depth nor waterline crevasse depth calving laws predict any significant calving (Table 1).
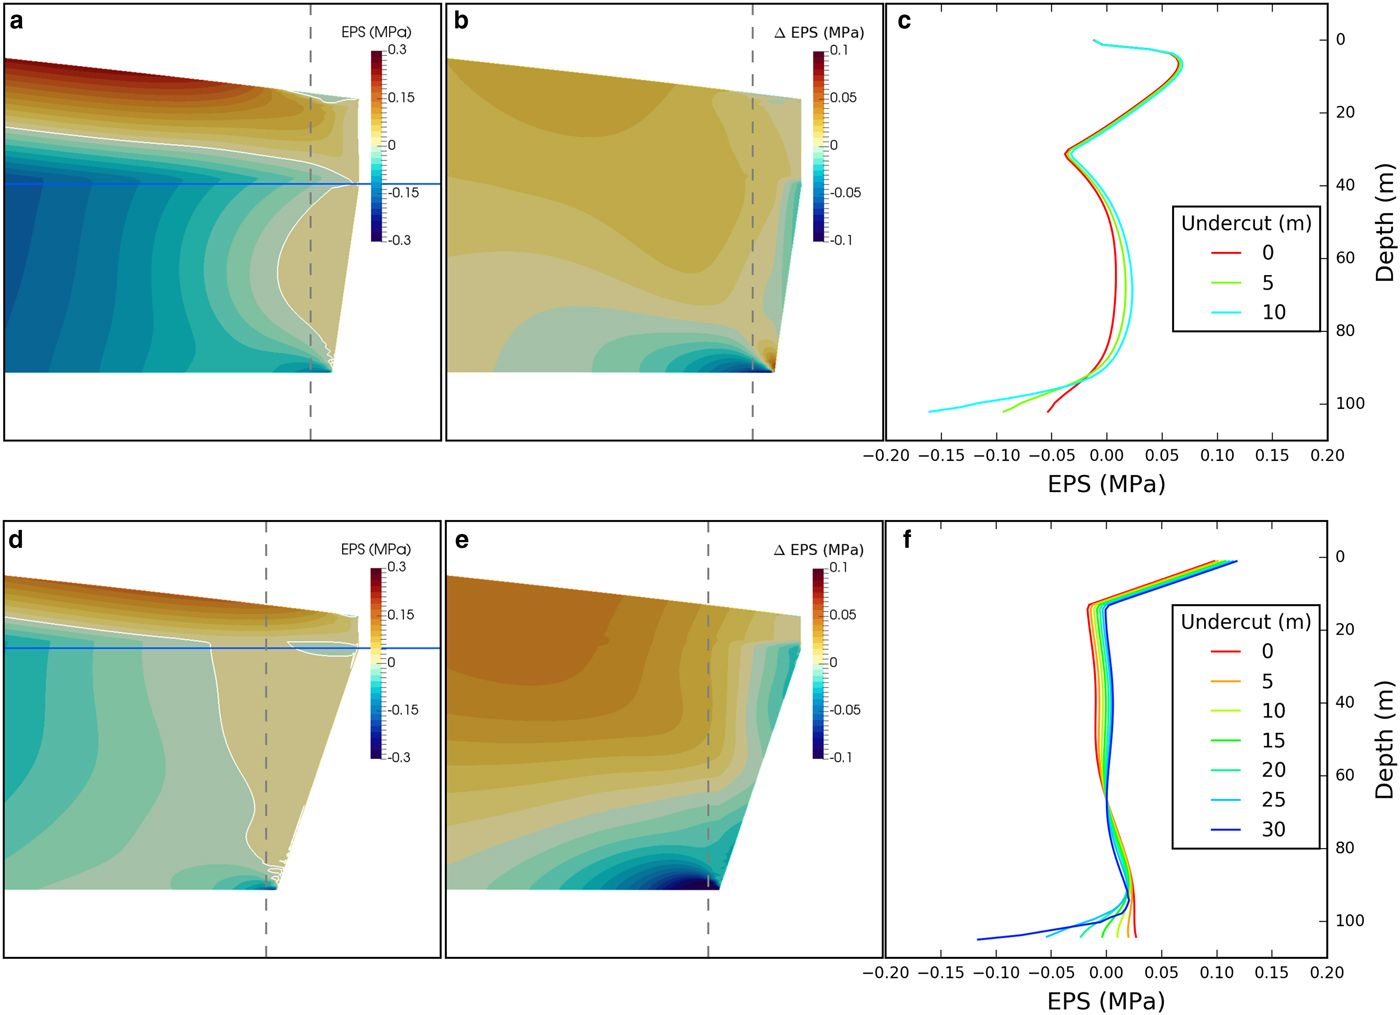
The mismatch between the HiDEM results and the predictions of crevasse-depth calving laws occurs largely because the Elmer/Ice analysis does not incorporate feedbacks between fracture growth and stresses within the ice. Such feedbacks play a crucial role in the high-magnitude HiDEM calving events. When fracturing occurs, tensile stresses must be supported by the remaining intact ice. If stress concentrations at crack tips are high enough to cause additional fracture growth, more stress will be transferred to the adjacent ice and this process may continue until calving occurs. The conditions required for stress – fracture growth feedbacks can be identified through comparison of the location of high-magnitude HiDEM calving events with EPS calculated in Elmer/Ice (Figs 2, 5). The first important observation is that HiDEM calving events never occur at the point of highest tensile stress at the surface but much closer to the front. In some cases, calving occurs where EPS is slightly negative at the surface, possibly reflecting differences between the HiDEM and Elmer/Ice stress fields. However, the calving location is so far removed from the point of maximum tensile stress that we can be confident that the offset is a real effect and not simply an artefact of the (slightly) different Elmer/Ice and HiDEM stress fields. Secondly, calving always occurs above a concentration of compressive stresses at the glacier bed, located at a short distance behind the front. The association is not exact, again probably due to differences between the HiDEM and Elmer/Ice stress fields, but calving always occurs within a few metres of the highest compressive stress identified in Elmer/Ice. Thirdly, the magnitude of the basal compressive stress increases with under-cutting. Figure 5 shows the difference between EPS in undercut ice relative to that in the zero undercut case (ΔEPS). In all cases, under-cutting is associated with growth of the compressive stress concentration behind the front and an increase in tensile stress in the near-surface ice, reflecting the torque introduced by unsupported gravitational forces in the overhang. In all cases, high-magnitude calving events occur when the EPS in the basal compressive stress concentration is ~−0.15 MPa. The same pattern emerges in runs with different ice thicknesses and undercut geometries, although the absolute magnitude of the critical stress concentration differs.
Elmer/Ice simulations of stresses associated with high-magnitude calving events modelled in HiDEM for D W/D F = 0.78 and 1.0. (a, d) Effective Principal Stress (EPS) for glacier geometries that experienced high-magnitude calving. The dotted vertical lines show the locations of the stress profiles in the right-hand panels, and are close to the mean calving position. (b, e) Difference in Effective Principal Stress (ΔEPS) between the undercut and non-undercut cases, showing growth of the basal compressive stress concentration behind the glacier front. (c, f) Vertical profiles of EPS above the basal compressive stress concentration.
These observations indicate that high-magnitude undercut-driven calving events are not simply governed by stress patterns that permit fracturing at the glacier surface. Rather, calving is associated with a combination of near-surface tensile stress and a concentration of compressive stress at the glacier bed, reflecting forward rotation of the ice front. This stress pattern can thus allow conditions conducive to fracture propagation to be identified in Elmer/Ice. Our analysis implies that vertical, grounded ice cliffs in the modelled height range are close to the limit of stability (cf. Åström and others, Reference Åström2014), and that calving can be triggered by small additional perturbations introduced by under-cutting. The magnitude of the required perturbation increases with degree of relative buoyancy.
4.2. Development of super-buoyancy
4.2.1. Experimental setup
To investigate the dynamic causes of super-buoyancy, we conducted time-evolving experiments with Elmer/Ice using two bed configurations broadly representative of fast-flowing Greenland outlet glaciers: (1) a sloping bed configuration with a constant bed slope of 1.43° (1/40 gradient); and (2) a horizontal bed configuration. Initial glacier thickness was set to 680 m, with an inflow velocity of 8000 m a−1, and a time step of 6 h. In both sloping and horizontal bed cases, we used the same flow law parameters as in the previous experiments, and a linear basal Weertman-type friction law τ B = C U B, with C = 5 × 10⁻⁵ between 0 and 2 km along the flowline, and then linearly decreasing at 1.65 × 10⁻⁸ m−1 beyond 2 km. In the sloping bed case, grounded ice seldom extends more than 2 km along the flowline, so the reduction in the bed friction coefficient only has a significant effect on the horizontal bed simulation. Mesh size was 4.3 m (horizontal) and 19 m (vertical) at the terminus, increasing to 39 m (horizontal) and 19 m (vertical) at the inflow. HiDEM simulations were conducted using geometries from selected time steps of the Elmer/Ice runs, using a particle size of 20 m and a fracture stress of 0.8 MPa.
4.2.2. Elmer/ice simulations
Snapshots of the Elmer/Ice simulation for the sloping-bed case are shown in Figure 6a. The buoyancy condition D W > D F is met at the terminus from the beginning of the simulation, but the front does not immediately lose contact with the bed. Uneven back-pressure on the front from the water column results in forward bending of the terminus, holding the ice below buoyant equilibrium. At t = 6.5 days, an area of high tensile stress (EPS = ~0.8 MPa) develops 395 m behind the front, with a small region of ice-bed separation located just down-glacier. As the glacier front advances into deeper water, the area of ice-bed separation expands down-glacier and the ungrounding point migrates up-glacier. During this period EPS at the ungrounding point increases, reaching a maximum of 1.2 MPa at t = 14 days. The terminus completely detaches from the bed at this time, after which the terminus undergoes gradual up-warping and eventually forms a neutrally-buoyant ice shelf. The viscous response of the terminus allows the tensile stress at the ungrounding point to slightly diminish in intensity.
Glacier geometry and Effective Principal Stress (EPS) at selected time steps (in days) modelled in Elmer/Ice. (a) Sloping bed case; (b) horizontal bed case.
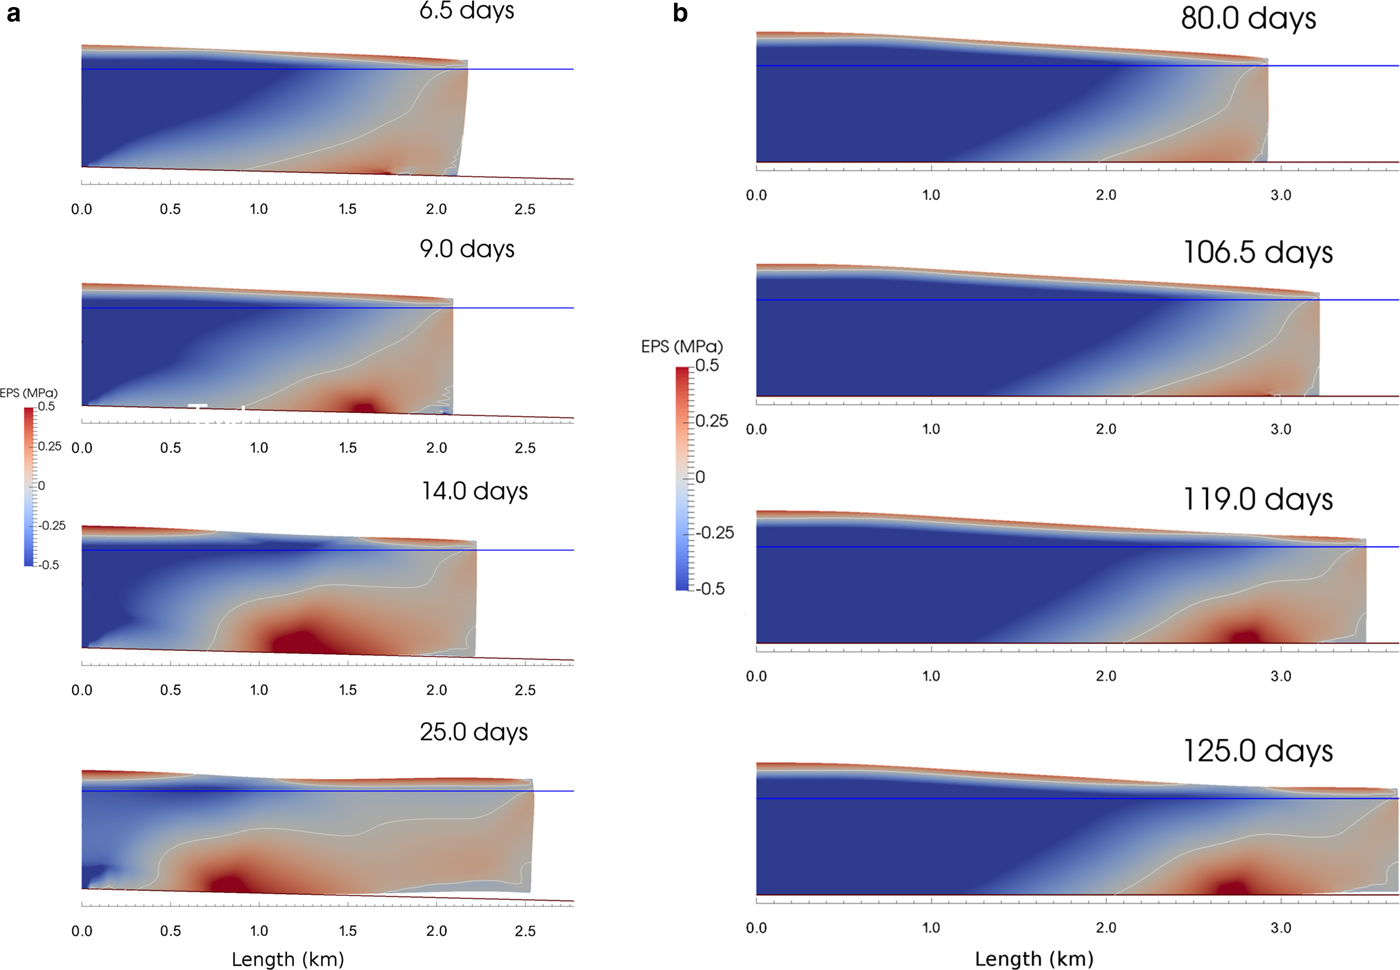
In the horizontal bed case, strong dynamic thinning occurs as the glacier advances in response to both longitudinal extension and vertical shear (Fig. 6b). This is sufficient for the buoyancy condition D W > D F to be met at the terminus from t = 80 days onward. However, as for the sloping bed case, the terminus does not immediately become ungrounded due to forward bending of the front. Ungrounding first occurs ~250 m behind the front at t = 106.75 days. The ungrounded region expands both down-glacier and up-glacier as the tongue advances and thins. The terminus finally detaches from the bed at t = 119 days, after which up-warping of the terminus forms a floating shelf. As was the case for the sloping bed simulation, an area of high tensile stress forms at the ungrounding point, increasing in intensity from 0.23 MPa at t = 106.75 days to 0.95 MPa at t = 125 days. After this point, the stress concentration slightly decreases in intensity, as viscous deformation of the front reduces the net upward buoyant force.
4.2.3. Buoyancy-driven calving in HiDEM
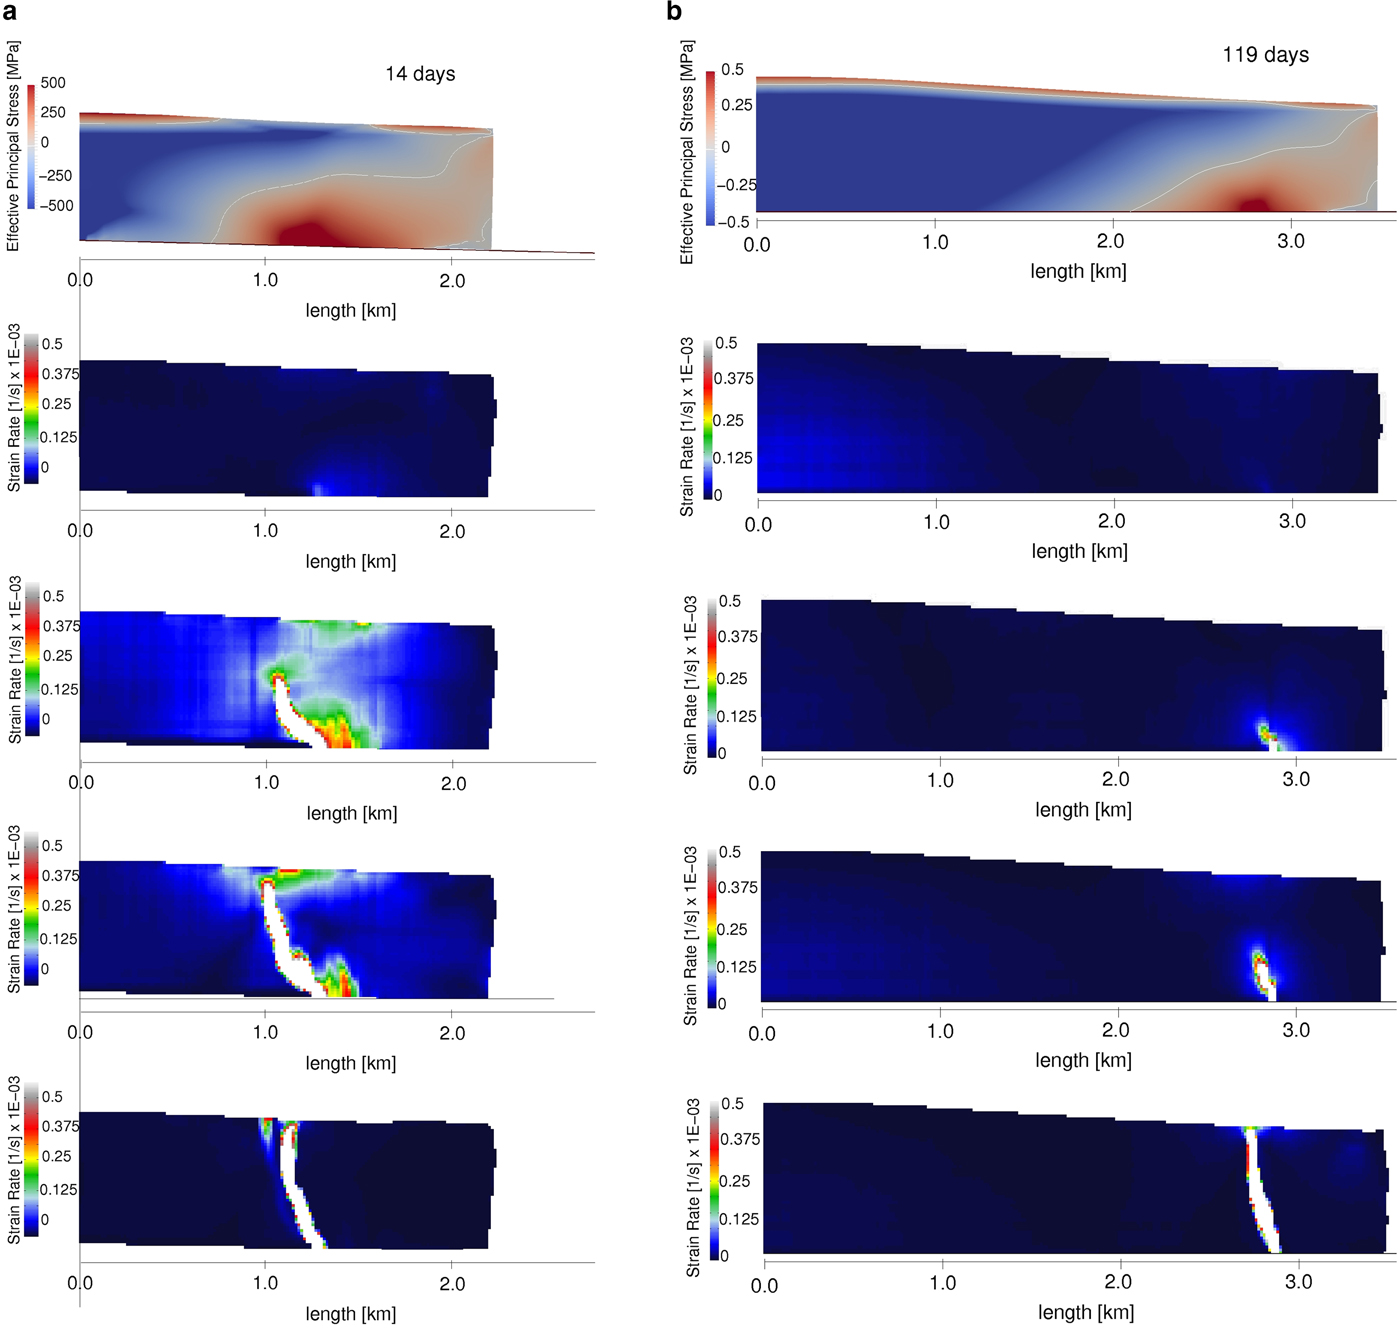
For the sloping bed case, ice geometry at t = 6.75, 9.25, 14 and 19 days was exported from Elmer/Ice into HiDEM. No calving occurs for the first two geometries, but the geometry for t = 14 days calves by the growth of a basal fracture originating in the area of maximum EPS (Fig. 7a). As the fracture propagates upward, inter-particle beams around the crack tip experience high strain rates, indicating a migrating stress concentration ahead of the advancing fracture. Regions of high stress also occur at the up-glacier end of the detaching block due to partial grounding and friction between the ice and bed. The fracture releases a block >900 m in length, that rotates backward and upward, but overturning is prevented by the high length-to-height ratio of the block. The pattern of fracturing is shown in Figure 8a, which plots the location of broken beams at the end of the HiDEM simulation. Two major sub-parallel fractures are evident, both of which display numerous offshoots. A large region of shattered ice occurs at the lower up-glacier end of the calved block, reflecting damage inflicted during block grounding and rotation.
Modelled calving events for (a) the sloping bed case at t = 14 days; and (b) the horizontal bed case at t = 119 days. Top panel: effective principal stress in Elmer/Ice; Lower panels: snapshots of the HiDEM simulations, showing strain rates in inter-particle beams averaged through the width of the model domain. The averaging creates a false impression of a wide crack: fracture geometry is shown in Figure 8.
Broken bonds at the end of the HiDEM runs (red dots), highlighting simulated fracture planes and regions of damaged ice. (a) Sloping bed case; (b) horizontal bed case.
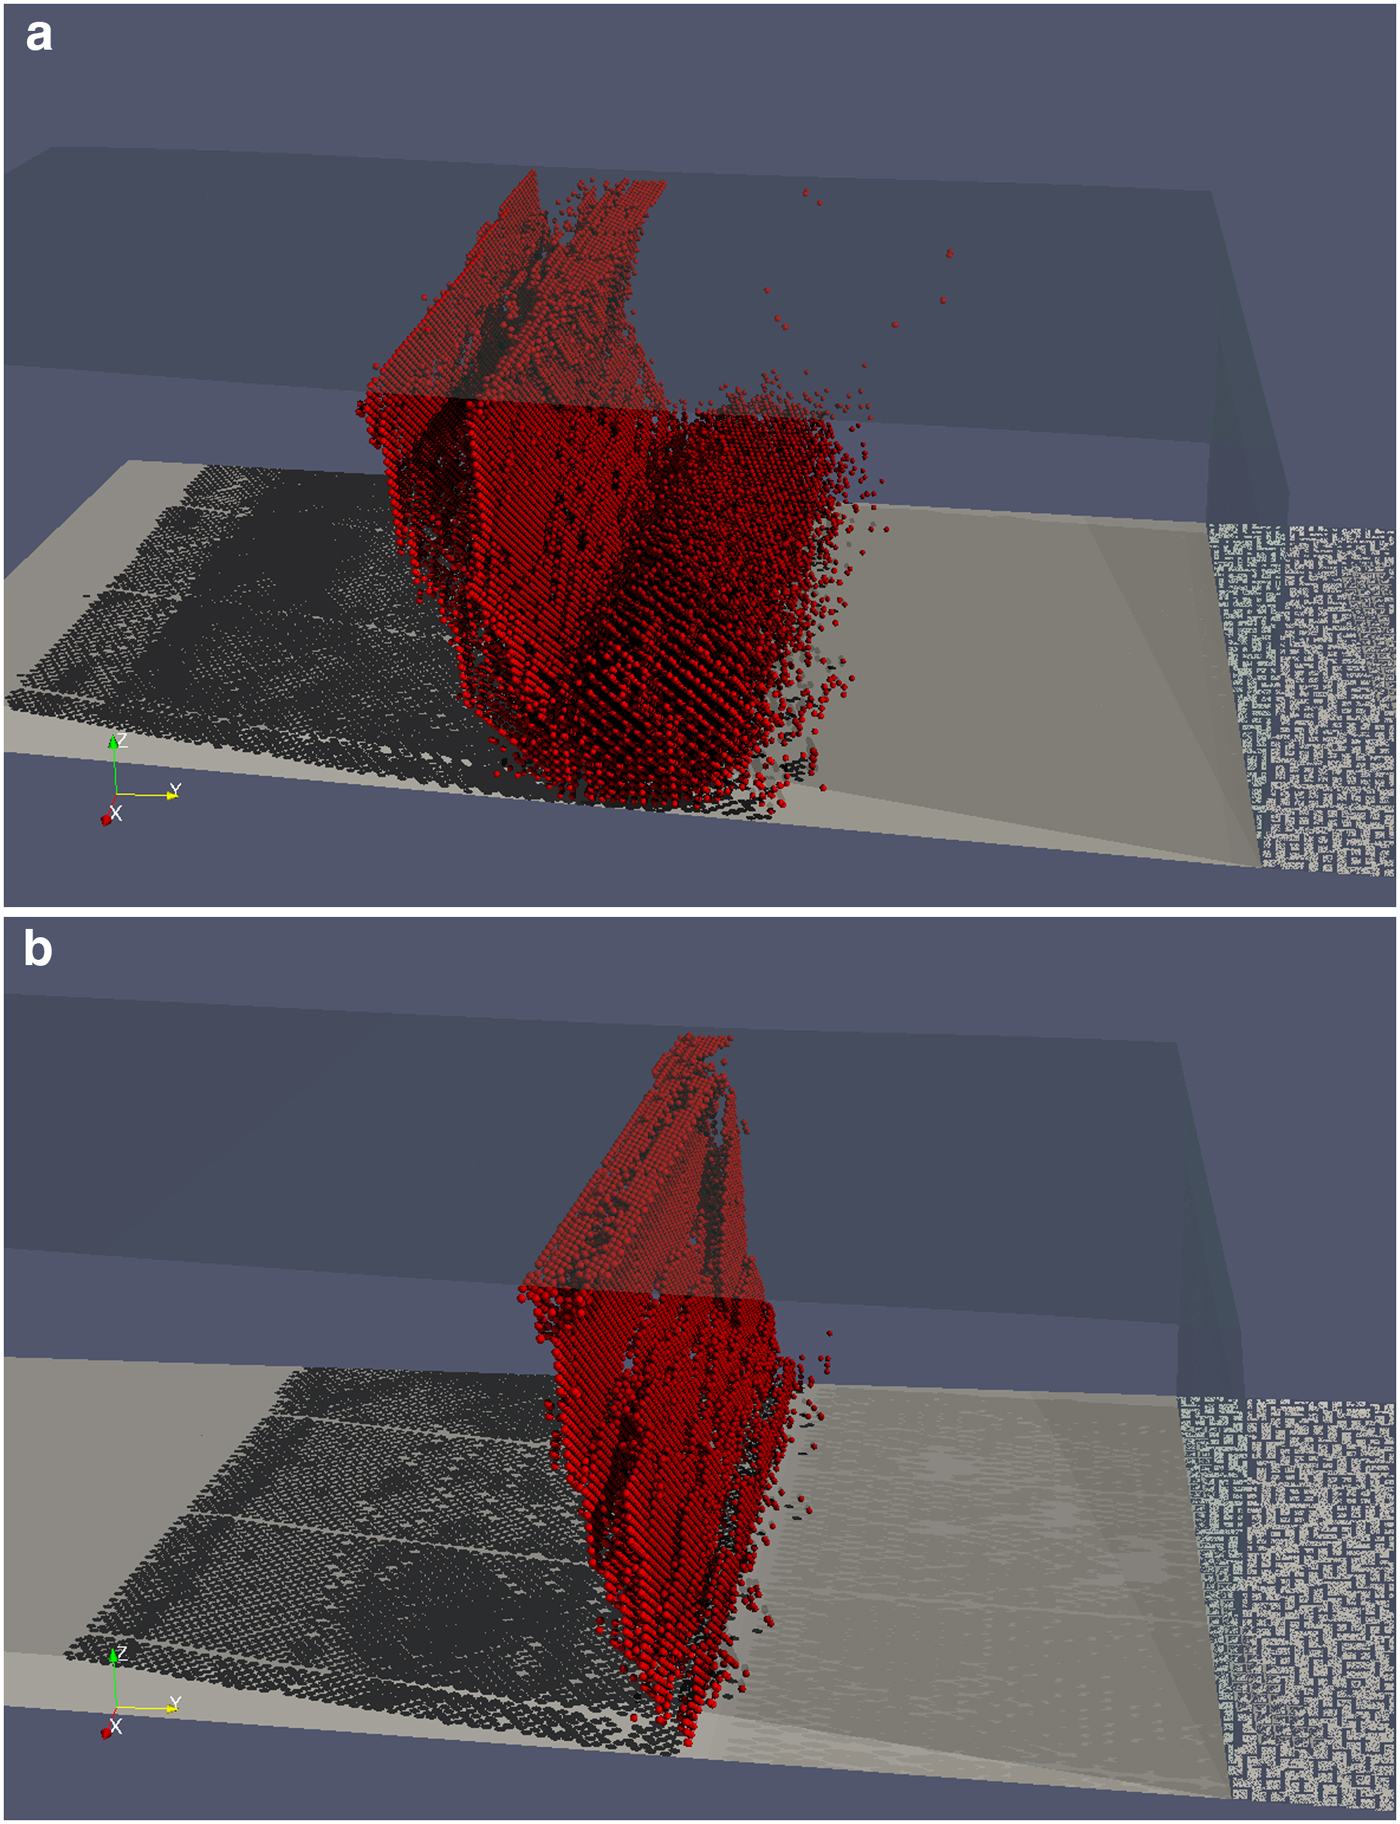
For the horizontal bed case, calving behaviour was tested in HiDEM for geometries obtained at t = 106.5, 112.74, 119.25 and 125.25 days. No calving occurs in the first two cases. In the geometry for t = 119.25 days, a basal fracture forms in the zone of highest EPS, 675 m from the front (Fig. 7b). The fracture propagates rapidly upward, with high strain rates in the inter-particle beams above the crack tip. Unlike the sloping bed case, high strain rates (and stress concentrations) only occur close to the crack, reflecting the lack of interaction between the detaching block and the bed during the calving event. This is mirrored in the final fracture pattern (Fig. 8b), which shows a single zone of branching fracture planes.
4.2.4. Stress analysis
Both Elmer/Ice simulations display similar patterns of EPS evolution during ice advance. Early in the simulations, there are surface layers of positive EPS (tensile stresses) and wedge-shaped regions of positive EPS at the termini (Fig. 6). In later time steps, once super-buoyant conditions have developed on the glacier tongues, regions of high positive EPS appear at the ungrounding points. These intensify through time, accompanied by the disappearance of the surface tensile layer in the overlying ice. In both cases, the full-depth crevasse calving criterion predicts numerous small calving events that noticeably slow the rate of glacier advance, particularly in the horizontal bed case. However, the calculated penetration of basal crevasses near the ungrounding point is only ~50% of the glacier thickness. This reflects the fact that the Elmer/Ice simulations do not include the effects of fracture on the remaining ice, precluding the positive feedbacks that can lead to full-thickness fracture. As for the melt-under-cutting case, however, the calving events are associated with distinctive stress patterns.
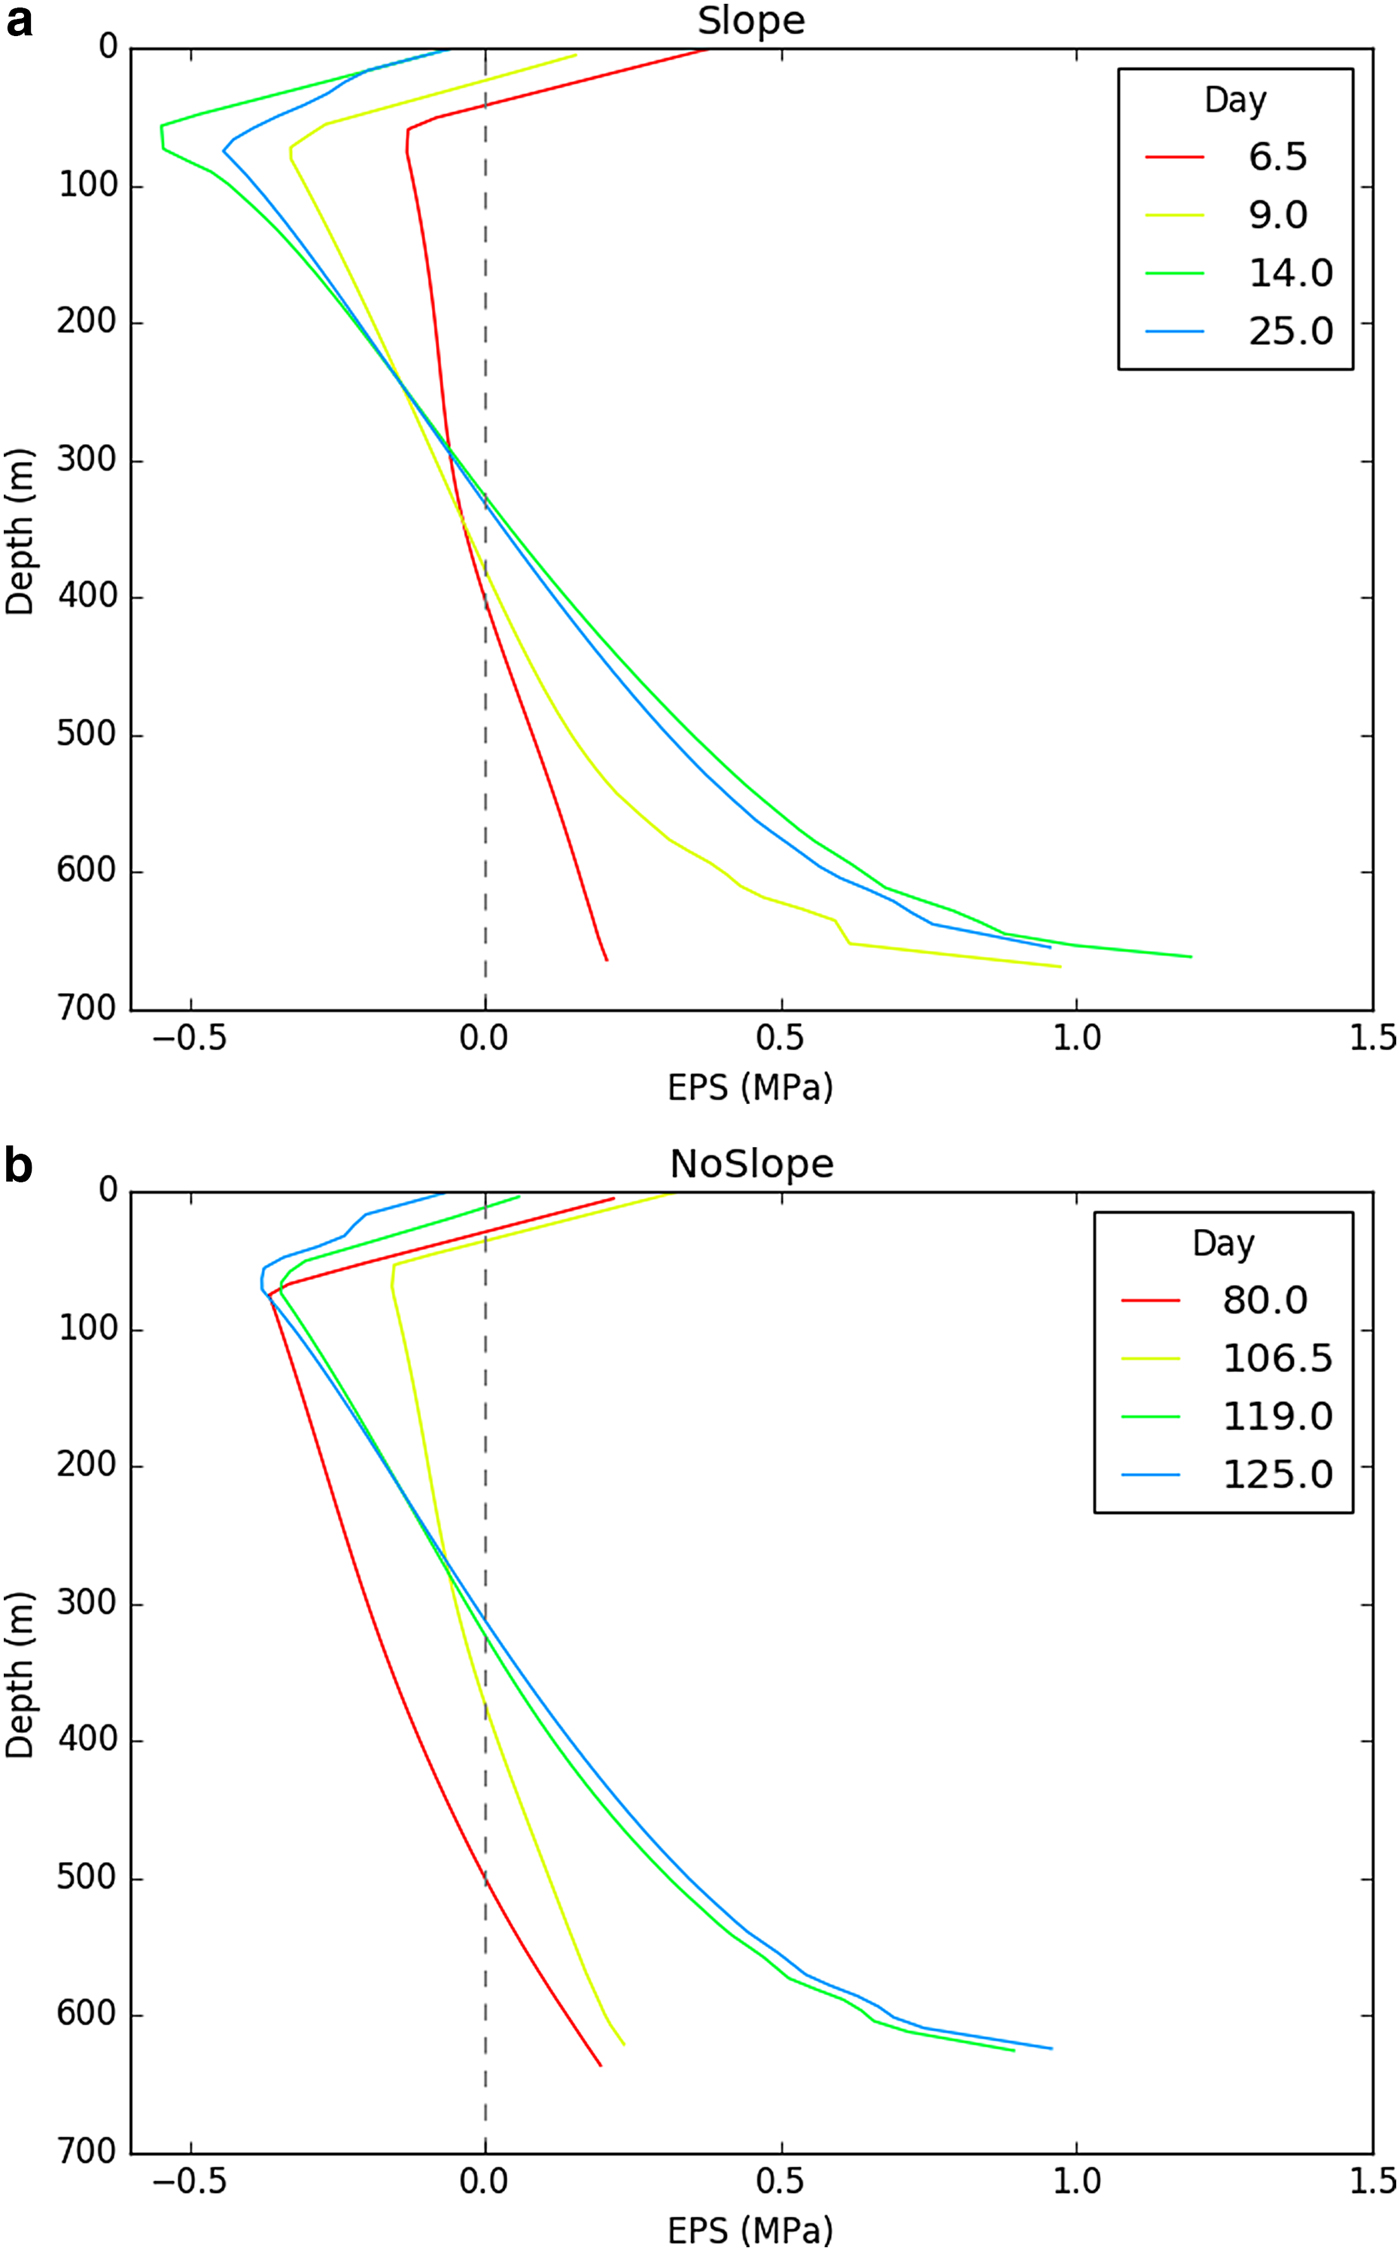
Figure 9 shows vertical transects of EPS above the (moving) ungrounding point, for the time steps shown in Figure 6. In both the sloping and horizontal bed cases, progressive intensification of tensile stress at the bed is accompanied by increasingly compressive (or less tensile) stresses near the surface. (This can be seen in the disappearance of the surface layer of positive EPS in Figs 6a, b.) The HiDEM calving events occur when two conditions are met: (1) high tensile stresses at the bed (>0.9 MPa); and (2) compressive stresses at the surface (or almost so in the horizontal bed case). These conditions are diagnostic of large net buoyant forces on the glacier tongue, and can be used to identify situations in which basal crevasses will propagate upward through the full thickness of the glacier.
Vertical transects of effective principal stress above the ungrounding point for selected time steps in (a) the sloping bed case; (b) the horizontal bed case. Calving occurred in HiDEM for the ice geometries at 14 and 25 days (sloping bed) and 119 and 125 days (horizontal bed), but not at the earlier time steps.
5. DISCUSSION AND CONCLUSIONS
Clear and consistent patterns emerge from our experiments with HiDEM and Elmer/Ice, providing a robust baseline for a comprehensive understanding of calving processes and their environmental controls. Because HiDEM model output is sensitive to the stress threshold required to break beams and the density of discontinuities, the precise magnitudes of modelled calving events are not necessarily representative of natural conditions. However, the results reliably replicate observed calving styles, and allow us to investigate calving processes and their controls in unprecedented detail. Three contrasting calving mechanisms – ice-cliff failure, undercut calving and buoyancy-driven calving – emerge spontaneously from the HiDEM experiments in response to changes in the buoyancy condition D W/D F and undercut length U L. This demonstrates that calving processes form a continuous spectrum, with calving style varying in response to changing boundary conditions.
The possibility of both low- and high-magnitude calving events raises interesting questions about the long-term calving rate over multiple under-cutting/calving cycles. If an undercut increases in length by subaqueous melting, and low-magnitude events frequently remove part of the overhanging ice cliff, the long-term calving rate will simply equal the under-cutting rate. However, if low-magnitude events are rare and an undercut is able to reach the size required for high-magnitude calving, then the calving multiplier effect means that the long-term calving rate will be greater than the subaqueous melt rate.
The low-magnitude calving events modelled in HiDEM reflect the location and orientation of pre-existing cracks in the ice. In areas of higher than average fracture density, loss of support from beneath due to under-cutting is sufficient to initiate calving. The contingent nature of these events means that they are not amenable to analysis in Elmer/Ice. However, such events appear to be very common in the highly fractured ice typical of real tidewater glacier fronts.
Our results show that for sufficiently large undercuts calving lengths may be several times the undercut length, confirming the calving multiplier effect proposed by O'Leary and Christoffersen (Reference O'Leary and Christoffersen2013). Large undercuts may be prevented from forming, however, by frequent low-magnitude calving events. This process may dominate on glaciers in Svalbard and Alaska, where calving rates are strongly correlated with ocean temperature, and frequent small calving events are observed (Bartholomaus and others, Reference Bartholomaus, Larsen, O'Neel and West2012; Åström and others, Reference Åström2014; Luckman and others, Reference Luckman2015). Although subaqueous melt rates may be several metres per day in these regions, undercuts may never grow large enough to allow the calving multiplier effect to kick in. A high frequency of low-magnitude events may also reflect relatively weak ice, possibly due to relatively high temperature and/or damage advected from up-glacier. In contrast, undercuts extending tens to hundreds of metres below the ice have been observed beneath several Greenland glaciers (Rignot and others, Reference Rignot, Fenty, Xu, Cai and Kemp2015). This may reflect the fact that these glaciers are close to buoyancy and the correspondingly small effect of under-cutting on glacier stability (Fig. 2). Indeed, for super-buoyant glaciers, melt under-cutting is a stabilizing factor, keeping the glacier front closer to hydrostatic equilibrium. These considerations may partly explain the varying sensitivity of glacier termini to incursions of warm water (cf. Truffer and Motyka, Reference Truffer and Motyka2016).
The development of super-buoyant conditions by rapid surface ablation or rapid increases in lake level is well documented and uncontroversial (Warren and others, Reference Warren, Benn, Winchester and Harrison2001; Boyce and others, Reference Boyce, Motyka and Truffer2007). However, the dynamic causes of super-buoyancy on fast-flowing Greenland glaciers are less well understood (James and others, Reference James, Murray, Selmes, Scharrer and O'Leary2014; Wagner and others, Reference Wagner, James, Murray and Vella2016). Our time-evolving simulations with Elmer/Ice indicate that super-buoyant conditions can develop by either ice flow into deepening water or dynamic thinning. The modelled sequences of frontal uplift, fracture propagation and block detachment are closely similar to observed buoyancy-driven calving events at Helheim Glacier and elsewhere (e.g. James and others, Reference James, Murray, Selmes, Scharrer and O'Leary2014; Wagner and others, Reference Wagner, James, Murray and Vella2016). In our simulations, ungrounding of the terminus occurs when the super-buoyant part of the tongue is hundreds of metres long, leading to large tensile EPS at the ungrounding point. When high tensile stresses at the bed coincide with compressive stresses at the surface, basal fractures are able to propagate upward through the full thickness of the glacier. Additional high-stress regions may occur in the detaching block in response to interactions with the bed, encouraging block disintegration and overturn.
Crevasse-depth calving laws implemented in Elmer/Ice predict similar calving lengths to the HiDEM simulations in some instances (Fig. 2), but in the majority of cases we tested both waterline and full-thickness crevasse depth calving laws under-predict melt- and buoyancy-driven calving relative to the HiDEM results. This highlights the importance of fracture-stress feedbacks in these calving processes, and the limitations of ‘static’ stress calculations that do not consider the effect of fracturing on the remaining intact ice. However, our analyses show that it is possible to circumvent this problem and predict both under-cutting- and buoyancy-driven calving using criteria based on stress patterns (Figs 5, 9). In the melt undercut cases, under-cutting leads to an intensification of compressive stresses at the bed behind the front, and calving occurs when EPS in this region is ~−0.15 MPa. For the super-buoyant cases, calving is triggered when EPS at the bed exceeds 0.9 MPa and EPS is negative at the surface. The precise timing and magnitude of HiDEM calving events depend on the choice of model setup, so formal definition of calving criteria will require systematic testing of model results against observations.
Developing equivalent criteria for predicting these calving processes in glacier models with simpler stress formulations presents considerable challenges. The ‘shelfy stream’ models currently used to predict calving glacier evolution use vertically integrated stress formulations and assume buoyant equilibrium of ungrounded portions (Nick and others, Reference Nick, van der Veen, Vieli and Benn2010; Enderlin and others, Reference Enderlin, Howat and Vieli2013; Lea and others, Reference Lea2014; Morlighem and others, Reference Morlighem2016). These models thus lack the information we used to diagnose melt- and buoyancy-driven calving in Elmer/Ice. ‘Shelfy stream’ models can represent subaqueous melting by applying uniform melt rates to glacier fronts, but they cannot incorporate the effects of under-cutting on glacier stresses and possible calving multiplier effects. These models, therefore, currently have an inbuilt insensitivity to ocean forcing. In contrast, crevasse depth calving laws exhibit high sensitivity to water depth in surface crevasses (Cook and others, Reference Cook, Zwinger, Rutt, O'Neel and Murray2012), which has led to the use of crevasse water depth as tuning parameter to scale glacier response to climate forcing (e.g. Lea and others, Reference Lea2014; Pollard and others, Reference Pollard, DeConto and Alley2015). The sensitivity of crevasse depth calving laws to water in surface crevasses, and their insensitivity to subaqueous melting may have led to an over-emphasis of surface melt as a driver of past and future calving retreat (e.g. Lea and others, Reference Lea2014).
The combination of HiDEM and Elmer/Ice used in this paper provides a powerful new approach to understanding calving processes. Analysis of stress patterns associated with HiDEM calving events allows formulation of new, physically-based calving criteria, overcoming the limitations of calving laws that are based on idealized conceptions of calving processes. Once thoroughly tested against observations, such criteria may open the way to reliable representation of melt- and buoyancy-driven calving in predictive models.
ACKNOWLEDGEMENTS
This work was funded by the ConocoPhillips Northern Area Program (CRIOS: Calving Rates and Impact on Sea Level) and the Nordic Research Council (SVALI: Stability and Variation of Arctic Land Ice and eSTICC: eScience Tools for Investigating Climate Change in northern high latitudes). Careful reviews by Martin Lüthi and an anonymous referee helped improve the manuscript.


 Open access