


Inequality is one of the defining challenges of our time and the question of who gets what and why once again entered center stage in the politics of the 21st century. Rising inequality even threatens our very understanding of democracy. A growing body of literature shows that elected policymakers and policy outcomes are biased towards the rich (Bartels, Reference Bartels2008; Gilens, Reference Gilens2012; Schlozman et al., Reference Schlozman, Brady and Verba2018), and that unequal policy responsiveness is just as pronounced in Germany and The Netherlands as it is in the US (Elsässer et al., Reference Elsässer, Hense and Schäfer2020; Schakel, Reference Schakel2021). Yet, Western European democracies also have large welfare states that redistribute a considerable amount of income. Given the pro-rich bias we observe in policy-making, and building on standard material self-interest theories of support for redistribution, it is puzzling why the rich would pay the costs for redistribution (see Elkjaer and Iversen, Reference Elkjaer and Iversen2020 who have made a similar point). The answer I am providing in this article builds on an emerging literature on fairness and other-regarding preferences (e.g., Alesina and La Ferrara, Reference Alesina and La Ferrara2005; Dimick et al., Reference Dimick, Stegmueller and Rueda2016; Rueda and Stegmueller, Reference Rueda and Stegmueller2019). The novel point I make is that differences in the configuration of the welfare state have consequences for fairness considerations, and I argue that this matters for the preferences of the rich.
Welfare states always combine two distinct objectives. One is to equalize incomes between the rich to the poor at a given point in time (redistribution), the other is to protect individuals against economic risks and income loss at some future point in time (social insurance) (see Titmuss, Reference Titmuss1974; Flora and Heidenheimer, Reference Flora and Heidenheimer1981). Although these two objectives, in principle, operate independently of each other, welfare states differ fundamentally in the understanding of what the purpose of social insurance should be, and this has implications for the redistribution side of the welfare state. Most relevant differences go back to Beveridge and Bismarck. Welfare states in the Beveridgean tradition build on social solidarity and the idea that “[s]ocial insurance should aim at guaranteeing the minimum income needed for subsistence” (Beveridge Reference Beveridge1942, 13f). Social insurance is governed by a flat-rate principle and equalizes given income differences between the rich and the poor during periods of economic downturn. The Bismarckian welfare state, in contrast,“is commonly considered reactionary, Bonapartist and unsolidaristic” (Baldwin Reference Baldwin1990, 61). It provides social benefits in proportion to previous earnings and maintains market hierarchies during periods of economic hardship.
Differences in the social insurance design have direct implications for fairness considerations. While the Beveridgean welfare state eliminates income inequality in response to economic risks, even if given income differences are in parts considered fair based on a meritocratic principle, the Bismarckian welfare state emphasizes income stability and stabilizes fair (merit-based) and unfair (luck-based) income differences. Social insurance in the Beveridgean tradition is then redistributive per design, while social insurance in the Bismarckian tradition is strictly separated from the redistribution objective of the welfare state (see Casamatta et al., Reference Casamatta, Cremer and Pestieau2000 for a formal approach). This is important because we already know from behavioral research that other-regarding preferences matter for explaining support for redistribution, and that people are more likely to demand redistribution if they believe that existing inequality results from an unfair process (e.g., Cappelen et al., Reference Cappelen, Hole, Sørensen and Tungodden2007; Lefgren et al., Reference Lefgren, Sims and Stoddard2016; Almås et al., Reference Almås, Cappelen and Tungodden2020; Mijs, Reference Mijs2019). Structural differences in the social insurance design then speak to fairness considerations by determining the stability of fair and unfair income differences in some future event of income loss. I argue that the other-regarding rich take those fairness implications related to the social insurance design into account when forming preferences for redistribution, and that this could help to explain why the rich support more redistribution in some welfare states than in others.
In this article, I focus on support for redistribution defined as a means to correct for unfair market outcomes. I strictly differentiate between demand for redistribution and demand for social insurance. While redistribution is about the present and reduces income inequality at a given point in time, social insurance is about the future and protects individuals from future economic hardship. My argument builds on differences in how welfare states organize the provision of social insurance, and my interest lies in explaining how the rich respond to these differences in terms of demanding redistribution.
Furthermore, I am most interested in explaining redistribution preferences of the rich. This has two reasons. First, previous research has already shown that other-regarding preferences matter most for the preferences of the rich. In what they name “income-dependent altruism”, Dimick et al. (Reference Dimick, Stegmueller and Rueda2016) theorize that the rich value an additional unit of income less than the poor, and can therefore afford to care about the well-being of others. They find that the rich indeed react more strongly to rising levels of inequality when compared to the poor (see also Rueda, Reference Rueda2018; Rueda and Stegmueller, Reference Rueda and Stegmueller2019). These more recent other-regarding approaches have implications for standard political economy explanations. My argument directly speaks to the social insurance model for redistribution preferences. Here, the assumption is that the rich are primarily concerned about their own material well-being and that they support high levels of redistribution if they expect to be poor themselves in the future (most influentially, Varian, Reference Varian1980; Iversen and Soskice, Reference Iversen and Soskice2001; Moene and Wallerstein, Reference Moene and Wallerstein2001). The argument I propose yields the exact opposite conclusion.Footnote 1 With other-regarding individuals who respond to considerations of fairness, and a strict differentiation between the redistribution and social insurance side of the welfare state, the rich would support higher levels of redistribution if they expect to be rich in the future (meaning that existing income hierarchies are fairly stable over time).
Second, the institutional logic I am referring to applies to high-income earners only. The proportion of income being replaced if benefits are handed out on a flat-rate basis decreases as income increases, while the proportion of replaced income is relatively stable in earnings-related systems. Differences in the social insurance design then define the degree to which the rich are included in the welfare state. In addition, given that the poor benefit less directly from the welfare state in earnings-related systems (which is in line with the Bismarckian insurance principle and the idea of protecting existing market hierarchies) they might, just like the rich, demand higher levels of redistribution in earnings-related systems. Behavioral motives that explain support for redistribution among the poor would then be quite different, even though they lead to similar observable implications.
I provide evidence for my argument by combining observational data with a laboratory experiment. For the observational part, I use the OECD tax-and-benefit calculator to compute an original institutional indicator to measure structural differences in the social insurance design. I then link the institutional indicator to European Social Survey (ESS) attitudinal data and show that support for redistribution among the rich is higher in countries which more closely approximate the earnings-related principle. The laboratory experiment allows me to test for causality, namely, whether differences in the social insurance design influence redistribution preferences via fairness considerations. I vary the the degree to which social benefits replace previous endowments (flat-rate versus earnings-related systems), and guarantee that participants do not benefit themselves from their redistribution choices. Results show that the social insurance design influences transfer decisions. Other-regarding participants reduce inequality more if given endowment differences are maintained in the case of loss (capturing the earnings-related principle).
1 The social insurance design and preferences for redistribution
In the sections to follow, I argue that structural differences in the social insurance design have consequences for fairness considerations and this influences support for redistribution among the rich. I derive my argument in three steps. First, I introduce two key behavioral components relevant for my argument: (1) other-regarding preferences and fairness considerations, and (2) time and future expectations. Second, I relate aspects of the labor market to fairness considerations. In the third step, I propose that the governing principle of social insurance speaks to these fairness considerations and that this matters most for the preferences of the rich. I provide an explanation for why the rich support higher levels of redistribution in some welfare states than in others.
1.1 Other-regarding preferences, fairness considerations and future expectation
My argument relies on two behavioral components. The first one is that other-regarding preferences matter for explaining support for redistribution. Experimental evidence, mainly from behavioral economics, suggests that a large share of the population is concerned about the well-being of the worse-off (Charness et al., Reference Charness and Rabin2002; Engelmann and Strobel, Reference Engelmann and Strobel2004) and about equality (Fehr and Schmidt, Reference Fehr and Schmidt1999; Bolton and Ockenfels, Reference Bolton and Ockenfels2000). Most important for the argument I propose, this research also shows that fairness considerations are important to understand other-regarding preferences. Cappelen et al. (Reference Cappelen, Hole, Sørensen and Tungodden2007) study fairness in complex allocation problems and find that people adhere to fairness ideals when deciding on how to share a produced outcome with others. Almås et al. (Reference Almås, Cappelen and Tungodden2020) more recently find that fairness considerations travel well beyond the controlled environment of the laboratory and matter for understanding other-regarding behavior in the broader population. Some people show little concern for fairness and do not redistribute at all (about 20 percent of the full sample), but the majority of the population in two countries (Norway and the United States) responds to fairness consideration and rejects inequalities that arise from luck and factors that go beyond individual control (Almås et al., Reference Almås, Cappelen and Tungodden2020).
An important point to make here is that this literature normally thinks of behavioral types, with some types being selfish and never responding to fairness considerations, while others show concerns for the well-being of the worse-off and adhere to different understandings of fairness (Fisman et al., Reference Fisman, Jakiela and Kariv2017; Epper et al., Reference Epper, Fehr and Senn2020; Kerschbamer and Müller, Reference Kerschbamer and Müller2020). While fairness arguments have been made in the political economy literature before (e.g., Alesina and La Ferrara, Reference Alesina and La Ferrara2005), the idea that fairness concerns only matter to people who care about the well-being of others in the first place has not been spelled out clearly. The distinction is crucial from a theoretical point of view. Arguing that it is the other-regarding individuals who respond to considerations of fairness and take into account institutionally defined fairness implication is very different from arguing that the selfish rich become altruistic depending on the institutional arrangement of social insurance. Furthermore, Dimick et al. (Reference Dimick, Stegmueller and Rueda2016) theorize that the rich value an additional unit of income less than the poor, and can therefore afford to care about the well-being of others. They show empirically that inequality indeed matters more for the rich than the poor (see also Rueda, Reference Rueda2018; Rueda and Stegmueller, Reference Rueda and Stegmueller2019). Building on this emerging body of research, fairness-related arguments then apply most directly to the preferences of the other-regarding rich.
The second behavioral component I build on relates to time and future expectations. Social insurance is about the future. It replaces lost income and stabilizes individual incomes over the life-cycle. Arguing that people respond to differences in the social insurance design means that people need to take the future into account when forming preferences for redistribution in the first place. Previous literature already emphasizes the importance of future income expectations when explaining redistribution preferences. Most influentially, the social insurance model argues that the rich are primarily concerned about their own material well-being (building on the Meltzer–Richard model for redistribution preferences, see Meltzer and Richard, Reference Meltzer and Richard1981) and support redistribution if they expect to be poor themselves in the future (Varian, Reference Varian1980; Sinn, Reference Sinn1995; Iversen and Soskice, Reference Iversen and Soskice2001; Moene and Wallerstein, Reference Moene and Wallerstein2001; Mares, Reference Mares2003; Rehm, Reference Rehm2009, Reference Rehm2016; Alt and Iversen, Reference Alt and Iversen2017). Further studies outside the social insurance framework have emphasized the relevance of expected life-cycle income and prospects for upward or downward mobility for understanding redistribution preferences (see Rueda and Stegmueller, Reference Rueda and Stegmueller2019, following Piketty, Reference Piketty1995; Benabou and Ok, Reference Benabou and Ok2001; Alesina and La Ferrara, Reference Alesina and La Ferrara2005).
The theoretical argument I propose unites these two behavioral components. It suggests that the other-regarding rich not only respond to their own future income expectations when forming preferences for redistribution, but that they also consider how much the social insurance system contributes to the stability of individual incomes and thereby the degree to which income hierarchies are maintained over time. I combine future expectations with considerations of fairness and propose that the other-regarding rich support higher levels of redistribution in earnings-related welfare states that maintain given income differences in the case of loss. I will elaborate on the importance of labor market dynamics and the welfare state in the next sections.
1.2 The labor market, fair and unfair inequality, and risk exposure
Certain aspects of the labor market directly speak to the behavioral components introduced in the previous section. One aspect is that labor market earnings result from effort and productivity on the one hand, and from factors that go beyond individual control on the other. Most influentially, Alesina and Angeletos (Reference Alesina and Angeletos2005) show that beliefs about the fairness of given income inequality influences redistribution preferences. The expectation is that a society chooses high levels of redistribution if it believes that luck, birth, connections, and/or corruption determine wealth. More recently, Alesina et al. (Reference Alesina, Stantcheva and Teso2018) relate intergenerational mobility to fairness beliefs and show that Europeans are more pessimistic about mobility and also tend to favor more generous redistribution policies than Americans. My argument builds on this literature but goes further by expecting that, first, not only past mobility but also considerations of future dynamics in the income distribution influence redistribution preferences (most recently, Rueda and Stegmueller, Reference Rueda and Stegmueller2019), and second, that even when holding cross-country differences in fairness beliefs constant, differences in the institutional arrangement of social insurance matter for redistribution preferences because they determine the stability of fair and unfair income differences in future periods.
This leads to the second labor market aspect that is relevant for the argument I propose: risk exposure. One driving force in the development of the modern welfare state was the demand for socio-economic security (e.g., Flora and Heidenheimer, Reference Flora and Heidenheimer1981). Social insurance evolved as a response to new risks that had emerged in modern industrialized societies, and its purpose was to reduce the role of luck in determining individual incomes (see Rosanvallon, Reference Rosanvallon2013). Risk still plays a key role in labor market politics. Most importantly, risk exposure goes, at least to some extent, beyond individual control (one can think of changes in the occupational structure due to automation, robotization, and technological progress, or economic recessions such as the 2008 financial crisis). Labor market risks would then eliminate both fair and unfair income differences if individuals indeed lost their incomes due to an economic shock.
It follows from here that fairness considerations have a time component. Income differences can be considered fair at a given point in time, but unfair in the long run if people lose their incomes due to economic shocks. Social insurance systems differ in how they respond to such shocks, and this has implications for the stability of fair and unfair income differences. Demand for redistribution at a given point in time therefore needs to be assessed with regard to differences in the social insurance design. I elaborate in the next section.
1.3 The social insurance design and future fairness
The welfare state has historically played a crucial role in distributing incomes between the rich and the poor (redistribution) and in insuring workers against risks inherent to the workplace (social insurance) (Titmuss, Reference Titmuss1974; Flora and Heidenheimer, Reference Flora and Heidenheimer1981). While redistribution is about the present and reduces income inequality at a given point in time, social insurance is about the future and protects individuals from future economic hardship. Welfare states differ fundamentally in how they organize the provision of social insurance and this has implications for the redistribution side of the welfare state. Welfare states in the Beveridgean tradition build on the principle of social solidarity and provide social benefits in equal amounts to everyone in need. Social insurance is governed by a flat-rate principle, and the poor and the unemployed receive the same total amount of benefits. Income differences between the rich and the poor are fully eliminated in the case of income loss. The Bismarckian welfare state, in contrast, emphasizes income stability. It provides benefits in proportion to previous earnings. Social insurance is governed by an earnings-related principle. The rich are still better off than the poor in the case of income loss, and a given distribution of income is maintained during periods of economic hardship (see Baldwin, Reference Baldwin1990 for a summary on these different understandings of the welfare state). The need to correct for currently unfair income differences via redistribution therefore relates to the question of how stable given income differences are over time when taking into account risk of future income loss.
Given that people not only look at a given point in time when forming preferences for redistribution, but take into account how stable incomes are over time, and that fairness considerations indeed matter, structural differences in the arrangement of social insurance are likely to matter for preference formation. If social insurance is governed by the earnings-related principle, both fair and unfair income differences are maintained over time. With similar beliefs about fairness in a given distribution of incomes, the need to correct for unfair income differences via redistribution is therefore higher in earnings-related as compared to flat-rate systems.
I focus my fairness argument to the preferences of the rich (for reasons given in the introduction). With a strict differentiation between the social insurance and the redistribution objective of the welfare state, the rich are least likely to benefit themselves from demanding additional redistribution in earnings-related systems. If we still observe support for redistribution in these systems, this points towards the relevance of other-regarding concerns. Taken together, I expect support for redistribution among the other-regarding rich to be higher in earnings-related systems as compared to flat-rate systems, and I argue that this has to do with fairness considerations.
2 Data and methods
In the empirical section, I test whether cross-national patterns in redistribution preferences support the argument I make, and whether the mechanism I propose explains some of the observed variation. I combine an observational analysis with a laboratory experiment. I use the OECD tax-and-benefit calculator to compute an original institutional indicator measuring the degree to which social benefits are structured along the earnings-related principle. Attitudinal data come from the European Social Survey (ESS). While the observational analysis helps me to reveal general empirical patterns, it is limited when it comes to isolating my argument from competing explanations. One issue is that people have difficulties separating the social insurance and redistribution side of the welfare state (see Barber et al., Reference Barber, Beramendi and Wibbels2013). Demand for redistribution could be driven by selfish motives as described by the social insurance framework. Another issue is that support for government spending in earnings-related systems relates to the fact that those systems also provide better social services and public goods (e.g., Busemeyer and Iversen, Reference Busemeyer and Iversen2020). Finally, welfare states rarely change the structure of the social insurance system. Hence, my main explanatory variable is time-invariant and all the variance I can exploit is between countries. In light of all those limitations in observational data, I use this part of the analysis to test whether variation in support for redistribution among the rich indeed relates to structural differences in the social insurance design. In order to get closer to causality, I move to the laboratory.
I modify a within-subject dictator game to test how structural differences in the social insurance design influence transfer decisions in a controlled setting. In the experiment, participants receive an endowment which is high or low and they face a risk of endowment loss. In the case of loss, they receive social benefits that replace parts of the initial endowment. Most importantly, benefits are either related to previous endowments (capturing the earnings-related principle) or handed out in equal amounts to everyone (flat-rate principle). Replacement rates in the experiment are based on observed values taken from my benefit concentration indicator in order to guarantee a close match between the two parts of my empirical study.
Several specifications of the experiment further help me to circumvent limitations related to observational data. Most importantly, I strictly differentiate between social insurance-related mechanisms and redistribution. Three aspects are important here. First, decision-makers never benefit themselves from their redistribution decisions. Second, participants do not switch roles and each allocation problem is independent of previous decisions (to block the reciprocity channel). And third, participants are monetarily incentivized and their redistribution decisions have an immediate effect on their own payoff. Other-regarding preferences have an actual cost (Morton and Williams, Reference Morton and Williams2010 on experimental political science). Furthermore, the experiment allows me to differentiate between selfish and other-regarding individuals. Fairness arguments only apply to participants who are concerned about the well-being of others in the first place. Strictly speaking, my experimental analysis assesses how other-regarding participants respond to the social insurance design. I allocate endowments based on luck. Differences in the governing principle of social insurance then create variation in the stability of unfair endowment differences. Finally, one out of multiple redistribution decisions is chosen at random and contributes to final payments. Even if decision-makers are using their allocations to the other participants as a signal for support of a specific institutional arrangement, this has no influence on outcomes, neither in terms of payoffs nor on how the experiment proceeds.
Taken together, the question I seek to answer with the experiment is how much a rich participant (the decision-maker) redistributes to another poor participant (the recipient) when the level of unfairness in the allocation of endowments is constant, but the governing principle of social insurance varies. Fairness then speaks to the question of whether institutions interact with an unfair initial allocation of endowments, rather than whether the source of endowment differences matters.
In order to reduce the effect of individual labor market experiences, I conduct the experiment with undergraduate students and I use abstract language to guarantee that people respond to the logic of the allocation problems and not to own previous experiences.
3 Cross-national analysis of preferences for redistribution
In the observational analysis, I first show that there is substantial variation in support for redistribution across advanced European welfare states. I then construct a benefit concentration indicator to measure differences in the structure of social insurance across European welfare states. The observational analysis reveals a strong link between support for redistribution among the better-off parts of society and differences in the social insurance design. Average support for redistribution among the rich is higher in earnings-related systems which maintain given income differences in the case of future income loss.
3.1 Observational data
Survey data come from the ESS and includes measures for redistribution preferences and for individual income. The analysis covers 15 advanced Western European welfare states: Austria, Belgium, Denmark, Germany, France, Finland, Ireland, Italy, Netherlands, Norway, Portugal, Spain, Sweden, Switzerland, and Great Britain. I draw data from seven rounds, covering the time period from 2002 to 2014.Footnote 2 Missing data are addressed with multiple imputation (King et al., Reference King, Honaker, Joseph and Scheve2001). Each imputed data set contains 184,292 observations. More information isgiven in Section A in the Appendix.
3.2 Preferences for redistribution
I use the most prominent indicator for redistribution preferences included in the ESS asking respondents whether they agree or disagree to the statement that the government should take measures to reduce differences in income levels (e.g., Rueda and Stegmueller, Reference Rueda and Stegmueller2016, see also Alt and Iversen, Reference Alt and Iversen2017 for a comparable measure). The item is measured on a five-point strongly agree to strongly disagree scale. I reverse the scale to ease interpretation. High values correspond to strong agreement. I measure support for redistribution preferences among respondents who earn more than the mean income in each country. Specifications of the income indicator can be found in Section A in the Appendix.
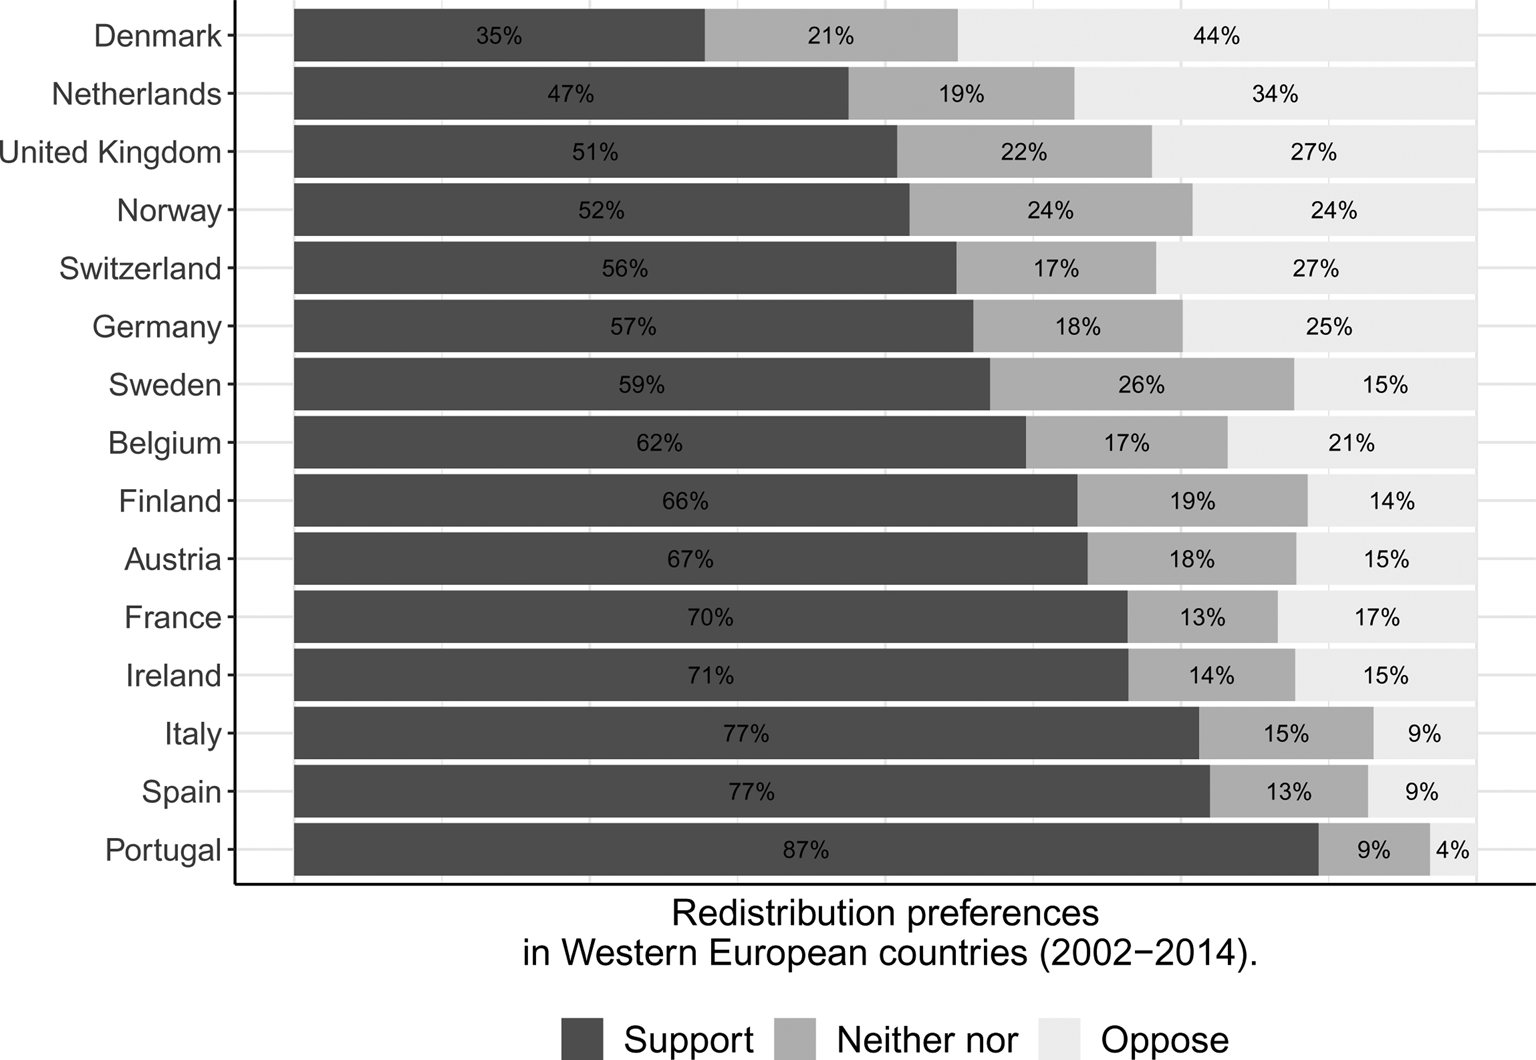
More than 60 percent of respondents who earn more than the average earner in each country respectively either agree or strongly agree with the statement that government should take measures to reduce income differences (support redistribution). Only about 20 percent disagree or strongly disagree with the same statement (oppose redistribution).
Figure 1 shows that average levels of support for redistribution vary strongly across advanced European welfare states when looking at those with an above-mean income (values are averaged over the five multiply imputed data sets and over the time period 2002–2014). Average support for redistribution is low in countries like Denmark or the United Kingdom, and high in France or in Portugal.
Support for redistribution across advanced European welfare states (above mean earners, 2002–2014).
3.3 Social insurance and benefit concentration
I compute a benefit concentration indicator in order to measure structural differences in the social insurance design. The indicator captures whether countries more closely follow the earnings-related or the flat-rate principle in the provision of social insurance (for a similar approach, see Beramendi and Rehm, Reference Beramendi and Rehm2016; Beramendi and Stegmueller, Reference Beramendi and Stegmueller2019). Data come from the Benefits and Wages series of the OECD, which quantifies complicated interactions of tax and benefit systems for different family types and labor market situations.Footnote 3 The tax-benefit calculator applies these rules to a range of prototypical income earners and allows for comparisons of how tax liabilities and benefit entitlements affect the disposable income of individuals and families in different labor market circumstances. I extract information on social benefits made available if a person becomes unemployed and calculate the proportion of previous income that is being replaced (unemployment replacement rate) over different levels of in-work income within countries and within similar in-work income between countries.
In order to measure structural differences, I plot replacement rates against rank-ordered income groups and compute an indicator for benefit concentration (Beramendi and Rehm, Reference Beramendi and Rehm2016; Kakwani, Reference Kakwani1977; Beramendi and Stegmueller, Reference Beramendi and Stegmueller2019). Calculation details are in Section B in the Appendix.Footnote 4
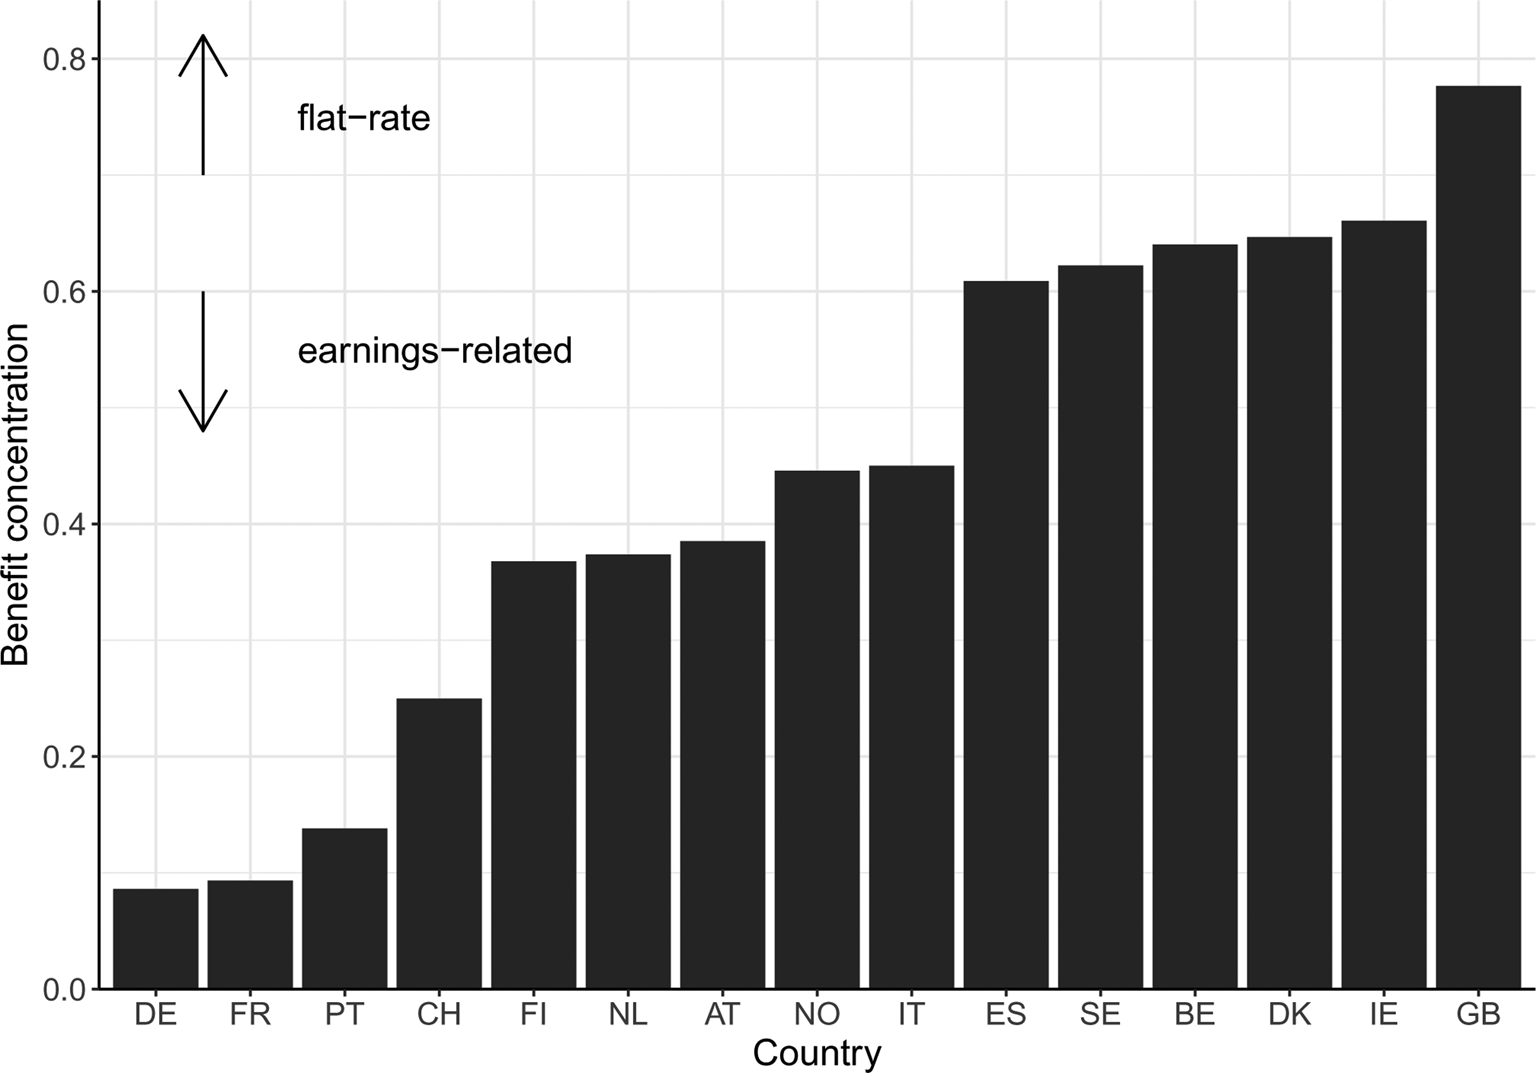
Figure 2 illustrates the calculated values of the benefit concentration indicator for each country, averaged over the time period 2002–2014 and over both prototypical family types (single with no children, and married with two children and the spouse earning 67 percent of the average wage). If social insurance follows the flat-rate principle, those at the top of the income ladder receive lower replacement rates than those at the bottom. In an earnings-related systems, replacement rates are constant over the income ladder. Higher values in the concentration coefficient indicate close alignment with the flat-rate principle. This means that the rich and the poor receive the same total amount of benefits if unemployed, irrespective of their previous earnings.Footnote 5
Benefit concentration indicator across countries.
Previous research normally builds on two kinds of measures to capture welfare state generosity. The first, and most commonly used indicators focus on outcomes. They build either on social policy expenditures as a share of GDP (Huber and Stephens, Reference Huber and Stephens2001; Brooks and Manza, Reference Brooks and Manza2006), or actual levels of redistribution achieved by calculating the difference between pretax-pretransfer inequality and posttax-pretransfer inequality (either in general or related to different instruments) (Kenworthy and Pontusson, Reference Kenworthy and Pontusson2005; Mahler and Jesuit, Reference Mahler and Jesuit2006). Those outcome-based measures tend to conflate generosity with need. This is because social policy expenditures and generosity are higher both if programs are structured more generously but also if more people take up benefits (e.g., with a higher share of the elderly population). Other indicators take differences in the structure of the welfare state into account (Esping-Andersen, Reference Esping-Andersen1990; Korpi and Palme, Reference Korpi and Palme1998; Jaeger, Reference Jaeger2006; Scruggs and Allan, Reference Scruggs and Allan2006) but are limited because they normally are calculated for a fictive production worker with average wage and tell little about the concentration of benefits along the income distribution (Scruggs and Allan, Reference Scruggs and Allan2006). My indicator, in contrast, covers different points of the income distribution and captures whether social insurance programs more closely follow the earnings-related or flat-rate principle in organizing social insurance. In Section B in the Appendix, I plot the benefit concentration indicator against alternative welfare state indicators (social spending, top income tax, fiscal transfers via transfers, and target efficiency).
3.4 The social insurance design and preferences for redistribution
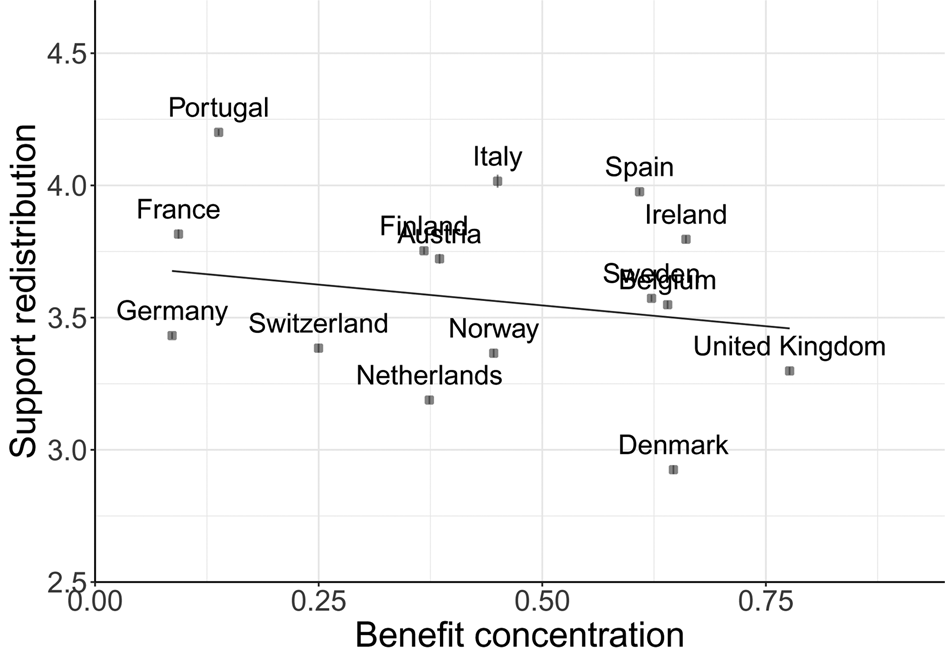
Figure 3 plots the relationship between preferences for redistribution and structural differences in the social insurance design across European welfare states. I relate average support for redistribution among respondents who earn more than the average earner in each country to benefit concentration (averaged over 2002–2014). Here I find a clear pattern, average support declines if benefits become more concentrated toward the poor (as it is the case in flat-rate systems). In other words, support for redistribution declines if income differences are equalized during periods of economic hardship. Note that the purpose of the figure is to show that there is an empirical relationship between support for redistribution and benefit concentration. While I provide a more thorough empirical analysis in Section C in the Appendix, I also re-emphasize in the same appendix section how data limitations make a more advanced observational analysis difficult. My main focus lies on the experiment when it comes to questions related to causality. In the following, I test whether the observed cross-national patterns I find might indeed relate to differences in the social insurance design.
Average support for redistribution and benefit concentration (above mean earners, 2002–2014). Note: Computation based on one full data set, sampled without replacement from the five multiply imputed data sets.
4 Laboratory experiment
In order to test the theoretical argument in this article more thoroughly, I designed an allocation game and ran ten sessions in two laboratories. In total, 174 people participated in the experiment, from which I collected a total of 2784 observations. Participants were students at the University of Mannheim and the University of Heidelberg. One session hosted between 12 and 22 subjects and lasted for 45–60 min. Participants earned between 6 and 20 Euros, with an average of 10 Euros. We used ORSEE to invite students to take part in the study (Greiner, Reference Greiner2015). The experiment was programmed in the experimental software z-Tree (Fischbacher, Reference Fischbacher2007).
4.1 Experimental design
The main part of the experiment consists of an allocation game that captures structural differences in the social insurance design. The allocation game is based on a modified within-subject dictator game with lotteries. Initial endowments are defined by luck and are either high (rich decision-maker) or low (poor recipient) and decision-makers never benefit themselves from their redistribution decisions. Endowments are subject to lotteries, which induce risk of loss (high or low). In the case of loss, social benefits replace parts of the initial endowment. I vary replacement rates to be either high or low for both recipient and decision-maker (capturing the earnings-related principle) or to be high for the recipient and low for the decision-maker (capturing the flat-rate principle). For completeness, I also specify problems with low replacement rates for the recipient and high replacement rates for the decision-maker (capturing regressive benefits). In order to take account for alternative channels that could influence redistribution decisions, I further manipulate the absolute level of endowment (high or low) and the level of endowment inequality (high or low).
Based on these four modifications, I generate 16 unique allocation problems. Decision-makers decide for each problem whether they want to transfer shares of their endowment to the recipient. Variation in replacement rates is of key interest to my research question as they capture differences in the social insurance design. For example, one allocation problem combines high absolute endowment, low inequality, and high risk exposure. The replacement rate is high for the recipient but low for the decision-maker (allocation problem 9 in Table 1). Another allocation problem is similar in all other parameters but both the decision-maker and the recipient receive high replacement in the case of loss (allocation problem 8 in Table 1). The comparison between those two allocation problems maps empirically to a comparison between Germany or France (both countries implement the earnings-related principle in the Bismarckian tradition) and the United Kingdom (where benefits are handed out on a flat-rate principle in the Beveridgean tradition). Transfer decisions then reveal the effect that the governing principle of social insurance has on redistribution preferences. In addition, variation in absolute endowments and endowment inequality allows me to test the importance of the social insurance design vis-a-vis differences in individual well-being or differences in expected inequality. I thereby generate allocation problems that control for alternative mechanisms that previous research has shown to be important for redistribution decisions (e.g., Fehr and Schmidt, Reference Fehr and Schmidt1999 on inequity aversion and Dimick et al., Reference Dimick, Stegmueller and Rueda2016 on income-dependent altruism).
Experimental design
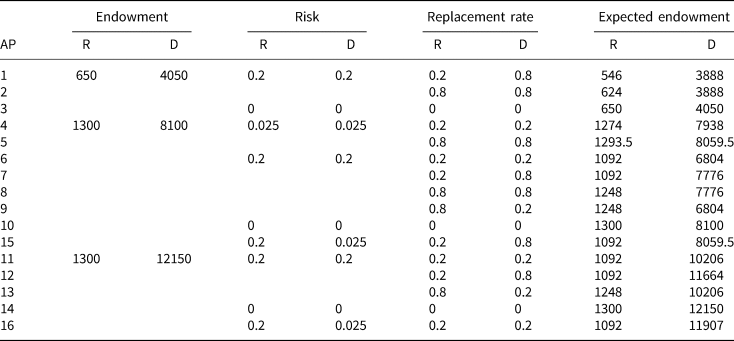
Note: AP refers to allocation problem, R refers to recipient and D refers to decision-maker.
I anchor the parameters for each allocation problem in empirical values observed across Western European countries. This is to guarantee a close match between the observational and the experimental approach. High replacement covers 80 percent of the initial endowment and approximates replacement rates for a married couple with two children in France with an earning of 200 percent of the average earner. Low replacement covers 20 percent and approximates the UK for a single income earner with no children. Risk exposure is either 20 percent in high risk problems or 2.5 percent in low risk problems. Germany has an unemployment rate of about 2.5 percent, and Greece about 20 percent for first stage tertiary education in 2013 (data come from the International Labor Organization). In the case of high absolute endowments and low levels of inequality, the decision-maker receives 8100 Tokens and the recipient receives 1300 Tokens. These endowments differences approximate the 5–95 income percentile difference in Germany for first stage tertiary education in 2013. In order to test for the importance of individual well-being in explaining support for redistribution, some allocation problems provide low levels of absolute endowments. Low endowments are half the amount of high endowment (4050 Tokens for the decision-maker and 650 Tokens for the recipient). To manipulate the level of inequality, I increase the endowment of the decision-maker by 50 percent in some of the high endowment problems. This leaves the poor with 1300 Tokens and the rich with 12150 Tokens, and approximates the rounded 5–99 income percentile difference in Germany (first stage tertiary education in 2013).
In order to abstract away from the substantive interest that the experiment seeks to capture, I combine several parameter values that are of little empirical interest but theoretically possible. For example, no existing welfare state provides regressive transfer which replace low incomes at a 20 percent rate and high incomes at a 80 percent rate.
Table 1 contains parameter constellation for each allocation problem in the experiment. Each decision-maker makes a transfer decision for each of the 16 allocation problems. Participants in the recipient role indicate preferences while decision-makers make their decision, but do not influence the outcome. Allocation problems are presented in random order and differ across laboratory sessions.
Decision-makers do not influence the stability of their own endowment with the allocation decisions they make, and recipients always receive the full transferred amount. For example, a decision-maker may receive 8100 Tokens and a recipient receives 1300 Tokens. Both are exposed to a risk of 20 percent of losing their endowment. If they lose their endowment, they receive 80 percent of their initial endowment. For the decision-maker, this means 6480 Tokens, for the recipient, it means 1040 Tokens (the expected endowment is 7776 Tokens and 1248 Tokens for decision-maker and respondent respectively). If the decision-maker decides to transfer 30 percent of his or her endowment to the recipient, he or she keeps 5670 Tokens. With a risk of 20 percent, she loses her remaining endowment and receives a replacement of 80 percent. This means, he or she receives 4536 Tokens. The recipient, in contrast, receives the full transferred amount. In this specific example, this means that after the transfer decision, the recipient has an endowment of 3730 Tokens. In the case of loss, he or she receives a replacement of 1040 Tokens from the initial endowment plus 2430 Tokens in transfers (3470 Tokens in total).
In each of the 16 allocation problems, the decision-maker's endowment after loss is higher than the recipient's endowment before loss (before transfer decisions are made).Footnote 6 The decision-makers are never as poor as the recipients. One outcome out of the 16 redistribution decisions is chosen at random and contributes to final payments. I describe the experimental procedure at length in Section D in the Appendix.Footnote 7
5 Analyzing experimental results
The results I present below are based on participants who are in the role of the decision-maker (recipients are not monetarily incentivized) and who reveal other-regarding preferences. I show that transfer shares are higher if given endowment differences are maintained in the case of loss (capturing the earnings-related principle). The following analysis is based on weighted transfer shares. A transfer share of 100 percent indicates endowment equalization.
5.1 Other-regarding preferences matter
Decision-makers reduce inequality on average by 23.18 percent (median = 16.11, mean = 23.18, SD = 24.83). Figure D.17 in Section D in the Appendix illustrates variation in averages across participants. 37 out of 87 participants transfer zero in at least five of the 16 allocation problems. Twenty-eight of those participants transfer zero amounts in at least half of the decisions, and 19 participants transfer nothing to the recipient in all allocation problems. I categorize those 37 participants who transfer nothing in at least five out of 16 decision allocation problems as selfish (inequality-reduction in percent: median = 0, mean = 5.56, SD = 11.36). The majority of participants (about 60 percent) reveals other-regarding preferences, with 50 participants transferring shares of their endowment to the poorer recipients (inequality-reduction in percent: median = 31.76, mean = 36.22, SD = 24.06).
5.2 The social insurance design influences transfer decisions
In the following, I demonstrate that the social insurance design influences transfer decisions. Those transfer decisions are not an artifact driven by inequality aversion or individual well-being, as I will show in the empirical analysis. I apply Wilcoxon signed-rank tests to conduct a paired difference test of repeated measurements. This nonparametric test does not assume that the samples are normally distributed and thereby helps to circumvent challenges of relatively small samples as common in laboratory experiments (see Keele et al., Reference Keele, McConnaughy and White2012).
Figure 4 provides three panels with two allocation problems respectively. Each panel is based on one allocation problem capturing the earnings-related principle (benefits are proportional to endowments) and another allocation problem capturing the flat-rate principle (equal lump-sum benefits for decision-maker and recipient). I choose those five out of the 16 allocation problems described in Table 1 that are most informative to test my hypothesis. This is because those five allocation problems most clearly relate to real-world variation in benefit systems while at the same time helping me to isolate alternative explanations (e.g., I compare transfers in allocation problem 2 versus 9 rather than 2 versus 1 because no existing welfare state provides regressive transfer which replace low-incomes at a 20 percent rate and high-incomes at a 80 percent rate and I compare 2 versus 9 rather than 2 versus 13 in order to fix the level of endowment inequality). Panel (a) controls for differences in relative well-being (absolute endowments are higher in the flat-rate situation), and Panels (b) and (c) control for the importance of final outcomes vis-a-vis fairness in the social insurance principle (inequality in expected endowments is lower in the earnings-related problem). Additionally, in the earnings-related problem, replacement rates are lower in Panel (b) than they are in Panel (c). This is to emphasize the importance of the stability of income differences in the case of loss as compared to individual income stability (as captured by the level of the replacement rate). Transfer shares are always substantially higher in the earnings-related allocation problems. Nonparametric exact Wilcoxon–Pratt signed-rank tests for paired samples confirm that these differences are different from zero and statistically significant.Footnote 8
Effect of social insurance principle on transfers. Note: Panel (a) compares transfers in AP 2 versus 9 (in Table 1), panel (b) compares transfers in AP 8 versus AP 13, and panel (c) compares transfers in AP 6 versus 13.
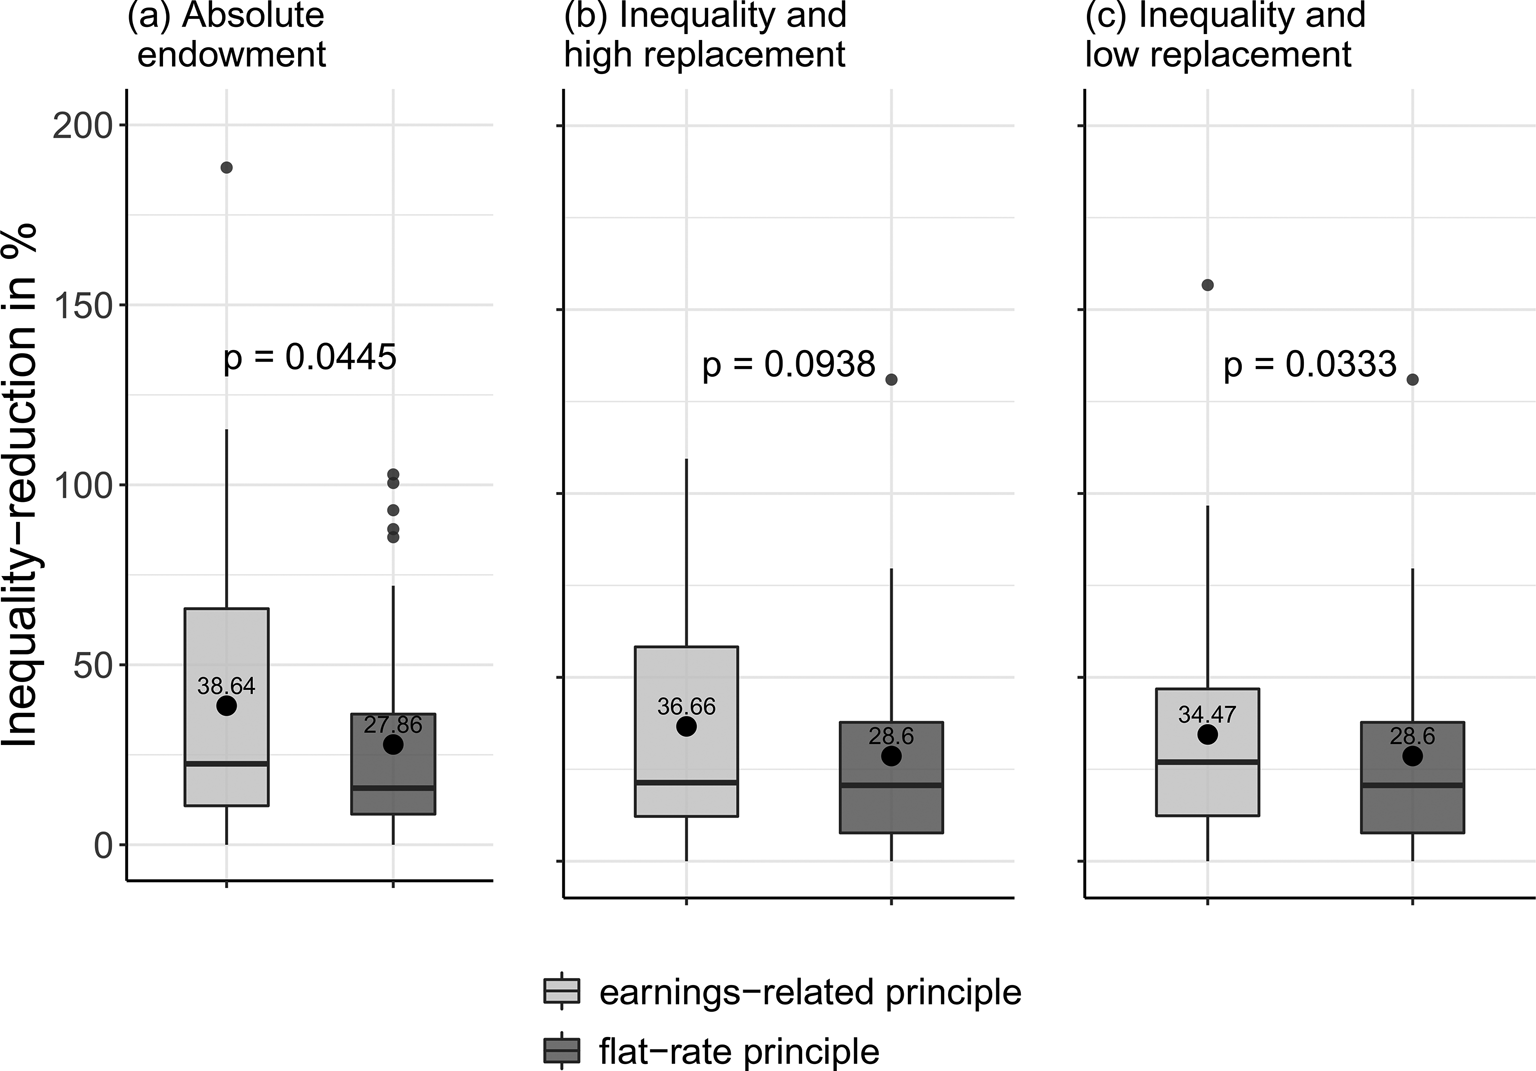
Panel (a) in Figure 4 isolates the governing principle of social insurance from changes in absolute endowments. One could argue that fairness considerations depend on the relative well-being of the decision-makers (e.g., Dimick et al., Reference Dimick, Stegmueller and Rueda2016 argue for income-dependent altruism). Panel (a) does not support this argument. Mean transfers are about 11 percentage points higher in allocation problems that follow the earnings-related principle (allocation problem 2 in Table 1) but provide low absolute endowments for decision-makers (mean transfers are 39 percent) when compared to allocation problems that follow the flat-rate principle (allocation problem 9 in Table 1) but provide high absolute endowments for decision-makers (mean transfers are 28 percent). However, inequality in expected endowments (taking into account risk and replacement) is higher in the earnings-related situation. Concerns for future fairness and inequality aversion then lead to similar behavioral implications. In Panels (b) and (c) I isolate these two alternative randomly chosen explanations.
Panel (b) in Figure 4 isolates concerns for future fairness from inequality aversion. Inequality in expected endowments is lower in the earnings-related situation (recipient expects 1248 Tokens, decision-maker expects 7776 Tokens) when compared to the flat-rate situation (recipient expects 1248 Tokens, decision-maker expects 10206 Tokens). Nevertheless, participants are more concerned about inequality in the earnings-related situation. Mean transfers are about 8 percentage point higher in the earnings-related allocation problems (allocation problem 8 in Table 1, mean transfers are 37 percent) when compared to the flat-rate situation (allocation problem 13 in Table 1, mean transfers are 29 percent). Future fairness therefore seems to be more important to understand redistribution decisions than inequality aversion more generally. However, these differences are only weakly statistically significant (on a 0.10 level).
Finally, panel (c) in Figure 4 is similar to panel (b) but provides low replacement rates in the earnings-related situation (20 percent of previous endowment). Decision-makers therefore stand to lose more in the earnings-related situation in panel (c) compared to the earnings-related situation in panel (b). Again, inequality in expected endowments is lower in the earnings-related situation (recipient expects 1092 Tokens, decision-maker expects 6804 Tokens) when compared to the flat-rate situation (recipient expects 1248 Tokens, decision-maker expects 10 206 Tokens). Additionally, similar to panel (a), the decision-maker's absolute endowment is lower (8100 Tokens) in the earnings-related situation when compared to the flat-rate situation (12 150 Tokens). Mean transfers are about 6 percentage points higher in the earnings-related situation (allocation problem 6 in Table 1, mean transfers are more than 34 percent), when compared to the flat-rate situation (allocation problem 13 in Table 1, mean transfers are less than 29 percent).
I replicate the same set of panels for participants categorized as being selfish. Figure D.18 in Section D in the Appendix reports the results. Average transfers are always close to zero, and participants do not respond to fairness considerations. While my experimental evidence supports the fairness argument I make, and substantiates the observational pattern I find, it also reveals that fairness arguments indeed apply to those participants who are concerned about the well-being of others in the first place. My results have broader implications for previous fairness arguments in the political economy literature. Rather than focusing on average effects, it is important to systematically include type-based differences, both in theory and in empirical analyses.
6 Conclusion
Income inequality is on the rise, even in the advanced European welfare states. Policy makers in many countries are seeking for solutions to distribute the benefits of economic growth more equally. The task is a thorny one. If politicians propose policies that go against the interests of the rich, a group that turns out to be politically more important than the poor (Verba et al., Reference Verba, Schlozman and Brady1995; Bartels, Reference Bartels2008; Gilens, Reference Gilens2012; Schlozman et al., Reference Schlozman, Brady and Verba2018; Becher and Stegmueller, Reference Becher and Stegmueller2021), they might be playing with their own political survival. If something is to be done about income inequality, we need a better understanding of what drives support for redistribution among the rich. This article has established that structural differences in social insurance design are important to explain variation in support for redistribution among the rich. It provides observational and experimental evidence showing that the rich support higher levels of redistribution if income differences are maintained in future periods (as is the case in earnings-related systems).
Future research needs to focus more on additional aspects of the social insurance system. Union membership and voluntary state-subsidized schemes are important but not captured by my indicator. While the UK and Sweden have an almost similar benefit concentration coefficient, many workers in Sweden are members of unions which provide them with an additional earnings-related component in case of unemployment. De facto replacement rates therefore differ from the purely government focused indicator that I apply. Furthermore, my benefit concentration captures only one social policy program of the welfare state that influences income stability. Employment protection and active labor market policies could be taken into account for a fuller picture when assessing the stability individual incomes over time (see e.g., Rueda, Reference Rueda2005, Reference Rueda2007).
Future research also needs to consider that both the Beveridgean and the Bismarckian understanding of social insurance leads to imperfect outcomes when taking fairness-related questions seriously. With given fair and unfair components in income differences, earnings-related systems maintain the unfair part, while flat-rate systems eliminate the fair part. The implication is that the same fairness-minded individuals that demand redistribution in earnings-related systems would demand social insurance in flat-rate systems. This needs to be tested in future research. A final point is that institutions are given and individuals respond to the institutions they are exposed to. What if the fairness-minded rich could choose the benefit system themselves? Would their choice respond to whether income inequality stems from fair or unfair procedures? Future experiments could help clarifying this question, which has far-reaching implications when thinking about policy design and the influence that institutions have on behavior and attitudes.
Supplementary material
The supplementary material for this article can be found at https://doi.org/10.1017/psrm.2022.48. Replication Link https://doi.org/10.7910/DVN/VNKZQF
Acknowledgments
I am grateful to Dominik Duell, Nikolay Marinov, Daniel Mueller, David Rueda, Daniel Stegmueller, Vera Troeger, and seminar participants and discussants at APSA (2017) EPSA (2017), NYU CESS 10th Annual Experimental Political Science Conference (2017), Fourth Annual Toronto Political Behaviour Workshop (2016), the Behavioral Models of Politics Conference (2016) and participants in various workshops at the University of Mannheim and Nuffield College. This work was supported by the University of Mannheim's Graduate School of Economic and Social Sciences funded by the German Research Foundation. I thank the SFB 884 at the University of Mannheim (funded by the German Research Foundation) for financial support to conduct laboratory experiments.


 Open access