

Acute and transient psychotic disorders, as defined by ICD–10 (World Health Organization, 1993), comprise 8–9% of all psychotic disorders and arguably have a benign long-term course (Reference Pillmann and MarnerosPillmann & Marneros, 2003; Reference Marneros and PillmannMarneros & Pillmann, 2004). We prospectively followed 42 individuals with acute and transient psychotic disorders, as well as a control group with schizophrenia. This paper reports longitudinal data from three waves of follow-up investigations covering 12 years after the first episode or 7 years after the index episode. It explores the hypotheses that acute and transient psychotic disorders can be differentiated from schizophrenia by a lack of deterioration during the long-term course, and that a subgroup remains well without further treatment.
METHOD
We identified all consecutive cases (n=42) fulfilling ICD–10 criteria for acute and transient psychotic disorders (F23) (World Health Organization, 1993) treated as in-patients at the Department of Psychiatry and Psychotherapy, Martin Luther University Halle-Wittenberg, Germany, during a 5-year period. We also recruited a control group of 42 individuals with ‘positive’ schizophrenia matched for gender and age. Positive schizophrenia was defined as an episode of schizophrenia with positive symptoms, such as hallucinations or delusions (F20.0, F20.2, F20.3); patients with chronic schizophrenia or residual schizophrenia (F20.5) were excluded.
The majority (79%) of participants were female; 19 of those with acute and transient psychotic disorders (45%) and 26 of those with positive schizophrenia (62%) had had earlier episodes (P=0.126). The mean age at first episode was 35.8 years (s.d.=11.1) for those with acute and transient psychotic disorders and 35.3 years (s.d.=13.9) for those with positive schizophrenia (P=0.867). Age at index admission was 41.2 years (s.d.=12.5) and 41.1 years (s.d.=12.4) (P=0.968).
Follow-up investigations took place at predetermined times 2.5 (s.d.=1.3), 4.9 (s.d.=1.4) and 7.0 (s.d.=1.5) years after the index episode, or 8.6 (s.d.=7.8), 10.5 (s.d.=7.3) and 12.4 (s.d.=7.3) years after the first episode. Three patients died before the first follow-up and four declined follow-up examinations throughout. Data from at least one point of follow-up were obtained from 39 patients with acute and transient psychotic disorders and 38 with positive schizophrenia (92% of the original participants). At the third follow-up, 66 (79%) of the original participants, or 88% of those surviving (n=75), were examined.
For the evaluation of socio-demographic features we used a semi-structured interview as in earlier studies (Reference Marneros, Deister and RohdeMarneros et al, 1991). The level of general functioning during the previous week was assessed using the Global Assessment Scale (GAS; Reference Endicott, Spitzer and FleissEndicott et al, 1976). Relapse was defined as the occurrence of a major affective syndrome or of psychotic symptoms leading either to hospitalisation or to out-patient treatment, including psychiatric medication and a disruption of daily activities. ICD–10 diagnoses were assessed with the Schedules for Clinical Assessment in Neuropsychiatry (SCAN; Reference van Gülick-Bailer, Maurer and Häfnervan Gulick-Bailer et al, 1995).
For the calculation of interrater reliability, 15 interviews were independently coded by two raters; one conducted the interview with the other present (interviewer – observer method). Kappa values for categorical items exceeded 0.80 for all items. The intraclass correlation coefficient for GAS was excellent (0.86).
As the conditions of normality and equal variances were not generally met, the non-parametric Wilcoxon test for paired samples and the Mann–Whitney U-test were used. In addition, χ2 tests or Fisher's exact test were performed, as applicable. P<0.05 was considered statistically significant.
All participants provided written informed consent. The study protocol was approved by the local ethics committee.
RESULTS
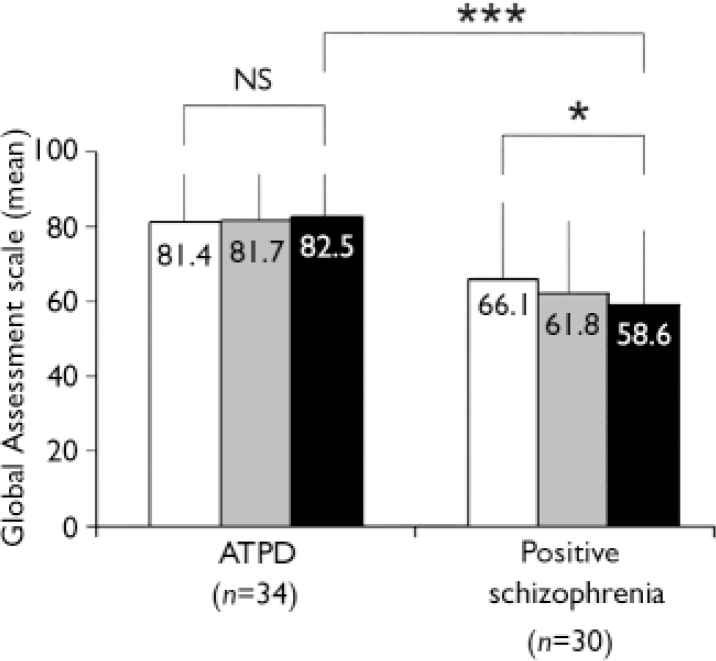
Global functioning was assessed with the GAS at the different points of follow-up (Fig. 1). There was a significant decrease in global functioning from the first to the third follow-up for those with positive schizophrenia (P=0.016), whereas the global functioning in those with acute and transient psychotic disorders remained unchanged (P=0.645). The score difference between the two groups at the third follow-up was highly significant (P<0.001).
Mean values on the Global Assessment Scale of those with acute and transient psychotic disorders (ATPD) and positive schizophrenia. Scores range from 1 to100 with higher values indicating better global functioning. Bars denote standard deviations. Within-group comparisons between first and last follow-up evaluated using Wilcoxon statistics. Between-group comparisons of status at the third follow-up evaluated using the Mann–Whitney U-test. *
P<0.05; ***
P<0.001;□, first follow-up; ![]() , second follow-up; ▪, third follow-up.
, second follow-up; ▪, third follow-up.
When the analysis was restricted to those with a first episode of illness, the results remained essentially unchanged, that is no significant change for those with acute and transient psychotic disorder (n=18, P=0.758) and a significant decline in global functioning for those with positive schizophrenia (n=13, P=0.041).
Relapses during the follow-up period were frequent and occurred in 31 out of 39 individuals with acute and transient psychotic disorders (79%) and 30 out of 38 with positive schizophrenia (79%; P=0.953). There was no difference in the median time to the first relapse between the two groups (1.04 and 1.57 years, respectively; Kaplan–Meier method, P=0.548).
In order to delineate a core group in longitudinally stable remission without medication, we set three criteria to be met at the last follow-up: no medication and no relapse for at least 2 years, and a GAS>70 at the last follow-up (Reference Mason, Harrison and GlazebrookMason et al, 1995). Out of the 39 individuals with acute and transient psychotic disorder, 12 (31%) fulfilled all three conditions but none of the 38 with positive schizophrenia met the criteria (P<0.001).
DISCUSSION
This study confirms and extends findings from earlier investigations of this and other cohorts (Reference Jager, Hintermayr and BottlenderJäger et al, 2003; Reference Marneros, Pillmann and HaringMarneros et al, 2003; Reference Marneros and PillmannMarneros & Pillmann, 2004; Reference Singh, Burns and AminSingh et al, 2004). The outcome of those with acute and transient psychotic disorders remained clearly more favourable than that of those with positive schizophrenia. This result generally held true when the analysis was repeated for the subsample with a first episode of illness. However, there was no difference between the groups in the proportion who had a relapse during the follow-up period.
Strengths of the present study include the use of standardised instruments, multiple points of follow-up and a low attrition rate. Important limitations are the small sample size, which affects the analysis of subgroups with acute and transient psychotic disorders, the absence of baseline data on GAS and the failure to mask the raters to the index diagnosis. Because of the case – control design of the study, the control group had a female preponderance and a relatively late onset, probably skewing the sample towards a somewhat better prognosis (Reference Harrison, Croudace and MasonHarrison et al, 1996). This bias precludes generalisation to unselected samples of individuals with schizophrenia, but makes differences between the two groups even more noteworthy.
The control group with positive schizophrenia had a slight deterioration in the long-term course of their illness. The effect is of questionable clinical significance but confirms other similar, if controversial, findings (Reference Eaton, Thara and FedermanEaton et al, 1995; Reference Stirling, White and LewisStirling et al, 2003). Deterioration was not observed in those with acute and transient psychotic disorders. As we have reported elsewhere (Reference Marneros and PillmannMarneros & Pillmann, 2004), this stability does not preclude syndromic change during long-term follow-up which affected more than half of the patients with acute and transient psychotic disorder in the present study. Although acute and transient psychotic disorders might represent a mild variant of the schizophrenia spectrum, characteristics such as the lack of deterioration, polymorphic features and affective syndromes during the long-term course suggest different pathogenetic mechanisms (Reference Marneros and PillmannMarneros & Pillmann, 2004).
At the end of the prospective follow-up, 31% of those with acute and transient psychotic disorders, but none of those with positive schizophrenia, could be regarded as being in longitudinally stable remission without medication. If in this subgroup the disorder is self-limiting, maintenance medication may be less often necessary than in schizophrenia. However, 31% may be an overestimation because of the possibility of later relapse. Only longer follow-up times and randomised controlled trials can resolve this matter.
Acknowledgements
The study was supported by a grant from the German Research Council (DFG MA 115/12-1).


eLetters
No eLetters have been published for this article.