

Breathing while Black became cause for arrest—or worse.
—Patrisse Khan-Cullors, co-founder of Black Lives Matter, 2018The continued deaths of African Americans in the hands of law enforcement have reignited public debate on how racial minorities are unfairly and unjustly treated in a country built on the premise of equal opportunities. The killings of Willie Ray Banks in 2011, Trayvon Martin in 2012, Eric Garner and Michael Brown in 2014, and Breonna Taylor and George Floyd in 2020, to name a few, are symptomatic of the ingrained racism imbued in the institutions that comprise American society (López Reference López2010; Petersen-Smith Reference Petersen-Smith2015). It is under this context that Black Lives Matter (BLM) emerged as a social movement, to put a much needed spotlight on the systemic racism against Black people in the United States (Campbell Reference Campbell2021), and to bring the legacy of police brutality against people of color front and center of civic and political discourse.
The dawn of the movement is attributed to the backlash following George Zimmerman’s 2013 acquittal for the killing of Trayvon Martin, an unarmed seventeen-year-old, and the ensuing widespread support for the online hashtag activism of #BlackLivesMatter (Clayton Reference Clayton2018). The BLM movement became a loose confederation of grassroots groups advocating for racial justice at both local and national levels. The movement has since become one of the largest in American history, rivaling that of the 1960s Civil Rights Movement (Buchanan, Bui, and Patel Reference Buchanan, Bui and Patel2020). BLM demonstrations were organized in every major U.S. city (Sawyer and Gampa Reference Sawyer and Gampa2018), gathering more than twenty-five million people in the aftermath of George Floyd’s brutal killing (Hamel et al. Reference Hamel, Kearney, Kirzinger, Lopes, Muñana and Brodie2020). BLM protests sparked not only across the country (Faust et al. Reference Faust, Johnson, Guignard, Adechoubou, Tilly, Castañeda and Wood2019; Sinanan Reference Sinanan2020; Swarns Reference Swarns2016) but also internationally (Beydoun and Ocen Reference Beydoun and Ocen2015; Khan Reference Khan2015; Saric Reference Saric2021). BLM’s plea for racial equality reached far beyond its borders as the international community witnessed the extent of racial injustices unfolding in the United States, and began to recognize similar structural symptoms at home (Bricker Reference Bricker2020; King Reference King2020; Strong Reference Strong2017). Indeed, the BLM movement has been expanding its scope to embrace the fight for the rights of other marginalized racial groups, such as refugees (De Genova Reference De Genova2018) and indigenous people (Scott Reference Scott2021). Now best described as a transnational social movement (Porta, Kriesi, and Rucht Reference della Porta, Kriesi and Rucht2009; Tarrow Reference Tarrow2005), BLM demonstrations spanned across the world—from Pretoria to Reykjavík, Bangkok to Buenos Aires, Auckland to Vancouver—and became tantamount to a global rallying cry against racism and police brutality (Kirby Reference Kirby2020). In 2021, the BLM movement was nominated for the Nobel peace prize, reinforcing BLM’s societal relevance in both confronting racially motivated violence and leading the fight towards racial equality (Belam Reference Belam2021).
Yet despite its well-recognized importance, the BLM movement has been met with mixed public support in the United States (Reinka and Leach Reference Reinka and Leach2017). While George Floyd’s death embodied a moment of racial awakening in America—increasing individuals’ perceptions of racial discrimination against Blacks, and decreasing favorable attitudes towards the police (Curtis Reference Curtis2021)—a Pew Research Center report from June 2020 indicated that 67% of American respondents expressed support towards the BLM movement, 30% of the population still opposed it (Parker, Horowitz, and Anderson Reference Parker, Horowitz and Anderson2020). Support for the movement later dropped to 55%, as indicated by a September follow-up Pew poll (Thomas and Horowitz Reference Thomas and Horowitz2020). This decline occurred for all ethnicities except for Black people, and across partisan lines where Republican support more than halved. Analyzing trends in time, Chudy and Jefferson (Reference Chudy and Jefferson2021) find a similar pattern and show that support for BLM has declined after George Floyd’s killing, mostly driven by conservative Republicans and white Americans. Race has rarely mattered more in American politics than it does now. It is thus not surprising that conservative Republicans dismiss the legacy of slavery as affecting black people’s position in the American society today, say the country has already given Black people equal rights, and believe a big problem for the country is that people see discrimination where none exist (Horowitz, Brown, and Cox Reference Horowitz, Brown and Cox2019). Another factor swaying public opinion on BLM is one’s attitudes toward the fourty-fifth U.S. president and his uniquely racially charged campaign and time in office—and by contrast, towards Barack Obama and his legacy, which Trump sought to undo. Trump’s racialized campaign and presidency have paved the way for the rise of white nationalism (Jardina and Piston Reference Jardina and Piston2021), encouraged whites to embrace their whiteness as a social identity (Jardina Reference Jardina2019), reinforced white Americans’ xenophobic sentiments (Hooghe and Dassonneville Reference Hooghe and Dassonneville2018), strengthened prejudice toward Latinos and Asian Americans (Louie and Viladrich Reference Louie and Viladrich2021), and Muslims (Lajevardi and Oskooii Reference Lajevardi and Oskooii2018). Racism, xenophobia, and prejudice are the tripartite pillars of white nationalism as evidenced by spikes in hate crimes following Trump’s 2016 campaign rallies (Feinberg, Branton, and Martinez-Ebers Reference Feinberg, Branton and Martinez-Ebers2019). It is particularly telling that Trump’s history of explicit racism appears not to be a bug that conservative Republicans had to overlook but a feature which would ultimately deliver the nomination, the presidency, and control over American conservatism and the GOP (Abramowitz Reference Abramowitz2018; Sides, Tesler, and Vavreck Reference Sides, Tesler and Vavreck2019).
This divide in public support for BLM across racial and political (partisan and ideological) lines buttresses the need to better understand which factors underlie individuals’ proclivities towards social movements in search of racial equality. The existing literature, however, focuses on vastly different elements associated with BLM support, providing important but ultimately disconnected insights. As support for BLM in America is likely a multifaceted issue influenced by a plethora of factors, and single studies are “limited in the generalizability of the knowledge they produce about concepts, populations, settings, and times” (Cook et al. Reference Cook, Cooper, Cordray, Hartmann, Hedges and Light1992, chap. 3), research synthesis can provide a stable foundation for an authoritative account on the subject matter (Dacombe Reference Dacombe2018). This is especially the case since the BLM literature appears to be proliferating exponentially (Campbell Reference Campbell2021), and—to date—there has not yet been an attempt to integrate existing findings.
In the present research program, we sought to uncover the demographic, political, and psychological bases of BLM support by conducting a systematic literature search and multiple meta-analyses. The goal was to build an analytical infrastructure paving the way for future research. We a) uncovered four main themes in the extant literature; b) contextualized the literature on collective action and political behavior into that of the BLM movement; c) consolidated published research and empirical evidence (surveys and polls) on the determinants of BLM support; d) pit the most reliable predictors of BLM against one another, compared the magnitudes and their relative importance; and e) explored disparities in BLM support across societal groups and subgroups. This research program contributes in numerous ways to theory development and testing because it combines evidence into a broader, more generalizable, framework; identifies sources of variability among the different components of evidence; generates new hypotheses; and uncovers understudied areas and potential gaps.
State of the Art
The rise of BLM has been accompanied by increased scholarly interest on the impacts of racial violence in the United States. Despite its recent emergence, it is possible to already identify some of the major themes around which discussions have centered. Initial academic discussions have concentrated mostly around the topic of police violence, exploring how policing poses harm to marginalized communities in the United States (Gaber and Wright Reference Gaber and Wright2016), documenting the lived experiences of Black Americans with the law enforcement (Brooks et al. Reference Brooks, Ward, Euring, Townsend, White and Hughes2016), discussing the impact of the episodes of police brutality to different academic fields (Pratt-Harris et al. Reference Pratt-Harris2016), and the need of interventions aiming to increase the psychological and physical health of Black students, employees, and organizations (Barlow Reference Barlow2018; McCluney et al. Reference McCluney, Bryant, King and Ali2017; Opie and Roberts Reference Opie and Roberts2017).
As the BLM matured, a second stream of literature emerged focusing on the characteristics of the movement and how they might have shaped its public image. Studies have emphasized how BLM stands out in comparison to earlier Black social movements for its intersectional framing, particularly among Black communities (Ray Reference Ray2020). Differently from the Civil Rights movement, which arguably centered more around a Black heterosexual male leadership (Matthews and Noor Reference Matthews and Noor2017, p.8), BLM activists deliberately sought to be inclusive of all Black lives across divisions of gender, socioeconomic status, and sexuality, providing a much-needed forum for diverse voices and marginalized groups (Clark, Dantzler, and Nickels Reference Clark, Dantzler, Nickels and Guay2018). BLM was also considered unique in standing in solidarity and building coalitions with other oppressed groups such as Palestinians and Indigenous people (Clark, Dantzler, and Nickels Reference Clark, Dantzler, Nickels and Guay2018), refugees (De Genova Reference De Genova2018), and aborigines (Scott Reference Scott2021). Another identified feature distinguishing BLM is its active use of social media to a) inform of news seldom covered by traditional outlets (e.g., racist incidents; Graham and Smith Reference Graham and Smith2016); b) generate mainstream media coverage (Freelon, McIlwain, and Clark. Reference Freelon, McIlwain and Clark2018); c) galvanize public support and political mobilization (Casas and Williams Reference Casas and Williams2019); and perhaps more significantly, to d) foster discussions from the point of view of Black people (Graham and Smith Reference Graham and Smith2016); and e) enable organizers and supporters to continuously shape their message and voice criticism against insidious attacks from— and pervasive (white) framing of—mainstream media (Nummi, Jennings, and Feagin Reference Nummi, Jennings and Feagin2019).
As BLM gained space in the media, it became imperative to investigate the role of news media in determining individuals’ attitudes towards the movement. Portrayals of BLM were found to be often racialized, with numerous news outlets expressing explicit disapproval of protests, failing to contextualize the movement within the historical struggles of Black people, attributing blame for acts of violence to Black protesters, and framing peaceful protests derogatorily as riots (Fabregat and Beck Reference Fabregat and Beck2019; Leopold and Bell Reference Leopold and Bell2017; Lane et al. Reference Lane, Williams, Hunt and Paulk2020). Research also revealed how media contextual and visual frames can affect individuals’ perceptions of protests. For example, legitimizing frames portraying the movement’s goals and complaints increased support for protesters (Kilgo and Mourão Reference Kilgo and Mourão2021), whereas framing BLM protests as being composed solely of Black participants (versus more racially diversified depictions) elicited lower support (Wouters Reference Wouters2019) and increased perceptions of the protest as being violent (Peay and Camarillo Reference Peay and Camarillo2021). Other elements such as the race-ethnicity of individuals expressing support for BLM movement on open letters (Arora and Stout Reference Arora and Stout2019), messaging strategies framing the movement as intersectional (Bonilla and Tillery Reference Bonilla and Tillery2020), and consumption of conservative media outlets (Kilgo and Mourão Reference Kilgo and Mourão2019) were also found to impact attitudes towards the BLM movement.
More recently, scholars have started to examine political and psychological characteristics influencing support for—and participation in—BLM protests. Published studies have found a range of factors contributing to participation in BLM protests including intergroup contact (Meleady and Vermue Reference Meleady and Vermue2019), empathy-mediated contact (Selvanathan et al. Reference Selvanathan, Techakesari, Tropp and Barlow2018), and perceived societal inequality (Lake, Alston, and Kahn Reference Lake, Alston and Kahn2018). Support for BLM has been linked to identifying as Democrats (Arora and Stout Reference Arora and Stout2019), endorsement of progressive-liberal politics (Merseth Reference Merseth2018), recognizing society lacks equal opportunities (Holt Reference Holt2018), as well as to psychological tendencies such as lower levels of both authoritarianism (Barker, Nalder, and Newham Reference Barker, Nalder and Newham2021), and social dominance orientation (Holt and Sweitzer Reference Holt and Sweitzer2018). Additionally, Sawyer and Gampa (Reference Sawyer and Gampa2018) found that during BLM protests, liberals tend to display less pro-white implicit and explicit bias than conservatives.
We dive deeper into the published literature on the factors influencing support for BLM as part of presenting results of Study 1. Next, to expand the determinants of BLM support beyond the published literature, in Study 2 we conducted systematic multiple meta-analyses of predictors of BLM support using thirteen nationally representative public opinion surveys. In an effort to contextualize reported findings theoretically, results from both studies are discussed integrating insights from the collective action and political behavior literature.
Study 1: Systematic Review of the Literature
Methods
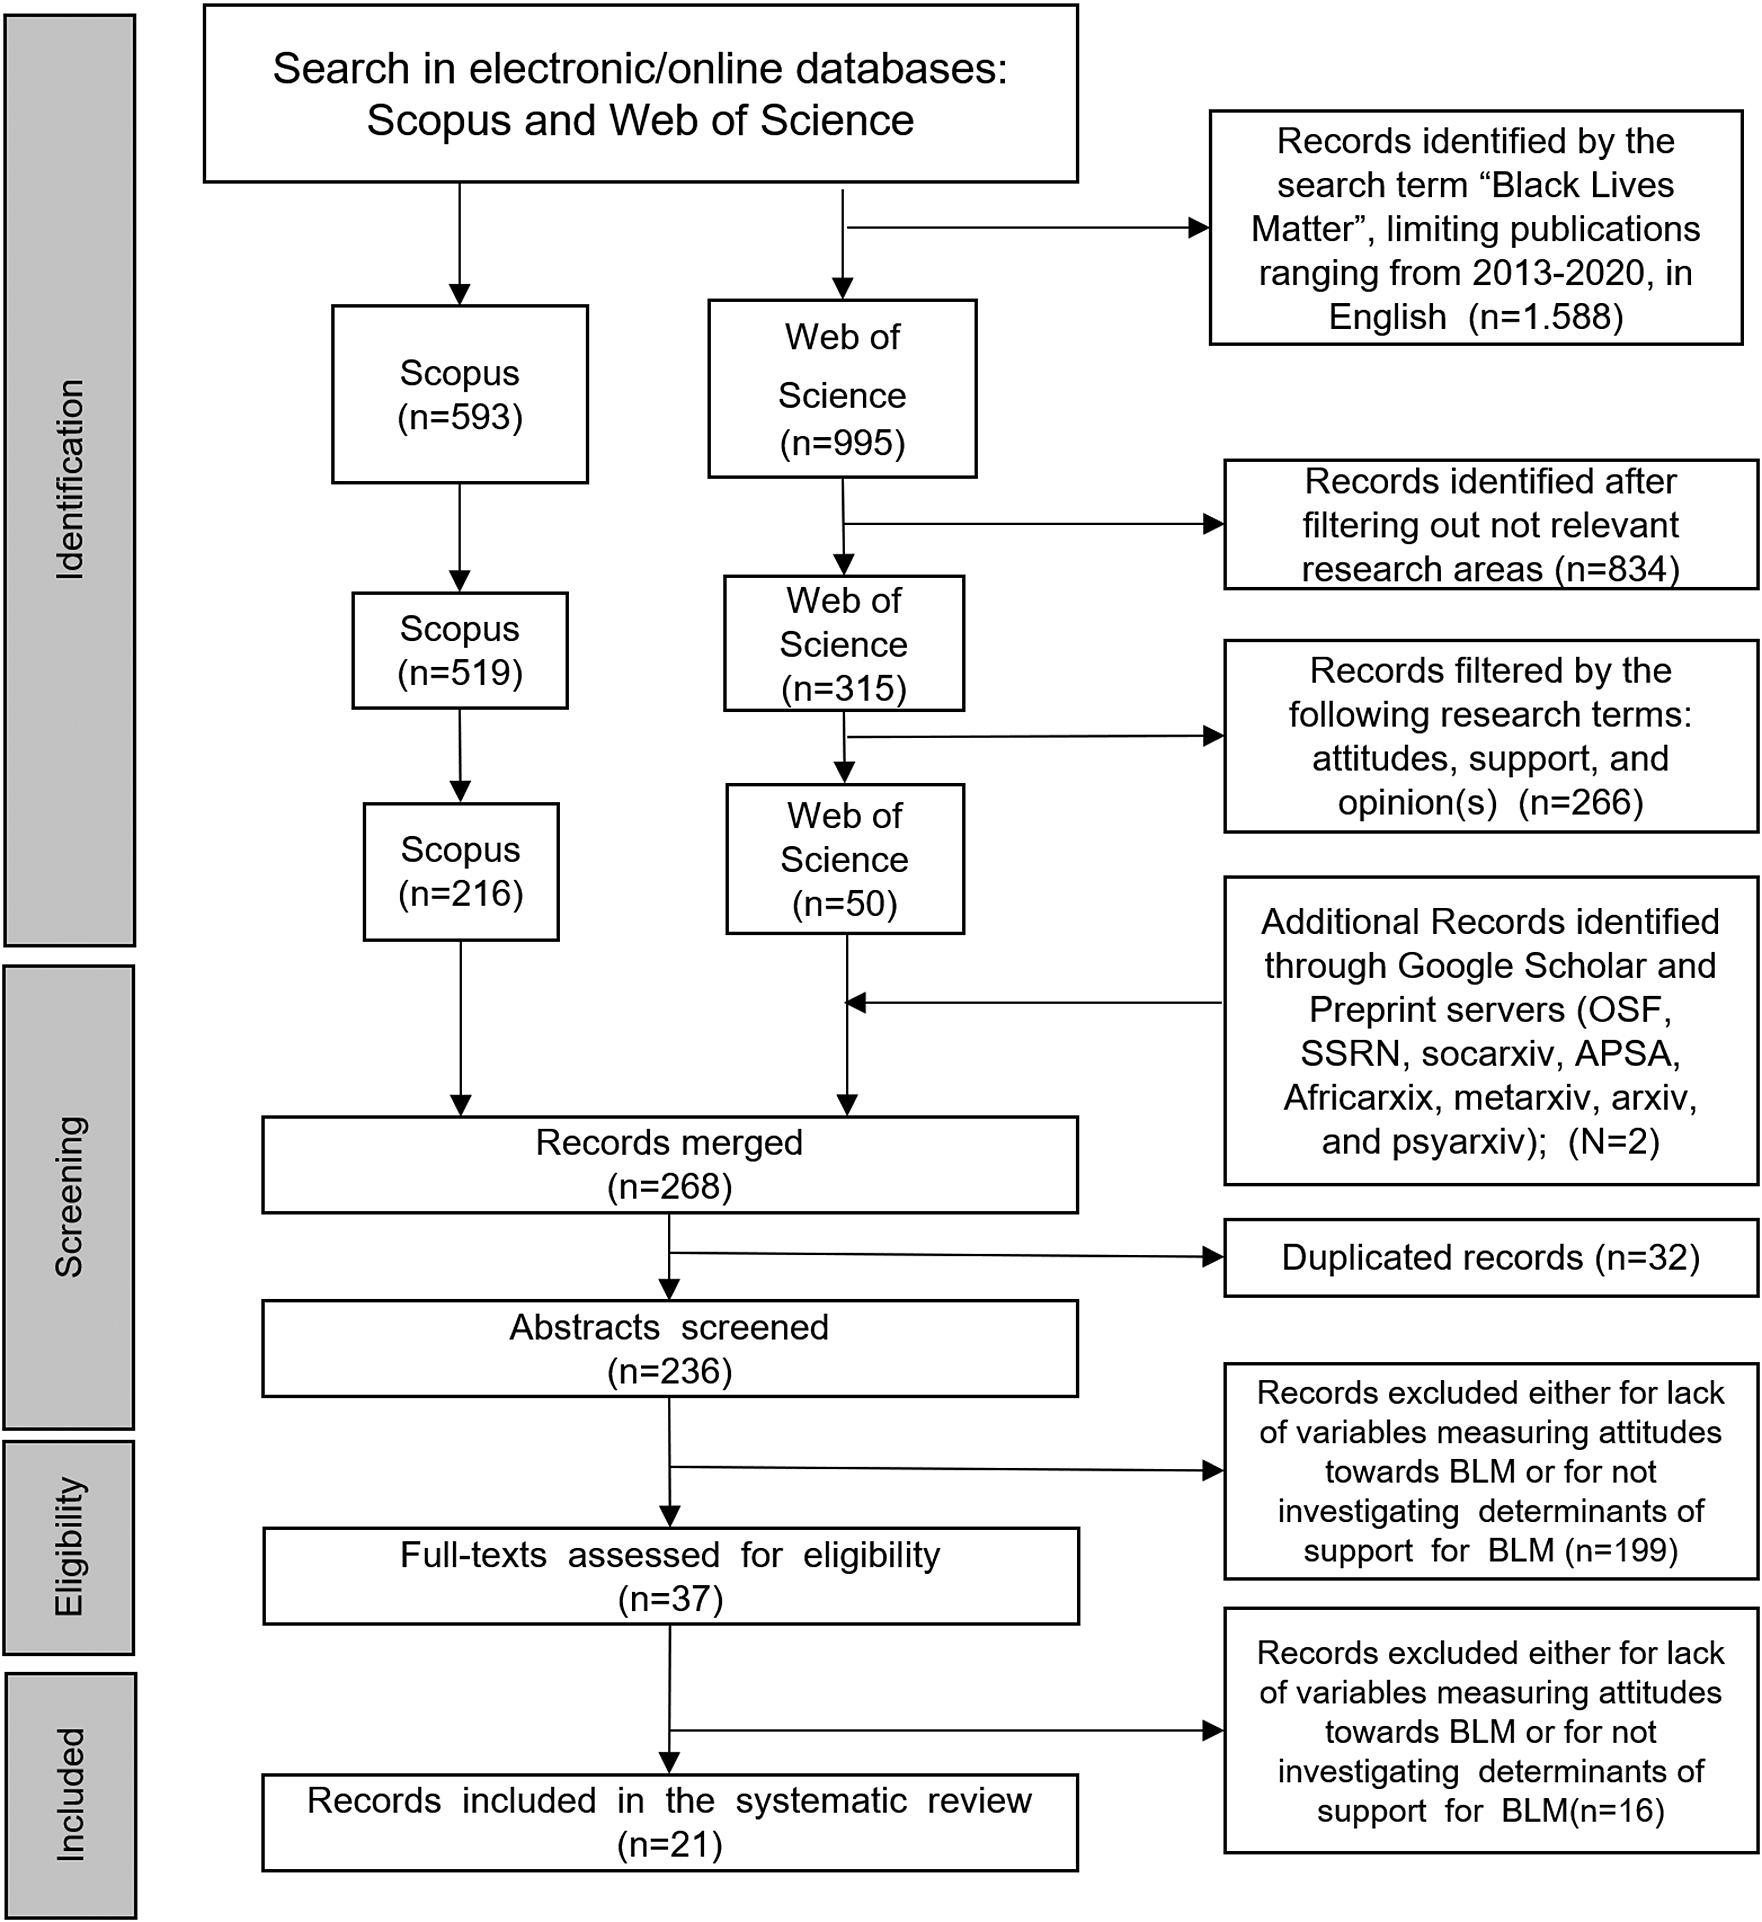
We synthesized evidence in a transparent and accessible manner, in line with the outlined principles for good evidence synthesis for policy (Donnelly et al. Reference Donnelly, Boyd, Campbell, Craig, Vallance, Walport, Christopher, Woods and Wormald2018). To ensure a transparent and complete reporting of the literature search and screening, we adopted the Preferred Reporting Items for Systematic Reviews and Meta-Analyses (PRISMA, Page et al. Reference Page2020). A flow diagram describing each step in the identification, screening, eligibility, and inclusion criteria is presented in figure 1. For further details on search methodology and data extraction, see sections 1.1 and 1.2 of the online appendix. We abided to open and reproducible research practices: replication materials can be found at https://osf.io/pvk69.
PRISMA flow diagram
Results
The systematic review yielded twenty-four studies from the original twenty-one records. The findings of the systematic review are shown in figure 2. The reviewed records comprised a total of 27,691 participants. Sample size across quantitative studies ranged from 202 to 3,769 participants per sample. Qualitative studies included in the systematic review had sample sizes of 41 (S4) and 115 participants (S9). Except for one study, which was conducted with British participants (N=202; S12), all other studies included U.S. participants (N=27,489). Most articles were published in 2020 (k=12) and 2018 (k=5) while only three articles were published in 2019 and one article was published in 2021. A total of twenty-one studies were conducted online while four studies employed in person interviews. Studies used diverse methodologies, with some studies using experimental research (S2, S3) while most employed observational surveys (k=20). Sixteen studies investigated specific racial/ethnic groups, while the remainder investigated the general population. The most prevalent race investigated was whites (k=9) followed by African Americans (k=6), whereas the least frequent ones were Asian Americans (k =3), Afro-Latinx (k=1), and Latino Americans (k=1).
Predictors of support for BLM
Notes: Significant and positive associations are denoted with ‘+’, significant and negative associations with ‘-’, and non-significant association with ‘ns’. Blank cells indicate that the study did not include the predictor. Whenever the study investigated a specific race/ethnic group, this is indicated (AS: Asian American Sample; AAS: African American Sample; LS: Latino American Sample; WS: White Sample). When not specified, the study investigated a general sample. For partisanship, in S1.1 and S1.2 we report findings for Democrats versus Independents and Republicans versus Independents. For all other studies, the comparisons are between Democrats versus Republicans or vice versa. On S5, “AL” means Afro-Latinos. “(R)” indicates that, for ease of use, in S7 the original measure of negative beliefs about equal opportunity was reversed to reflect perceptions of social inequality. S1: Arora and Stout Reference Arora and Stout2019; S2: Barker, Nalder, and Newham Reference Barker, Nalder and Newham2021; S3: Bonilla and Tillery Reference Bonilla and Tillery2020; S4: Cole Reference Cole2020; S5: Corral Reference Corral2020; S6: Drakulich et al. Reference Drakulich, Wozniak, Hagan and Johnson2020; S7: Holt Reference Holt2018; S8: Holt and Sweitzer Reference Holt and Sweitzer2018; S9: Hordge-Freeman and Loblack Reference Hordge-Freeman and Loblack2020; S10: Ilchi and Frank Reference Ilchi and Frank2020; S11: Lake, Alston, and Kahn Reference Lake, Alston and Kahn2018; S12: Meleady and Vermue Reference Meleady and Vermue2019; S13: Merseth Reference Merseth2018; S14: Riley and Peterson Reference Riley and Peterson2020; S15: Seaton et al. Reference Seaton, Horse, Yoo and Vargas2020; S16: Selvanathan, Lickel, and Jetten Reference Selvanathan, Lickel and Jetten2020; S17: Selvanathan et al. Reference Selvanathan, Techakesari, Tropp and Barlow2018; S18: Towler, Crawford, and Bennett Reference Towler, Crawford and Bennett2020; S19: Updegrove et al. Reference Updegrove, Cooper, Orrick and Piquero2020; S20: Watson-Singleton et al. Reference Watson-Singleton, Mekawi, Wilkins and Jatta2020; S21: Wouters Reference Wouters2019.

We employ a narrative approach (Baumeister and Leary Reference Baumeister and Leary1997) to systematize the reviewed literature. We clustered findings into five categories: demographics; race and ethnicity; partisanship and ideology; discrimination and prejudice; social attitudes and psychology. We followed a vote counting procedure to integrate patterns of studies’ results, extracted the direction of the associations ensuing from all statistical models, and assessed the degree of consistency (cf. Cooper, Reference Cooper2017, 225). Results are reported per racial/ethnic group whenever studies investigated different groups. Additional (infrequent) predictors are reported in the online appendix (section 1.3).
Demographics
Age. Ten studies out of the twenty-four included in the systematic review investigated the association between age and support for BLM. The majority of studies (k=7) report non-significant associations between age and support for BLM (S1.1, S1.2, S8, S10, S13, S14, S21). Nevertheless, in line with previous studies showing that older individuals hold more positive attitudes towards the police (Weitzer and Tuch Reference Weitzer and Tuch2002) and are less likely to support the Civil Rights Movement (Jones Reference Jones2006) three studies find that older individuals are less prone to support the BLM movement (S3, S5, S19).
Education. Eight studies examine the relationship between educational attainment and support for BLM, all of which consistently found non-significant associations between education and BLM support (S1.1, S1.2, S3, S5, S8, S13, S19, S21). This is surprising in light of previous literature considering education as an important factor determining political participation and activism (Hall, Rodeghier, and Useem Reference Hall, Rodeghier and Useem1986; Dalton, Van Sickle, and Weldon Reference Dalton, Van Sickle and Weldon2010).
Gender. Results for gender are inconsistent across eleven studies. Four studies find non-significant associations between gender and BLM support (S8, S11, S13, S21), whereas seven studies report that—compared to men—women are more prone to support the movement (S1.1, S1.2, S3, S5, S10, S14, S19). These inconsistencies in BLM support reinforce the need to further consider how social movements might be gendered. Feminist theory has been crucial in bringing to light the contributions of women to many social movements (e.g., Civil Rights; West and Blumberg Reference West and Blumberg1991). Black women compose the majority of registered voters among Blacks (Noe-Bustamante and Budiman Reference Noe-Bustamante and Budiman2020) and were fundamental in turning the course of the 2020 election (Herndon Reference Herndon2020). As such, the role of women—and especially Black women—in supporting BLM should be a subject of further research.
Income. Out of the twenty-four studies, eight investigate income, all of which report a non-significant association between income and BLM support (S1.1, S1.2, S3, S5, S8, S13, S14, S19). This consistent result across studies suggests that income does not appear to predict BLM attitudes.
Urbanicity. Only three studies investigate urbanicity. Results are mixed. One study finds the relationship between urbanicity and BLM support to be non-significant (S19) while the other two report that living in urban—compared to non-urban areas—is associated with higher support for the movement (S5, S8). This is in line with studies showing that rural consciousness is related to racial resentment and stereotyping (Nelsen and Petsko Reference Nelsen and Petsko2021) and that the racial attitudinal shift following George Floyd’s death was much smaller in rural than urban areas (Curtis Reference Curtis2021). Of interest, the two studies reporting a significant and positive association also suggest there are differences in this result depending on ethnicity, such that the relationship is mostly significant and positive for whites but non-significant for Latinos (S5) and African Americans (S8). These results suggest that lower levels of support for BLM in non-metropolitan areas may ensue from the higher proportion of whites in rural areas rather than urbanicity itself.
Race and Ethnicity
As can be expected for a movement addressing issues of racial inequality, race and ethnic identity play an important role in shaping attitudes towards BLM. Results are largely consistent across studies. The three studies comparing participants who self-identify as African Americans versus white find positive and significant associations (S8, S19, S21). These findings support previous evidence reporting that self-identifying as white was a strong predictor of negative attitudes towards the Civil Rights Movement (Jones Reference Jones2006). In addition, S5 finds that Latinos who self-identify as Blacks are more prone to support the movement than Latinos who self-identify as whites, suggesting that other minorities may support BLM to the extent that they identify with Black people or their struggles. Indeed, perceptions of commonalities with African Americans appear to shape political alliances between minority groups (Sanchez Reference Sanchez2008).
Compared to whites, however, racial minority groups are largely and consistently more supportive of BLM across three studies (S10, S11, S16). This might be due to the spike in hate crimes against minorities in the United States in the last years, which may have contributed to a shared identity among people of color (Pérez Reference Pérez2021).
Partisanship and Ideology
For both partisanship and ideology, findings are quite consistent among studies, both showing large effect-sizes predicting BLM support.
Identification with the Democratic party (versus other parties or Independents) is significantly and positively associated with BLM support in four studies (S1.1, S1.2, S13, S21). Similarly, identification with the Republican party (versus other parties or Independents) is significantly and negatively associated with BLM support across four studies (S1.1, S1.2, S5, S19). These findings echo long established patterns (Olsen Reference Olsen1968) whose enduring nature are likely due to the GOP’s increasingly racially-tinted politics (Jardina Reference Jardina2019)—arguably as an effort to satisfy Republicans’ growing white constituency (Kinder and Kalmoe Reference Kinder and Kalmoe2017). Democrats, on the other hand, are comprised of a more racially and ethnic diversified membership (Mason and Wronski Reference Mason and Wronski2018) and have progressively shown a meaningful and genuine decrease in racial resentment (Engelhardt Reference Engelhardt2019, Reference Engelhardt2021).
Ideology was found to be a significant and negative predictor of BLM support across all four studies, suggesting that the more conservative individuals are, the lower their support for the social movement whose mission is to eradicate white supremacy (S2, S13, S14, S19). This was the case even after controlling for partisanship (S13, S19) echoing the findings of McCright and Dunlap (Reference McCright and Dunlap2008) who showed ideological asymmetries in the endorsement of collective action such that conservatives—as opposed to liberal/progressives—tend to show lower levels of support for (progressive) social movements. These findings are also largely in agreement with research linking conservatism and anti-Black racial sentiment (Federico and Sidanius Reference Federico and Sidanius2002a, Reference Federico and Sidanius2002b; Sears et al. Reference Sears, Van Laar, Carrillo and Kosterman1997; Sears and Henry Reference Sears and Henry2003; Sidanius and Pratto Reference Sidanius and Pratto2001). Taken together, liberal-conservative differences appear to be of importance for BLM support insofar as it impacts the legitimation of existing forms of inequality (Azevedo, Jost, and Rothmund Reference Azevedo, Jost and Rothmund2017; Hall Reference Hall, Baker, Diawara and Lindeborg1996; Jost Reference Jost2021; Wilson Reference Wilson2021) and the desire to change society in a more egalitarian direction (e.g., Bobbio Reference Bobbio1996; Womick et al. Reference Womick, Rothmund, Azevedo, King and Jost2019).
Discrimination and Prejudice
Prejudice. Four studies examined the effect of participants’ racially motivated prejudice on support for BLM. Even if measures of racial attitudes differed across studies, findings were consistent in that the more individuals are prejudiced, the less they support the BLM movement. Using feeling thermometers on African Americans, a negative and significant association between favorability/warmth against African Americans and support for BLM was found in S12. Both S14 and S21 used the racial resentment scale finding the more participants resent Blacks, the less they support the movement. S10, too, found consonant results by adapting the measure of symbolic racism to the context of individuals’ perceptions about those living in unprivileged neighborhoods (“the policed”). These findings resonate with literature showing that prejudice reduces support for the Civil Rights Movement (Jones Reference Jones2006) and for political activities benefiting Blacks (James et al. Reference James, Brief, Dietz and Cohen2001), Aborigines (Leach, Iyer, and Pedersen Reference Leach, Iyer and Pedersen2006), and immigrants (Shepherd et al. Reference Shepherd, Fasoli, Pereira and Branscombe2018).
Perceptions of racial discrimination. Three studies investigated individuals’ general perceptions of racial discrimination in America. Findings are consistent, suggesting that the more individuals recognize racial discrimination to be a pervasive issue in America, the more they support the BLM movement (S5, S13, S21). Previous literature has shown that witnessing racial discrimination motivates whites to engage in collective action for racial justice, an effect that is mediated by enhancing awareness of white privilege (Uluğ and Tropp Reference Uluğ and Tropp2021). Accordingly, recognition of one’s own privilege is thought to be an important factor motivating members of advantaged groups to engage in collective action supporting disadvantaged groups (S4; Radke et al. Reference Radke, Kutlaca, Siem, Wright and Becker2020).
Personal experience with racial discrimination. Four studies included questions about participants’ previous personal experiences with racial discrimination. The relationship between personal experience with racial discrimination and BLM support is not significant for the general population (S19), for whites and Latinos (S5), African Americans (S20), and Asians (S1.2). Although personal experiences with discrimination are associated with increased psychological distress (Broman, Mavaddat, and Hsu Reference Broman, Mavaddat and Hsu2000), they do not necessarily lead to engagement in collective action. As shown by Foster and Matheson (Reference Foster and Matheson1998), negative emotions elicited by experiences of discrimination may actually inhibit participation. As such, individual differences in how the discrimination episode is internalized and reappraised might be more important than the actual experience in determining support for—and participation in—collective action (Foster Reference Foster2000). Experiencing discrimination as a racial-ethnic minority did not lead to BLM support, and whites who report to have experienced racial discrimination were less inclined to support the BLM movement (S1.2). This perception of “reverse racism” is likely associated with whites’ understanding racism as a zero-sum game, such that perceived decrease in racial biases against Blacks is associated with a perception of increased bias against whites (Norton and Sommers Reference Norton and Sommers2011).
Social Attitudes and Psychology
Social Dominance Orientation (SDO). Three studies reported associations between SDO and support for the BLM movement. Social dominance was significantly and negatively related to support for BLM (S2, S8, S12). These results are consonant with the literature showing that individuals holding views that endorse group-based dominance and inequality are less likely to support—and engage in—a range of progressive social movements (Ho and Kteily Reference Ho and Kteily2020), such as in favor of refugees (Thomas et al. Reference Thomas, Laura, McGarty, Reese, Kende, Biluc, Curtin and Spears2019), environmentalism (Milfont et al. Reference Milfont, Bain, Kashima, Corral-Verdugo, Pasquali, Johansson and Guan2018), Arab uprisings (Stewart et al. Reference Stewart, Pratto, Zeineddine, Sweetman, Eicher, Licata and Morselli2016) and racial equality (Stewart and Tran Reference Stewart and Tran2018). These findings also square with extant literature linking anti-Black attitudes and racism with SDO and authoritarianism (Duriez and Soenens Reference Duriez and Soenens2009; van Hiel and Mervielde Reference Van Hiel and Mervielde2005; Knowles et al. Reference Knowles, Lowery, Shulman and Schaumberg2013). Taken together, individuals desiring the in-group to dominate out-group members appear to display low support for the BLM movement.
Intergroup contact. Two studies investigated whether intergroup contact with Blacks affects one’s predisposition to support the BLM movement (S5, S17.1). Contrary to expectations (Pettigrew and Tropp Reference Pettigrew and Tropp2006), results are inconsistent. While non-significant associations between intergroup contact and support for the BLM movement were found in S5, S17.1 reported the more individuals experience contact with Blacks, the more they support BLM. We found more consistent results when the quality of the intergroup interaction is taken into account. All three studies investigating positive intergroup contact with Blacks find that the more individuals report having positive interactions with Blacks, the greater is their support for the BLM movement (S12, S17.2, S17.3). Moreover, the relationship between negative intergroup contact with Blacks and support for BLM is consistently found to be non-significant across two studies (S12, S17.2).
Police misconduct. Two studies investigated whether individuals’ perceptions of police misconduct were related to support for BLM (S10, S21). Alternatively, one study investigated perceptions of police misconduct in relation to African Americans, in specific (S19). Results are mixed with two studies finding that individuals who believe police misconduct occurs are more prone to support the BLM movement (S10, S19), while one study reported a non-significant association between perceptions of police misconduct and BLM support (S21).
Empathy, anger, and willingness for collective action. Three studies belonging to the same article investigate the relationship between support for BLM, empathy for Black people, anger in the context of racial injustices, and willingness for collective action (S17.1, S17.2, S17.3). All three studies find significant and positive bivariate correlations between empathy, anger, willingness for collective action, and support for BLM. Interestingly, as these studies are applied to the context of intergroup contact, all three studies consistently show that positive intergroup contact with Blacks is associated with support for BLM through a sequential process of increasing empathy for Blacks and subsequently anger towards racial injustice.
Taking Stock
The systematic review revealed informative patterns. Race and ethnicity, as well as partisanship and ideology are reliable predictors of support for the BLM movement. Whites, Republicans, and conservatives consistently opposed BLM. Social psychological variables such as low social dominance orientation and authoritarianism, positive intergroup contact, empathy for protestors, anger, and willingness to participate in collective actions in response to social injustices are all consistently associated with BLM support. Similarly, prejudice towards African Americans and lack of recognition of existing racial discrimination against Black people consistently predict opposition to BLM. Education and income show a consistent pattern of non-significance. The remaining demographics (i.e., age, gender, and urbanicity), as well as personal experiences with discrimination and perceptions of police misconduct, are inconsistent predictors of BLM support across studies. Being female, from urban areas, and perceiving police misconduct are found to be positively associated with BLM support in most studies, even if other studies found these associations non-significant. In contrast, age and personal experiences of discrimination are mostly non-significant, even if a few studies find these variables to be negatively associated with BLM support.
While relatively minor, these inconsistencies could arise from cross-sample heterogeneity and differences in the racial and ethnic sample composition of reviewed studies. Additionally, the use of convenience, non-representative, and small-N samples, raises further concerns about potential existing biases on the published record.
To address these concerns, in Study 2, we aim to confirm the earlier-described patterns and explore a wider range of predictors of BLM support. To this end, we conduct multiple meta-analyses of thirteen public opinion datasets (N=31,779) which offer several advantages towards the consolidation of a profile of BLM supporters. First, the use of large probability-based nationally representative samples enables precise and generalizable estimates of BLM support. Second, results obtained from the multiple meta-analyses are not dependent on the (idiosyncratic) analyses reported in the current literature, nor are they subject to publication biases. Third, the comparison of the same BLM predictors across datasets allows us to investigate the robustness of prospective correlates of BLM support across different samples while assessing its heterogeneity. Finally, by comparing the magnitude of effect-sizes of a diverse set of determinants of BLM, we provide a comprehensive view of the most important factors determining support for BLM.
Study 2: Systematic Multiple Meta-Analyses of Public Opinion Datasets
Methods
To identify suitable public opinion datasets containing questions on support for the BLM movement, we conducted a systematic search using the Roper Center for Public Opinion Research (iPoll), on December 23, 2020. The process is akin to that of a systematic review, except that the unit of observation is a dataset as opposed to a scientific article. We detail our search methodology and inclusion criteria in the online appendix (Sections 2.1-2.3).
Results
For each dataset, we ran a bivariate Pearson’s correlation between each identified predictor and BLM support. We then pooled correlations of the same predictor and conducted a random-effects meta-analysis, with the Sidik-Jonkman estimator, to assess the heterogeneity of the effects (Harrer et al. Reference Harrer, Cuijpers, Furukawa and Ebert2021). The choice for random, as opposed to fixed, meta-analyses was based on the need to account for the study effect showing more variance than when drawn from a single population and to control for the effect of statistical heterogeneity (Schwarzer, Carpenter, and Rücker Reference Schwarzer, Carpenter and Rücker2015). To interpret the magnitude of meta-analytical effect-sizes and contextualize it in relation to the published literature, we use empirically derived guidelines for effect-size interpretation (Lovakov and Agadullina Reference Lovakov and Agadullina2017). According to this system, correlation coefficients of 0.12, 0.24 and 0.41 correspond, respectively, to the twenty-fifth (small effect), fiftieth (medium effect), and seventy-fifth (large effect) percentiles of the distribution of effect-sizes in the literature. This study design yields high statistical power which can detect even very small effect-sizes. We also conducted an individual respondent meta-analysis (Stewart and Tierney Reference Stewart and Tierney2002)—also known as integrative data analysis (Curran and Hussong Reference Curran and Hussong2009)—obtaining largely equivalent results.
We summarized 234 associations between support for Black Lives Matter and its predictors in figure 3. We describe the found thirty-seven predictors in seven clusters—namely, demographics, race and ethnicity, partisanship and ideology, voting behavior and political attitudes, attitudes towards immigration, racial attitudes and economic attitudes. In addition, two measures of heterogeneity are provided. Tau-squared (t2) represents the variation between the effects observed across datasets with smaller values indicating lower variation (Deeks, Higgins, and Altman Reference Deeks, Julian, Altman, Higgins, Thomas, Chandler, Cumpston, Li, Page and Welch2011). I2 quantifies the percentage of variation across datasets that is due to heterogeneity between the datasets rather than sampling error (Higgins Reference Higgins2003) with values above 50% indicating substantial heterogeneity (Deeks, Higgins, and Altman Reference Deeks, Julian, Altman, Higgins, Thomas, Chandler, Cumpston, Li, Page and Welch2011). Although I2 is more commonly used than other heterogeneity measures, it becomes less adequate for high-powered meta-analyses, as the sampling error tends to zero and I2 tends to 100% (Harrer et al. Reference Harrer, Cuijpers, Furukawa and Ebert2021). Given the high sample size of the meta-analyses reported here, for 92% of predictors heterogeneity as measured by I2 is considered to be substantial (>50%) even if the estimate’s confidence interval is comparatively small. Furthermore, we note that t2, which is insensitive to both k and N, tended to zero for all predictors, indicating low heterogeneity between datasets.
Overview of multiple meta-analyses
Notes: The N denotes the number of respondents across datasets used to calculate the meta-analytical correlation between support for BLM and a given predictor. Note that this number may differ across predictors using the same datasets as it is contingent upon the predictors’ amount of missing data. The total number of datasets is denoted by k. Two measures of heterogeneity of the meta-analytical Pearson’s r are provided: t2 and I2. Bars to the right of the dashed line denote positive associations between the predictor and BLM support, whereas bars to the left of the dashed line denote negative associations with BLM support. Lastly, on the right, the meta-analytical Pearson’s r is provided accompanied by its 95% confidence interval.

The purpose of Study 2 is to provide confirmatory evidence for—and expand the conceptual breadth of—predictors investigated in Study 1. For brevity, we deferred to section 2.4 of the online appendix, a detailed statistical description of results, while summarizing main takeaways here.
Results of the multiple meta-analyses largely corroborate the results of Study 1. We find that BLM support is negatively associated with age, being white, Republican, and conservative, and positively related with being female (versus male), African American, and believing Blacks are more likely to experience both police violence and discrimination in the United States. Another consistent effect is that experiencing discrimination is not associated with BLM support. Two predictors, however, showed divergent results in our two studies—namely, education and income—which were consistently found to be non-significative across reviewed studies, but significative in Study 2: education was positively related to BLM support while income showed the inverse association.
With Study 2, we build on the scope of demographics, voting behavior, and political, racial, immigration and economic attitudes. Results show that not identifying with a religious denomination, being single (versus married), employed (versus retired), and Asian American is associated with BLM support. Being Hispanic American, however, appears to bear no association with support for BLM. Political behavioral predictors display some of the highest effect-sizes. Voting intention for the Republican nominee in 2016 and 2020 as well for Republican House of Representatives members are highly related to BLM opposition. Similarly, political attitudes such as approval of Trump’s presidency and disapproval of Obama’s, favorability towards Trump and antagonism for Clinton, and believing Trump would handle race relations better than Biden are all strongly and negatively related to BLM support. We also expand the findings of Study 1 to attitudes about immigration, race, and economics. All three immigration-related attitudes display the same pattern, the more one believes immigrants take jobs away from Americans, holds the view that illegal immigrants living in the U.S. should be required to leave the country, and favors building a wall along the United States and Mexico border, the lower the support for BLM. A similar pattern is found regarding racial attitudes. Thinking Black (versus white) Americans are more likely to experience police violence, that generations of slavery and discrimination have created conditions that make it difficult for Blacks to work their way out of the lower class, that race relations in the United States are getting better (during the Obama presidency), and that racial discrimination against Blacks is a serious problem, are all consistent predictors of support for BLM. Economic attitudes all suffer from the president-in-power-effect (e.g., correlations between BLM support and being optimistic about future and personal finances flip direction once Trump is elected).
Subgroup Analyses
We were also interested in the predicted probability of support for the BLM by various societal groups and subgroups, exploring differences in how political cleavages may shape support for BLM, and identifying group-based disparities that could potentially motivate targeted interventions. We present results in percentages to facilitate interpretation. All discussed results are statistically significant (p < 0.001), even when correcting for multiple comparisons. Refer to Section 2.5 of the online appendix for additional details on methodology and results (e.g., Ns in each cell).
Results are displayed in figure 4 and reveal that out of the eleven societal groups, symbolic ideology appears to cleave support for BLM the most, with a difference of more than 62 perceptual points between liberals and conservatives. Party identification follows with a gap of 54% in BLM support between Democrats and Republicans. Race represents the third largest cleavage on BLM support: while 82.3% of African Americans support BLM, only 47.3% of whites endorse the movement. More mild differences are observed across religious affiliation, where we observe Catholics and Protestants being substantially less prone to support BLM than non-religious individuals. Disparities in age are also modest, with young adults (18–29 years) showing 21% more support for BLM than adults older than 65 years. An identical gap is observed between single/never married and married individuals, with the former showing more support than the latter. Across remaining groups, differences between subgroups become less pronounced.
Percentage of endorsement of BLM across societal groups and subgroups
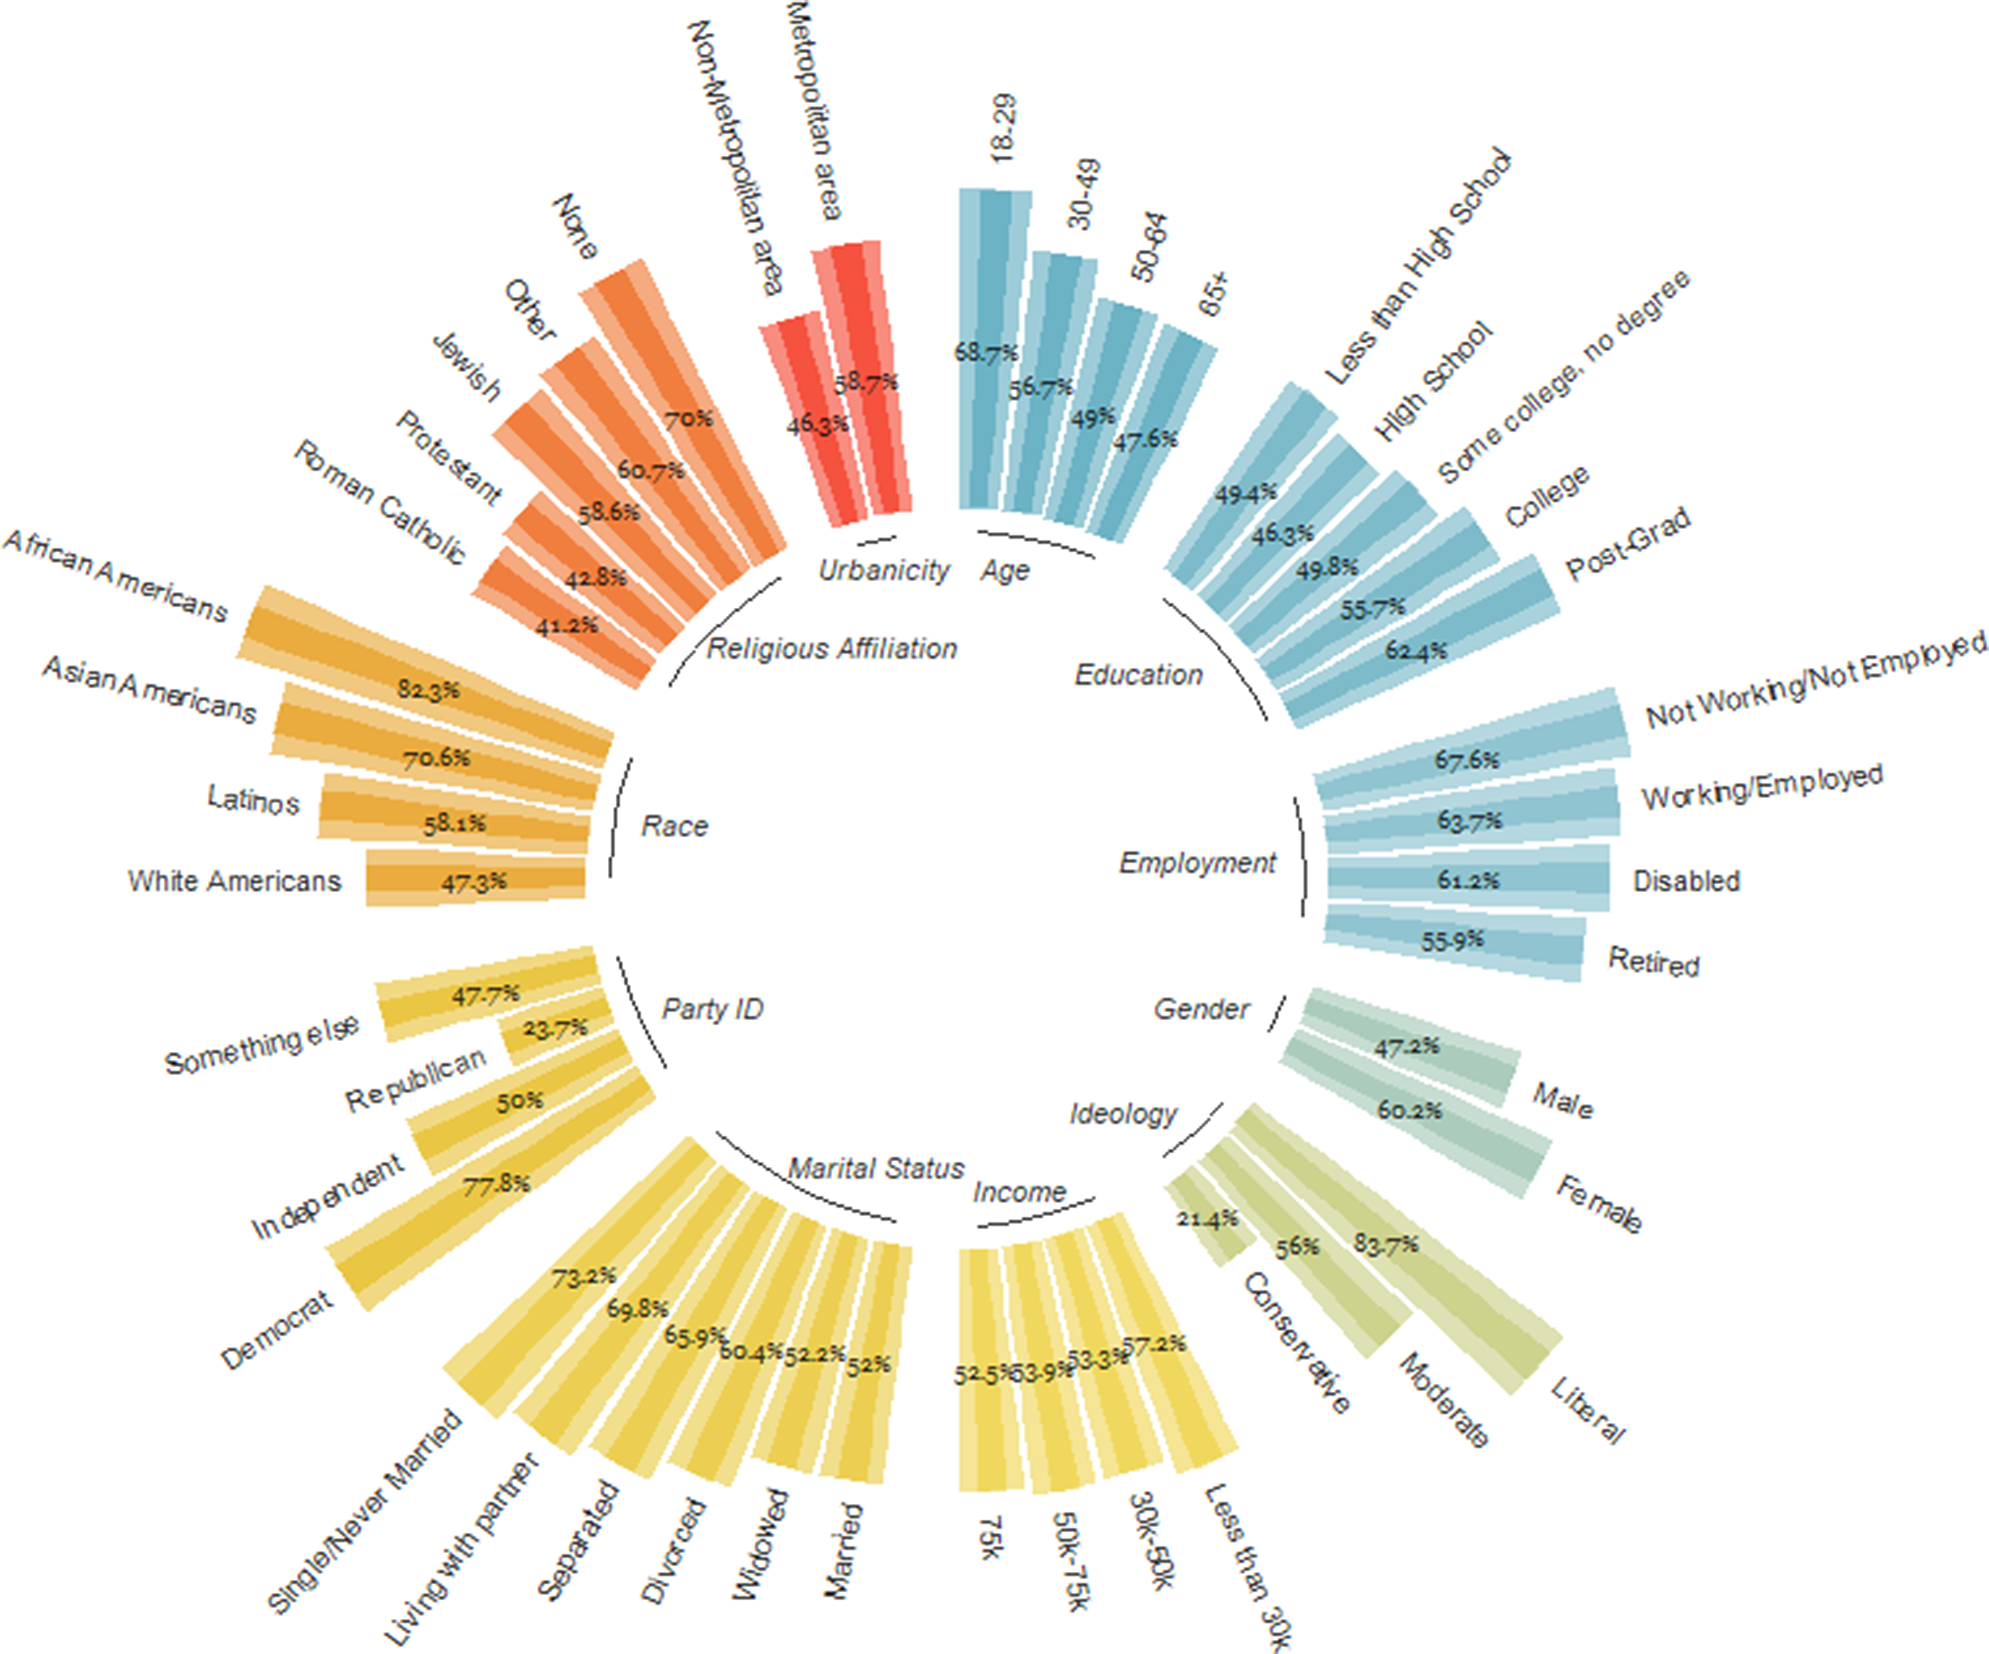
These analyses reveal that there is substantial heterogeneity within societal groups, suggesting stronger appreciation for subgroup analyses will likely yield illuminating insights into contemporary racial attitudes and BLM support.
Multivariate Regressions
So far, we sought to analyze the demographic, political, social, and psychological bases of support for BLM, focusing especially on zero order associations, as is the standard practice when the goal is to synthesize empirical research (Donnelly et al. Reference Donnelly, Boyd, Campbell, Craig, Vallance, Walport, Christopher, Woods and Wormald2018) and maximize the generalizability of presented results against idiosyncratic controls, covariates, and statistical models (Gelman and Loken Reference Gelman and Loken2014; Breznau et al. Reference Breznau, Rinke, Wuttke, Adem, Adriaans, Alvarez-Benjumea and Andersen2021). This bivariate approach was also used due to the limitation that common predictors are seldom found across several datasets, and thus merging individual datasets to conduct an omnibus regression would not be feasible except for a few demographics and partisanship. For this reason, to assess which predictors are comparatively stronger and robust to controls in a multivariate setting, we resorted to applying a series of regressions—maximizing the use of available variables per dataset—to identify a subset of predictors that consistently and reliably exhibited significant effects (Zou and Hastie Reference Zou and Hastie2005). This approach minimizes the influence of false positives and spurious relationships and complements the multiple meta-analyses against the inferential pitfalls of separately modeling closely related constructs.
In figure 5 (panel A), predictors of BLM are presented and broken down by the number of times each predictor is available across datasets and found to be statistically significant in the multivariate regressions. Overall, twenty-seven out of the thirty-seven predictors were significantly related to BLM support controlling for other variables at least once (eighteen at least twice, ten at least trice), suggesting BLM in America is a complex, multifaceted issue influenced by various competing and intersectional factors. Notwithstanding, symbolic ideology (conservatism) is the most frequent predictor significantly associated with BLM support (ten out of the eleven datasets) whereas party identification is only a significant predictor of BLM support in six out of the thirteen datasets. Attitudes towards immigrants, support for Trump, and attitudes like believing BLM protests are legitimate and perceiving racial discrimination are also often significant predictors of BLM support. Furthermore, even after adjusting for other variables, Blacks versus others, female versus male, and education remained often significant predictors, suggesting support for BLM is cleaved across race, gender, and education levels. An overview of variables present in each model is provided in section 2.6 in the online appendix.
Relative proportion of significant predictors when controlling for other variables (panel A) and averaged standardized effect-sizes (panel B) for multiple linear regressions across datasets
Notes: Panel A compares the number of times a predictor is available across datasets and the times it is a significant predictor of BLM support when accounting for all other available predictors. Panel B shows the meta-analytical standardized regression coefficients (Gelman, Reference Gelman2008), with a 95% confidence interval, across 13 datasets. On panel B, the grayscale highlights the number of times each predictor is statistically significant, controlling for other variables, with darker colors representing higher frequency of statistical significance.

To identify the most robust and strong predictors, we standardized regression slopes (Gelman Reference Gelman2008) and proceeded to calculate the average effect of each predictor across datasets. We display the standardized regression coefficients in figure 5 (panel B) where we applied a transparency filter to highlight the number of times each predictor was significant as a proxy for reliability of the estimated effect-size. Among the most frequently significant predictors, symbolic ideology and party identification have the largest, most robust effect-sizes, followed by race (Blacks versus others) and gender. Attitudes towards immigrants, political attitudes (i.e., approval of Trump, vote intention for the House of Representatives) and attitudes like BLM legitimacy, protesting for racial equality, perceptions of racial discrimination, and perceived systematic racism all had a moderate effect on BLM support. Even if vote intention for Trump in 2016 and Republicans in the 2020 election have the largest effect-size in predicting BLM opposition, we note these variables were only significant twice and once, respectively. We also provide a dot-and-whisker plot of standardized averaged regression coefficients per dataset in figure 6. It can be observed that the direction and magnitude of most predictors is consistent across datasets. For example, despite some small variations in effect size, across all datasets in which symbolic ideology is a significant predictor of BLM support (after controlling for other variables), conservatism always predicts lack of BLM support. The same is true for party identification: self-identifying as a Republican always predicts lack of BLM support. Gender and race are always found to be positive predictors of BLM support, with females and Blacks showing greater support for the movement compared to males and whites, respectively. Education and experienced discrimination are the only predictors for which the direction of the effect changes across datasets, which explains why their confidence bands include zero in figure 5 (panel B). This variation across datasets might suggest that the effect of these variables on BLM support is contingent on available controls, sample characteristics, model covariates, or measurement differences.
Standardized regression coefficients
Notes: This dot-and-whisker plot of standardized regression coefficients (Gelman Reference Gelman2008) summarizes, per dataset, the significant predictors of BLM support, controlling for other variables.

The goal of these multivariate analyses was to tease apart the effects of the most reliable predictors of BLM support found in Studies 1 and 2. When predictors were entered simultaneously into multivariate regression models, endorsement of politically conservative ideology was the most reliable predictor. Other factors including race, gender, and partisanship—while important—were less reliable in comparison with ideology. These patterns of associations are indicative of conservatism being a key factor explaining variance in support for the BLM movement, and of racial inequality more broadly.
These findings are hard to square with the ideological innocence hypothesis (Kinder and Kalmoe Reference Kinder and Kalmoe2017). According to Kalmoe (Reference Kalmoe2020, 18), “partisan identification has broader and stronger empirical and theoretical foundations for guiding public opinion” and that “mass partisanship routinely outperforms ideology.” We found the opposite. Not only ideology vastly outperforms partisanship, but partisanship is outperformed by race and gender (at least as far as consistency is concerned). It is worth noting that since Converse (Reference Converse and Apter1964), the explanatory and theoretical value of ideology for the study of political behavior—and that of racial attitudes and racism specifically—is often downplayed, when not omitted completely (see Azevedo et al. Reference Azevedo, Jost, Rothmund and Sterling2019, Azevedo and Jost Reference Azevedo and Jost2021; and Jost Reference Jost2021, for a critique and counterexamples).
Discussion
I carry the memory of living under terror—the terror of knowing that I, or any member of my family, could be killed with impunity—in my blood, in my bones, in every step I take.
—Khan-Cullors and Bandele Reference Khan-Cullors and Bandele2018, 15Police brutality against Blacks is deeply endemic to the fabric of America. Black individuals are 3.5 times more likely to be met with police brutality than white people (Geller et al. Reference Geller, Goff, Lloyd, Haviland, Obermark and Glaser2021), and Black males—in particular—are 5 times more likely to be killed by the police than their white counterparts (Robinson Reference Robinson2017). Adding insult to injury, African Americans are also systematically incarcerated at much higher rates than white people (Carson Reference Carson2020), more prone to be convicted and receive harsher sentences (Anwar, Bayer, and Hjalmarsson Reference Anwar, Bayer and Hjalmarsson2021), and vulnerable to the U.S. misdemeanor system impeding their social-economic mobility. The U.S. criminal justice system is riven by racial bias (Bronner Reference Bronner2020). When it comes to wealth inequality, the median white household owns 7.8 times more wealth than Black households (Moss et al. Reference Moss, McIntosh, Edelberg and Broady2020) and these economic disparities are likely to persist for generations as Black Americans are significantly less likely to achieve upward economic mobility than white Americans (Chetty et al. Reference Chetty, Hendren, Jones and Porter2020). In the context of access and quality of care, Black patients are at an increased risk of not receiving proper care for chronic diseases (Chin, Zhang, and Merrell Reference Chin, Zhang and Merrell1998) and of not being rated as suitable candidates for organ transplantation (Epstein Reference Epstein, Ayanian, Keogh, Noonan, Armistead, Cleary and Weissman2000). The COVID-19 pandemic is no exception, having disproportionately affected Black communities both in terms of infection and death rates (Millett et al. Reference Millett, Jones, Benkeser, Baral, Mercer, Beyrer and Honermann2020; Tai et al. Reference Tai, Shah, Doubeni, Sia and Wieland2021). These facts are but a few pieces of the jigsaw puzzle depicting the various systems that detrimentally and disproportionately affect Black lives. The evidence of systemic racism against African Americans in the United States is so overwhelming it should be incontrovertible.
Against this backdrop, we sought to uncover the demographic, political, and psychological bases of BLM support by conducting a systematic literature review and multiple meta-analyses. Study 1 uncovered important patterns in the published literature for which Study 2 provided independent, high quality confirmatory evidence, as well as an expansion of its conceptual breadth. We found the specific arrangement of associations between support for BLM and demographic, social, and political constructs is indicative of a system of interconnected beliefs whose goal is to hinder—if not impede—racial progress. In interpreting the theoretical breadth and prevalence of investigated constructs, there is a near-perfect correspondence between opposition to BLM and positive attitudes towards American institutions that are deeply rooted in systemic racism (e.g., the police, Republican Party, Conservatism), the attitudes disseminated by these actors, and the psychological predispositions habitually associated with endorsing them. This interpretation is furthered by the multivariate analyses, which pitted predictors against one another, showing that liberal-conservative differences prevailed over other robust predictors of BLM attitudes. We argue for a greater appreciation of the ideological character of contemporary racial attitudes and behaviors on the part of whites and Blacks in the United States and contend that political ideology matters insofar as it underlies both the legitimation of existing forms of inequality and the desire for societal change. Hence, the inclusion of ideology in models of collective action is paramount (Becker Reference Becker2020).
Our results have theoretical and methodological implications for the study of BLM, especially regarding promising directions for future research. First, the nomological network of BLM support is powerfully interwoven and should not be studied disjointedly—or be relegated to accessorizing partisanship—but as a system of interrelated attitudes toward social, racial, and political “others”. Second, results suggest that American public opinion on BLM is largely cleavaged across race and gender, demonstrating a fertile territory for intersectional and critical approaches to the study of racial inequality, and political behavior in general. Similarly, as cross-racial coalitions are essential to the fight for racial equality, research on support for BLM across different racial-ethnic groups is sorely needed. Third, as we uncovered insightful patterns diving deeper into societal subgroups such as in the case of religious affiliation and urbanicity, research providing more granularity on religious denominations, sexual and gender orientations, levels of income, education, and urbanicity might uncover patterns our approach was unable to. Fourth, when available, psychological factors were found to be highly robust predictors of BLM support suggesting that an in-depth systematic examination of the psychological bases of BLM support would shed light into its underlying motives and dispositions, beyond that of partisanship or ideology. Lastly, as BLM ventures overseas, it would be exceedingly valuable to investigate whether the findings presented in this work generalize cross-nationally.
Conclusion
BLM demonstrations rose against police brutality, one of many institutions of American society that “prioritizes the comfort of white Americans over the lives of people of color” (Oliver Reference Oliver2020). The prerogative of the BLM movement is, and has always been, about bringing relief to those who had long lived under a regime of racial oppression (Jefferson and Ray Reference Jefferson and Ray2022). In the words of its co-founder: “We have a right to live” (Khan-Cullors and Bandele Reference Khan-Cullors and Bandele2018, 14). Yet despite the rather elementary mission, white backlash has been unrelenting. To the privileged—when all you have ever known is unfettered, unimpeded privilege—other people’s right to live can feel like oppression. It is to this sentiment that rancid, racist rhetoric resonates. To Trump, GOP supporters, and contemporary conservatism in the United States, the goal of the BLM movement is “to achieve the destruction of the nuclear family, abolish the police, abolish prisons, abolish border security, abolish capitalism, and abolish school choice” (Villarreal Reference Villarreal2020). This conservative reactionarism (Parker and Barreto Reference Parker and Barreto2014; Robin Reference Robin2011) leads to viewing the oppressed as “terrorists,” the victims as “thugs,” and those who are demonstrating for racial equality as “rioters”. BLM’s very existence and pursuit for racial equality have been subverted to galvanize support for counter movements (Becker Reference Becker2020) and racist causes (Taylor Reference Taylor2019), further entrenching systemic racism in the American political ethos (Jefferson and Ray Reference Jefferson and Ray2022). To conclude, as America grapples with the extent of its systemic racism, it is fundamental to broaden the scope of research on race and ethnicity in general and on the BLM movement more specifically to amplify the voices of racial minorities, inform policies that challenge American institutions, and reshape them towards racial equality.
Supplemental Materials
To view supplementary material for this article, please visit http://doi.org/10.1017/S1537592722001098.
-
1. Systematic Literature Review (Study 1)
-
1.1. Identification and screening
-
1.2. Extraction of metadata
-
1.3. Additional results
-
-
2. Multiple meta-analysis (Study 2)
-
2.1. Search methodology
-
2.2. Dependent variable
-
2.3. Predictor variables
-
2.4. Detailed results Multiple Meta-analyses
-
2.5. Detailed methods and results for the Subgroup Analyses
-
2.6. Multivariate Regressions
-
2.7. References for the datasets used in Study 2
-
Acknowledgements
The authors would like to thank Ben Saunders, Nicholas Davis, Sam Parsons, Lucas de Abreu Maia, Laurits Bromme, and John Jost for helpful comments on earlier versions of this paper. They also thank the anonymous reviewers and Michael Bernhard, Christopher S. Parker, and Jennifer Boylan for their constructive feedback.
Dedication
To the memory of George Perry Floyd Jr., October 14, 1973–May 25, 2020.


 Open access