

1. INTRODUCTION
The McMurdo Dry Valleys (MDV) of Victoria Land, Antarctica, are the largest ice-free region on the continent (Drewry and others, Reference Drewry, Jordan and Jankowski1982; Levy, Reference Levy2012), as well as a polar desert that is one of the coldest and driest on Earth (Fountain and others, Reference Fountain1999b). Snowfall is infrequent and most snow sublimates with relatively little melt to the soils and streams (Keys, Reference Keys1980; Gooseff and others, Reference Gooseff, Lyons, McKnight, Vaughn, Fountain and Dowling2006; Fountain and others, Reference Fountain, Nylen, Monaghan, Basagic and Bromwich2010; Hagedorn and others, Reference Hagedorn, Sletten, Hallet, McTigue and Steig2010; Eveland and others, Reference Eveland, Gooseff, Lampkin, Barrett and Takacs-Vesbach2013). Consequently, glacier melt provides the primary source of water to ephemeral streams that flow for ~10 weeks each summer (Dana and Wharton, Reference Dana, Wharton and Priscu1998; McKnight and others, Reference McKnight, Niyogi, Alger, Bomblies, Conovitz and Tate1999; Foreman and others, Reference Foreman, Wolf and Priscu2004). But the glacier surfaces are typically below the melt threshold during the summer and runoff is quite limited given the large expanse of ice present in the valleys (Fountain and others, Reference Fountain, Dana, Lewis, Vaughn, McKnight and Priscu1998; Lewis and others, Reference Lewis, Fountain and Dana1998; Bliss, Reference Bliss2005; Hoffman and others, Reference Hoffman, Fountain and Liston2008, Reference Hoffman, Fountain and Liston2014; MacDonell and others, Reference MacDonell, Fitzsimons and Mölg2012). Episodic (~decadal) warming events have been shown to have substantial impact on glacier ablation, hydrology, geomorphology and ecology of the MDV (Foreman and others, Reference Foreman, Wolf and Priscu2004; Doran and others, Reference Doran, McKay, Fountain, McKnight and Barrett2008; Nielsen and others, Reference Nielsen2012; Levy and others, Reference Levy2013; Fountain and others, Reference Fountain, Levy, Gooseff and Van Horn2014). The climate sensitivity of these glaciers, and polar glaciers in general (Oerlemans and Fortuin, Reference Oerlemans and Fortuin1992; Oerlemans and others, Reference Oerlemans1998; Cuffey and Paterson, Reference Cuffey and Paterson2010), has received little study.
Previous studies of glacier melt in the MDV have included both physically complete but spatially and/or temporally limited surface energy-balance models (Lewis and others, Reference Lewis, Fountain and Dana1998, Reference Lewis, Fountain and Dana1999; Bliss, Reference Bliss2005; Johnston and others, Reference Johnston, Fountain and Nylen2005; Hoffman and others, Reference Hoffman, Fountain and Liston2008, Reference Hoffman, Fountain and Liston2014; MacDonell and others, Reference MacDonell, Fitzsimons and Mölg2012) and spatio-temporally extensive but physically limited statistical models (Dana and others, Reference Dana, Davis, Fountain and Wharton2002; Jaros, Reference Jaros2003; Ebnet and others, Reference Ebnet, Fountain, Nylen, McKnight and Jaros2005; Jaros and others, Reference Jaros, McKnight, Gooseff, Fountain and Nylen2014). The former category of studies has indicated that melting is never a large term of the surface energy budget in these glaciers, and minor changes to energy losses and gains can result in large changes to melt and ablation. One form of this sensitivity is the presence of microclimates along vertical cliffs that form the termini of these glaciers (Chinn, Reference Chinn1987; Lewis and others, Reference Lewis, Fountain and Dana1999) and in sheltered and debris-rich topographic basins on the glacier surfaces (Johnston and others, Reference Johnston, Fountain and Nylen2005; Bagshaw and others, Reference Bagshaw, Tranter, Wadham, Fountain and Basagic2010; MacDonell and others, Reference MacDonell, Fitzsimons and Mölg2012). Statistical models have performed well at coarse spatial (drainage basin) and temporal (seasonal) scales, but introduce major uncertainty when applied outside of their calibration periods, due to changes in the underlying physical processes driving melt.
In previous papers, we have described a surface energy-balance model that works well for the glaciers of the MDV (Hoffman and others, Reference Hoffman, Fountain and Liston2008, Reference Hoffman, Fountain and Liston2014). The model nicely reproduced observations of surface lowering, ice temperature and ice density when penetration of solar radiation into the ice is included and when subsurface meltwater is allowed to drain away (Hoffman and others, Reference Hoffman, Fountain and Liston2014). This work showed that ablation of glacier surfaces in the MDV is dominated by sublimation with rare events of surface melt. However, subsurface melt and drainage was comparatively common and important for the heat and mass balance at the modeled locations.
In this paper, the model is applied across the ablation zones of the glaciers of Taylor Valley to determine whether the previous results and processes explain valley-wide mass-balance observations, generally, over 15 summers. After validating the model across the valley, we used it to investigate a change in ablation sensitivity that occurred midway through our period of study and inferred that modest and spatially variable changes in albedo, perhaps associated with deposition of windblown sediment, are the most likely cause. Finally, we assessed climate sensitivity of the MDV glaciers, considering changes to air temperature, ice albedo and wind speed.
2. STUDY AREA AND MEASUREMENTS
Taylor Valley is centrally located in the MDV adjacent to McMurdo Sound and is roughly 40 km long, oriented east–west (Fig. 1). The western end of the valley is blocked by Taylor Glacier, an outlet glacier of the East Antarctic ice sheet; the eastern end is open to the ocean but a moraine blocks most streamflow from exiting the valley. The valley floor is primarily covered by sandy soils, punctuated by perennially ice-covered lakes and glaciers descending from the adjacent mountain ranges connected by short streams. Mean annual air temperature on the valley floor ranges from −23 to −15°C, with mean summer air temperatures a few degrees below freezing (Doran and others, Reference Doran2002a). A prevalent feature of the MDV climate is intense downvalley drainage winds (often tens of m s−1) which can adiabatically increase temperatures by 10°C or more within hours. These events are more common in winter than summer (Doran and others, Reference Doran2002a; Nylen and others, Reference Nylen, Fountain and Doran2004; Speirs and others, Reference Speirs, Steinhoff, McGowan, Bromwich and Monaghan2010).
Map of Taylor Valley.

Alpine glaciers, up to a few tens of km2 in area, flow from the adjacent mountains that border the valley. The ablation zones are generally bare ice all year, with episodic snow events in any season briefly (~week) covering the ice (Fountain and others, Reference Fountain, Dana, Lewis, Vaughn, McKnight and Priscu1998, Reference Fountain, Nylen, Monaghan, Basagic and Bromwich2009). A strong climatic gradient follows the valley axis with warmer, drier and windier conditions inland (west) (Doran and others, Reference Doran2002a; Nylen and others, Reference Nylen, Fountain and Doran2004; Fountain and others, Reference Fountain, Levy, Gooseff and Van Horn2014) creating a rise in the equilibrium line at a rate of 30 m km−1 (Fountain and others, Reference Fountain, Lewis and Doran1999a, Reference Fountain, Nylen, MacClune and Dana2006). While sublimation is the dominant form of ablation, melt can also be important, with the majority of melt occurring beneath the ice surface in the upper 20 cm of ice (Fountain and others, Reference Fountain1999b; Hoffman and others, Reference Hoffman, Fountain and Liston2014).
A network of four on-glacier (designated CAA, TAR, HOD and COH) and four off-glacier meteorological stations have measured air temperature, relative humidity, wind speed and direction, and incoming shortwave and longwave radiation across Taylor Valley at 15 min measurement intervals since the mid-1990s (Doran and others, Reference Doran2002a, Reference Doranb; Nylen and others, Reference Nylen, Fountain and Doran2004) (Fig. 1). During the study period, average summer (November–January) air temperature ranged from −6.0°C in 2006 to −3.9°C in 2001 at the Taylor Glacier AWS (Fig. 2). The 2001 summer had substantially greater degree-days above freezing than other years.
Summer (November–January) meteorological variables at Taylor Glacier meteorological station: (a) Mean air temperature; (b) total degree-days above freezing; (c) mean wind speed; (d) mean incoming solar radiation.

Seasonal mass-balance measurements were collected on four glaciers in the valley using a network of stakes on each glacier (Fountain and others, Reference Fountain, Nylen, MacClune and Dana2006). The fundamental measurements at each stake are the change in glacier surface height against a stake drilled into the glacier and surface density from which mass balance is calculated. Also, limited measurements of the mass balance of the vertical terminal cliffs of Canada and other glaciers were recorded (Lewis and others, Reference Lewis, Fountain and Dana1999; Fountain and others, Reference Fountain, Nylen, MacClune and Dana2006) (Fig. 1).
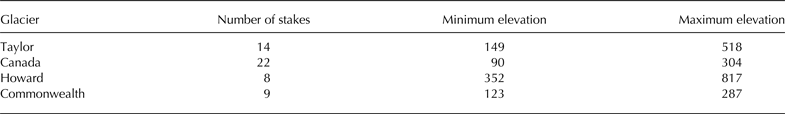
In this study, a subset of 53 ablation stakes measured from 1995 through 2011 and restricted to the ablation zones of the glaciers were used to test the model (Fig. 1; Table 1). Because the surface mass-balance measurements assume a constant ice density (Fountain and others, Reference Fountain, Nylen, MacClune and Dana2006) but substantial mass loss occurs beneath the ice surface and lowers ice density (Hoffman and others, Reference Hoffman, Fountain and Liston2014), in this work we considered the stake measurements to record surface lowering and compared this with modeled surface lowering after accounting for changes in ice density due to the drainage of subsurface melt.
Number of mass-balance stakes on the ablation zones of each glacier, not including terminal cliffs. Stake elevations are m a.s.l.
3. DISTRIBUTED ABLATION MODEL DESCRIPTION
For runoff prediction we applied a spatially distributed version of a one-dimensional (1-D) surface energy-balance model used by Hoffman and others (Reference Hoffman, Fountain and Liston2014), which has previously been described in detail (Liston and others, Reference Liston, Winther, Bruland, Elvehoy and Sand1999; Hoffman and others, Reference Hoffman, Fountain and Liston2008; Hoffman, Reference Hoffman2011). This model is composed of a surface energy balance and a subsurface heat and mass balance of the upper 15 m of the glacier, which includes the penetration of solar radiation and the drainage of subsurface melt. In the surface energy balance:
 $$\chi (1 - \alpha ){{\rm Q}_{{\rm si}}} + {{\rm Q}_{{\rm li}}} + {{\rm Q}_{{\rm le}}} + {{\rm Q}_{\rm h}} + {{\rm Q}_{\rm e}} + {{\rm Q}_{\rm c}} = {{\rm Q}_{\rm m}},$$
χ allocates a fraction of the net solar radiation at the surface (with the remainder forming the subsurface heating source term; see Eqn (2)), α is the albedo, Q si is the incoming shortwave solar radiation, Q li is the incoming longwave radiation, Q le is the emitted thermal radiation, Q h is the sensible heat flux, Q e is the latent heat flux, Q c is the heat conduction in the ice and Q m is the energy available for melt, calculated as a residual. All heat flux terms have units, W m−2, and a positive sign is the energy directed toward the surface. Q si, α and Q li are supplied from observations, and the terms that cannot be directly measured (Q le, Q h, Q e, Q c) are cast in a form that leaves surface temperature, T 0, as the only unknown (Liston and others, Reference Liston, Winther, Bruland, Elvehoy and Sand1999).
The conductive heat flux, Q c, in Eqn (1) is calculated using a 1-D heat-transfer equation,
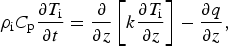 $${\rho _{\rm i}}{C_{\rm p}}\displaystyle{{\partial {T_{\rm i}}} \over {\partial t}} = \displaystyle{\partial \over {\partial z}}\left[ {k\displaystyle{{\partial {T_{\rm i}}} \over {\partial z}}} \right] - \displaystyle{{\partial q} \over {\partial z}},$$
where T i (K) is the ice temperature, z (m) is the vertical coordinate, t (s) is time, ρ i is the density of glacier ice (kg m−3), C p (J kg−1 K−1) is the specific heat of the ice and q (W m−2) is the net solar radiative flux. The thermal conductivity of the ice is dependent on the water fraction and ice temperature and density (Hoffman and others, Reference Hoffman, Fountain and Liston2008). When ice below the surface layer melts, a water fraction within each grid cell is accounted for, and any additional melt beyond 10% water fraction is assumed to instantly drain and run off out of the modeled domain (Hoffman and others, Reference Hoffman, Fountain and Liston2014). We refer readers to previous studies (Liston and others, Reference Liston, Winther, Bruland, Elvehoy and Sand1999; Hoffman and others, Reference Hoffman, Fountain and Liston2008, Reference Hoffman, Fountain and Liston2014; Hoffman, Reference Hoffman2011) for details of the model formulation, including the description of the latent and turbulent fluxes and calculation of the net solar radiative flux within the ice.
The model was spatially distributed using a 250 m grid, with a second 250 m grid representing the vertical cliffs along the glacier termini. Specifically, the 1-D (vertical) surface energy-balance model was applied independently at each model grid cell of the domain. The initial ice temperature profile for each grid cell was isothermally equal to the local mean annual air temperature, and the model spin-up period was 14 years of model time (once through the entire length of our input data time-series) to generate a realistic profile of internal ice temperatures.
The topography for the grids was generated using a 40 m resolution digital elevation model (DEM) acquired through the SPOT 5 SPIRIT program (Korona and others, Reference Korona, Berthier, Bernard, Rémy and Thouvenot2009), which was subsequently downsampled to 250 m. The modeling domain was restricted to the typically snow-free ice of the glacier ablation zones to predict runoff. Snowmelt on the glaciers is rare due to the high albedo and lower air temperatures away from the warm soils. In the accumulation zone when snowmelt does occur, it refreezes at depth, producing no runoff (Fountain and others, Reference Fountain, Dana, Lewis, Vaughn, McKnight and Priscu1998). The model was applied with an hourly time step for the period 1996–2011. We focused on model results for summer, with summer seasons defined by the dates of stake measurements, which typically occurred in early November and late January (a ~69 d duration). For convenience, we refer to each summer by the starting year (e.g. the 1996/97 austral summer is referred to as 1996).
The model requires three adjustable parameters: surface roughness (z 0), effective ice grain radius (r eff) and solar radiation surface fraction (χ), which partitions the incident solar radiation into that absorbed at the surface and that transmitted into the ice. Appropriate values for the three parameters were determined by Hoffman and others (Reference Hoffman, Fountain and Liston2014) at three glacier sites in Taylor Valley using 1680 Latin hypercube samples of the parameter space. The optimal values found for the three sites were similar, with some differences in z 0 that were explained by differences in observable roughness features. The values of the parameters quantified by Hoffman and others (Reference Hoffman, Fountain and Liston2014) were used in the present application except for z 0, which was varied as glacier surface roughness varied. Specifically, we use values of r eff = 0.064 mm, χ = 22% and a z 0 of 0.05 mm for smooth glacier ice and 1.0 mm for areas with rough topographic basins. These values yielded the smallest averaged RMSE for the three previous calibration sites.
Model inputs included air temperature, relative humidity, wind speed, incoming shortwave and longwave radiation and ice albedo. We generated hourly gridded weather data from the data of the eight meteorological stations in Taylor Valley using spatial interpolation by the quasi-physically based meteorological model MicroMet (Liston and Elder, Reference Liston and Elder2006). Before processing with MicroMet, the weather data were averaged to 1 h time intervals and wind speeds were adjusted to 3.0 m height, the nominal height of the instruments, assuming a neutral density profile to compensate for changing instrument height as the on-glacier meteorological stations ablated out of the ice. The shortwave radiation scheme in MicroMet was modified to account for topographic shading (Dozier and Frew, Reference Dozier and Frew1990) and to use measurements of incoming solar radiation to estimate cloudiness following parameterizations of the relation between clearness index and diffuse fraction (Liu and Jordan, Reference Liu and Jordan1960; Skartveit and Olseth, Reference Skartveit and Olseth1987; Skartveit and others, Reference Skartveit, Olseth and Tuft1998), and accounting for surface slope (Jonsell and others, Reference Jonsell, Hock and Holmgren2003) and direct and diffuse components (Hock and Holmgren, Reference Hock and Holmgren2005). Additionally, to extrapolate our measurements of incoming longwave radiation across Taylor Valley, we used parameterizations for clear-sky and all-sky emissivity of Konzelmann and others (Reference Konzelmann, van de Wal, Greuell, Bintanja, Henneken and Abe-Ouchi1994), after assessing the performance of over 20 published longwave radiation parameterizations (summarized by König-Langlo and Augstein, Reference König-Langlo and Augstein1994; Pirazzini and others Reference Pirazzini, Nardino, Orsini, Calzolari, Georgiadis, Levizzani and Smith2001; Flerchinger and others, Reference Flerchinger, Xaio, Marks, Sauer and Yu2009). Finally, MicroMet was run separately for the vertical cliffs along the glacier termini to capture topographic effects on radiation for these surfaces. Details of the modifications to MicroMet and its application to Taylor Valley are described by Hoffman (Reference Hoffman2011).
Ice albedo is a particularly important model input. To reduce noise in albedo time-series and to provide more spatially representative values, we used the average of daily-averaged albedo measured at two glacier meteorological stations (CAA and TAR) that are well below their glacier's equilibrium lines. The HOD and COH meterological stations also measure albedo but are located at the equilibrium line and the glacier surfaces there are typically snow covered. During the summer of 2001, bare ice was exposed at the equilibrium line of HOD and COH, revealing that ice albedo on these glaciers is ~0.05 less than at CAA and TAR, so we lower albedo on these glaciers accordingly. More detailed information on spatial variations of ice albedo was not available. Snow events, though infrequent, dramatically change the albedo and reduce runoff (Fountain and others, Reference Fountain, Nylen, Monaghan, Basagic and Bromwich2010; Hoffman and others, Reference Hoffman, Fountain and Liston2014). We ignore snow events entirely, for two reasons. First, the meteorological stations are all located relatively high on the ablation zones, and snowfall at those elevations is more frequent than at lower elevations where runoff is more abundant. Second, comparisons between model versions that ignored and included snow events showed a negligible difference in overall model skill.
Previous studies of MDV glaciers have identified large spatial variations in surface energy balance and melt production due to local microclimates. To account for these variations, we established three submodels, one for smooth glacier surfaces, one for basins with complex relief and one for terminal cliffs.
3.1. Smooth surfaces
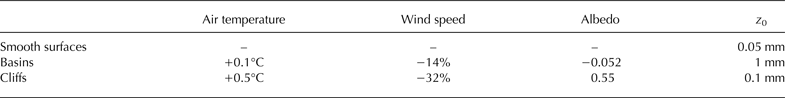
The surface morphology and ice composition over most of the ablation zones are dominated by gently sloping, smooth surfaces composed of bubbly, white ice (Fig. 3a) (Hoffman and others, Reference Hoffman, Fountain and Liston2008, Reference Hoffman, Fountain and Liston2014). The surface is pockmarked with cryoconite holes and refrozen fractures composed of bubble-free blue ice covering about 4–6% of the area of these surfaces in Taylor Valley (Fountain and others, Reference Fountain, Tranter, Nylen, Lewis and Mueller2004), which we ignore for this application. Concentrated sediment is found within cryoconite holes, but rare on the glacier surface. In these locations, we applied the distributed meteorological data without adjustment and used the smaller surface roughness value (z 0 = 0.05 mm).
Photographs demonstrating the topographic morphologies modeled. (a) Smooth surface and cliff topographic morphologies (Howard Glacier). The cliff here is ~25 m high. (b) Basin morphology showing floors, walls and ridges (Taylor Glacier).

3.2. Basins
Basins are locally rough terrain incised into the once smooth glacier surface. These melt-formed features are found near the glacier termini and exhibit vertical cliffs up to 20 m high, rumpled basin floors and narrow passages between basins downstream (Fig. 3b). This topography is common to many glaciers, including Taylor, Rhone, LaCroix, Suess and Canada glaciers (Johnston, Reference Johnston2004) (Fig. 1). Basins are associated with abundant sediment and rock debris from a variety of possible sources – medial moraines on Taylor Glacier, windblown sand and silt on Canada Glacier or rock avalanche debris elsewhere. The basins are hypothesized to develop from this debris, which causes local melting, a more energetically efficient ablation process that results in the formation of local depressions (Lewis, Reference Lewis2001; Johnston and others, Reference Johnston, Fountain and Nylen2005). Compared with the surrounding smooth surfaces, the depressions more effectively trap solar radiation due to multiple reflections from the walls and floor, and experience lower wind speeds, which reduce turbulent exchange (MacClune and others, Reference MacClune, Fountain, Kargel and MacAyeal2003). These differences increase local temperature and humidity, further favoring melt. In addition, the accumulation of sediment and refreezing meltwater (forming ‘blue ice’) in the basin reduces the albedo of the basin floor. In some cases, the meltwater forms ice-topped pools 10–50 m in diameter (Bagshaw and others, Reference Bagshaw, Tranter, Wadham, Fountain and Basagic2010). Enhanced melt occurs within the basins and melt areas enlarges them at the expense of the surrounding smooth surfaces. We do not differentiate the morphology, orientation or causal mechanism of channels and basins, and for simplicity we refer to all topographically rough regions as ‘basins’.
The spatial distribution of basin terrain was mapped empirically, using the criteria of relief >3 m within a 10 m × 10 m area using a 2 m resolution DEM (US Geological Survey, 2012). This criterion roughly corresponds to slopes >15°. The regions were manually revised to ensure that smooth surfaces with high slope were not included and that basin floors and intervening ridges with low slope were included. Within the areas delineated as basins, the topography was further divided into three components: floors, walls and intervening ridges (Table 2). Floors were identified by slopes <15° with concave-up curvature (calculated over distances of 20 m), walls were identified by slopes >15° and ridges were identified by slopes <15° that did not meet the curvature criterion for floors.
Summary of meteorological adjustments for the basin submodel
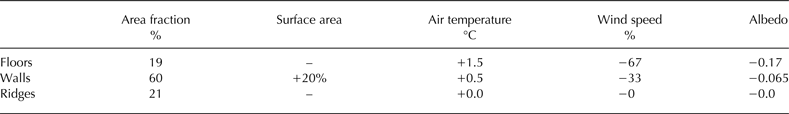
Notes: Area fractions and surface area adjustment are calculated from 2 m gridded lidar data. Basin floor adjustments are the average of adjustments measured by Lewis (Reference Lewis2001) and Johnston (Reference Johnston2004). Basin ridges are unadjusted, and basin wall adjustments are the average of the floors and ridges.
To model basin floor microclimate we parameterized the difference between climate on the smooth surface and in the basins. Simultaneous meteorological measurements in basins and adjacent surfaces on Canada Glacier (Lewis, Reference Lewis2001) and on Taylor Glacier (Johnston, Reference Johnston2004) (Table 2) show that air temperature in the basin is warmer by 1.5°C (when incoming solar radiation is greater than 50 W m−2), and wind speed is slower by 67% (Table 2). The basin surface is also rougher, z 0 = 1.0 mm (Hoffman and others, Reference Hoffman, Fountain and Liston2014). Drag-partition modeling of similarly sized (~10 m) dome features in the ablation zone of the Greenland ice sheet by Smeets and van den Broeke (Reference Smeets and van den Broeke2008) also indicated z 0 = ~1 mm for ice features of this scale. The meteorological adjustments for the walls applied were midway between the basin floors and smooth surfaces (Table 2). Johnston (Reference Johnston2004) found wall albedo on Taylor Glacier to be 0.065 less than the smooth surfaces. To calculate the melt volume from the walls, the planimetric area covered by basin walls is increased by 20%, based on average aspect ratios, to account for the wall area (Fig. 3b). No meteorological adjustment was applied to the ridges between basins.
3.3. Terminal cliffs
Near-vertical cliffs define the glacier edge in the ablation zone (Fig. 3a). Although the cliffs make up a small fraction of the ablation area, they can generate a substantial fraction of total meltwater runoff. For example, on Canada Glacier the terminal cliffs account for 2% of the total ablation area but up to 15–20% of the runoff (Lewis and others, Reference Lewis, Fountain and Dana1999). To model cliff melt a separate 250 m resolution model domain was used to describe the geometry of the cliffs. Length and mean aspect were calculated for each 250 m segment using the 2 m resolution DEM. For simplicity we assumed all cliffs are vertical (Fountain and others, Reference Fountain, Dana, Lewis, Vaughn, McKnight and Priscu1998) with a uniform height of 25 m (Fountain and others, Reference Fountain, Nylen, MacClune and Dana2006). We ignored cliff ablation due to calving, a mechanical rather than energy-balance process. MicroMet calculations of incoming shortwave and longwave radiation for the cliffs were used unaltered within the melt model, but the output for air temperature and wind is changed by +0.5°C and −32%, respectively, according to field measurements (Lewis and others, Reference Lewis, Fountain and Dana1999; Pettit, personal communication; summarized in Hoffman, Reference Hoffman2011) (Table 3). The model used a constant ice albedo on the cliffs of 0.55 (Lewis and others, Reference Lewis, Fountain and Dana1999; Hoffman, Reference Hoffman2011) because snow does not accumulate on the vertical surfaces, and cliff surface roughness (z 0) was set to 0.1 mm (Lewis and others, Reference Lewis, Fountain and Dana1999). However, the abrupt vertical shape of cliffs violates a fundamental assumption of the bulk aerodynamic theory of a flat, homogeneous surface that extends for ~102 m (Brutsaert, Reference Brutsaert1982; Lewis and others, Reference Lewis, Fountain and Dana1999), making this an uncertain parameter.
Summary of meteorological adjustments and parameters for each submodel
4. RESULTS
4.1. Smooth surfaces
The model reproduced observed summer surface lowering at the 53 mass-balance stakes across the ablation zones, performing best on Taylor and Canada Glaciers, where the meteorological stations are located well within the ablation zone (Figs 4 and 5). In most years surface lowering was almost entirely attributed to sublimation and surface melt was typically negligible. Even in the warmest summer of 2001 when ablation was an order of magnitude larger than previous or following years little surface melt occurred at most stakes. Subsurface melt, however, made a common and substantial contribution to ablation across the smooth surfaces in all but the coolest summers. Unlike on temperate glaciers, observations and model ablation showed little elevational gradient except in the warmest summers. This may be due to the large component of sublimation, which has a weaker elevation dependence than melt, a lack of a spring snow cover and migrating snow line and the patchy albedo of these icy surfaces. Although not the focus of the paper, winter ablation was also well predicted (not shown) because the only ablation process was sublimation.
Measured and modeled surface lowering with elevation for all mass-balance stakes on Canada Glacier for each summer. Black dots are measured values from mass-balance stakes. The open black dot is the stake located at the glacier's meteorological station. Each colored column shows modeled surface melt (blue), sublimation (green) and the contribution of subsurface melt drainage to density reduction (red). Summers are identified by their start year.

Mean model error (i.e. bias) in surface lowering for all stakes on each glacier in each summer.

Close inspection of the model results reveals mismatches that provide insight into the model shortcomings. In cool, low-ablation summers (e.g. 1996 and 2000), the model overestimated ablation at the highest elevations; this is most apparent on Commonwealth and Howard Glaciers. This may be due to snow accumulation near the glacier equilibrium lines, which was not included in the model. During the warmest summer of 2001, the MDV experienced anomalously large glacier melt and associated stream runoff (Doran and others, Reference Doran, McKay, Fountain, McKnight and Barrett2008). In that year the model captures surface lowering well across all elevations on Taylor Glacier, slightly underpredicts surface lowering on Canada Glacier and severely underpredicts on both Howard and Commonwealth Glaciers. The spatial pattern of these errors suggests a process missing from the model that affects the Lake Fryxell and Hoare basins but not the Lake Bonney basin. Interestingly, starting in the summer of 2007, model predictions underestimated both the magnitude and variability in ablation for all stakes (Fig. 5). Taylor Glacier was the least affected and Canada Glacier the most. This suggests a process change not included in the model, which is investigated in Section 5.2.
4.2. Cliffs
The analysis of model performance on terminal cliffs was restricted to the cliff segments on the west side of Canada Glacier where long-term (11 years) stake measurements exist. The number of stake observations in a given season varies between 2 and 11, but most seasons have at least 5. Because of high spatial variability in the observations, we averaged all stake measurements for each summer and compared the cliff-wide average of surface lowering with the averaged modeled results (Fig. 6). The cliffs have measured summer surface lowering rates that are typically about ~50% larger than for the adjacent smooth surface of Canada Glacier (Figs 4 and 6a).
Seasonal surface lowering along Canada Glacier westside cliff. (a) Summer. (b) Winter. Black curve is measured ablation averaged over 3–11 cliff stakes each season. Stacked bars show modeled ablation. Blue is surface melt, green is sublimation and red is the contribution of subsurface melt drainage to density reduction.

Modeled surface lowering on the terminal cliffs matched observations well. In contrast to the smooth surfaces, model results indicated that surface melt makes the largest contribution to surface lowering on the cliffs during summer, with sublimation also being important. Subsurface melt is a much smaller fraction of cliff surface lowering than it is for the smooth glacier surfaces. However, in the extreme melt season of 2001, subsurface melting was the largest contributor to surface lowering on the cliffs.
Due to uncertainty in the appropriate value of the surface roughness, z 0, to use for the cliffs, we additionally validated the cliff model using observations of surface lowering during the winter mass-balance season, when sublimation is the primary ablative process (Fig. 6b). Model results for both summer and winter seasons suggested that the z 0 value of 0.1 mm chosen is appropriate for the cliffs. The model also demonstrated that melt is a non-trivial contribution to cliff melt during the winter mass-balance season.
4.3. Specific mass loss from different ablative processes
Using the ablation model we mapped individual components of summer ablation and ablation patterns on specific surfaces across the glaciers of Taylor Valley (Fig. 7). Sublimation exhibits a smooth spatial trend across the valley, with little dependence on elevation. Close inspection shows that sublimation is reduced in the basins, as expected, due to the wind shadow caused by the depressions. Sublimation across the valley shows a marked break between the western (>6 cm w.e. summer−1) and eastern (<6 cm w.e. summer−1) basins (Fig. 7a). This partition corresponds to the separation between the Bonney basin and Hoare/Fryxell basins, respectively, caused by the presence of a large 700 m hill (Nussbaum Riegel) in the center of the valley. Higher wind speeds, drier atmosphere and warmer temperatures are found in the Bonney basin (Fountain and others, Reference Fountain, Lewis and Doran1999a). Variations in sublimation from summer to summer are minor (<±25%) and the spatial patterns are consistent. Sublimation rates exceeded melt rates over most of the glaciers’ surfaces, except at the lowest elevations and in the basin areas.
Average summer specific mass loss (cm w.e.) for glacier ablation zones in Taylor Valley from various ablative processes. (a) Sublimation on smooth surfaces. (b) Melt on smooth surfaces. (c) Melt from basins. (d) Melt from cliffs. Melt includes both surface melt and drainage of subsurface melt. Note the change in color-bar range in (c). Tick marks are at 5 km intervals.

Subsurface melt had a marked dependence on elevation, while spatial trends were less evident. The lack of spatial trends suggests that local influences control melt production, such as basins. Although the area covered by the basins is a small fraction of the glaciers’ ablation areas, the modeled melt rates in the basins were two to ten times larger than on neighboring smooth surfaces (Figs 7b and c and 8a). While we were unable to validate the modeling of the basin areas directly, this result is consistent with previous studies that found ablation rates up to an order of magnitude larger in areas with topographic basins (Chinn, Reference Chinn1987; Lewis, Reference Lewis2001; Johnston and others, Reference Johnston, Fountain and Nylen2005). No melt was predicted on high-elevation ablation zones in the western part of the valley (gray regions in Fig. 7b–d).
Relative mass loss from melt between different surfaces. (a) Ratio of melt in basins to co-located smooth surfaces. (b) Ratio of melt from cliffs to co-located smooth surfaces.

Cliff melt was highly variable. Melt on north-facing cliffs was often two to ten times greater than on adjacent smooth surfaces, and for south-facing cliffs the ratio was inverted (Figs 7b and d and 8b). Cliffs with east and west aspects were modeled to melt at similar rates to smooth surfaces. Model results indicate that cliffs differed from horizontal surfaces in that surface melt formed a substantial fraction of ablation on cliffs. The ice surface of cliffs is warmed relative to the upper glacier surface by a microclimate of increased air temperature, reduced wind speed and increased longwave radiation (due to a large fraction of incoming longwave radiation from warm, dark soils). Additionally, direct solar radiation is absent from these vertical surfaces much of the day, which reduces subsurface melting. While our results contrast with previous work suggesting that cliffs melt at rates substantially higher than smooth surfaces (Lewis and others, Reference Lewis, Fountain and Dana1999), our modeling here included all the cliffs in the valley over an 11 year period, whereas the Lewis and others report was a site-specific study. Consistent with our model results, Lewis and others (Reference Lewis, Fountain and Dana1999) also identified increased longwave radiation and decreased shortwave radiation on cliffs as key components of the cliff surface energy-balance.
5. DISCUSSION
5.1. Assessment of model skill
In most summers, the model has low bias in surface lowering (<3 cm) when model skill is averaged over all stakes on the smooth surfaces of each glacier (Fig. 5). This shows that the model works well beyond the three point locations considered previously (Hoffman and others, Reference Hoffman, Fountain and Liston2014), and provides a good constraint on melt production before applying the model for prediction of glacier runoff in future work. In particular, Taylor and Canada Glaciers were modeled very well, with lower model skill at Howard and Commonwealth Glaciers. Additionally, for the one area with long-term observations of cliff ablation (west side of Canada Glacier), the model predicted the magnitude of ablation on the vertical cliffs well (Fig. 6).
The somewhat poorer model performance on Howard and Commonwealth Glaciers may result from two issues. First, the model was calibrated on Canada and Taylor Glaciers (Hoffman and others, Reference Hoffman, Fountain and Liston2014) and therefore optimized for those glaciers. Second, and perhaps more important, both Howard and Commonwealth Glaciers receive more snow (Fountain and others, Reference Fountain, Nylen, Monaghan, Basagic and Bromwich2009), which the model ignores. Furthermore, as mentioned previously, the albedo applied to these glaciers was extrapolated from Canada and Taylor Glaciers.
While the model generally does well reproducing the magnitude of ablation, it does less well reproducing the spatial and temporal variability in the stake observations, as can be seen in a Taylor diagram (Taylor, Reference Taylor2001) (Fig. 9). The model has a correlation coefficient of 0.49 with stake observations when all glaciers and summers are considered (Fig. 9, open red circle), but this correlation is not statistically significant. Additionally, RMS deviation is large (7.4 cm/0.87 normalized) and spatio-temporal variations in the model (i.e. standard deviation) are about half of that in the observations (Fig. 9, open red circle). We attribute some of this discrepancy to uncertainty in stake observations of surface lowering; though the precision of individual stake measurements is estimated at 3 mm based on multiple measurements at each stake (Fountain and others, Reference Fountain, Nylen, MacClune and Dana2006), we observe much greater variability of the order of cm between neighboring stakes due to local microclimatic effects at each stake (Fountain and others, Reference Fountain, Nylen, MacClune and Dana2006; Hoffman and others, Reference Hoffman, Fountain and Liston2014) (e.g. Fig. 4). Thus, uncertainty in the representativeness of individual stake measurements limits the model's ability to reproduce the spatio-temporal variability in observations. Nonetheless, we find these metrics of model skill useful in comparing different spatial and temporal subsets. For example, it is clear that the model reproduces variability in ablation best at Taylor Glacier and worst at Howard Glacier (red circles, Fig. 9).
Taylor diagram (Taylor, Reference Taylor2001) showing model correlation, centered RMS difference, and standard deviations compared with stake observations of surface lowering. Red circles represent the entire 1996–2011 study period, pink squares represent the 1996–2006 time period and light blue triangles represent the 2007–11 time period. Each glacier studied is indicated by letters: T, Taylor; C, Canada; H, Howard; O, Commonwealth; a, all four glaciers combined (emphasized by open symbols). The statistics are calculated using summation over space (all stakes in a specified region) and time (all summers in a specified time period). The statistics have been normalized and non-dimensionalized to allow the different time and space subsets to be plotted on a single plot. Thus, the location of the red star indicates perfect agreement with observations.

Despite the overall good model performance, for the last 5 years of the record (summer 2007 through 2011) model bias increased up to 10 cm (Fig. 5). The bias was largest at Canada Glacier, but was evident at all four glaciers. Additionally, the 2001 summer was biased low at all glaciers, particularly for Howard and Commonwealth Glaciers. The model was never biased high, suggesting that there may be an unknown process or an unknown change in conditions leading to enhanced ablation. This was likely from enhanced melt, as sublimation rates need to increase by nearly an order of magnitude to explain the discrepancy.
Furthermore, the higher spatial variability in measured ablation values (which also propagates into the model bias) during these summers suggests a shift to more spatial heterogeneity in ablation. This is demonstrated by the higher skill for the 1996–2006 period (pink squares in Fig. 9) relative to the 2007–11 period (light blue triangles in Fig. 9) on the Taylor diagram, and the higher spatial variability in ablation can clearly be seen qualitatively in Figure 4 for the summers 2007–11. Localized melting is a likely cause of spatially variable ablation.
Because the model performed well in the first part of the data record, we hypothesize a change in physical conditions occurred. We favor this explanation because temporal observations of the glacial surfaces were limited to four point measurements (meteorological stations) and the meteorological variables were interpolated over long (tens of km) distances. However, the meteorological environment slowly varies across space (except for the basins) and cannot explain the increased variability in ablation. One of the most sensitive parameters in the energy-balance equation is surface albedo, which can be quite variable over time and space. We hypothesize that the albedo observations used to force the model have become less representative over time. The sensors themselves were recalibrated at 2 year intervals (Doran and others, Reference Doran2002a) precluding sensor performance as the cause. Because of the location of the meteorological stations on Commonwealth and Howard Glaciers, albedo measurements were used from only Taylor and Canada Glaciers both of which are at relatively high elevation, and fail to sample the glaciers closest to the coast. Given this obvious source of uncertainty, we performed a series of model runs with perturbed albedo values (Table 4) and compared the modeled ablation from each run with the measurements, to determine whether the magnitude of albedo required to eliminate model bias made physical sense.
Summary of perturbed forcing experiments. Each forcing was perturbed independently of the others

Results showed that for the first 11 years of record, only small adjustments to the observed albedo (±0.03) were necessary to eliminate model bias in most years (Fig. 10a). A lower albedo was required for both Commonwealth and Howard Glaciers, particularly in 2001. These small adjustments are within the uncertainty of the sensors. Reported uncertainty in glacier albedo from point observations using paired broadband pyranometers is ~±2–5% (e.g. Brock and others Reference Brock, Willis and Sharp2000; Jonsell and others Reference Jonsell, Hock and Holmgren2003; Azzoni and others Reference Azzoni, Senese, Zerboni, Maugeri, Smiraglia and Diolaiuti2014), a range comparable with our observational uncertainty.
Adjustments to (a) albedo and (b) temperature needed to remove model bias in surface lowering for each summer. The vertical axis in (b) is inverted for easier comparison with (a).

Over the last 5 years of the record, the required albedo adjustment to remove model bias was substantially greater: −0.09 averaged over all glaciers. This adjustment is well within observed variability on glaciers elsewhere. On temperate glaciers, ice albedo can vary spatially and temporally by up to 0.30, even after accounting for variations in debris cover, elevation and accumulated melt (Brock and others, Reference Brock, Willis and Sharp2000; Klok and others, Reference Klok, Greuell and Oerlemans2003; Azzoni and others, Reference Azzoni, Senese, Zerboni, Maugeri, Smiraglia and Diolaiuti2014), highlighting challenges in representativeness when using point observations of albedo. Ice albedo on polar glaciers is less variable due to less melt and debris, but we commonly see contemporaneous differences in ice albedo of 0.10 between the four glacier meteorological stations in Taylor Valley. Even for the apparently stationary first half of the record, uncertainty in the albedo measurements can translate to model error of >30% of surface lowering, indicating the need for more accurate and extensive observations of albedo on these glaciers.
For the ‘big melt’ summer of 2001, a large albedo reduction (~−0.09) was required at Howard and Commonwealth Glaciers similar to that for all the glaciers in the last 5 years of record. However, a large reduction of albedo was not required by the model at the locations of the meteorological stations on Canada or Taylor Glaciers where albedo is measured. Investigation of the stake record shows that the stakes co-located with these two automatic weather stations exhibit a relatively low surface lowering in 2001 and for the period 2007–11 relative to nearby stakes. This suggests the sediment distribution and its albedo reduction is patchy, supporting anecdotal field observations.
To test whether changing air temperature could explain the same ablation variability and change over the last 5 years of record, another series of model runs were performed (Table 4; Fig. 10b). For the first 11 years of the record, temperature adjustments of a few degrees removed the model bias in each summer, but for the final 5 years the model required a temperature increase of ~7°C. Such a large adjustment is clearly unrealistic, particularly given the dense network of temperature observations (Fig. 1), supporting our interpretation that changes in albedo are responsible.
Aeolian sediment transport in the MDV is relatively common (Šabacká and others, Reference Šabacká2012; Gillies and others, Reference Gillies, Nickling and Tilson2013). MacDonnell and others (Reference MacDonell, Fitzsimons and Mölg2012) describe an annual cycle of winter föhn winds (Nylen and others, Reference Nylen, Fountain and Doran2004; Speirs and others, Reference Speirs, Steinhoff, McGowan, Bromwich and Monaghan2010) depositing sediment on Wright Lower Glacier in neighboring Wright Valley, which enhances summer melt. The sediment distribution is uneven, resulting in heterogeneous melting across the glacier surface. There is less evidence for this annual cycle in Taylor Valley; however, infrequent high-speed wind events (>20 m s−1) transport sediment in Taylor Valley (Šabacká and others, Reference Šabacká2012), which is deposited on the glaciers. We suggest that the lowered albedo for the period 2007–11 results from aeolian transported sediment. The model bias was strongest at Canada Glacier (Fig. 5), as was the increased spatial variability in surface lowering seen in stake observations. This suggests an effect strongest at this location consistent with the observed sand-dune on the west side of Canada Glacier and the intrusion of the glacier across the valley floor, creating an obstacle to downvalley transport (Šabacká and others, Reference Šabacká2012). Whether the sustained increase in melt over the final 5 years of the record was a result of a single, exceptional event or a series of repeating smaller events, is unclear. The twice-yearly mass-balance measurements preclude detection of specific events. Aeolian sediment flux measurements showed large, but not extreme, sediment fluxes for 2007 (Šabacká and others, Reference Šabacká2012).
The addition of windblown sediment to the glacier surfaces is certainly a plausible explanation for the magnitude of albedo change inferred from this analysis. Low concentrations of sediment and aerosols have a strong effect on the albedo of ice and snow (Wiscombe and Warren, Reference Wiscombe and Warren1980a; Warren, Reference Warren1984; Gardner and Sharp, Reference Gardner and Sharp2010; Dadic and others, Reference Dadic, Mullen, Schneebeli, Brandt and Warren2013b; Azzoni and others, Reference Azzoni, Senese, Zerboni, Maugeri, Smiraglia and Diolaiuti2014). Ice is even more sensitive to low concentrations of sediment than snow, with an albedo reduction of 0.01 reached with a mass fraction of ash of 10 ppb for Antarctic blue ice similar to that found on Taylor Valley glaciers (Dadic and others, Reference Dadic, Mullen, Schneebeli, Brandt and Warren2013b). Dadic and others (Reference Dadic, Mott, Lehning, Carenzo, Anderson and Mackintosh2013a, Reference Dadic, Mullen, Schneebeli, Brandt and Warrenb) show that increasing ash concentration on Antarctic blue ice from 1 to 10 ppm reduces ice albedo by ~0.10. Assuming ash has a similar absorption spectrum to the dust and sediment found in Taylor Valley, this seems a plausible magnitude of sediment loading for an exceptional sediment-loading event. The albedo parameterization of Gardner and Sharp (Reference Gardner and Sharp2010) indicates a soot concentration of 1.9 ppm would reduce ice albedo by 0.10 relative to clean ice; given our lack of knowledge of background impurity concentrations on Taylor Valley glaciers, these two estimates are not inconsistent. Azzoni and others (Reference Azzoni, Senese, Zerboni, Maugeri, Smiraglia and Diolaiuti2014) found that increasing the areal fraction of debris cover from 0 to 25% on a temperate glacier in the Italian Alps reduces ice albedo by 0.10. However, the albedo of debris-free ice on that glacier (0.35) was substantially lower than that of the ice found in Taylor Valley (0.56), precluding a direct transfer of this relationship.
It should be noted that large wind events that would deposit sediment on the glaciers would also directly affect melt by substantially altering the turbulent fluxes. While föhn wind events substantially raise air temperature (Nylen and others, Reference Nylen, Fountain and Doran2004), the increased sublimation they generate inhibits melt (Hoffman and others, Reference Hoffman, Fountain and Liston2008; Bliss and others, Reference Bliss, Cuffey and Kavanaugh2011). There is no indication that a change in frequency or intensity in summertime föhn wind events occurred around 2007 (Fig. 2), but even if that were the case, the weather data forcing the model would capture the change. Thus, the increase in model bias starting in 2007 is likely due to sediment deposited by wind events, and not the wind events themselves.
5.2. A hypothesis for unmodeled ablation variability
One possible explanation for the strong change in ablation despite limited measurements of a change in albedo is the incorporation of sediment within the ice weathering crust (Hoffman and others, Reference Hoffman, Fountain and Liston2014) as it develops. Desert dust and ash typically absorb preferentially in the blue end of the visible spectrum (Wiscombe and Warren, Reference Wiscombe and Warren1980a; Dadic and others, Reference Dadic, Mullen, Schneebeli, Brandt and Warren2013b). These are the wavelengths that penetrate beyond the first few cm of ice (Wiscombe and Warren, Reference Wiscombe and Warren1980b; Brandt and Warren, Reference Brandt and Warren1993; Liston and others, Reference Liston, Winther, Bruland, Elvehoy and Sand1999) into the depths where most melting on MDV glaciers occurs (Hoffman and others, Reference Hoffman, Fountain and Liston2014). Thus, these sediments would be particularly efficient at enhancing below-surface melt. Previous studies have shown that, in snow, impurities impact albedo less when located beneath the surface, but still affect the absorbance of shortwave radiation (Aoki and others, Reference Aoki, Aoki and Fukabori2000; Grenfell and others, Reference Grenfell, Light and Sturm2002). Similarly, for the ice cover on MDV lakes, Jepsen and others (Reference Jepsen, Adams and Priscu2010) found that subsurface sediment melts through the ice faster than sediment on the surface because surface sediment loses heat to the atmosphere, supporting our idea of increased melt efficacy of sediment at depth.
We speculate that sediment from a rare high-flux sediment transport event (or events) was added to the glacier surfaces sometime in 2006 or 2007, with the greatest concentration occurring locally on Canada Glacier. The sediment was incorporated below the ice surface during normal seasonal weathering and crust development (MacDonell and others, Reference MacDonell, Fitzsimons and Mölg2012). Below the surface this sediment continued to enhance melting, but at that point it was contributing to the subsurface melt that is dominant on these glaciers (Hoffman and others, Reference Hoffman, Fountain and Liston2014). Further, below the surface the sediment was not as visible and possibly had a muted effect on broadband surface albedo. Because of the low melt rates and minimal supraglacial flow on these glaciers, this sediment was not washed away as it occurs quickly on temperate glaciers (Brock and others, Reference Brock, Willis and Sharp2000; Jonsell and others, Reference Jonsell, Hock and Holmgren2003; Azzoni and others, Reference Azzoni, Senese, Zerboni, Maugeri, Smiraglia and Diolaiuti2014), and it has generated a multi-year effect.
A detailed investigation of sediment distribution, concentration and optical properties is necessary to assess this hypothesis, but if correct, this suggests that sediment loading associated with exceptional wind events has the potential to change MDV glacier melt rates and associated streamflow as much as a large (~7°C) change in climate. For reference, Coupled Model Intercomparison Project Phase 5 projections for summer air temperature at 2100 relative to present over Antarctic land areas under representative concentration pathway 6 (RCP6) are substantially smaller than this: +0.7 to +3.7°C (Christensen and others, Reference Christensen and Stocker2013). (RCP6 is one of the midrange greenhouse gas concentration trajectories defined by the Intergovernmental Panel on Climate Change, and is consistent with anthropogenic greenhouse gas emissions peaking in 2080 and then declining. It is used here as a well-described reference for projected temperature change for the Antarctic.) Such an effect may help to explain the existence of large paleolakes presumed to fill the MDV valleys during the Last Glacial Maximum (Hall and others, Reference Hall, Denton, Fountain, Hendy and Henderson2010) despite air temperatures 8 °C lower than present at nearby Taylor Dome (Steig and others, Reference Steig2000). In addition to cooler temperatures, the nearby Taylor Dome ice core also records a near order-of-magnitude increase in aerosols within the ice during the last glacial period, as has commonly been observed across the ice sheets (Steig and others, Reference Steig2000).
5.3. Surface mass-balance sensitivity
Previous studies have shown that the glaciers of Taylor Valley are quite sensitive to small changes in energy balance (Lewis and others, Reference Lewis, Fountain and Dana1998; Johnston, Reference Johnston2004; Ebnet and others, Reference Ebnet, Fountain, Nylen, McKnight and Jaros2005; Hoffman and others, Reference Hoffman, Fountain and Liston2008; Hoffman, Reference Hoffman2011). In summer, solar radiation warms the ice and the winds cool the ice and small changes in the energy-balance variables can shift ablation from energy-costly sublimation to energy-efficient melt. However, no previous study has explored the sensitivity of ablation on these glaciers to the various forcing factors. To understand the hydrology of the valleys, past, present and future, and to infer paleoclimatic conditions from geologic, hydrologic and biologic legacies found in the valley requires understanding of glacial ablation response to changes in environmental factors.
We used our model to assess the sensitivity of ablation to changes in air temperature, albedo and wind speed. The sensitivity of glacier surface mass balance to air temperature can be assessed by perturbing the forcing of a calibrated surface mass-balance model by ±1 K (Oerlemans and Fortuin, Reference Oerlemans and Fortuin1992; Oerlemans and others, Reference Oerlemans1998; Cuffey and Paterson, Reference Cuffey and Paterson2010). The standard approach is to apply the model analysis over an entire year, either at a point (specific surface mass-balance) or averaged over an entire glacier (average specific surface mass balance). This approach can be extended to other climate parameters such as albedo and wind speed (e.g. Bintanja, Reference Bintanja1989; Gerbaux and others, Reference Gerbaux, Genthon, Etchevers, Vincent and Dedieu2005; Anslow and others, Reference Anslow, Hostetler, Bidlake and Clark2008).
We consider only summer ablation restricted to the ablation zones of the glaciers because of its implications for summer meltwater production. Winter ablation on MDV glacier ablation zones is relatively insensitive to air temperature, and ablation is entirely through sublimation (Hoffman and others, Reference Hoffman, Fountain and Liston2008). To facilitate comparison with glaciers in other regions, we present our results as traditional surface mass-balance sensitivity. Note we considered ablation to include sublimation, surface melt and drainage of subsurface melt, (m w.e.) as opposed to surface lowering, which was used earlier. The ranges of parameter perturbations applied is described in Table 4 and Figure 11.
Sensitivity of summer ablation to changes in (a) temperature, (b) albedo and (c) wind speed, averaged over the stakes on each glacier. Note the difference in y-axis scale in (c).
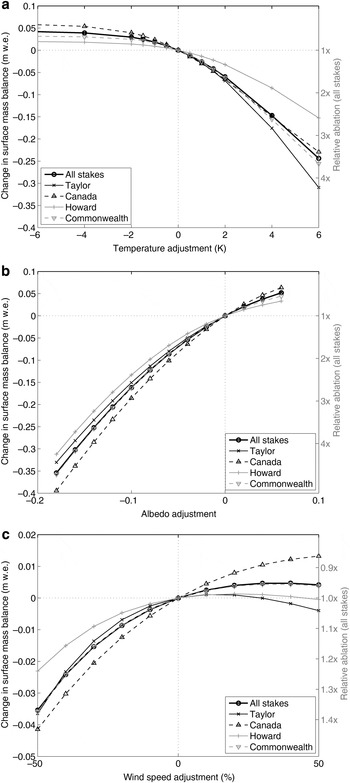
Averaged over the Taylor Valley glacier ablation zones, surface mass-balance sensitivity to temperature was ~−0.02 m w.e. K−1 for small temperature perturbations (Fig. 11a). Sensitivity was fairly uniform across the four glaciers considered but is strongest at Taylor Glacier and weakest at Howard Glacier. For all glaciers, as temperature decreased beyond a couple of degrees <0 °C, surface mass balance became much less sensitive to temperature changes (~0.001 m w.e. K−1). This large change in sensitivity was due to the elimination of melt on the smooth surface of these glaciers, leaving only the much weaker sensitivity of sublimation to temperature. Conversely, sensitivity increased as temperature increased above the current climate; at a temperature increase of 6 K the sensitivity more than doubled to ~0.05 m w.e. K−1. A perturbation of more than a few degrees has questionable predictive value but the sensitivity increase indicates a transition to the melt-dominated summer environment found on subpolar and temperate glaciers.
Typical surface mass-balance sensitivity to temperature on temperate glaciers is in the range −0.4 to −1.4 m w.e. K−1, with maritime glaciers typically having higher sensitivity than continental glaciers (Oerlemans and Fortuin, Reference Oerlemans and Fortuin1992; Oerlemans and others, Reference Oerlemans1998; Braithwaite and Zhang, Reference Braithwaite and Zhang2000; Cuffey and Paterson, Reference Cuffey and Paterson2010). Subpolar glaciers are less sensitive, with values around −0.1 m w.e. K−1 (Oerlemans and others, Reference Oerlemans1998; Cuffey and Paterson, Reference Cuffey and Paterson2010). Reported values in the Antarctic appear to be restricted to the relatively temperate South Shetland Islands, where there is stronger sensitivity than found here: −0.6 m w.e. K−1 (Jonsell and others, Reference Jonsell, Navarro, Bañón, Lapazaran and Otero2012), −0.3 m w.e. K−1 (Braun and Hock, Reference Braun and Hock2004), −0.1 m w.e. K−1 (Bintanja, Reference Bintanja1989). Our values are more similar to those on Mount Kilimanjaro, Tanzania, −0.05 to −0.10 m w.e. K−1 (Mölg and others, Reference Mölg, Cullen, Hardy, Kaser and Klok2008). This is not surprising because the energy balance of ice on Kilimanjaro is very similar to that in Taylor Valley (Hoffman and others, Reference Hoffman, Fountain and Liston2008). The Taylor Valley glaciers have the weakest sensitivity to temperature that we are aware of, highlighting their extreme continentality and very low melt rates. And while the absolute sensitivity is extremely small, the relative sensitivity for these glacier ablation zones is large; a 1 K change in temperature changes ablation by 23%.
For small changes in albedo, we found a surface mass-balance sensitivity of +0.011 m w.e. per 0.01 change in albedo, with little difference between glaciers (Fig. 11b). Therefore, a 0.02 decrease in albedo has a similar effect on surface mass balance to increasing air temperature by 1 K. These sensitivities are smaller than that for Morteratschgletscher, Switzerland, of +0.018 m w.e. per 0.01 change (Klok and Oerlemans, Reference Klok and Oerlemans2002). Because the ice albedo on Morteratschgletscher is substantially lower (0.34) than that of the MDV glaciers (0.60), a unit change in albedo there corresponds to a larger change in net shortwave radiation; this also accounts for the different sensitivities among the MCM glaciers, with Canada Glacier having a lower overall albedo than Taylor Glacier. A related comparison is that of ablation sensitivity to changes in net shortwave radiation. For Antarctic environments such sensitivities have been estimated at −0.005 m w.e. %−1 to −0.009 m w.e. %−1 for glaciers on the South Shetland Islands (Bintanja, Reference Bintanja1989; Jonsell and others, Reference Jonsell, Navarro, Bañón, Lapazaran and Otero2012). If we convert our findings based on albedo changes to changes in net shortwave radiation, we find a similar sensitivity, −0.004 m w.e. %−1. The slightly smaller sensitivity in Taylor Valley is likely due to some net shortwave energy lost to heating the near-surface ice, which typically loses heat to the cooler atmosphere and deeper ice. In the other locations discussed, summer air temperature is typically above freezing, keeping the glacier surface at or near the melting temperature and allowing all or most net shortwave energy to go to melting.
Finally, we assessed surface mass-balance sensitivity to wind speed (Fig. 11c). For small perturbations of wind speed, increasing wind speed increases the surface mass-balance (i.e. decreases ablation) at a rate of +0.0003 m w.e. %−1. The positive sign reflects the cold, dry conditions there, such that the turbulent fluxes typically remove heat from the ice surface (Hoffman and others, Reference Hoffman, Fountain and Liston2008, Reference Hoffman, Fountain and Liston2014), and therefore increasing the wind speed removes more energy that may otherwise be available for melt. Though sublimation increases under such a situation, the rate of ablation for a given energy loss associated with sublimation is one-eighth that of melting. Three of the four glaciers show an interesting non-monotonic response where once increasing wind speed minimizes melt, further increasing wind speed increases ablation through enhanced sublimation. Overall, these results contrast with most other studies that find increasing wind speed lowers surface mass balance (increases ablation). On temperate glaciers, wind speed sensitivity is two orders of magnitude larger: −0.05 m w.e. %−1 on South Cascade Glacier, Washington, USA (Anslow and others, Reference Anslow, Hostetler, Bidlake and Clark2008), and −0.04 m w.e. %−1 at low elevations in the French Alps (Gerbaux and others, Reference Gerbaux, Genthon, Etchevers, Vincent and Dedieu2005). For the South Shetland Islands an intermediate magnitude of −0.0035 m w.e. %−1 was assessed by Bintanja (Reference Bintanja1989).
These results show that glacial ablation is most sensitive to albedo, air temperature and then wind speed. However, our simple analysis ignores the complex spatio-temporal characteristics of wind in the MDV (Nylen and others, Reference Nylen, Fountain and Doran2004; Speirs and others, Reference Speirs, Steinhoff, McGowan, Bromwich and Monaghan2010, Reference Speirs, McGowan, Steinhoff and Bromwich2013), as well as complexities in the sensitivity of turbulent fluxes to wind speed (Dadic and others, Reference Dadic, Mott, Lehning, Carenzo, Anderson and Mackintosh2013a). Specifically for our field conditions, basins are a good example of this complexity. The basin floor is often characterized by a lower albedo compared with the surrounding smooth surfaces. The lower albedo and multiple reflections of solar radiation within the basin not only more efficiently trap the solar radiation, but also warm the air. Because the basin acts as a wind shadow, the turbulent exchange with the cooler winds aloft is reduced, further trapping the heat and the increased humidity. These processes act together and increasingly favor melt over sublimation, allowing the basin to deepen faster than the surrounding smooth surfaces.
6. CONCLUSIONS
We applied a spatially distributed surface energy-balance model across the ablation zones of the glaciers of Taylor Valley using gridded weather data from eight meteorological stations over a 16 year period. The model was previously calibrated to three summers at three points, and was tested against a network of 53 surface mass-balance stakes spread over four glaciers spanning ~30 km, which showed high model skill in reproducing observed surface lowering from stake measurements spatially averaged across the glaciers studied. The model does less well at reproducing spatiotemporal variability in the observations, partly because individual measurements are noisy. The best model performance was in the west part of Taylor Valley where snowfall and cloud cover were less frequent and ice albedo was more accurately measured. As identified previously, surface melt was rare across these glaciers, but melt beneath the surface was common (Hoffman and others, Reference Hoffman, Fountain and Liston2014).
Model results showed that areas with ~10 m scale surface roughness (basins) had ablation and melt rates that were substantially higher (up to 10×) than smooth glacier surfaces. In contrast, the vertical cliffs in which the glaciers terminate had either higher or lower ablation and melt rates than the adjacent horizontal surfaces. Cliff aspect controlled the differences, with north-facing cliffs having relatively high melt rates.
Unsurprisingly, glacier melt and ablation were sensitive to ice albedo, each 0.01 decrease in albedo having a similar effect to a 0.5 K increase in temperature. Sensor uncertainty in albedo observations could explain model error for most of the record. For the last 5 years of record, however, the model underpredicted ablation, which cannot be explained by sensor performance. Anecdotal evidence points to lower albedo and the model showed that a reduction of only 0.09 can explain this change, well within the natural variability of glacier surfaces. We attributed the albedo reduction to wind events that transport sediment from the valley floor to the glacier surfaces.
The ablation sensitivity to temperature was ~−0.02 m w.e. K−1, which is among the smallest magnitudes observed globally. This is due to the fact that surface heating on these polar glaciers is lost to both the colder atmosphere and colder ice at depth. The sensitivity of these glaciers to changes in wind speed was also small compared with other glaciers globally (+0.0003 m w.e. %−1), and was opposite in sign to what is commonly observed because the turbulent fluxes typically remove heat from these glacier surfaces. Despite the relatively small response of ablation to the change in these factors, it must be appreciated that in summer the glaciers of Taylor Valley are on the cusp of melting such that small changes in the energy balance have profound effects on ablation and commonly these factors interact producing greater ablation (and melt) than any one factor alone.
These results highlight the need for more study on ice albedo processes and spatio-temporal variability on these glaciers. The unique climate sensitivity of these glaciers may help explain apparent higher melt rates during colder, glacial times, as well as suggest that these glaciers may have a complicated response to a changing climate in the future.
ACKNOWLEDGEMENTS
This work was funded by US National Science Foundation (NSF) Office of Polar Programs grants ANT-0423595 and ANT-0233823 and the Earth System Modeling program of the Office of Biological and Environmental Research within the US Department of Energy's Office of Science. We thank two anonymous reviewers for constructive reviews and Scientific Editor Martyn Tranter and Chief Editor Jo Jacka for guiding the review process.


 Open access