

Introduction
Attention deficit hyperactivity disorder (ADHD) is a developmental disorder characterised by attentional problems, impulsive behaviour and hyperactivity, and symptoms starting in childhood (Biederman, Reference Biederman1998), but which is now known can persist into adolescence and adulthood (Mannuzza et al. Reference Mannuzza, Klein, Bessler, Mallov and LaPadula1993; Cumyn et al. Reference Cumyn, Kolar, Keller and Hechtman2007). The previous age criterion of diagnostic and statistical manual of mental disorders (DSM)-IV that symptoms should have started before the age of 7 has now been extended in DSM-V which makes more explicit references to the progression of ADHD into adulthood. Pooled prevalence of ADHD in children and adolescents combined has been estimated to be 5%, and around 3% in adolescents (Polanczyk et al. Reference Polanczyk, delima, Horta, Biederman and Rohdeee2007). The estimated prevalence of adult ADHD in the USA is 4.4%, and is more common in males, previously married, unemployed and is associated with substantial role impairment (Kessler et al. Reference Kessler, Adler, Barkely, Biederman, Conners, Demler, Faraone, Greenhill and Howes2006). A recent meta-analysis of epidemiological studies of ADHD (all conducted in high income countries) estimated a prevalence of 2.5%, declining with increasing age, and more common in men (Simon et al. Reference Simon, Czobor, Balint, Meszaros and Bitter2009). There is thought to be substantial under-diagnosis or misdiagnosis of affected people (Kooij et al. Reference Kooij, Bejerot, Blackwell, Caci, Casas-Brugué, Carpentier and Asherson2010), and there have been calls to expand the research agenda on this condition in adulthood (Ramos-Quiroga et al. Reference Ramos-Quiroga, Nasillo, Fernández-Aranda, Fernández-Arana and Casas2014).
The only previous African epidemiological survey of ADHD in a general adult population using a screening questionnaire was conducted in Nigeria in adults aged 18–52, using the Berkely Adult ADHD rating scale and found a population prevalence of 12.2% (Okhakume & Oluwefaemi, Reference Okhakhume and Oluwefaemi2014). Therefore the opportunity was taken to conduct a study of the adult prevalence of ADHD in Kenya as part of a wider project to examine the associations between mental disorder, malaria and immunity, the results of which will be reported elsewhere.
Kenya is in sub-Saharan Africa, and was a low income country until 2014 when it became a lower middle income country, because Kenya's gross domestic product (GDP) per capita rose from US$399 in 2000 to US$ 1040.55 in 2013, although poverty levels remain high at 45.9% (UNDP, 2013). Kenya's population is growing rapidly by about 1 million a year from 10 million in 1969 to an estimated 43.2.million in 2013(extrapolated from the 2009 census), (Kenya Bureau of Statistics, 2011) with nearly 50% aged under 15. Life expectancy at birth is 57 years, the adult literacy rate is 87%, the infant mortality rate is 55 per 1000 live births, the maternal mortality rate is 490 per 100 000 live births and HIV prevalence is currently estimated at 5.6% (Kimanga et al. Reference Kimanga, Ogola, Umuro, Nganga, Kimondo, Mureithi, Muttunga, Waruiru, Mohammed, Sharrif, De Cock and Kim2014). There is rapid urbanisation, the agricultural sector is highly inefficient and the food supply is vulnerable to catastrophic drought and floods.
Nyanza Province, where the study was conducted, has relatively high levels of unplanned pregnancies (53%), deaths of children under 5 (14.9%), spousal abuse (60%) (United Nations, 2007) and considerably higher prevalence compared with the rest of Kenya of HIV of 17.7% in women and 14.1% in men (Oluoch et al. Reference Oluoch, Mohammed and Bunnell2011), all of which socioeconomic and health challenges may impact on the mental health of the population.
The research was conducted as part of an overall collaborative programme of work between the Kenya Ministry of Health and the UK Institute of Psychiatry, Kings College London over the last 15 years, (including collaborations with the Kenya Medical Training College (KMTC), the Kenya Medical Research Institute (KEMRI),the Kenya Psychiatric Association and Great Lakes University) comprising situation appraisal (Kiima et al. Reference Kiima, Njenga, Okonji and Kigama2004; Muga & Jenkins Reference Muga and Jenkins2008a ; Mugawebster & Jenkins, Reference Mugawebster and Jenkins2010; Jenkins et al. Reference Jenkins, Njenga, Okonji, Kigamwa, Baraza, Ayuyo, Singleton, McManus and Kiima2012a , Reference Jenkins, Njenga, Okonji, Kigamwa, Baraza, Ayuyo, Singleton, McManus and Kiima b ), studies of traditional healers (Okonji et al. Reference Okonji, Njenga, Kiima, Ayuyo, Kigamwa, Shah and Jenkins2008), community health workers (Kiima et al. Reference Kiima, Njenga, Shah, Okonji, Ayuyo, Baraza, Parker and Jenkins2009), district health workers (Muga & Jenkins Reference Muga and Jenkins2008b ), policy development (Kiima & Jenkins, Reference Kiima and Jenkins2010), primary care training (Jenkins et al. Reference Jenkins, Kiima, Njenga, Okonji and Kingora2010a , Reference Jenkins, Kiima, Okonji, Njenga and Kingora b ) and its evaluation (Jenkins et al. Reference Jenkins, Othieno, Okeyo, Kaseje, Aruwa, Oyugi, Bassett and Kauye2013a , Reference Jenkins, Othieno, Okeyo, Aruwa, Kingora and Jenkins b , Reference Jenkins, Othieno, Okeyo, Aruwa, Wallcraft and Jenkins c ; Othieno et al. Reference Othieno, Jenkins, Okeyo, Aruwa, Wallcraft and Jenkins2013).
Methods
Data were used from a cross sectional community study, of adults living at home in a demographic surveillance site in Nyanza province, near Lake Victoria in Kenya, in order to examine the prevalence rate of ADHD self-reported symptoms and associated risk factors.
Study population
The sample frame is a subdivision in an endemic area for malaria in Kenya, namely Maseno area in Kisumu county, Nyanza Province in western Kenya, Maseno has a population of 70 805 (Sifuna et al. Reference Sifuna, Oyugi, Ogutu, Andagalu, Otieno, Owira, Otsyula, Oyieko, Cowden, Otieno and Otieno2014). Females constitute 53% of the population. The mean household size is four people per household with a population density of about 374 people/km2. The population is largely young with a mean age of 23 years. The population 0–14 years constitutes 46%, ages 15–64 years constitute 49% and ages 65 + years constitute 5%.
The population is primarily black African, and the languages spoken are Luo (which is the predominant ethnic group), Kiswahili and English. The area is largely rural, with most residents living in villages, which are a loose conglomeration of family compounds near a garden plot and grazing land. The majority of the houses are mud-walled with either grass thatched or corrugated iron-sheet roofs. Water is sourced mainly from community wells (40%), local streams (43%) and the lake (5%) for those mostly living on the shores of Lake Victoria (Sifuna et al. Reference Sifuna, Oyugi, Ogutu, Andagalu, Otieno, Owira, Otsyula, Oyieko, Cowden, Otieno and Otieno2014). Most water sources are not chlorinated. Subsistence farming, animal husbandry and fishing are the main economic activities in the area. Malaria is holoendemic in this area, and transmission occurs throughout the year. The ‘long rainy season’ from late March to May produces intense transmission from April to August. The ‘short rainy season’ from October to December produces another, somewhat less intense, transmission season from November to January.
Study site
Study participants
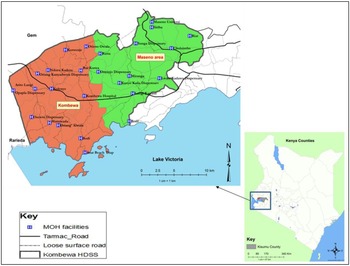
The study sample was selected from Maseno Area within Kisumu County, western Kenya (see Fig. 1). Maseno Area is sub-divided into four locations, 17 sub-locations and 184 enumeration areas (villages) based on mapping work done earlier by the Kombewa Health and Demographic Surveillance System (Kombewa HDSS) run by the KEMRI/Walter Reed Project. The Kombewa HDSS is a longitudinal population registration system set up to monitor the evolving health and demographic problems of the study population in Kombewa and Maseno areas (Sifuna et al. Reference Sifuna, Oyugi, Ogutu, Andagalu, Otieno, Owira, Otsyula, Oyieko, Cowden, Otieno and Otieno2014). Some villages with less than 50 households were merged together to create new enumeration areas. A random sample of 7 households was drawn from each enumeration area, to give a projected sample of 1190 households, which with an estimated response rate of 85% would give a total sample size of 1010. Village maps were used to assign households and guide the research assistants during the survey. Using the Kish Grid Method, one individual was selected from each of the sampled household. The demographics and reasons for the refusal were recorded in notebooks by the Research assistants. A total of 1190 households were visited.
Location of the study site.
Study procedures
Meetings were held with community leaders to explain the purpose of the survey, and answer questions. The heads of the sampled households, and then the identified participants in the survey were approached in their own homes for informed written and witnessed consent to the interview. The interview was administered by one of a group of 20 research assistants using a personal digital assistant (PDA), on which the interview questions were programmed and responses were recorded. The research assistants received a 5 day training course, and were supervised in the field by a field manager.
The participants received a structured epidemiological assessment of common mental disorders (CMD), ADHD, psychotic symptoms, alcohol and substance abuse, accompanied by additional sections on socio-demographic data, life events, social networks, social supports, disability/activities of daily living, quality of life, use of health services and service use, adapted from the adult psychiatric morbidity schedule (Health and Social Care Information Centre, 2009) used in the UK mental health survey programme.
Demographic information collected included age, sex, ethnicity, marital status and household status (head, spouse or other). Socio-economic factors assessed included employment status, education attainment, economic assets and type of housing.
ADHD was assessed by the WHO Adult ADHD Self-Report Scale (ASRS) Screener (Kessler et al. Reference Kessler, Adler, Gruber, Sarawate, Spencer and Van Brunt2007), for each of the six questions, never = 0, rarely = 1, sometimes = 2, often = 3 and very often = 4. This gives a total ASRS score of 0–24. Cases are those with scores of 14 and above. This approach and cut off are recommended by Kessler et al. (Reference Kessler, Adler, Gruber, Sarawate, Spencer and Van Brunt2007) who examined the validity of the ASRS, tried out three ways of scoring the ASRS and concluded that the most robust approach was to use the full 0–4 response scale for each item to obtain a summary score of 0–24, and that the optimal cut off is a threshold of 13/14, consistently outperforming other approaches including the 0–6 approach, and so recommended it for the future use of the ASRS. Kessler et al. (Reference Kessler, Adler, Gruber, Sarawate, Spencer and Van Brunt2007) also calculated a range of positive predictive values for each stratum of population prevalence, and found a strong concordance with clinician diagnoses, with an area under the receiving operating characteristic curve of 0.90.
Ramos et al. (Reference Ramos-Quiroga, Daigre, Valero, Bosch, Gómez-Barros, Nogueira, Palomar, Roncero and Casas2009) recommended a cut off of 11/12 which achieved a positive predictive value 91.6% and a negative predictive value 96.5%, in a Spanish outpatient sample. As the Kessler recommendation of a cut off 13/14 was derived from a community sample, we considered that was the most appropriate to use for this study, and note that this approach has also been recently used by Das et al. (Reference Das, Cherbuin, Easteal and Anstey2014).
CMD were assessed by the Clinical Interview Schedule-Revised (CIS-R) (Lewis et al. Reference Lewis, Pelosi, Araya and Dunn1992), a gold standard instrument for use by lay interviewers to assess psychopathology in community settings. It has been widely used in high (Meltzer et al. Reference Meltzer, Gill, Petticrew and Hinds1995; Jenkins et al. Reference Jenkins, Bebbington, Brugha, Farrell, Gill, Lewis, Meltzer and Petticrew1997a , Reference Jenkins, Lewis, Bebbington, Brugha, Farrell, Gill and Meltzer b , Singleton et al. Reference Singleton, Bumpstead, O'Brien, Lee and Meltzer2003) and low income countries (Araya et al. Reference Araya, Rojas, Aritsch, Acuna and Lewis2001; Wickramasinghe et al. Reference Wickramasinghe, Rajapakse, Abeysinghe and Prince2002; Patel & Mann, Reference Patel and Mann1997; Patel et al. Reference Patel, Kirkwood, Pednekar, Weiss and Mabey2006) including Tanzania (Ngoma et al. Reference Ngoma, Prince and Mann2003; Jenkins et al. Reference Jenkins, Mbatia, Singleton and White2010c ) and Kenya (Jenkins et al. Reference Jenkins, Njenga, Okonji, Kigamwa, Baraza, Ayuyo, Singleton, McManus and Kiima2012a ). The CIS-R measures the presence of 14 symptom-types in the preceding month and the frequency, duration and severity of each symptom in the past week. Scores, taken together with algorithms based on the International Classification of Diseases (ICD)-10 (WHO, 1993), provide diagnoses of depressive episode (mild, moderate or severe), obsessive compulsive disorder, panic disorder, phobic disorder, generalised anxiety disorder and mixed anxiety/depressive disorder. For the purpose of the current paper however, a score of 12 or more across the 14 sections of the survey was considered an indication of ‘any CMD’, as used in other CIS-R studies (Lewis et al. Reference Lewis, Pelosi, Araya and Dunn1992; Jenkins et al. Reference Jenkins, Bebbington, Brugha, Farrell, Gill, Lewis, Meltzer and Petticrew1997a , Reference Jenkins, Lewis, Bebbington, Brugha, Farrell, Gill and Meltzer b ).
Respondents were given a list of 11 different stressful life events and asked to say which, if any, they had experienced in the last 6 months. The list included health risks (serious illness, injury or assault to self or close relative), loss of a loved one (death of a relative; death of a close friend), relationship difficulties (separation or divorce; serious problem with a close friend or relative); income instability (being made redundant or sacked; having looked for work for over a month; loss of the equivalent of 3 months income) and legal problems (problems with the police involving a court experience; something of value lost or stolen). The list was developed for the British psychiatric morbidity survey (Meltzer et al. Reference Meltzer, Gill, Petticrew and Hinds1995; Singleton et al. Reference Singleton, Bumpstead, O'Brien, Lee and Meltzer2003) programme, and slightly modified for the east African context (Jenkins et al. Reference Jenkins, Mbatia, Singleton and White2010c ). Scores were grouped into ‘none’, ‘one’, ‘two’ and ‘three or more’ life events and were also analysed by category.
Perceived lack of social support was assessed from respondents’ answers to seven questions which were used in the 1992 Health Survey for England (Breeze et al. Reference Breeze, Maidment, Bennett, Flatley and Carey1994), and the Office of National Statistics (ONS) Surveys of Psychiatric Morbidity (Meltzer et al. Reference Meltzer, Gill, Petticrew and Hinds1995; Singleton et al. Reference Singleton, Bumpstead, O'Brien, Lee and Meltzer2003). The seven questions take the form of statements that individuals could say were not true, partly true or certainly true for them in response to the question ‘There are people I know who: (i) do things to make me happy; (ii) who make me feel loved; (iii) who can be relied on no matter what happens; (iv) who would see that I am taken care of if I needed to be; (v) who accept me just as I am; (vi) who make me feel an important part of their lives; and (vii) who give me support and encouragement’. Results were categorised into no, moderate or severe lack of perceived social support.
Social network size was assessed by respondents answers to three questions which have also been used in the ONS surveys of Psychiatric morbidity, namely (i) how many adults who live with you do you feel close to, (ii) how many relatives aged 16 or over who do not live with you do you feel close to, (iii) how many friends or acquaintances who do not live with you would you describe as close or good friends. Responses were added into a total social network score.
Specific questions were also asked about caring responsibilities (do you give care due to long term physical or mental disorder or disability? And if yes, time spent giving care in a week); about growing up with one natural parent or two until age 16; and about spending time in an institution before the age of 16.
Statistical analysis
We examined the prevalence of self-reported ADHD symptoms, CMD, individual diagnostic categories, individual non-psychotic symptoms and of alcohol consumption, hazardous drinking and substance abuse. The estimated prevalence of ADHD self-reported symptoms was examined by calculating the prevalence of ASRS scores of 14 and above (Kessler et al. Reference Kessler, Adler, Gruber, Sarawate, Spencer and Van Brunt2007) and reported as proportion of individuals with a 14+ score. Risk factors for ADHD were examined using a logistic regression model with results from the unadjusted analysis reported. Factors considered significant at the bivariate analysis level have been included in the multivariate analysis with odds ratios (ORs) and their 95% confidence interval (CI) reported in the adjusted analysis. We used STATA (Statacorp, 2003) to calculate unadjusted and adjusted ORs. Households have been categorised into different socio-economic levels using an index of household assets, constructed applying the principal component analysis procedure, as a proxy indicator for socio-economic status. In developing the asset quintiles, type of house, roofing and walling material, source of water, toilet facility and land have been used. (Moser, Reference Moser1998; Morris et al. Reference Morris, Carletto, Hoddinott and Christiaensen2000).
Ethics
Ethical approval was granted by the Kings College London (KCL) and KEMRI boards of research ethics respectively, and by the KEMRI/Walter Reed Project to conduct the study in households within Maseno area, which is part of the Kombewa HDSS.
Informed written and witnessed consent was asked of heads of sampled households, and then of sampled participants to take part in the study.
Results
A total of 1190 households were selected, and 1158 participants consented to the study while 32 refused to participate in the study interviews, giving a response rate of 97.3%.
Table 1 shows the prevalence of ADHD (using a cut ASRS score of 14+). The prevalence of people with ASRS scores of 14 or more is 13.1%.
Prevalence of ADHD (ASRS 14+) and its relationship with socio-demographic and psychosocial risk factors (univariate odds ratio)
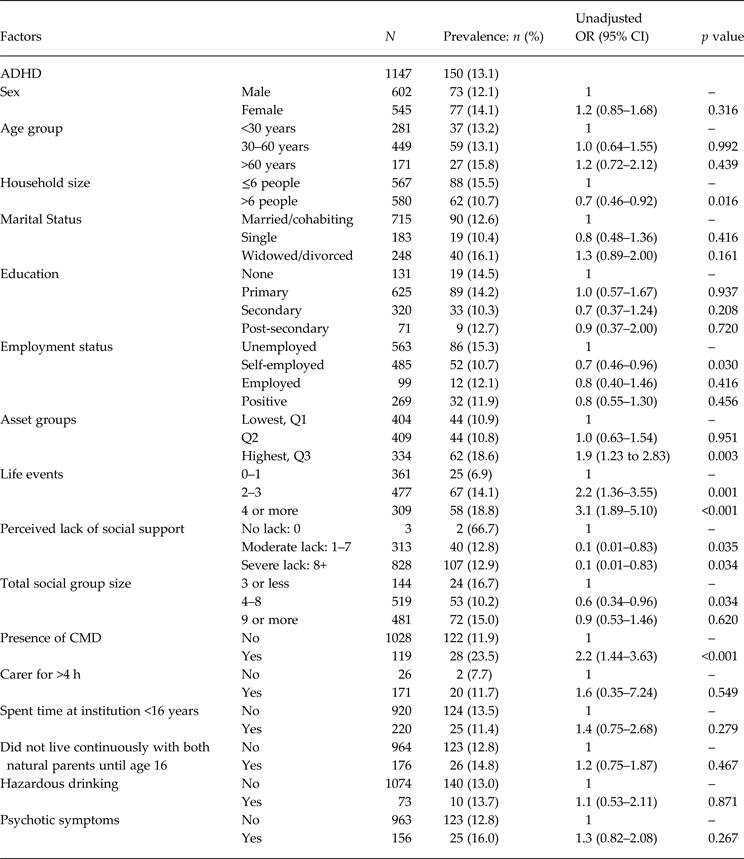
Table 1 also shows the risk factors associated with ASRS scores of 14 and above, giving ORs, CIs and p value.
Odds of ADHD were significantly increased in those with higher assets (OR 1.9, p = 0.003), those with more life events (OR 2.2, p = 0.001 for those with 2–3 life events and OR 3.1, p < 0.009 for 4 or more life events), and were significantly reduced in the self-employed (OR 0.7, p = 0.03), those living in larger households (OR 0.7, p = 0.016), and those living with a lack of social support (OR 0.1, p = 0.035 and OR 0.1, p = 0.034 for a moderate lack and severe lack, respectively), and those living with large social group size of 4–8 (OR 0.6, p = 0.034) at the bivariate level of analysis.
Table 2 shows the adjusted analysis for risk factors associated with ADHD.
Factors significantly associated with ADHD, using logistic regression analysis to provide adjusted odds ratio, adjusted for all variables found to be significant at the bivariate level
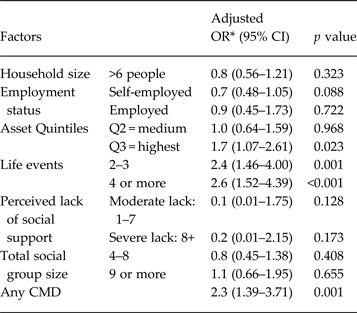
* variables identified as univariate predictors of ADHD
The variables for which the outcomes have been adjusted (with p value ≤0.05) are household size, employment status, asset quintiles, life events, perceived lack of social support, total social group size and any CMD.
In the adjusted analysis (with factors considered significant in the unadjusted analysis), the self-employed (OR 1.7, p = 0.088), those with higher assets (OR 1.7, p = 0.023), those with life events (OR 2.4, p = 0.001 and OR 2.6, p < 0.001 for those with 2–3 life events and 4 or more life events respectively), and those with CMD (OR 2.3, p = 0.001) are considered to be predictors/risk factors for ADHD.
The p value for the adjusted model, using the Likelihood Ratio test is <0.005.
Discussion
This is the first household survey of Adult ADHD in Kenya, and the second in sub-Saharan Africa that we have been able to find. This survey of adult ADHD undertaken as part of a mental health epidemiological survey of a household population in Maseno district, Nyanza province in Kenya found that the overall prevalence of ASRS scores of 14 and above was 13.1%.
A range of methods have been used to measure ADHD in the research literature, some using questionnaire screens, some using full clinical diagnostic interview and some using both approaches to provide validation data for the screening instrument. Whenever such validation studies are done, the prevalence rates of ADHD confirmed by diagnostic interview are lower than those identified by the screening instrument. Willcut (Reference Willcut2012) in a meta-analytic review of 86 studies of children and adolescents, and 11 studies of adults with ADHD using DSM-IV criteria, found that point prevalence rates of ADHD varied from 4.0 to 13.3 in the meta analysis depending on the specific procedures used to combine information from multiple rates and measure functional impairment. When full clinical diagnostic criteria are used, he found that the overall prevalence of ADHD fell within the range of 5.9–7.1% in children and adolescents and 5% in adults. Faraone & Biederman (Reference Faraone and Biederman2005) administered a semi- structured clinical interview, based on DSM-IV diagnostic criteria for ADHD, to a telephone sample of 966 randomly selected adults in the USA, and estimated prevalence rates of 2.9% for Narrow ADHD and 16.4% for Broad ADHD.
We used the ASRS but we did not validate the ASRS in this population with a gold standard clinical interview to confirm cases relative to full diagnostic ICD or DSM criteria, but rather used the cut off recommended by Kessler et al. (Reference Kessler, Adler, Gruber, Sarawate, Spencer and Van Brunt2007). Direct comparisons of our results can therefore best be made with other studies which used the same instrument and the same scoring method. Two studies meet this criterion. Firstly, Kessler et al. (Reference Kessler, Adler, Gruber, Sarawate, Spencer and Van Brunt2007) used a personal ASRS screen, with a cut off 13/14, followed by a telephone clinical reappraisal interview to a national sample in the USA, and found a weighted prevalence of 8.4% of clinical adult ADHD. Secondly, Das et al. (Reference Das, Cherbuin, Easteal and Anstey2014) also used the ASRS and found 2.2% of the older age cohort scored equal or above the ASRS cut-off score of 14 compared with 6.2% of middle aged adults. Kessler et al. (Reference Kessler, Adler, Gruber, Sarawate, Spencer and Van Brunt2007) classified cases in partial remission as not cases which is a conservative approach. Cases in partial remission are quite common (Faraone & Biederman, Reference Faraone and Biederman2005), and so if they had been included, their prevalence rate would have been higher.
Prevalence rates found in other household studies of adult populations range from 12.2% for Nigeria using the Barkley Adult ADHD Rating Scale (Okhakhume & Oluwefaemi, Reference Okhakhume and Oluwefaemi2014) to a pooled prevalence of 2.5% (CI 2.1–3.1) in a meta-analysis of western studies (Simon et al. Reference Simon, Czobor, Balint, Meszaros and Bitter2009), which had used a variety of sample designs and instruments. Simon et al. (Reference Simon, Czobor, Balint, Meszaros and Bitter2009) concluded that this pooled prevalence may be too restrictive because the DSM-IV criteria underestimate ADHD in adults.
The World Mental Health Survey in 10 countries (Belgium, France, Germany, Italy, Netherlands and Spain in Europe, the USA, Colombia, Mexico and the Lebanon.) used the ASRS with O-6 scoring (Fayyad et al. Reference Fayyad, De Graaf, Kessler, Alonso, Angermeyer, Demyttenaere, De Girolamo, Haro, Karam, Lara, Demyttenaere, Lepine, Ormel, Posada-Villa and Zaslavsky2007). The estimated prevalence was based on multiple imputations, and the imputation model was based on a clinical calibration conducted only in the USA and not in the other countries studies. It found an average prevalence of 3.4% (range 1.2–7.3%) across the 10 countries in the World Mental Health Survey which did not include any from Africa.
The British national household survey (Health and Social Care Information Centre 2007) found that 8.3% screened positive for ADHD, using the ASRS screener and the O-6 scoring method, with a cut off of 3/4.
There have also been a few epidemiological studies of ADHD in college students. One study of Kenyan medical students (Atwoli et al. Reference Atwoli, Owiti, Manguro and Ndambuki2011) used the 0–6 scoring method for the ASRS screener and found a prevalence of 23.7% of ADHD symptoms in Kenyan medical students, with 8.7% satisfying DSM-IV criteria for an ADHD diagnosis, while De Paul et al. (Reference De Paul, Schaughenency, Weyandt, Tripp, Kisener and Ota2001) found rates of ADHD up to 8.1% in Italy, New Zealand and the USA (De Paul et al. Reference De Paul, Schaughenency, Weyandt, Tripp, Kisener and Ota2001).
Atwoli et al. (Reference Atwoli, Owiti, Manguro and Ndambuki2011) argue that, as well as methodological issues posed by screening instruments being a relevant issue in comparing survey results, it is possible that rates of ADHD are actually much higher in low income countries than in the west. Indeed it has also been argued that ADHD may carry some evolutionary advantage in nomadic tribes, (Eisenberg et al. Reference Eisenberg, Campbell, Gray and Sorenson2008; Eisenberg & Campbell, Reference Eisenberg and Campbell2011) and so previous natural selection of genes linked to ADHD symptoms may go some way towards explaining higher rates found so far in low income countries in Africa.
We did not find a gender difference in ADHD prevalence, similar to the lack of gender difference in other adult studies (Fayyad et al. Reference Fayyad, De Graaf, Kessler, Alonso, Angermeyer, Demyttenaere, De Girolamo, Haro, Karam, Lara, Demyttenaere, Lepine, Ormel, Posada-Villa and Zaslavsky2007; Health and Social Care Information Centre, 2009; Simon et al. Reference Simon, Czobor, Balint, Meszaros and Bitter2009; Okhakhume & Oluwefaemi, Reference Okhakhume and Oluwefaemi2014) of ADHD. However we did find significantly increased odds in the adjusted analysis in the self-employed (OR 1.7, p = 0.088), those with higher assets (OR 1.7, p = 0.023), those with life events (OR 2.4, p = 0.001 for those with 2–3 life events and OR 2.6, p < 0.001 for those with 4 or more life events), and those with CMD (OR 2.3, p = 0.001).
The relationship between ADHD and self-employment is puzzling. It would be expected that people with ADHD might be more likely to choose self-employment, where it may be more possible to choose niches that fit their strengths and energies, and where ADHD is a clear benefit rather than a disability (Eisenberg & Campbell, Reference Eisenberg and Campbell2011). On the other hand it may be that being in self-employment enables ADHD symptoms to be less prominent than they would be in the confines of more structured employment.
We have not found comparable studies of adult ADHD and assets, but our finding of an association of ADHD symptoms with high assets stands in contrast to the British National Survey (Health and Social Care Information Centre, 2009) which found odds were higher in those with low household income, and also in contrast to Faraone & Biederman (Reference Faraone and Biederman2005) which found associations between ADHD and lower levels of employment status, while Willcut (Reference Willcut2012) found an association between ADHD and low socio-economic status in some but not all studies. Das et al. (Reference Das, Cherbuin, Butterworth, Anstey and Easteal2012) found significant negative associations (p < 0.01) with employment and financial stress, and the British mental health survey found an association of ADHD with unemployment and economic inactivity (Health and Social Care Information Centre, 2009).
We did not find an association with educational level, unlike Faraone & Biederman (Reference Faraone and Biederman2005) who found an association with lower levels of education, and the British National Survey which also found an association with those who had no educational qualifications (Health and Social Care Information Centre, 2009). This is a complex question to examine as it is possible that the screener works better in higher educated groups and not so well in those with less sophisticated use of language, and so the relationship of ADHD with educational level needs further exploration.
We did not find significant comorbidity with psychotic symptoms or with hazardous drinking, and indeed a diagnosis of ADHD is precluded in the presence of psychosis in DSM-IV. (Willcut, Reference Willcut2012) The comorbidity we found with CMD was also found in the World Mental Health Survey (Fayyad et al. Reference Fayyad, De Graaf, Kessler, Alonso, Angermeyer, Demyttenaere, De Girolamo, Haro, Karam, Lara, Demyttenaere, Lepine, Ormel, Posada-Villa and Zaslavsky2007); in the British survey (Health and Social Care Information Centre, 2009) which found comorbidity with attempted suicide, panic disorder, phobia, post traumatic stress disorder (PTSD), Psychosis, depressive episode and antisocial personality disorder but not with alcohol or drug dependency; and in the study of Das et al. (Reference Das, Cherbuin, Butterworth, Anstey and Easteal2012) who found strong positive correlations between symptoms of ADHD and depression/anxiety. The associations we found with increased unpleasant life events and with CMD indicate the vulnerability and disadvantage still experienced by people with ADHD in Africa as well as in western countries (Ginsberg et al. Reference Ginsberg, Beusterien, Amos, Jouiseelin and Asherson2014). Understanding comorbidity is important because these comorbid conditions often clinically overshadow the underlying ADHD syndrome (Cumyn et al. Reference Cumyn, Kolar, Keller and Hechtman2007).
Strengths of study
The strengths of the study are the use of a health and demographic surveillance site for the random sample of households, the high response rate and the systematic approach to the clinical and socio-demographic assessments. The population in the surveillance site is regularly monitored by field staff who visit each household bi-annually to capture health and demographic information (birth rates, death rates, causes of death, pregnancies, immunization status, in-and out-migrations, etc.). Various studies nested on the DSS platform take advantage of the sampling frame inherent in the HDSS, whether at individual, household/compound or regional levels. This familiarity with survey procedures is likely to have been influential in the achievement of a high response rate. The ASRS proved reasonably straightforward to include in the overall research interview with questions specified on the PDA, and responses directly recorded to the PDA. The questions were available on the PDA in English, Kiswahili and Luo (the main local language). Our research interviewers were trained health workers who lived locally and who were therefore familiar with the local languages. It was very important to ensure that the sample was properly random, and therefore we drew on the supervision of the demographic surveillance site staff as well as the project manager to ensure that the randomisation procedures were followed in the identification of households and the identification of one adult per household
Limitations of study
Our study findings were limited by the fact that we did not validate the ASRS with a clinical diagnostic interview in this population. This is important to do as the wording of the ASRS may not always be understood in all populations and therefore accuracy of the screener is not clear until validated against diagnostic interview. If accurate estimates of ADHD are to be generated, it is essential to do a study with validation against the gold standard of diagnostic interview in a random subsample.
The validity of the ASRS screener has been examined in the USA (Kessler et al. Reference Kessler, Adler, Barkely, Biederman, Conners, Demler, Faraone, Greenhill and Howes2006, Reference Kessler, Adler, Gruber, Sarawate, Spencer and Van Brunt2007) but not in Kenya, and so future studies in Kenya and indeed elsewhere need to compare the results of the ASRS screener with semi-structured standardised research clinical assessments.
We used the cut off of 13/14 as recommended by Kessler et al. (Reference Kessler, Adler, Gruber, Sarawate, Spencer and Van Brunt2007) from a USA sample. Although Ramos-Quiroga (Reference Ramos-Quiroga, Daigre, Valero, Bosch, Gómez-Barros, Nogueira, Palomar, Roncero and Casas2009) as subsequently recommended a lower cut off 11/12, this was based on a Spanish outpatient sample, so we still consider use of the cut off 13/14 as recommended by Kessler et al. (Reference Kessler, Adler, Gruber, Sarawate, Spencer and Van Brunt2007) remains the most appropriate and reasonably conservative approach for community samples in Africa pending local validity studies.
We consider that our findings of the relatively high prevalence of ASRS (14+) scores in Kenya indicate the importance of further research on this important condition both in Kenya and in other low and high-income countries, in order to have a better understanding of overall global mental health and illness. Since ADHD is essentially a clinical diagnosis, it is important in future studies in both high and low income countries to combine the ASRS screen with a clinical interview to obtain more information on the optimum cut off screening score in each population in which the screen is used, and the methodological challenges might inform the population measuring and surveillance of this condition in other settings, including high-income ones. The use of a demographic surveillance site as a sample frame where possible confers a number of advantages to the implementation of epidemiological surveys, particularly a relatively high response rate, which reduces the effects of non-response bias in the findings.
Conclusions
The study demonstrates the magnitude of ADHD symptoms, as measured by ASRS screener scores of 14 and over, as a public health issue in Kenya, which is relevant for health worker training about detection and management. The study also indicates the importance of further research into measurement and surveillance of adult prevalence rates in both high and low income countries using a screening instrument to enable the coverage of large sample sizes together with a gold standard clinical assessment of a random subsample to assess validity of the screener in that population. It is also crucial to conduct further exploration of the complexity of associated risk factors, which may vary in different contexts, and between high and low income countries.
Acknowledgements
We are grateful to the KWHDSS for access to the health and demographic surveillance site, to Howard Meltzer who designed the sampling strategy before his untimely death in 2012, to the KEMRI laboratory at Kisian for malaria and cytokine assays, to the research assistants and field managers, and last but not the least to the people who willingly gave their time to participate in the study.
Financial support
The work was supported by the UK Department for International Development (Grant 113303-110). We are also grateful to the Nuffield Foundation for a timely travel grant (Grant 41346) to enable LO to visit Kisumu to assist the later stages of the project.
Declaration of interest
None.
Authors’ contributions
R. J. conceived the study and had overall responsibility for the project; R. J., B. O. and C. O. designed the study; P. S. drew the sample within Kombewa DHSS; B. O., C. O. and latterly L. O. provided local field supervision; R. O. analysed the data, R. J. wrote the first draft of the paper, all authors commented on successive drafts, interpretation of results and approved the final version.
Ethical standards
‘The authors assert that all procedures contributing to this work comply with the ethical standards of the relevant national and institutional committees on human experimentation and with the Helsinki Declaration of 1975, as revised in 2008.’


 Open access