


1. INTRODUCTION
Mountain snow covers are highly variable due to complex distributions of precipitation, wind, radiation and vegetation over the terrain. Snow avalanches are a hazard in these regions, and are difficult to forecast given unpredictable spatial variations in snow cover properties (Schweizer and others, Reference Schweizer, Kronholm, Jamieson and Birkeland2008). Avalanches release on failure layers that are often composed of snow that initially forms on or near the snow surface; such as surface hoar and near-surface faceted particles (Schweizer and Jamieson, Reference Schweizer and Jamieson2001). Therefore, mapping the state of mountain snow surfaces with remote sensors could provide valuable information about where destructive avalanches may occur in the future.
Surface hoar crystals grow when water vapour deposits on the snow surface. Deposition can occur in a planar axis (a-axis) to form broad plate-shaped surface hoar crystals, or in the perpendicular axis (c-axis) to form narrow needle-shaped crystals (Fig. 1). The direction of growth depends on the snow surface temperature, supersaturation, and wind speed and direction (Stössel and others, Reference Stössel, Guala, Fierz, Manes and Lehning2010; Stanton, Reference Stanton2013). The crystals can grow to several centimetres in length and stand upright on the snow surface, forming a coarse flaky texture. The unique texture allowed Champollion and others (Reference Champollion, Picard, Arnaud, Lefebvre and Fily2013) to detect surface hoar formation at a study site in Antarctica with texture analysis from an infrared camera. Once buried, plate-shaped surface hoar can form thin truss-like layers prone to propagating fractures and avalanche release (Jamieson and Schweizer, Reference Jamieson and Schweizer2000).
Surface hoar crystals with (a) plate-like shapes and (b) needle-like shapes.

Snow microstructure affects the reflection of solar radiation. Visible light incident on snow is more likely to reflect from air/ice interfaces than be absorbed by the ice, resulting in high spectral albedo at visible wavelengths (400–750 nm). At longer wavelengths, snow absorbs more radiation resulting in lower spectral albedo at near- and shortwave-infrared (NIR and SWIR) wavelengths; here defined as 750–1000 nm and 1000–3000 nm, respectively. Snow microstructure affects the overall air/ice interfacial area of the snow, and therefore the spectral albedo at NIR and SWIR wavelengths (Wiscombe and Warren, Reference Wiscombe and Warren1980). Liquid water and contaminants like dirt, black carbon and aerosols reduce the albedo by absorbing more radiation than pure dry snow (Warren and Wiscombe, Reference Warren and Wiscombe1980; Gallet and others, Reference Gallet, Domine and Dumont2014a).
In terms of optical properties, snow microstructure is often characterized by specific surface area (SSA) and optical-equivalent grain size (optical radius). The SSA is the surface area per unit mass of the snow and the optical radius is the radius of an ice sphere with the same surface to volume ratio as the snow. Snow with a low SSA or high optical radius has a lower overall air/ice interfacial area, so it reflects less shortwave radiation (Fig. 2). Numerous studies have quantified this relationship with calibrated measurements of snow samples (e.g. Domine and others, Reference Domine2006; Matzl and Schneebeli, Reference Matzl and Schneebeli2006; Gallet and others, Reference Gallet, Domine, Zender and Picard2009; Langlois and others, Reference Langlois2010; Arnaud and others, Reference Arnaud2011; Montpetit and others, Reference Montpetit2012) and using radiative transfer theory (e.g. Wiscombe and Warren, Reference Wiscombe and Warren1980; Kokhanovsky and Zege, Reference Kokhanovsky and Zege2004; Grenfell and others, Reference Grenfell, Neshyba and Warren2005; Picard and others, Reference Picard, Arnaud, Domine and Fily2009; Negi and Kokhanovsky, Reference Negi and Kokhanovsky2011). The geometric shape of the snow also impacts the relationship between SSA and reflectance, as rounded geometries such as spheres reflect less than cubes, columns, or hollow geometries (Picard and others, Reference Picard, Arnaud, Domine and Fily2009; Krol and Löwe, Reference Krol and Löwe2016).
Spectral hemispherical reflectance (albedo) of snow with different specific surface areas based on the radiative transfer model of Kokhanovsky and Zege (Reference Kokhanovsky and Zege2004). Sample spectra of vegetation and soil are shown for comparison. Boundaries between visible, near-infrared (NIR) and shortwave infrared (SWIR) wavelengths are also shown.

Remote-sensing applications can map snow properties using the relationships between snow microstructure and shortwave reflection. For example, satellite sensors map SSA and optical radius at various resolutions using the spectral reflectance from visible, NIR and SWIR wavelength bands (Jin and others, Reference Jin, Charlock, Yang, Xie and Miller2008; Kokhanovsky and Schreier, Reference Kokhanovsky and Schreier2009; Painter and others, Reference Painter2009). Bühler and others (Reference Bühler, Meier and Ginzler2015) used high-resolution airborne imagery to identify regions of fresh snow, windblown snow and wet snow in alpine terrain by calculating normalized difference indices with reflectance measurements from visible and NIR wavelengths. At smaller scales, NIR photography can be used to retrieve the vertical layering of SSA in exposed snow pit walls (Matzl and Schneebeli, Reference Matzl and Schneebeli2006; Langlois and others, Reference Langlois2010; Montpetit and others, Reference Montpetit2012).
In terms of properties relevant to avalanche release, snow microstructure is better characterized by the morphological grain shapes defined by the International Classification for Seasonal Snow on the Ground (ICSSG, Fierz and others, Reference Fierz2009). In this classification, the sintered ice structure of snow is disaggregated into individual particles, called snow grains and classified into nine major morphological shape classes (e.g. precipitation particles, rounded grains, melt forms). Observers also measure the physical dimensions of the snow grains (i.e. grain size). Avalanche practitioners use this scheme to classify snow, as the shapes often characterize the mechanical properties of the snow (Jamieson and Johnston, Reference Jamieson and Johnston2001). For example, avalanche failure layers are often composed of surface hoar, faceted crystals, or depth hoar, making the morphological shapes more applicable for avalanche forecasting than SSA or optical radius.
However, morphological shapes do not adaquately characterize the optical properties of the snow. Existing remote-sensing applications focus on the SSA and optical radius of snow, creating a disconnect with snow properties relevant to avalanche practitioners. The SSA of various morphological shapes has been reported in numerous studies and consistently show freshly deposited snow (precipitation particles) has the largest SSA, while older types of snow have smaller SSA (e.g. Legagneux and others, Reference Legagneux, Cabanes and Dominé2002; Domine and others, Reference Domine, Taillandier and Simpson2007; Gallet and others, Reference Gallet, Domine, Zender and Picard2009; Matzl and Schneebeli, Reference Matzl and Schneebeli2010; Libois and others, Reference Libois2015). For example, from a total of 345 snow samples, Domine and others (Reference Domine, Taillandier and Simpson2007) reported an average SSA of 85 m2 kg−1 for freshly fallen dendritic snow, 40 m2 kg−1 for decomposing dendritic snow, 21 m2 kg−1 for rounded grains, 18 m2 kg−1 for faceted crystals, 12 m2 kg−1 for depth hoar, 34 m2 kg−1 for surface hoar and 29 m2 kg−1 for melt-freeze crusts. Reported SSA values for surface hoar range from 16 to 65 m2 kg−1 (Table 1), and the SSA of snow surfaces often increases during periods of surface hoar growth (Stanton, Reference Stanton2013; Gallet and others, Reference Gallet, Domine, Savarino, Dumont and Brun2014b; Libois and others, Reference Libois2015).
Reported specific surface areas (SSA) for surface hoar

A wide range of reflective properties could be expected for various shapes and sizes of surface hoar, although limited reflectance measurements exist. Stanton and others (Reference Stanton, Miller, Adams and Shaw2016) performed bidirectional reflectance measurements of surface hoar grown in a cold lab, finding surface hoar had similar spectral albedo at visible wavelengths to rounded grains and caused more variations in scattering direction (i.e. a departure from Lambertian scattering). Other studies have noted changes in spectral albedo when surface hoar existed on the surface (e.g. Casacchia and others, Reference Casacchia2001; Champollion, Reference Champollion2013; Libois and others, Reference Libois2015), but did not investigate the role of surface hoar shape and size. These studies were also in polar environments as opposed to humid mountain environments where surface hoar crystals can grow of order of magnitude larger than other types of surface snow, which could have dramatic effects on the reflective properties at NIR and SWIR wavelengths.
While the effects of microstructure on the reflective properties of snow have been thoroughly studied, they have not been directly related to physical properties relevant to avalanche release. The goal of this study was to investigate the reflective properties of snow prone to becoming critical avalanche layers, including large plate-shaped surface hoar. A field spectrometer was used to measure the spectral reflectance of 377 different mountain snow samples at NIR and SWIR wavelengths, including 161 samples of surface hoar. The reflectance of different morphological shapes is compared, and the feasibility of remotely detecting critical snow surfaces is discussed.
2. METHODS
2.1. Snow observations
Field studies were conducted over 11 days in the Rocky and Columbia Mountains of Canada throughout the 2014/15 winter. Study dates and areas were chosen to observe the widest variety of snow surfaces, with emphasis on finding locations with surface hoar. Flat uniform fields were chosen to avoid the shading from trees. Major roughness features and inclines were avoided by only sampling on smooth flat surfaces, and surfaces with large impurities such as bark and lichen were avoided. A total of 377 snow surfaces were sampled using a standard procedure for acquiring spectral measurements and manual snow observations.
The morphological shape and size of snow grains in each sample were manually classified according to the ICSSG (Fierz and others, Reference Fierz2009). Disaggregated grains were placed on a gridded crystal card and viewed with a 10 × magnification loupe. The typical grain size (i.e. length of the longest axis) was observed using regular avalanche practitioner methods (Canadian Avalanche Association, 2014). The same observer made all snow observations for consistency. The primary morphological shapes in the 377 samples included 41 precipitation particles, 6 decomposing and fragmented precipitation particles, 7 rounded grains, 47 near-surface faceted particles, 13 depth hoar, 161 surface hoar, 87 melt-freeze crusts and 15 clustered rounded grains (Table 2). The surface hoar crystals were further classified as either primarily plate-shaped or needle-shaped (i.e. a-axis or c-axis growth). All samples were natural snow surfaces, except for the rounded grain and depth hoar samples, which were from buried snow layers. The snow overlying these buried samples was carefully removed with a shovel over a flat 1 m2 area. The clustered rounded grains were in the pendular regime for wet snow (i.e. <8% liquid water content).
Morphological shapes sampled with the field spectrometer

* Manually exposed buried layers.
In addition to the ICSSG classification, each sample was classified as either ‘critical’ or ‘non-critical’ based on a threshold sums method for snow stability evaluation. Schweizer and Jamieson (Reference Schweizer and Jamieson2007) identified several criteria to identify potential avalanche failure layers based on statistical analysis of snow profile observations and slope tests. Two of the criteria were the presence of a layer with a persistent grain type (i.e. faceted crystal, surface hoar, or depth hoar) with a size greater or equal to 1.2 mm. According to their threshold sums method, a layer with these properties has the potential to become an avalanche failure layer. Applying these criteria to our data found 190 of 377 samples contained ‘critical’ grains. It should be noted that these criteria were developed for buried layers, but we observed surface snow that would evolve once buried. Regardless, the classification provided a useful method to identify which of the sampled surfaces had potential to become avalanche failure layers.
2.2. Reflectance measurements
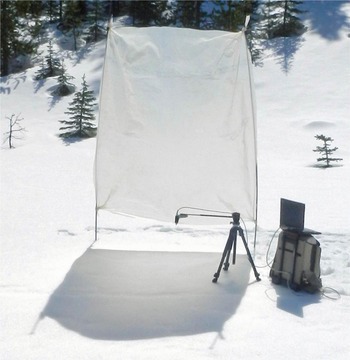
The spectral reflectance of each snow sample was measured with an Analytical Spectral Devices FieldSpec field spectrometer (Hatchell, Reference Hatchell1999). The field spectrometer measured radiance in the visible, NIR and SWIR wavelength bands (350–2500 nm) at 3 nm spectral resolution for visible wavelengths and 10 nm resolution at NIR and SWIR wavelengths. The spectrometer had a fore optics fibre-optic cable with a pistol grip for pointing at a target. The pistol grip was mounted on a tripod 0.3 m above the surface and pointed strait down (nadir). With a 25° conical field of view, the spectrometer targeted a circular area with an approximate diameter of 0.13 m on the surface (Fig. 3).
Instrument setup for acquiring reflectance measurements with the field spectrometer.

The snow surfaces were illuminated with natural shortwave radiation. All surface hoar samples were observed on clear sky days, but some of the other snow types were observed on days with overcast and broken clouds. Direct sunlight was blocked from the target by placing a plastic sheet in front of the sun, so the incident radiation was primarily diffuse. Direct radiation would have resulted in a greater degree of specular reflection, and as shown by Stanton and others (Reference Stanton, Miller, Adams and Shaw2016), the bidirectional reflectance factor of surface hoar is unpredictable. Allowing direct solar radiation would have increased directional scattering, making calibration of the spectrometer measurements more difficult. Furthermore, the atmospheric conditions varied over the course of acquiring the 377 samples, making it difficult to account for the role of direct radiation on each individual measurement. For example, variations in the solar zenith angle throughout the day can have a dramatic impact on reflectance measurements made with field spectrometers (Negi and Kokhanovsky, Reference Negi and Kokhanovsky2011; Painter, Reference Painter2011).
Reflectance factors were calculated by measuring the radiance reflected from the snow surface and the radiance reflected from a reference target. A Spectralon panel was used as a reference target, which has nearly-Lambertian reflective properties when viewed from nadir. After correcting for dark-currents resulting from instrument noise, the radiance from the snow was divided by the radiance from the reference target at each wavelength band to calculate reflectance factors. Since the snow was illuminated with diffuse atmospheric radiation and the detector had a conical field of view, the reflectance factors were hemispherical directional reflectance factors – or alternately hemispherical conical reflectance factors (HDRF/HCRF, Nicodemus and others, Reference Nicodemus, Richmond, Hsia, Ginsberg and Limperis1977). Hereafter, HDRF/HCRF is referred to as spectral reflectance or reflectance when discussing the spectrometer measurements.
Twenty consecutive spectra were acquired over a 60 s period for both the snow and reference target measurements. The spectra were averaged to reduce the effect of fluctuating illumination conditions and instrument noise during acquisition (Curtiss and Goetz, Reference Curtiss and Goetz1994). The reference target was manually held horizontally 0.1 m below the fore optics to cover the entire field of view. While we limited the effect of direct illumination by blocking direct sunlight, we observed unexpected reflectance measurements at visible wavelengths where the reflectance of all snow types should be near unity. Based on the comments of Painter (Reference Painter2011), these could result from calibration errors. The fibre optic cables in field spectrometers have a wider field of view and are more sensitive to forward scattering at visible wavelengths, and thus the reference target measurements at these wavelengths could be inaccurate (e.g. Pirazzini and others, Reference Pirazzini, Räisänen, Vihma, Johansson and Tastula2015). As a result, we limited our analysis to reflectance measurements at NIR and SWIR wavelengths. Atmospheric water vapour absorption caused low signal-to-noise ratio ~1400 nm and above 1750 nm, limiting the quality of measurements at those wavelengths.
Several other potential sources of uncertainty likely affected the reflectance measurements. Firstly, the illumination conditions were variable over the course of acquiring samples from 377 different targets. Re-calibration with the reference panel before each acquisition reduced this error, but sky conditions could change during the 60 s acquisition and cause non-uniform illumination from the upper hemisphere. Another uncertainty is the effect of non-Lambertian scattering, which could result in excessively bright or dark radiances reaching the detector, even with primarily diffuse illumination. Deviations from the nadir viewing geometry were also possible because the pistol grip fore-optics were manually leveled with a bubble inclinometer, the reference target was manually held during calibration and minor surface roughness features likely existed. Pirazzini and others (Reference Pirazzini, Räisänen, Vihma, Johansson and Tastula2015) showed minor tilting of surface (2°) could result in errors in reflectance measurements on the order of 5%. Minor roughness features likely created relative dark and bright regions, particularly for the manually exposed rounded grains and depth hoar samples. Finally, while we avoided surfaces with large impurities, smaller contaminants like dust and aerosols likely reduced the reflectance of the older snow surfaces.
2.3. Normalized difference indices
A simple remote-sensing technique that could potentially classify snow surface types calculates normalized difference indices (NDI). NDI take the ratio between reflectance measurements from two different wavelength bands to cancel out a large portion of atmospheric and illumination effects (Gordon, Reference Gordon1978). NDI can also partly correct for variable illumination on slopes in complex terrain (Bühler and others, Reference Bühler, Meier and Ginzler2015). NDI follow the general formula
 $$NDI = \displaystyle{{R_{\lambda 1} - R_{\lambda 2}} \over {R_{\lambda 1} + R_{\lambda 2}}} $$
where R λ1 and R λ2 are the spectral reflectance factors at two different wavelength bands.
The normalized difference snow index (NDSI) is a widely used NDI for the remote sensing of snow, where reflectance measurements from a visible and a SWIR band are used in Eqn (1). For example, the moderate-resolution imaging spectroradiometer (MODIS) satellite sensor produces a global snow map using a NDSI (Hall and others, Reference Hall, Riggs, Salomonson, DiGirolamo and Bayr2002). Fily and others (Reference Fily, Bourdelles, Dedieu and Sergent1997) examined the relationship between NDI and snow-grain size for various wavelength combinations, while Bühler and others (Reference Bühler, Meier and Ginzler2015) used NDI to map different snow surface types. Most NDI values use a NIR or SWIR bands to detect snow properties, due to their sensitivity to snow microstructure.
NDI values were calculated for all combinations of NIR and SWIR wavelengths at 10 nm increments (R λ1 = 750, 760, …, 1000 and R λ2 = 1010, 1020, …, 2500). For each NDI, a statistical classification tree was built with the R package rpart (Therneau and others, Reference Therneau, Atkinson and Ripley2015). Each classification tree determined threshold NDI values to classify morphological shapes. NDI values with different combinations of wavelengths were ranked in terms of cross-validation error to identify which combination of wavelength bands may be appropriate for remote-sensing applications.
3. RESULTS AND DISCUSSION
3.1. Comparing morphological shapes
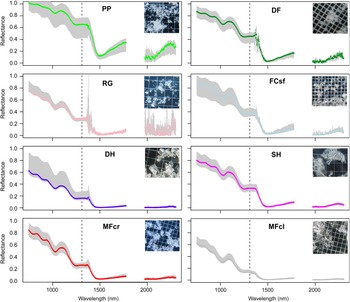
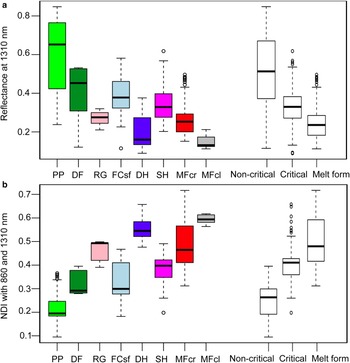
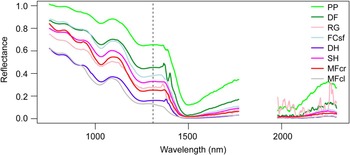
Precipitation particles were more reflective across NIR and SWIR wavelengths than other morphological shapes (Fig. 4). The range of reflectance factors (HCRF) for each morphological shape often overlapped with other shapes (as exhibited by the reflectance at 1310 nm in Figure 5a – a wavelength known to exhibit dependency on snow microstructure). Despite the overlap, a trend from most to least reflective shapes was observed (Fig. 6), starting with precipitation particles as the most reflective, followed by decomposing and fragmented precipitation particles, near-surface faceted particles, surface hoar, rounded grains, melt-freeze crusts, depth hoar and finally, clustered rounded grains.
Spectral reflectance of precipitation particles (PP), decomposing and fragmented precipitation particles (DF), rounded grains (RG), near-surface faceted particles (FCsf), depth hoar (DH), surface hoar (SH), melt-freeze crusts (MFcr) and clustered rounded grains (MFcl). The median reflectance at each wavelength is shown with coloured lines and the interquartile range is shown with gray shading. The dashed line at 1310 nm shows the wavelength band where reflectance is compared in Figure 5. Atmospheric water vapour absorption caused low signal-to-noise ratio ~1400 nm and above 1750 nm, and the noisiest values between 1750 and 2000 nm are not shown.

Comparison of (a) reflectance at 1310 nm and (b) a normalized difference index (NDI) calculated with reflectance at 860 and 1310 nm for different morphological shapes. A secondary classification based on snow stability criteria are shown on the right, where each sample was classified as either a critical snow type, a non-critical snow type, or a melt form. For each bin, the median value is shown with a black line, the interquartile range with boxes, values within 1.5 times the interquartile range with whiskers and outliers with dots.

The median spectral reflectance of each morphological shape (from Fig. 4).

The spectral reflectance of different morphological shapes is best explained by their SSA. Shapes associated with larger SSA were typically more reflective at SWIR wavelengths. For example, Domine and others (Reference Domine, Taillandier and Simpson2007) reported precipitation particles and depth hoar had the largest and smallest SSA, respectively, and these were found to be the most and least reflective types of dry snow (Fig. 6). The reflectance of other types of dry snow were less distinct, as their SSA is typically between 15 and 30 m2 kg−1 (Domine and others, Reference Domine, Taillandier and Simpson2007). While Domine and others (Reference Domine, Taillandier and Simpson2007) reported similar SSA values for rounded grains and faceted crystals, we found rounded grains were substantially less reflective than near-surface faceted particles (Fig. 5a). Although their SSAs may be similar, the sharp angles and planar faces of the faceted crystals likely increase their reflectance relative to rounded grains (Picard and others, Reference Picard, Arnaud, Domine and Fily2009). Additionally, the near-surface faceted particles in this study may have larger SSA than solid faceted particles found in older snow. Surface hoar often has larger reported SSA values than rounded grains (Table 1), and accordingly, the median reflectance of surface hoar was found to be greater than rounded grains (Fig. 6).
Physical grain size was less influential on spectral reflectance when comparing different morphological shapes. For example, the precipitation particles, decomposing and fragmented precipitation particles, near-surface faceted particles and rounded grains all had physical grain sizes between 0.5 and 2 mm (Table 2). For these similar sized grains, the rounder shapes were substantially less reflective than the dendritic shapes (Fig. 5a). The surface hoar crystals were nearly of order of magnitude larger than these grains in physical size, but their reflectance fell between the range of reflectance for near-surface faceted particles and rounded grains. The unique shape of surface hoar crystals, which are flat and striated, results in greater overall air/ice interfacial area for reflection. The depth hoar samples were also large, but were much less reflective than surface hoar (Fig. 4), demonstrating how their three-dimensional cup shape has less overall air/ice interfacial area.
Snow with liquid water in the pore spaces was the least reflective type of snow (i.e. clustered rounded grains). The reflectance of melt-freeze crusts was comparable with rounded grains at SWIR wavelengths, but slightly greater than rounded grains at NIR wavelengths (Fig. 6). As crusts are composed of refrozen grains that are often large and rounded from the melt-freeze process, their SSA are often comparable with rounded grains (e.g. Legagneux and others, Reference Legagneux, Cabanes and Dominé2002; Smith, Reference Smith2014). While melt-freeze crusts were more reflective than the wet snow samples, Gallet and others (Reference Gallet, Domine and Dumont2014a) measured only minor changes in reflectance and SSA when freezing wet snow samples. Perhaps the melt-freeze crusts and wet snow we observed had major morphological differences. For example, many of the melt-freeze crust samples were formed by rain-on-snow events, while the clustered rounded grains were formed by surface melting from solar radiation. Alternately, the melt-freeze crusts were occasionally covered by a dusting of fine precipitation particles or near-surface faceted particles, which would increase the overall surface reflectance.
3.2. Surface hoar reflectance
A wide variety of shapes and sizes of surface hoar were observed, which accordingly exhibited a wide range of reflective properties. The reflectance of surface hoar at SWIR wavelengths changed negligibly with physical crystal size (Fig. 7a), as reflectance at 1310 nm was not linearly correlated with surface hoar size (Spearmean rank correlation coefficient of −0.06, P = 0.49). However, needle-shaped surface hoar was more reflective than plate-shaped surface hoar at 1310 nm (P < 0.01 for one-sided Mann–Whitney test). Stanton (Reference Stanton2013) found needle-shaped surface hoar had larger SSA than plate-shaped surface hoar (Table 1), which would explain its higher reflectance.
Scatter plot with (a) reflectance at 1310 nm and (b) normalized difference index (NDI) calculated with reflectance at 860 and 1310 nm for different shapes and sizes of surface hoar. Dashed lines show least-square fits to the data.

The reflectance of needle-shaped surface hoar was comparable to near-surface faceted particles (interquartile ranges 0.32–0.43 and 0.33–0.46, respectively). This is not surprising considering they are structurally similar and form under similar meteorological conditions. The plate-shaped surface hoar was less reflective and closer to the reflectance of rounded grains (interquartile ranges 0.27–0.38 and 0.24–0.30, respectively). When growing plate-shaped surface hoar from rounded grains in a cold lab, Stanton (Reference Stanton2013) measured minor increases in SSA. Libois and others (Reference Libois2015) also observed increase in SSA during the growth of surface hoar in an arctic environment. The largest plate-shaped surface hoar (10–15 mm in size) showed a minor increase in reflectance with size (Fig. 7a), possibly due to an increase in SSA.
The surface hoar samples in this study included substantially larger crystals than previous studies, but only weak relationships existed between SWIR reflectance and crystal properties. This suggests SWIR reflectance measurements alone may not be appropriate for distinguishing the larger and more hazardous types of surface hoar. However, large surface hoar crystals increase the amount of directional scattering, creating random patterns with brighter reflectance maxima and darker reflectance minima (Stanton and others, Reference Stanton, Miller, Adams and Shaw2016). This could allow larger surface hoar to be identified with texture analysis from high-resolution photography (e.g. Champollion and others, Reference Champollion, Picard, Arnaud, Lefebvre and Fily2013), which may be a more appropriate method for detecting crystal size.
3.3. Normalized difference indices
NDI values using any NIR wavelength between 850 and 930 nm and any SWIR wavelength between 1240 and 1310 nm had roughly equal ability to classify morphological shapes. Using NDI values from these wavelengths to determine a set of thresholds for classifying morphological shapes resulted in cross-validation errors between 48 and 49%. The specific choice of wavelengths within these ranges had minimal impact on classification errors, similar to how Negi and Kokhanovsky (Reference Negi and Kokhanovsky2011) showed a variety of NIR wavelength were suitable for estimating optical radius. We present results for an NDI calculated with reflectance measurements from 860 to 1310 nm in Figures 5b, 7b.
NDI with a NIR and SWIR reflectance reduced the relative spread for each morphological shape compared with reflectance measurements from a single wavelength band (Fig. 5). However, the ability to classify morphological shapes with this NDI was still relatively large (48%). Surface hoar size was moderately correlated with NDI values calculated with reflectance at 860 and 1300 nm (Fig. 7b), with a Spearman rank correlation coefficient of 0.41 (P < 0.01). This suggests the NDI calculations may correct some of the calibration errors and variable illumination conditions by considering relative differences within a spectrum rather than absolute reflectance values.
3.4. Classifying critical grains
The reflectance measurements in Figures 4, 5a show snow with vastly different morphological shapes had similar HCRF at SWIR wavelengths. Considering these measurements were made under semi-controlled experimental conditions, detecting morphological shapes with remote sensors under uncontrolled conditions may be difficult. In particular, after several days without snowfall it is common for near-surface faceted particles, surface hoar and melt-freeze crusts to form simultaneously in complex mountainous terrain. Given the small degree of difference in their reflective properties, these morphological shapes may be difficult to distinguish with remote measurements. Existing algorithms that map the SSA and optical radius of snow with satellite imagery may be able to detect areas with critical snow types based on their relatively low SSA (e.g. Kokhanovsky and Schreier, Reference Kokhanovsky and Schreier2009), but would have difficulty discerning whether these areas had surface hoar, near-surface faceted particles, or melt-freeze crusts.
An alternate approach is to simplify the classification into snow types that may become critical avalanche failure layers. Surface hoar, faceted crystals and depth hoar larger than 1.2 mm had a relatively narrow range of reflectance at 1310 nm, with an interquartile range between 0.27 and 0.38 (Fig. 5b). The reflectance of non-critical precipitation particles, decomposing and fragmented precipitation particles, and small near-surface faceted particles at 1310 nm had an interquartile range between 0.37 and 0.43, distinctly higher than the critical grains. A challenge with this classification is that melt forms (i.e. melt-freeze crusts and clustered rounded grains) are also non-critical, but are notably less reflective than the critical grains. Therefore, a three-tiered classification would be needed to classify critical grains. For example, classification trees found thresholds NDI values of 0.31 to separate critical grains from non-critical grains and 0.46 to separate critical grains from melt forms (Fig. 5b).
3.5. Other considerations
While these measurements address the reflective properties of different morphological shapes, additional considerations would impact remote retrievals of surface snow types. Firstly, solar radiation not only interacts with surface snow, but with the upper snow cover. For example, Libois and others (Reference Libois2013) show measurements of NIR radiation penetrating 15–30 cm deep into various types of snow. When surface hoar exists on the snow surface the reflectance could be reduced by buried melt-freeze crusts or increased by near-surface faceted particles. The snow surface could also be composed of a mixture of morphological shapes (e.g. near-surface faceted particles mixed with small surface hoar). Also, impurities are more common on aging snow surfaces, which would likely lower the reflectance, as wind can deposit twigs, bark and lichen on growing surface hoar layers.
The bidirectional reflective properties of surface hoar would also affect remote retrievals, as many retrieval methods assume Lambertian (non-directional) scattering. Stanton and others (Reference Stanton, Miller, Adams and Shaw2016) found the reflectance of surface hoar was less Lambertian than rounded grains, with no predictable pattern aside from an increase in forward scattering. The randomness of the bidirectional reflectance would make it difficult to perform atmospheric and radiometric corrections to remotely sensed radiances, although NDI can reduce the impact of illumination effects.
The presence of melt-freeze crusts or wet snow near the surface complicate the interpretation of SWIR reflectance measurements. However, melt forms could possibly be detected with an alternate method such as remote-microwave measurements, where there is a stronger dependence on liquid water and ice crusts (Montpetit and others, Reference Montpetit, Royer, Roy, Langlois and Derksen2013). Such an approach could detect melt forms with microwave measurements, and then use SWIR reflectance measurements to distinguish critical and non-critical dry snow surfaces.
Finally, spatial resolution must be considered for remote-sensing applications. Processes affecting the evolution of mountain snow surfaces are highly variable, and accordingly very high-resolution sensors would be preferred for avalanche prediction. Traditional satellite sensors with SWIR bands have coarser resolution (e.g. tens of metres for Landsat and ASTER), but newer very high-resolution sensors like WorldView3 may be able to resolve finer slope-specific details. Detecting melt forms with remote microwave sensors would likely have coarser resolution than most sensors than measure SWIR reflectance. Finally, to resolve surface hoar texture from brightness maxima and minima, resolution on the order of a centimetre would be needed.
4. CONCLUSIONS
Morphological snow shapes prone to releasing slab avalanches had relatively low spectral reflectance at SWIR wavelengths, including surface hoar, near-surface faceted particles and depth hoar. These morphological shapes are characterized by lower SSAs than other common snow surface types. For example, the interquartile range of reflectance at 1310 nm for critical shapes was 0.26–0.38, compared with 0.37–0.43 for non-critical shapes. The reflectance of surface hoar did not vary substantially with crystal size, although plate-shaped surface hoar was less reflective than needle-shaped surface hoar (median reflectance at 1310 nm of 0.32 and 0.41, respectively). Due to its primarily 2-D structure, surface hoar was more reflective than manually exposed depth hoar (median reflectance at 1310 nm of 0.32 and 0.16, respectively). However, since melt-freeze crusts also had relatively low reflectance (median reflectance at 1310 nm of 0.25), it may be difficult to discern critical snow types from crusts using only SWIR reflectance measurements.
While this study highlighted several challenges in remotely detecting the specific morphological properties of surface hoar, it may be feasible to map ‘critical’ snow surfaces using NDI. Bühler and others (Reference Bühler, Meier and Ginzler2015) already demonstrated mapping fresh snow, windblown snow and wet snow surfaces in complex terrain with NDI using visible and NIR wavelengths. Performing similar studies over areas with critical snow types such as surface hoar would be interesting, particularly using sensors with SWIR wavelength bands. Improved methods for detecting melt-freeze crusts near the surface would be necessary for developing useful avalanche forecasting applications, as they complicate the interpretation of SWIR reflectance measurements. Additionally, since our experiments were restricted to diffuse illumination and contained several sources of uncertainty, further quantifying the bidirectional reflectance of surface hoar (e.g. Stanton and others, Reference Stanton, Miller, Adams and Shaw2016) would help explain how mountain snow surfaces reflect shortwave radiation under a wider variety of atmospheric conditions.
ACKNOWLEDGEMENTS
We thank Alexandre Langlois and his team at the University of Sherbrooke for lending their field spectrometer and TECTERRA for providing a hyperspectral camera for additional experiments on this topic. For the financial support we thank TECTERRA, Canadian Pacific, Canadian Avalanche Association, NSERC, HeliCat Canada, Canadian Avalanche Foundation, Parks Canada, Mike Wiegele Helicopter Skiing, Canada West Ski Areas Association, Backcountry Lodges of BC Association, Association of Canadian Mountain Guides, Teck Mining Company, Canadian Ski Guide Association, Backcountry Access and the BC Ministry of Transportation and Infrastructure Avalanche and Weather Programs. We also thank Michael Smith for proofreading this paper and the reviewers for their helpful feedback.


 Open access