


Introduction
Prompt treatment of sepsis is crucial for improving patient outcomes. The 2021 and 2026 Surviving Sepsis Campaign (SSC) Guidelines recommend antibiotic administration within one hour for patients with possible septic shock or a high suspicion of sepsis, and within three hours for patients with possible sepsis without shock. Reference Evans, Rhodes and Alhazzani1,Reference Prescott, Antonelli and Alhazzani2 Delays in antibiotic administration have been associated with increased morbidity and mortality in sepsis patients. Reference Leung, Huang and Hung3
Intravenous piggyback (IVPB) antibiotics require on-demand compounding or thawing from premixed frozen solution and are administered over 30–60 minutes. Admixture devices (eg, vial-to-bag adapters) increase cost, training burden, and risk of incomplete or incorrect activation leading to no medication delivery. In contrast, intravenous push (IVP) antibiotics are low cost, ready-to-use, without risk of drug omission, and can be administered over 5 minutes without affecting their pharmacodynamic profile compared to 30-minute infusion. 4,Reference Butterfield-Cowper and Burgner6 Additionally, IVP antibiotics have been shown to decrease delays in antibiotic administration, labor demands, and cost without any increase in adverse events compared to IVPB antibiotics. 5–Reference Rech and Gottlieb13
Given the growing evidence supporting IVP antibiotics, our Emergency Department (ED) transitioned from IVPB to IVP administration for cefazolin, cefepime, ceftriaxone, and piperacillin-tazobactam to improve time to antibiotic administration and compliance with SSC guidelines. This retrospective analysis evaluates outcomes before and after the transition.
Methods
Population and setting
We conducted a retrospective analysis of adult patients with sepsis treated in the Veterans Affairs Puget Sound Healthcare System (VAPSHCS) ED between June 2022 and July 2024. The VAPSHCS is a tertiary academic medical center with approximately 22,000 annual ED visits. Patients were included if they had a sepsis-related International Classification of Diseases (ICD)-10 code or met ≥2 systemic inflammatory response syndrome (SIRS) criteria. Exclusion criteria included receipt of antibiotics before documented sepsis identification, unclear antibiotic start times, duplicate records, or failure to meet SIRS criteria on chart review. Additional chart review captured key variables, including sepsis identification time (defined as meeting ≥2 SIRS criteria), antibiotic administration start time, ED length of stay (LOS), patient demographics, antibiotic selection, and suspected infection source.
Intervention
Before the intervention, cefazolin, cefepime, ceftriaxone, and piperacillin-tazobactam were dispensed to the ED as IVPB, requiring on-demand compounding or thawing from pre-mixed frozen solution, and infusion over 30 minutes. In June 2023, our ED transitioned the first dose of these antibiotics to IVP administration. To support this change, antibiotic vials and diluents were stocked in the ED automated dispensing cabinet for rapid access. Education regarding the change was provided to ED physicians, nurses, and pharmacy staff. Training on immediate-use compounding was delivered to ED nurses prior to rollout and subsequently incorporated into annual nursing competency requirements. This intervention supported ongoing efforts to improve compliance with the SSC guidelines. Following the initial IVP dose in the ED, subsequent antibiotic doses continued as IVPB (30-minute infusion for cefazolin, cefepime, and ceftriaxone; extended infusion for piperacillin-tazobactam).
Primary and secondary outcomes
The primary measure was the median time from sepsis identification to antibiotic administration start (minutes) per month. Secondary measures included the proportion of septic patients who received antibiotics within 60 and 180 minutes of sepsis identification and ED LOS.
Statistical analysis
Descriptive and inferential statistics were used to summarize variables before and after the intervention. X-bar and S charts assessed process consistency over time and temporal relationships between IVP antibiotic implementation and mean time from sepsis identification to antibiotic administration using accepted rules for special cause variation. Reference Benneyan, Lloyd and Plsek14 Comparisons between groups were performed using Wilcoxon rank sum and chi-squared analysis, as appropriate. Analyses were conducted in Stata version 18.1 (College Station, TX) and Process Improvement Products QI Charts for Microsoft Excel version 2.0 (San Antonio, TX). All tests were two-sided, and P < .05 was considered statistically significant.
Results
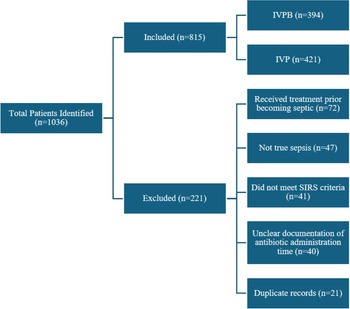
Of the 1,036 encounters identified, 221 (21%) were excluded due to duplicate records (n = 21), antibiotic administration before sepsis identification (n = 72), unclear antibiotic administration start time (n = 40), or not meeting sepsis criteria after adjudication (n = 88). We included 815 in the final analysis, with 394 (38%) receiving IVPB antibiotics and 421 (40%) receiving IVP antibiotics (Figure 1).
Patient selection. The Figure illustrates the patient selection process, showing the number of patients included in the IVPB and IVP groups, as well as the number of patients excluded with corresponding reasons for exclusion.

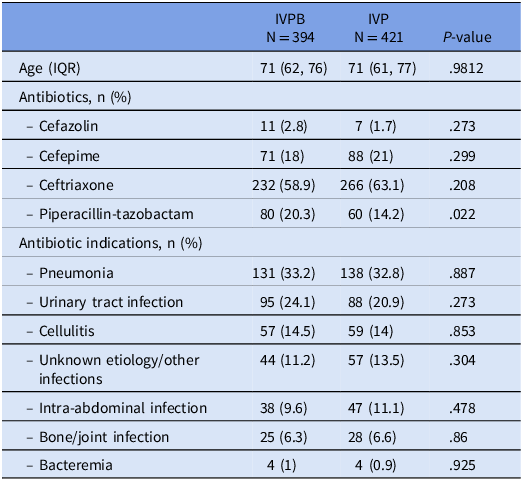
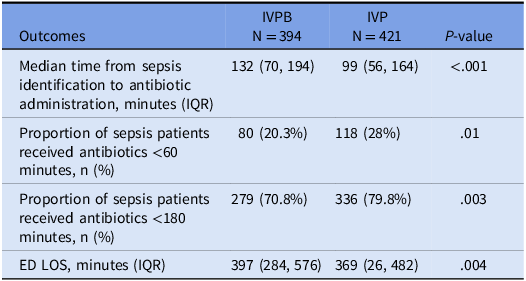
Baseline characteristics between the two groups were similar, with no significant difference in age between the IVPB (71 yr; IQR 62, 76) and IVP groups (71 yr; IQR 61, 77). Ceftriaxone was the most frequently used antibiotic (IVPB 59% vs IVP 63%), and pneumonia was the most frequent indication for antibiotics (IVPB 33% vs IVP 33%) in both groups (Table 1). The time from sepsis identification to antibiotic administration start was 132 (IQR 70, 194) minutes with IVPB antibiotics and 99 (IQR 56, 164) minutes with IVP antibiotics. Patients in the IVPB group were less likely to receive antibiotics within 60 (IVPB 20% vs IVP 28%) and 180 (IVPB 71% vs IVP 80%) minutes of sepsis identification. Regarding ED LOS, patients in the IVPB group stayed for a median of 397 (IQR 284, 576) minutes and patients in the IVP group stayed for a median of 369 (IQR 262, 482) minutes (Table 2).
Baseline characteristics, antibiotic use, and infection indications in IVPB and IVP groups

Process and clinical outcomes of IVPB vs IVP antibiotic

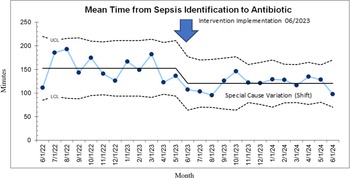
Prior to the intervention, the mean time from sepsis identification to antibiotic administration fluctuated widely between 111 and 192 minutes, with some data points approaching the upper control limit (UCL). Following implementation of IVP antibiotic administration, there was a sustained downward shift of twelve consecutive months of mean sepsis identification to antibiotic administration start time below the pre-intervention centerline and less variations across data points (Figure 2). In terms of variability, the monthly standard deviation was less consistent before the intervention, with three points beyond the control limits. After the intervention, the monthly standard deviation remained entirely within the control limits (Figure 3).
Statistical process control chart for mean time from sepsis identification to antibiotic administration. This figure displays the fluctuation in mean time from sepsis identification to antibiotic administration prior to the intervention, with some data points approaching the upper control limit (UCL). Following the implementation of IVP antibiotic administration in June 2023, the data show a sustained downward shift, with twelve consecutive months below the pre-intervention centerline and reduced month-to-month fluctuation.

Statistical process control S chart for variability in time from sepsis identification to antibiotic administration. Prior to IVP implementation, standard deviations were higher and inconsistent, with several months showing large spikes in administration times. Post-intervention, the standard deviation trended downward, with less extreme monthly variation and values remaining more stable within control limits.

Discussion
IVP antibiotic administration is supported by the American Society of Health-System Pharmacists (ASHP) to conserve IV fluids during shortages and has gained adoption for its practical benefits. 5 The shortened infusion time of IVP regimens was found to have no significant impact on the pharmacodynamic profile of the antibiotics, having little to no effect on plasma concentration throughout the dosing interval or the time interval that free drug concentration remained above MIC. Reference Butterfield-Cowper and Burgner6 Additionally, IVP antibiotics can reduce labor demands, improve time to antibiotics, lower costs, and does not increase adverse events. Reference Academia, Jenrette and Mueller7–Reference Rech and Gottlieb13
The findings from this QI initiative demonstrate that the transition from IVPB to IVP antibiotics was associated with significant improvements in the timeliness and consistency of antibiotic administration for sepsis patients at the VAPSHCS ED. The median time from sepsis identification to antibiotic administration was significantly reduced from 132 minutes (IQR 70–194) with IVPB to 99 minutes (IQR 56–164) with IVP (P < .001). Additionally, adherence to SSC guidelines improved, as reflected by an increase in the proportion of patients receiving antibiotics within 60 minutes (20.3% to 28%, P = .01) and within 180 minutes (70.8% to 79.8%, P = .003). These findings are supported by the trend of the X-bar chart, which showed a consistent downward shift in the mean time from sepsis identification to antibiotic administration post intervention. Lastly, the ED LOS decreased by 28 minutes (397 to 369 mins, P = .004), which along with the improved process consistency showed by the S chart, suggests that the intervention had a modest effect on overall ED efficiency and patient flow.
These findings align with previous studies demonstrating time savings with IVP antibiotics in sepsis management. In prior retrospective analysis, IVP was associated with approximately 32-minute time savings to β-lactam (β = –0.60; 95% CI, –0.91 to –0.29) and to broad-spectrum (β = –0.32; 95% CI, –0.62 to –0.02) antibiotic administrations. The IVP antibiotic group was less likely to fail the goal of β-lactam antibiotics within 1 hour (44.6% vs 57.3%; odds ratio, 2.27; 95% CI, 1.34–3.86) and 3 hours (7.6% vs 24.5%; odds ratio, 4.31; 95% CI, 2.01–10.28) of sepsis diagnosis compared with IVPB. Reference Gregorowicz, Costello and Gajdosik11 However, with a small sample size and short timeframes, the study did not evaluate trends in antibiotic administration times or assess process consistency over time, which is critical for QI initiatives.
Our analysis is the first to demonstrate a statistically significant association between IVP antibiotics and improvements in sepsis-related process measures and patient outcomes, using a large sample size with statistical process control evaluation over time. Despite these improvements, some challenges remain. Only 28% of patients received IVP antibiotics within 60 minutes, and although the proportion of patients receiving antibiotics within 180 minutes increased to 79.8%, approximately 20% still did not receive antibiotics within the recommended time frame, indicating a need for further optimization.
Several institution-specific factors likely contributed to lower adherence. Our analysis measured time from sepsis identification, which depends on timely clinical recognition and documentation of SIRS criteria. Variability in these processes may have attenuated measured adherence despite timely clinical intent. Limited space in ED automated dispensing cabinets also restricted the quantity of antibiotic and diluent vials that could be stocked, necessitating frequent restocking and potentially delaying antibiotic administration. Furthermore, the reduction in ED LOS, while statistically significant, may not be clinically meaningful in all cases, indicating that other factors beyond antibiotic timing may influence patient flow and disposition.
Overall, this initiative demonstrates that IVP antibiotics are an effective and sustainable strategy to reduce antibiotic administration times, improve adherence to sepsis guidelines, and enhance ED efficiency. Future directions should focus on expanding IVP protocols in the ED, addressing remaining delays, and evaluating the long-term patient outcomes such as mortality and ICU admission rates.
Conclusion
Implementation of IVP antibiotics was associated with decreased median time to antibiotic administration for septic patients as well as increased adherence to SSC guidelines and decreased ED LOS.
Acknowledgements
The authors report no financial support and no conflict of interest. MHN implemented the intervention, designed and validated the data collection query, and finalized the manuscript. LTP assisted with the data collection query, performed data analysis, and critically reviewed the manuscript. KL contributed to the design of the data collection query, assisted with data collection, and prepared the initial draft under the supervision of MHN and LTP. CV supported the internal MUE evaluation in 2023 under the supervision of MHN and LTP.
Ethical standards
This quality improvement study was approved as non-research by the VAPSHCS Human Research Protection Program and Quality, Safety, and Value Office.


 Open access

