


1. Introduction
During the 2012 drought, the decline in beef cow numbers led the beef industry to look for alternatives to help maintain beef supply. Over a 50% increase in dairy-type animals occurred between 2011 and 2016 as the industry relied on dairy calves to help maintain the beef supply (Boykin et al., Reference Boykin, Eastwood, Harris, Hale, Kerth and Griffin2017; Moore et al., Reference Moore, Gray, Hale, Kerth, Griffin, Savell and Raines2012). Although dairy calves contribute to overall beef production, they incur discounts compared with native beef calves (Ledbetter, Reference Ledbetter2018). When native beef supply returned to normal in 2016 and other market forces shifted, Holstein bull calves lost most of their market value (Basiel and Felix, Reference Basiel and Felix2022). Additionally, the use of female-sexed semen for genetic advancement increased the number of female calves and resulted in more dairy heifers for producers. With more dairy heifers available than required to maintain the milking herd, dairy farmers began mating a portion of their females, typically heifers, older cows, and genetically inferior cows, to beef semen to add value to the surplus calves (Jaborek et al., Reference Jaborek, Carvalho and Felix2023). This trend led to a 437% increase in domestic beef semen sales from 2013 to 2024 and a reduction in dairy semen sales (NAAB, 2013, 2024).
The resulting beef-dairy crossbred calves are currently more valuable to buyers after birth than the dairy bull calf (Dal Zotto et al., Reference Dal Zotto, Penasa, De Marchi, Cassandro, López-Villalobos and Bittante2009; Wilson et al., Reference Wilson, Stojkov, Renaud and Fraser2020). So, breeding dairy cows to beef sires has increased rapidly in recent years (Fairbairn and Felix, 2020). The U.S. fed beef supply from dairy-bred cattle ranges from 20.5% to 22.7% (Pimentel-Concepcion et al., Reference Pimentel-Concepción, Jaborek, Schweihofer, Garmyn, McKendree, Bradford, Hentschl and Buskirk2024; Poock and Bekett, Reference Poock and Beckett2022).
Beef packers typically discount straight-bred dairy steers about $32.19/cwt carcass weight compared to $2.27/cwt carcass weight for beef × dairy crosses in relation to native beef carcasses (USDA AMS, 2025). Recent reports indicate that beef × dairy crossbreds are valued approximately $34.58 per cwt higher than straightbred male dairy calves (McCabe et al., Reference McCabe, King, Fike and Odde2022). USDA Agricultural Marketing Service Cattle Contracts Library report average discounts of $32.45/cwt for straightbred dairy cattle compared to $2.68/cwt for beef × dairy crosses on a carcass weight basis in April of 2025 (USDA, AMS, 2025). However, information on beef × dairy calf value to feedlots is limited, and there are limited data on how these calves perform economically compared to their native beef counterparts in different post-weaning management systems.
The objective of this paper was to determine the effect of calf-fed (CF) or yearling-fed (YF) finishing systems on economic outcomes of beef × dairy (BD) crossbred steers compared to native beef (NB) steers. The hypothesis was that NB calves would generate higher returns than BD calves, and YF systems would generate higher returns than CF systems. Accordingly, we expected Native Beef Calf-Fed (NBYF) calves to have the highest returns, followed by Beef × Dairy Yearling-Fed (BDYF) and native beef calf-fed (NBCF), with Beef × Dairy Calf-Fed (BDCF) having the lowest returns.
2. Literature review
There is an extensive body of literature covering the economics of cattle production systems, but little of that literature addresses the economic returns associated with beef × dairy cattle production. Among the earliest studies to do so are Cunningham (Reference Cunningham1974) and Shumway and Bentley (Reference Shumway and Bentley1974). Cunningham (Reference Cunningham1974) argued that returns to the dairy industry increase rapidly as dairy cows are inseminated with semen from beef bulls. Shumway and Bentley (Reference Shumway and Bentley1974) used linear programming to compare traditional beef cow herds with beef breeds crossed with dairy and exotic breeds. They concluded that crossbred herds produced higher profit per unit of fixed inputs, such as land, facilities, and other non-variable resources. Obviously, in the last 50 years, “traditional” beef breeds have changed phenotypically and genotypically. For example, Shumway and Bentley assumed Angus cows weighed 950 pounds, whereas current mature Angus cows commonly reach 1,400 pounds.
Beef × dairy cattle production and meat science have been studied extensively for several decades (e.g., Pahnish et al., Reference Pahnish, Brinks, Urick, Knapp and Riley1969; Basiel and Felix, Reference Basiel and Felix2022; Berry, Reference Berry2021; Bertrand et al., Reference Bertrand, Willham and Berger1983; Foraker et al., Reference Foraker, Ballou and Woerner2022; Huuskonen et al., Reference Huuskonen, Pesonen, Kämäräinen and Kauppinen2013). With the increased market value of cattle, including beef × dairy crosses, over the last five years, some economic analyses have been published. Rezagholivand et al. (Reference Rezagholivand, Nikkah, Khabbazan, Mokhtarzadeh, Dehghan, Mokhtabad, Sadigihi and Rajee2021) compared the feedlot performance and economic returns of purebred Holstein calves with those of beef × dairy calves. They reported that purebred Holstein calves had lower returns than beef × dairy calves. Ruelle et al. (Reference Ruelle, Shalloo and Butler2021) argued that dairy producers improve returns by utilizing beef semen after sufficient replacement female pregnancies are obtained. Schmaltz et al. (Reference Schmaltz, Schroeder, Walter and Hutcheson2024) evaluated the economic returns of fed beef × dairy crossbred heifers under varying days on feed. They reported that returns of fed beef × dairy heifers were highest at the shortest days on feed (323 days), at about $100 per head, and declined rapidly after 344 days on feed. The published studies agree that dairy producers improve profits by utilizing beef genetics to add value to their calf crop in excess of replacement females. Still, there is much to discover about how to most profitably manage beef × dairy calves, specifically regarding which management systems yield the highest returns.
3. Data collection
Data were collected from research at Oklahoma State University, and all procedures were approved by the Institutional Animal Care and Use Committee at Oklahoma State University (Animal Care and Use Protocol Number: IACUC-22-16). A description of the study methods is reported and briefly discussed below.
3.1. Breed
Native beef steers were acquired from Capitol Land and Livestock (Schwertner, TX), and beef × dairy steers were acquired from 5-Star Dairy (Hart, TX). There were 185 observations for beef × dairy steers and 160 observations for native beef steers. Of the 185 observations for beef × dairy, 110 were allocated to the CF system and 75 to the YF system. For native beef, there were 85 observations for CF system and 75 observations for YF system.
3.2. System
The experimental design was a 2 × 2 system with treatments of breed (NB or BD) and finishing system (CF or YF). The CF system was characterized as steers bought and transported directly to Buffalo Feeders (Buffalo, OK) for finishing, resulting in 194 observations. Some mortality occurred during the feeding period but was not included in the analysis. Data were collected from feedlot arrival through slaughter dates (January–April 2024). YF steers were transported to the Marvin Klemme Research Range near Bessie, OK (35°25’00.4” N, 99°03’42.6” W) for a grazing period before finishing at Buffalo Feeders with 150 observations. At Buffalo Feeders, steers were assigned to commercial-scale finishing pens based on breed and finishing system.
3.2.1. Calf-Fed
At intake at Buffalo Feeders, initial body weight (BW) was recorded, and steers were implanted with Component E-S with Tylan (containing 20 mg estradiol benzoate, 200 mg progesterone, and 29 mg tylosin tartrate), dewormed with Dectomax® (doramectin), and vaccinated with Pyramid 5 + Presponse SQ for infectious bovine rhinotracheitis (IBR) and bovine viral diarrhea (BVD). NBCF steers were fed a growing diet for 97 days supplying 26% roughage, 15% CP, and 1.20 Mcal NEg/kg (DM basis) before moving through three rounds of step-up diets for five days each with a three-day transition period. Feed management differed between groups because all feeding decisions were determined by Buffalo Feeders after cattle arrived at the feedlot. NBCF steers were transitioned to a finishing diet on day 111. BDCF steers were fed the same three-stage step-up diets, in which the proportions of feed ingredients were gradually adjusted. These diets consisted of corn silage, ground corn, dried distillers’ grains, alfalfa hay, and a protein–mineral supplement and were fed for 19 days each with a three-day transition period before steers were transitioned to a finishing diet on day 64. The finishing diet for both groups was fed until slaughter and provided approximately 13% crude protein (CP), 2.4 Mcal/kg NEm, and 1.6 Mcal/kg NEg on a dry matter basis. NB steers were reimplanted on day 78, and BD steers were reimplanted on day 108 with either Synovex One Feedlot or Synovex Plus implants (each containing 200 mg trenbolone acetate and 28 mg estradiol benzoate; Zoetis Animal Health). At reimplant, steers were weighed and sorted into heavy and light sorts. For the CF system, BW ranges were 914–1072 lb (heavy) and 812–1008 lb (light) for BDCF steers and 1006–1280 lb (heavy) and 776–998 lb (light) for NBCF steers. NB steers were shipped for slaughter on 20 February 2024 and 02 April 2024, whereas BD steers were shipped on 23 January 2024 and 20 February 2024. This occurred because BD steers entered the finishing phase sooner and therefore reached slaughter weight earlier. Steer BW at slaughter was calculated as carcass-adjusted BW, defined as hot carcass weight divided by the average dressing percentage (DP) for the sort and multiplied by 100.
3.2.2. Yearling-Fed
YF steers were transported from the source to the Marvin Klemme Research Range. At arrival, steers were placed into a holding pen with ad libitum access to mixed grass hay and water for 48 h. Steers were weighed 24 h and 48 h post-arrival and sorted by BW and randomly placed into one of three pastures, achieving a stocking rate of 6 acres per animal. Pastures were balanced for breed type (Pasture 1; BD = 21; NB = 18, Pasture 2; BD = 26; NB = 26, Pasture 3; BD = 28; NB = 31). Steers were supplemented with extruded 100% DDGS cubes (MasterHand Milling, Lexington, NE) at 1 lb per head per day for the first 53 days. Steers were supplemented with 2.5 lbs per head per day from day 54 to day 144 due to 53-day BW and forage maturity. All steers had libitum access to stocker mineral (MasterHand Milling, Lexington, NE) during the grazing period. Steers were gathered a day prior to weigh days and held together in a dry lot with ad libitum access to mixed grass hay and water. Steers were weighed on days 53, 144, and 145. On day 145, steers were transported to Buffalo Feeders to be followed through the finishing phase.
Upon arrival at the feedlot, steers were implanted (Synovex Choice; Zoetis Animal Health), dewormed (Safeguard; Merck Animal Health), and were vaccinated for IBR and BVD (Pyramid 3 + Presponse; Boehringer Ingelheim Animal Health). Beef × Dairy steers were fed the first two step-up rations for nine days each with a three-day transition period and were then fed the final step-up diet (containing 55% flaked corn, 18% wet distillers grains, and 4.8% fat) for four days before transitioning to the finishing diet (13.0% CP, 2.4 Mcal/kg NEm, 1.6 Mcal/kg NEg) on day 29. Native beef steers were fed the first step-up ration for then days, the second for five days, and the third for three days all with a three-day transition period. Native beef steers were transitioned to the finishing diet on day 25. Both NB and BD YF steers were reimplanted on day 87 using Synovex Choice (Zoetis Animal Health). Reimplant BW was recorded, and steers were sorted into heavy and light sorts. For the YF system, BW ranges were 1150–1314 lb (heavy) and 992–1120 lb (light) for BDYF steers, and 1190–1420 lb (heavy) and 942–1202 lb (light) for NBYF steers. Native beef steers shipped for slaughter on 23 April 2024 and 07 May 2024, whereas BD steers were shipped for slaughter on 30 April 2024 and 07 May 2024. Steer BW at slaughter was a carcass-adjusted BW, calculated as hot carcass weight divided by average DP for the pen (determined from abattoir data) and multiplied by 100.
4. Bio-economic model
We assume the producer objective is to maximize expected returns to fixed costs, labor, and management from feeding calves by choosing breed and system.
Mathematically,
 $$\underset{B,S}{{\rm Max}}\,\, E[\textit{Return}{\,\,\,}(B,S)]$$
where B ∈ {Native Beef, Dairy × Beef} denotes breed type and S ∈ {Yearling, Calf} denotes the finishing system. Return is calculated as
 $$\textit{Return}{\,\,\,}\left(B,S\right)=[HCW_{B,S}\times \left(\textit{Price}+\textit{Premiums}+\textit{Discounts}\right)-\textit{PurchaseCost}_{B}-\textit{FeedCosts}_{B,S}\\-OCi_{B,S}-\textit{OCfyv}_{B,S}]$$
where HCW is hot carcass weight (lb); Price is base carcass price ($/lb); Premiums is added value based on carcass quality ($/lb); Discounts is deductions for carcass defects or yield grade ($/lb); PurchaseCost is steer purchase cost ($/head); FeedCosts is total feed cost ($/head); OCi is the opportunity cost of investment ($/head), calculated in equation (4), and OCfyv is the opportunity costs of feed, yardage, and vet ($/head), calculated in equation (5).
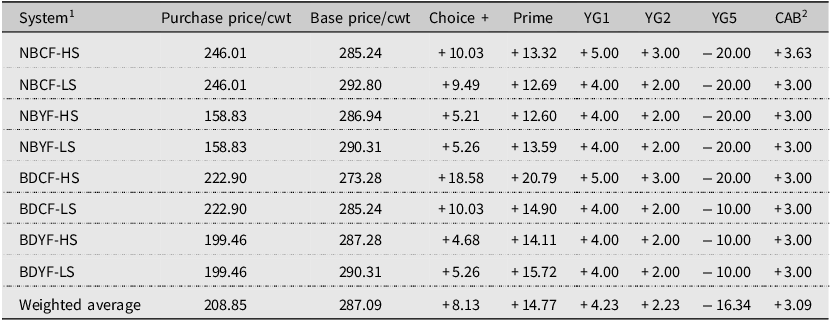
Carcass data were collected by trained personnel from the abattoir via carcass camera imaging. Purchase cost and prices were collected, and weighted averages were used. Premiums and discounts (Table 1) were calculated using average weighted base grid prices from National Beef Packing Co. LLC (Liberal, KS) at the time of slaughter to account for changes in cattle prices between slaughter dates.
Purchase prices, base prices, premiums, and discounts used for carcass values

Table 1 Long description
The table compares purchase prices, base prices, premiums, and discounts for various systems. It has 8 rows and 9 columns. The columns are labeled as System, Purchase price/cwt, Base price/cwt, Choice +, Prime, YG1, YG2, YG5, and CAB. The rows are labeled with different systems: NBCF-HS, NBCF-LS, NBYF-HS, NBYF-LS, BDCF-HS, BDCF-LS, BDYF-HS, BDYF-LS, and Weighted average. Each row provides specific values for each column. For example, Row 1: System, NBCF-HS; Purchase price/cwt, 246.01; Base price/cwt, 285.24; Choice +, +10.03; Prime, +13.32; YG1, +5.00; YG2, +3.00; YG5, -20.00; CAB, +3.63. Row 2: System, NBCF-LS; Purchase price/cwt, 246.01; Base price/cwt, 292.80; Choice +, +9.49; Prime, +12.69; YG1, +4.00; YG2, +2.00; YG5, -20.00; CAB, +3.00. Row 3: System, NBYF-HS; Purchase price/cwt, 158.83; Base price/cwt, 286.94; Choice +, +5.21; Prime, +12.60; YG1, +4.00; YG2, +2.00; YG5, -20.00; CAB, +3.00. Row 4: System, NBYF-LS; Purchase price/cwt, 158.83; Base price/cwt, 290.31; Choice +, +5.26; Prime, +13.59; YG1, +4.00; YG2, +2.00; YG5, -20.00; CAB, +3.00. Row 5: System, BDCF-HS; Purchase price/cwt, 222.90; Base price/cwt, 273.28; Choice +, +18.58; Prime, +20.79; YG1, +5.00; YG2, +3.00; YG5, -20.00; CAB, +3.00. Row 6: System, BDCF-LS; Purchase price/cwt, 222.90; Base price/cwt, 285.24; Choice +, +10.03; Prime, +14.90; YG1, +4.00; YG2, +2.00; YG5, -10.00; CAB, +3.00. Row 7: System, BDYF-HS; Purchase price/cwt, 199.46; Base price/cwt, 287.28; Choice +, +4.68; Prime, +14.11; YG1, +4.00; YG2, +2.00; YG5, -10.00; CAB, +3.00. Row 8: System, BDYF-LS; Purchase price/cwt, 199.46; Base price/cwt, 290.31; Choice +, +5.26; Prime, +15.72; YG1, +4.00; YG2, +2.00; YG5, -10.00; CAB, +3.00. Row 9: System, Weighted average; Purchase price/cwt, 208.85; Base price/cwt, 287.09; Choice +, +8.13; Prime, +14.77; YG1, +4.23; YG2, +2.23; YG5, -16.34; CAB, +3.09.
1 Base prices, premiums, and discounts for native beef (NB) or beef × dairy (BD) steers in yearling-fed (YF) or calf-fed (CF) systems with heavy sorts (HS) and light sorts (LS). Certain premiums and discounts were the same for all groups and include the following: Choice = 0.00, YG3 = 0.00, YG4 = −10.00, Certified Hereford Beef (CHB) = +2.00, Black Canyon Premium Reserve (BCPR) = +0.50, HCW ≤ 574 lbs = −30.00, HCW 575 – 1099 lbs = 0.00, HCW≥1100 lbs = −15.00, No roll = −10.00, Hard bone = −25.00, > 30 mo of age = −12.00.
2 CAB = certified Angus beef.
Feed costs were calculated for each steer as:
 $$Feed{\,\,}\textit{Costs}=\textit{Total}{\,\,}Feed{\,\,}\textit{Required}{\,\,}\times{\,\,}feed{\,\,}\textit{price}$$
where Total Feed Required is the total dry-matter feed consumed by each steer during the feeding period $(\hbox{kg DM})$
, and feed price is the cost per kg of feed on a dry matter basis ($/kg DM).
$(\hbox{kg DM})$
, and feed price is the cost per kg of feed on a dry matter basis ($/kg DM).
Opportunity costs of investment (OCi) were determined for each steer using the equation below and a 7% interest rate per year:
 $$OCi = {\textit{Revenue}+\textit{PurchaseCosts} \over 2} \times {0.07 \over 365}\times DOF$$
where Revenue ($/head) is the total carcass value calculated in equation (2) as carcass weight multiplied by base price plus premiums and discounts; PurchaseCosts ($/head) is the initial steer purchase cost; the factor ${0.07 \over 365}$
converts the annual interest rate (7%) to a daily rate by dividing it by 365 days per year; and DOF (day) is days on feed.
${0.07 \over 365}$
converts the annual interest rate (7%) to a daily rate by dividing it by 365 days per year; and DOF (day) is days on feed.
Opportunity costs of feed, yardage, and vet (OCfyv) were similarly calculated as:
 $$\textit{OCfyv} = {COG_{\textit{grazing}}+COG_{\textit{feedlot}}+Vet \over 2} \times {0.07 \over 365}\times DOF$$
where COG grazing and COG feedlot ($/lb gain) are average cost of gain during the grazing and feedlot periods, respectively; and Vet is veterinary cost. To evaluate how breed, finishing system, and their interaction affected economic returns, we estimated a regression model using the return from equation (2) as the dependent variable. The results of this model are presented in Table 6.
Statistical analyses were performed using the SAS 9.4 software (SAS Institute Inc., Cary, NC). Data were analyzed as 2 × 2 factorial design using the Mixed Procedure. Breed, system, and their interaction were fixed effects. The Satterthwaite denominator degrees of freedom approximation option was utilized to correct the degrees freedom in t-tests and F-tests. The LSMEANS statement was used to estimate least squares means for the Breed × System interaction. Significance was declared at α = 0.05.
5. Results and discussion
Summary statistics for the four breed × system treatments are reported in Table 2 and included in-weight, feedlot initial BW, days on feed (DOF), ADG, DMI, feed efficiency, hot carcass weight (HCW), USDA Quality Grade (QG), and Yield Grade (YG). These findings show that breed and finishing system influence both growth and carcass outcomes, which are important factors to the economic analysis of this study.
Summary of statistics system
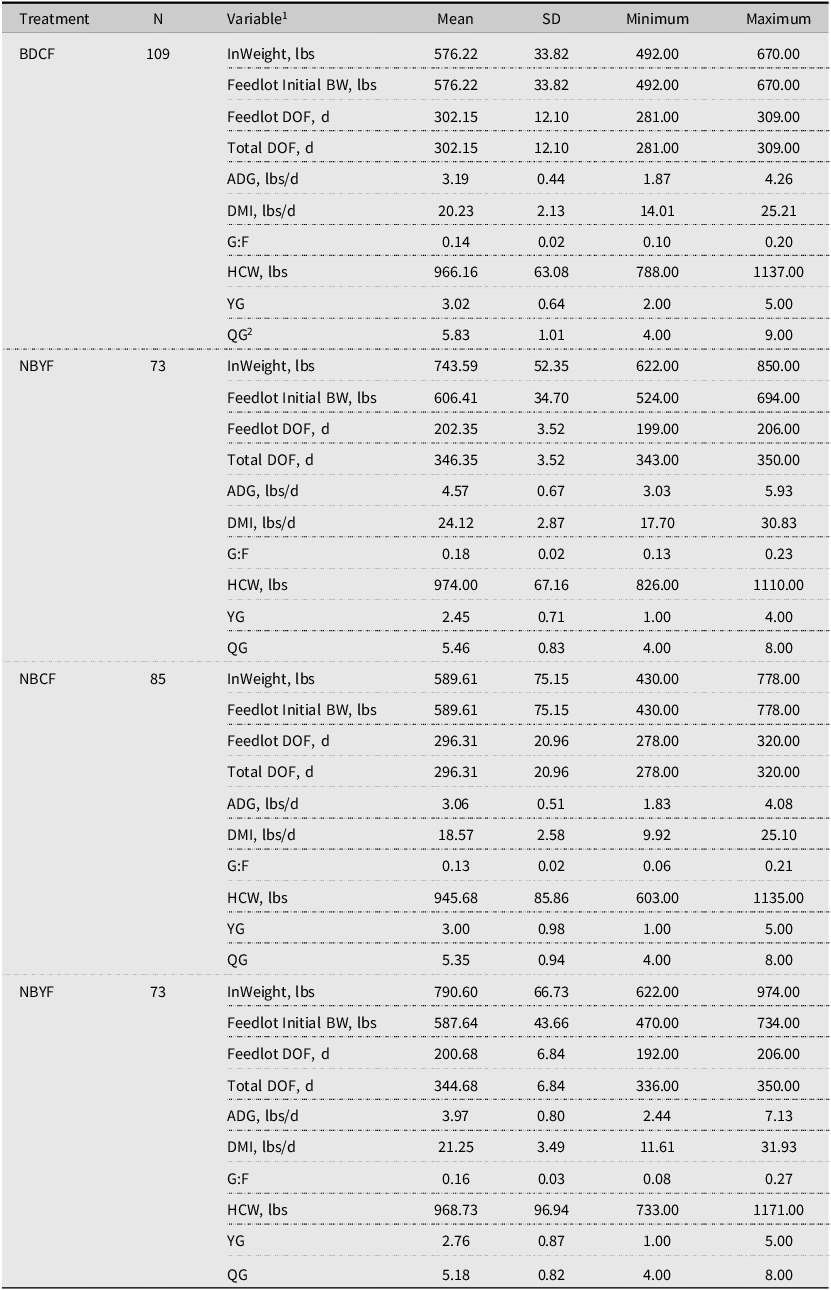
Table 2 Long description
The table presents summary statistics for four different breed system treatments: BDCF, NBYF, NBCF, and NBYF. It includes data on in-weight, feedlot initial body weight (BW), days on feed (DOF), average daily gain (ADG), dry matter intake (DMI), feed efficiency (G:F), hot carcass weight (HCW), USDA Quality Grade (QG), and Yield Grade (YG). The table has four main sections, each corresponding to a different treatment. Each section lists various variables with their mean, standard deviation (SD), minimum, and maximum values. For example, in the BDCF treatment, the in-weight ranges from 492.00 to 670.00 lbs with a mean of 576.22 lbs. The table provides a detailed comparison of these variables across the different treatments.
1 BW = bodyweight; DOF = days on feed; ADG = average daily gain; DMI = dry matter intake; G:F = gain-to-feed ratio; HCW = hot carcass weight; YG = USDA Yield Grade; QG = USDA Quality Grade.
2 Quality grades were based on 3 = USDA Standard+, 4 = USDA Select+, 5 = USDA Choice−, 6 = USDA Choice°, 7 = USDA Choice+, 8 = USDA Prime−, 9 = USDA Prime°, 10 = USDA Prime+.
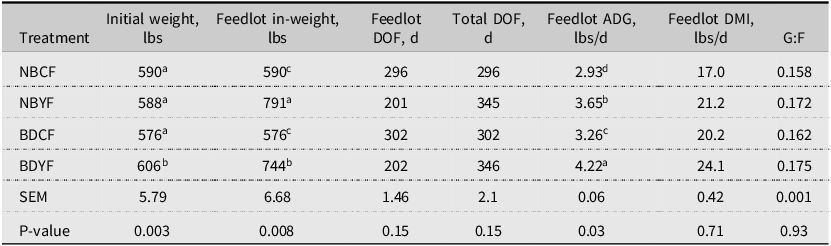
Average performance characteristics are given in Table 3. Initial weight prior to the start of the study was higher in BDCF steers compared to other systems by breed combinations. Feedlot in-weight was greatest for NBYF steers, followed by BDYF steers. Since the CF calves enter the feedlot at their initial weight, YF calves are expected to have greater feedlot receiving weight because of the 144-day grazing period before entering the feedlot. Feedlot DOF was greater in BD and CF steers. Total DOF, including the grazing period, YF calves had a longer DOF. Previous research between CF and YF systems indicates that feedlot ADG is greater for YF cattle, but feed efficiency typically favors CF systems (Anderson et al., Reference Anderson, Rasby, Klopfenstein and Clark2005). In the current study, however, BDYF steers had the highest ADG followed by NBYF, BDCF, and NBCF. Although YF steers consumed more feed (higher DMI), feed efficiency (G:F) did not differ significantly among treatments. In short, more weight gain in YF steers did not necessarily mean better feed efficiency.
Feedlot performance by breed × finishing system 1

Table 3 Long description
A table with 6 rows and 9 columns comparing feedlot performance by breed finishing system. The columns are labeled Treatment, Initial weight, Feedlot in-weight, Feedlot DOF, Total DOF, Feedlot ADG, Feedlot DMI, and G:F. The rows are labeled with different treatments: NBCF, NBYF, BDCF, BDYF, SEM, and P-value. Each row contains values corresponding to the columns. Notable trends include the highest initial weight for BDCF steers, the greatest feedlot in-weight for NBYF steers, and the highest feedlot ADG for BDYF steers. The table also includes standard error of the mean (SEM) and P-values for statistical significance.
1 NBCF = native beef calf-fed; NBYF = native beef yearling-fed; BDCF = beef × dairy calf-fed; BDYF = beef × dairy yearling-fed. SEM = standard error.
a,b,c,d Interaction effect and different superscripts differ at p ≤ 0.05.
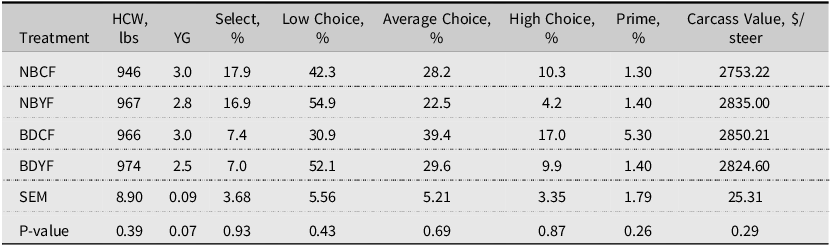
When evaluating carcass characteristics (Table 4), there were no statistically significant Breed × System interaction effects for HCW, YG, or carcass quality grades (p > 0.05). Numerically, HCW ranged from 946 lbs in NBCF steers to 974 lbs in BDYF steers. The percentage of Select carcasses was highest in NBCF (17.9%) and NBYF (16.9%) and lowest in BDYF (7.0%). Low choice carcasses were most prevalent in NBYF (54.9%) and least in BDCF (30.9%). NBCF had slightly more High Choice carcasses (10.3%) compared to BDYF (9.9%) and NBYF (4.2%). Prime grade carcasses were numerically highest in BDCF steers (5.30%). Overall, carcass value ranged from $2753.22/head in NBCF steers to $2850.21/head in BDCF steers. Despite numerical differences, there were no statistically significant interaction effects for carcass value (p = 0.29). BDCF steers had slightly higher carcass values (about $15–$100 more per head). To compare system returns, total production costs were considered, as shown in Table 5.
Average carcass traits

Table 4 Long description
The table presents data on carcass traits across different treatments. It has 6 rows and 9 columns. The columns are labeled as Treatment, HCW, lbs, Select, %, Low Choice, %, Average Choice, %, High Choice, %, Prime, %, and Carcass Value, $/steer. The rows are labeled as NBCF, NBYF, BDCF, BDYF, SEM, and P-value. Each row provides specific values for each column. For example, the NBCF row shows values like 946 lbs for HCW, 3.0 for YG, 17.9% for Select, 42.3% for Low Choice, 28.2% for Average Choice, 10.3% for High Choice, 1.30% for Prime, and $2753.22 for Carcass Value. The table also includes SEM and P-value rows for statistical analysis.
1NBCF = native beef calf-fed; NBYF = native beef yearling-fed; BDCF = beef × dairy calf-fed; BDYF = beef × dairy yearling-fed.
SEM = standard error.
a,b,c,dInteraction effect and those with different superscripts differ at p ≤ 0.05.
Average feed costs, feedlot COG, total COG, and return

Table 5 Long description
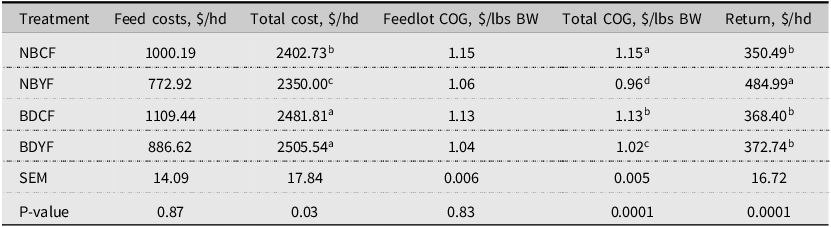
The table presents data on average feed costs, feedlot cost of goods (COG), total COG, and return for different treatments. It has five rows and six columns. The columns are labeled as Treatment, Feed costs, $/hd, Total cost, $/hd, Feedlot COG, $/lbs BW, Total COG, $/lbs BW, and Return, $/hd. The treatments listed are NBCF, NBYF, BDCF, and BDYF. Row 1: NBCF, Feed costs, 1000.19, Total cost, 2402.73, Feedlot COG, 1.15, Total COG, 1.15, Return, 350.49. Row 2: NBYF, Feed costs, 772.92, Total cost, 2350.00, Feedlot COG, 1.06, Total COG, 0.96, Return, 484.99. Row 3: BDCF, Feed costs, 1109.44, Total cost, 2481.81, Feedlot COG, 1.13, Total COG, 1.13, Return, 368.40. Row 4: BDYF, Feed costs, 886.62, Total cost, 2505.54, Feedlot COG, 1.04, Total COG, 1.02, Return, 372.74. The table also includes SEM and P-value rows with corresponding values.
1NBCF = native beef calf-fed; NBYF = native beef yearling-fed; BDCF = beef × dairy calf-fed; BDYF = beef × dairy yearling-fed. SEM = standard error.
a,b,c,d Interaction effect and those with different superscripts differ at p ≤ 0.05.
Table 5 presents the average feed costs, feedlot COG, total COG, and return. Feed costs were $111.47 per head lower for native beef steers and $225.04 per head lower for YF steers. Overall, total costs were greatest in BDYF and BDCF steers at $2503.63 per head and $2479.43 per head, respectively. The NBCF steers had an intermediate total cost, which was $103.05 per head lower than BDYF but $52.25 per head higher than NBYF. Steers in NBYF had the lowest cost at $2348.34 per head. Feedlot COG was $0.02/lb more expensive in NB steers and $0.09/lb less expensive in YF steers. Total COG was highest in NBCF steers at $1.15/lbs BW followed by BDCF, BDYF, and NBYF at $1.13/lbs BW, $1.02/lbs BW, and $0.96/lbs BW, respectively.
Table 5 shows that the total system net returns ranged from $350.49/ head to $484.99/head. NBCF, BDCF, and BDYF did not statistically differ in return per head. However, numerically, NBCF steers had a $17.91 lower return than BDCF and a $22.25 lower return than BDYF. NBYF steers had the largest return per head at $484.99, which was $112.25 per head greater than BDYF, $116.59 per head greater than BDCF, and $134.50 greater than NBCF. In short, NBYF steers had the highest economic return. These steers had the lowest total COG and total cost. While there was not an interaction in feed costs, NB and YF steers had lower feed costs, and feedlot COG was lower in YF steers, but BD steers had a lower feedlot COG. Carcass value was greatest in YF steers. Based on these results, BD steers were competitive with NB steers in the CF system, and NBCF had the lowest return, which corresponded with higher total cost and lower gain and efficiency. On the other hand, NBYF had the lowest total cost and improved gain and feed efficiency, resulting in the highest net return. Although the difference was not statistically significant, a $110 to $135 higher net return per head in NBYF steers can still have economic importance when applied to larger herds or feedlot operations.
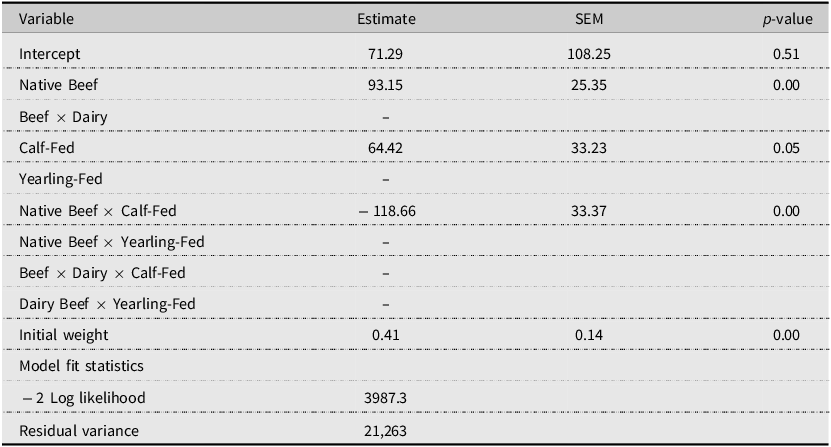
Regression results for return (equation (2)) by breed, finishing system, and their interactions are reported in Table 6. The coefficient for NB is the estimated impact of NDYF because of the interaction term NBCF. The result confirms the difference of least squares means in Table 5: NBYF is the highest returning system. Then again because of the interaction term, the coefficient on CF is the difference between BDCF and BDYF. The coefficient on initial weight was positive and statistically significant, meaning heavier calves at placement earned more returns. The most important results is the NB × CF of −$118.66. This shows that the NB economic advantage is more than offset when in the CF system by −$25.51 per head. Lastly, a one-pound increase in initial weight increases returns by $0.41 per head.
Regression results for return ($)

Table 6 Long description
A table with regression results for return in dollars. The table has 14 rows and 4 columns. The columns are labeled Variable, Estimate, SEM, and p-value. The rows list different variables and their corresponding estimates, standard errors of the mean (SEM), and p-values. The variables include Intercept, Native Beef, Beef x Dairy, Calf-Fed, Yearling-Fed, Native Beef x Calf-Fed, Native Beef x Yearling-Fed, Beef x Dairy x Calf-Fed, Dairy Beef x Yearling-Fed, and Initial weight. Model fit statistics include -2 Log likelihood and Residual variance.
While BD calves had greater feed efficiency, they also consumed more, increasing their feed costs. They had a heavier carcass weight, improved average USDA quality grade, and higher carcass value. So, gross returns for NBCF and BDCF were similar. The BD higher cost of gain, though, decreased their net return in comparison to NBYF. The NBCF steers had the lowest net return as they had the lowest carcass value. This is due to these calves having the lowest ADG, leading to 20-pound lighter HCW. YF systems from weaning to slaughter typically have lower breakeven prices and higher net profits (Sindt et al., 1991). Hot carcass weight is the most influential driver of carcass value per head and indicates heavier carcasses have increased profitability (Tatum et al., Reference Tatum, Belk, Field, Scanga and Smith2006). In our study, carcass value was higher in YF steers and BD steers. Furthermore, HCW was higher in YF calves and BD calves by 15 pounds and 13 pounds, respectively.
Small and Mark (Reference Small and Mark2008) reported that average returns (1996–2007) of the CF and YF systems were $18.54 per head and $14.33/ per head, with highly variable returns ranging from −$177 to $347 per head. When steers were either adapted to a finishing diet following weaning or fed a grower-ration diet for 76 days before the finishing phase, there were no differences in returns. But in comparison to the current study, CF steers had greater returns than the CF in Gardine et al. (Reference Gardine, Boyd, Bittner, Hilscher, Erickson, Jenkins, Klopfenstein and Watson2019), which was $110.08 per head. Furthermore, steers fed the grower diet in Gardine et al. (Reference Gardine, Boyd, Bittner, Hilscher, Erickson, Jenkins, Klopfenstein and Watson2019) had smaller returns than both YF systems in the current study by at $25.88 per head. Furthermore, Iowa State University Extension and Outreach reports returns ranging from $104.40 to $299.67/ per head for YF steers from January 2025 to March 2025, and for steers in general, the returns range from $177.35 to $204.60 for January to March 2025 (Iowa State University, 2025). The returns in the current study are all greater than those recorded by Iowa State University.
6. Conclusions and implications
The differences in profitability between native beef and dairy beef calves were investigated due to post-weaning management systems. Using costs and data provided from a finishing trial, return for breed and system combinations was estimated. Carcass value, feed costs, and opportunity costs of investment, feed, yardage, and vet were calculated. Returns were computed by breed and system, resulting in four breed × system returns.
Native beef YF steers had the greatest return on a per head basis across the four combinations. This combination had the lowest total costs and similar revenue (Table 5) to other combinations. Beef × dairy steers also had a greater ADG, DMI, and feed efficiency which increased their feed costs. In net, beef × dairy calves, regardless of system, had intermediate returns to NBYF and NBCF. Higher feed costs were partially offset by fewer USDA Select Grade carcasses. Our results, for this set of cattle and environment, showed that BD calves can compete with NBCF steers but are outperformed by NBYF steers. Market prices for BD calves appear to be efficient in CF situations. Where grazing opportunities are present, current market prices suggest that NBYF calves will outperform CF systems. However, the opportunity cost of grazing calves, that is the return from cow-calf production, needs to be considered before it is possible to determine the economic advisability of NBCF systems. Further, a longer series of outcomes should be evaluated.
A caution is needed regarding sample size: our data were from one environment and one set of calves. Native beef and beef × dairy steers can perform better or worse from one year to the next depending on many different factors, like weather, forage quality, and DOF. For example, Schmaltz et al. (Reference Schmaltz, Schroeder, Walter and Hutcheson2024) saw a decrease in net returns in BD heifers as DOF increased. Data from more than one season is necessary to fully weigh the economic merits of beef × dairy steers in different post-weaning management systems. Genetics are also critically important in determining returns (DeVuyst et al., Reference DeVuyst, Bullinger, Bauer, Berg and Larson2007, Reference DeVuyst, Biermacher, Lusk, Mateescu, Blanton, Swigert, Cook and Reuter2011; Thompson et al., Reference Thompson, DeVuyst, Brorsen and Lusk2014). It is possible, even likely, that NB cattle in more moderate climates will have less Brahman influence than the NB calves in this study. Taurine cattle have better carcass traits, so the differences in net returns relative to beef × dairy calves will differ from our findings.
Data availability statement
Data posted at https://data.mendeley.com/datasets/rn6g436yx2/2. Beck, Paul; DeVuyst, Eric (2025), “Impact of Management of Composite Dairy × Beef Crossbreds On Economic And Environmental Sustainability of Beef Production,” Mendeley Data, V2, https://doi.org/10.17632/rn6g436yx2.2.
Author contribution
Conceptionalization: AG, EAD, PB; Data curation: AG, PB; Formal analysis: AG, EAD, RR, PB; Funding acquisition: EAD, PB; Investigation: AG, EAD, RR, PB; Methodology: AG, EAD, PB; Project administration: EAD, PB; Resources: EAD, PB; Software: AG, EAD, RR; Visualization: AG, EAD, PB; Writing original draft: AG, EAD, PB; Writing reviewing and editing: EAD, RR.
Financial support
This research was sponsored in part by the intramural research program of the U.S. Department of Agriculture, National Institute of Food and Agriculture Critical Agricultural Research and Extension Award No. 2022-68008-37102. The findings and conclusions in the manuscript have not been formally disseminated by the U.S. Department of Agriculture and should not be construed to represent any agency determination or policy.
Competing interests
The authors have no competing interests to declare.
Ethical standard
AI was not used to complete any part of this research and manuscript.


 Open access