


Introduction
La Crosse virus (LACV) was first isolated in 1964 from the brain tissue of a 4-year-old girl diagnosed with ‘rural encephalitis’ in La Crosse, Wisconsin, USA in 1960 [Reference McJunkin1–Reference Thompson, Kalfayan and Anslow3]. It is an arbovirus from the family Bunyaviridae, genus Orthobunyavirus and a member of the California encephalitis serogroup viruses. For humans, LACV is considered the most pathogenic of the California encephalitis serogroup viruses and is the second most commonly reported mosquito-borne disease in North America after West Nile Virus [Reference McJunkin1, Reference Teleron4–Reference Leisnham and Juliano6].
Mosquitoes are the primary vector of LACV and Aedes triseriatus, the tree-hole mosquito, has consistently been implicated in LACV transmission [Reference Sutherland2, Reference Teleron4]. During the past 25 years Aedes albopictus and Aedes japonicas, competent vectors of LACV under experimental conditions, have emerged in North America, however, evidence on their role in LACV transmission is conflicting [Reference Sutherland2, Reference Bewick7]. LACV predominately circulates east of the Rocky Mountains in hardwood forests between mosquitoes and small mammals with occasional human exposure [Reference Sutherland2, 5, Reference Camille Harris8, Reference Goddard9]. Humans are considered incidental and dead-end hosts for LACV and rarely acquire a sufficient dose of LACV from mosquito bites to develop an infection [Reference Sutherland2, 5, Reference Goddard9]. While it is widely acknowledged that climate change will impact vector-borne diseases as a result of the temperature dependency of pathogens and their vectors, factors such as the competition between mosquito species, as well as the geographic variation of abiotic and biotic environmental factors make it difficult to directly assess the impact of climate change on the burden or emergence of LACV [Reference Leisnham and Juliano6].
Annually the Centre for Disease Control and Prevention (CDC) reports a variable number of human LACV cases, 30–130, per year in the USA [10]. This case count likely represents only severe clinical cases of LACV [10], of which the majority (>90%) are children under age 16 [Reference Sutherland2, Reference Teleron4, Reference Tsai11]. Clinical disease onset ranges from 5 to 15 days post exposure [Reference Sutherland2, 5]. Symptoms can include fever, headache, myalgia, malaise and occasional prostration [5]. Severe cases can lead to encephalitis and result in significant lifelong neurological sequelae or death in rare cases (<1% of cases) [5, Reference Leisnham and Juliano6]. Currently, there is no specific treatment or preventative vaccine for LACV in humans and long-term sequelae represent a substantial health and economic burden, with an estimated average cost of over 3 million dollars per patient [Reference McJunkin1, Reference Sutherland2, Reference Byrd12–Reference Utz14].
LACV has been a public health issue in the mid-western USA over several decades and more recently in the mid-Atlantic regions of the USA with periodic outbreaks in non-endemic regions [Reference Sutherland2, Reference Leisnham and Juliano6]. Due to the severity of symptoms and the potential for climate change to affect (expand or change) the suitable habitats of the vectors and hosts involved in the LACV epizootic cycle, a scoping review (ScR) of the LACV literature was prioritised to support evidence-based decision-making activities with respect to the current and future public health impact of LACV. A ScR is a knowledge synthesis method that aims to summarise all available evidence on a topic to identify well-researched areas and research gaps and is often conducted in response to a policy-driven research question [Reference Arksey and O'Malley15, Reference Pham16]. To the best of our knowledge, no ScR has been previously conducted on this topic.
Materials and methods
ScR team and protocol
The ScR team consisted of eight individuals with multi-disciplinary expertise in the fields of epidemiology, microbiology, zoonotic diseases, knowledge synthesis and/or public health. Additional topic insight was sought from LACV experts within the National Microbiology Laboratory at the Public Health Agency of Canada.
The protocol was developed a priori to ensure that results were transparent, consistent and reproducible. A copy of the protocol which includes the search strategy, the citation relevance screening tool, the data characterisation tool and all project management details can be found in S1. A list of the relevant articles identified in this ScR can be found in S2 and more detailed summaries of key aspects of LACV research and references associated with major categories of research are available in S3–S13. All supplementary material is available online on the Cambridge Core website.
Review question and scope
Using the PICOs (population, intervention, comparison, outcomes) framework [Reference Higgins and Green17], the research question is: What is the current state of global evidence for LACV including infection in humans, vectors and animal reservoirs? The populations of interest included studies on LACV, humans, vectors and animal reservoirs. No restrictions were placed on the interventions, exposures or comparisons. All direct (e.g. virus isolation, serology, molecular virus identification) and indirect (e.g. knowledge, perception or costs) LACV outcomes were considered relevant.
Search strategy
A comprehensive search was conducted on 30 November 2016 in the following databases: PubMed, Scopus, Agricola, CAB, Embase, ProQuest and the Cochrane Central Register of Controlled Trials. Article abstracts, titles and keywords were searched using the pretested search algorithm: (‘La Crosse’ OR ‘La Crosse’) AND (encephalitis OR virus). No other limits were placed on the search.
To verify that the electronic search captured all relevant primary research, the reference lists from eight reviews (S1) included at the relevance screening stage were hand searched. References were prioritised for addition to the ScR if the title included ‘La Crosse’. A grey literature search conducted on 9–10 January 2017 included searching the CDC website to identify the country and state reports with probable or confirmed cases of LACV encephalitis (data available 2004–2013) [10]. US state department websites with identified cases were hand searched for primary research reports, surveillance bulletins and reports, or epidemiological alerts that were not already captured. Reports were excluded if they only reported California serogroup virus or California encephalitis.
Relevance screening and inclusion criteria
A relevance screening form was developed a priori to screen the titles, abstracts and keywords of the captured citations. Primary research was considered relevant if the study focused on one or more aspects of the research question. Primary research was defined as original research reporting data that the authors generated themselves. No restrictions were placed on study location or date. Only articles in English and French were included; articles in other languages were identified but were not included due to a lack of available resources. Full-text documents were procured for potentially relevant citations.
Data characterisation
A data characterisation and utility (DCU) form was developed a priori and consisted of up to 73 questions depending on the article's research focus. The questions confirmed the article's relevance and then captured information about study design, populations, interventions, epidemiology of the virus, risk factors, the burden of disease or infection, pathology of disease, treatment, diagnosis, laboratory tests and outcome characteristics.
ScR management and data analysis
All citations identified by the search strategy were uploaded into reference management software (RefWorks 2.0; ProQuest LLC, Bethesda, Maryland, USA) and de-duplicated. The citations were then uploaded to an online systematic review management program (Distiller SR, Evidence Partners, Ottawa, Canada) for additional de-duplication, followed by relevance screening and data characterisation which were completed by two independent reviewers. Conflicts were resolved by consensus or by a third reviewer. All data collected by the DCU were exported as Excel spreadsheets (Excel 2010, Microsoft Corp., USA) for data cleaning, formatting and descriptive data analysis.
Results
ScR descriptive statistics
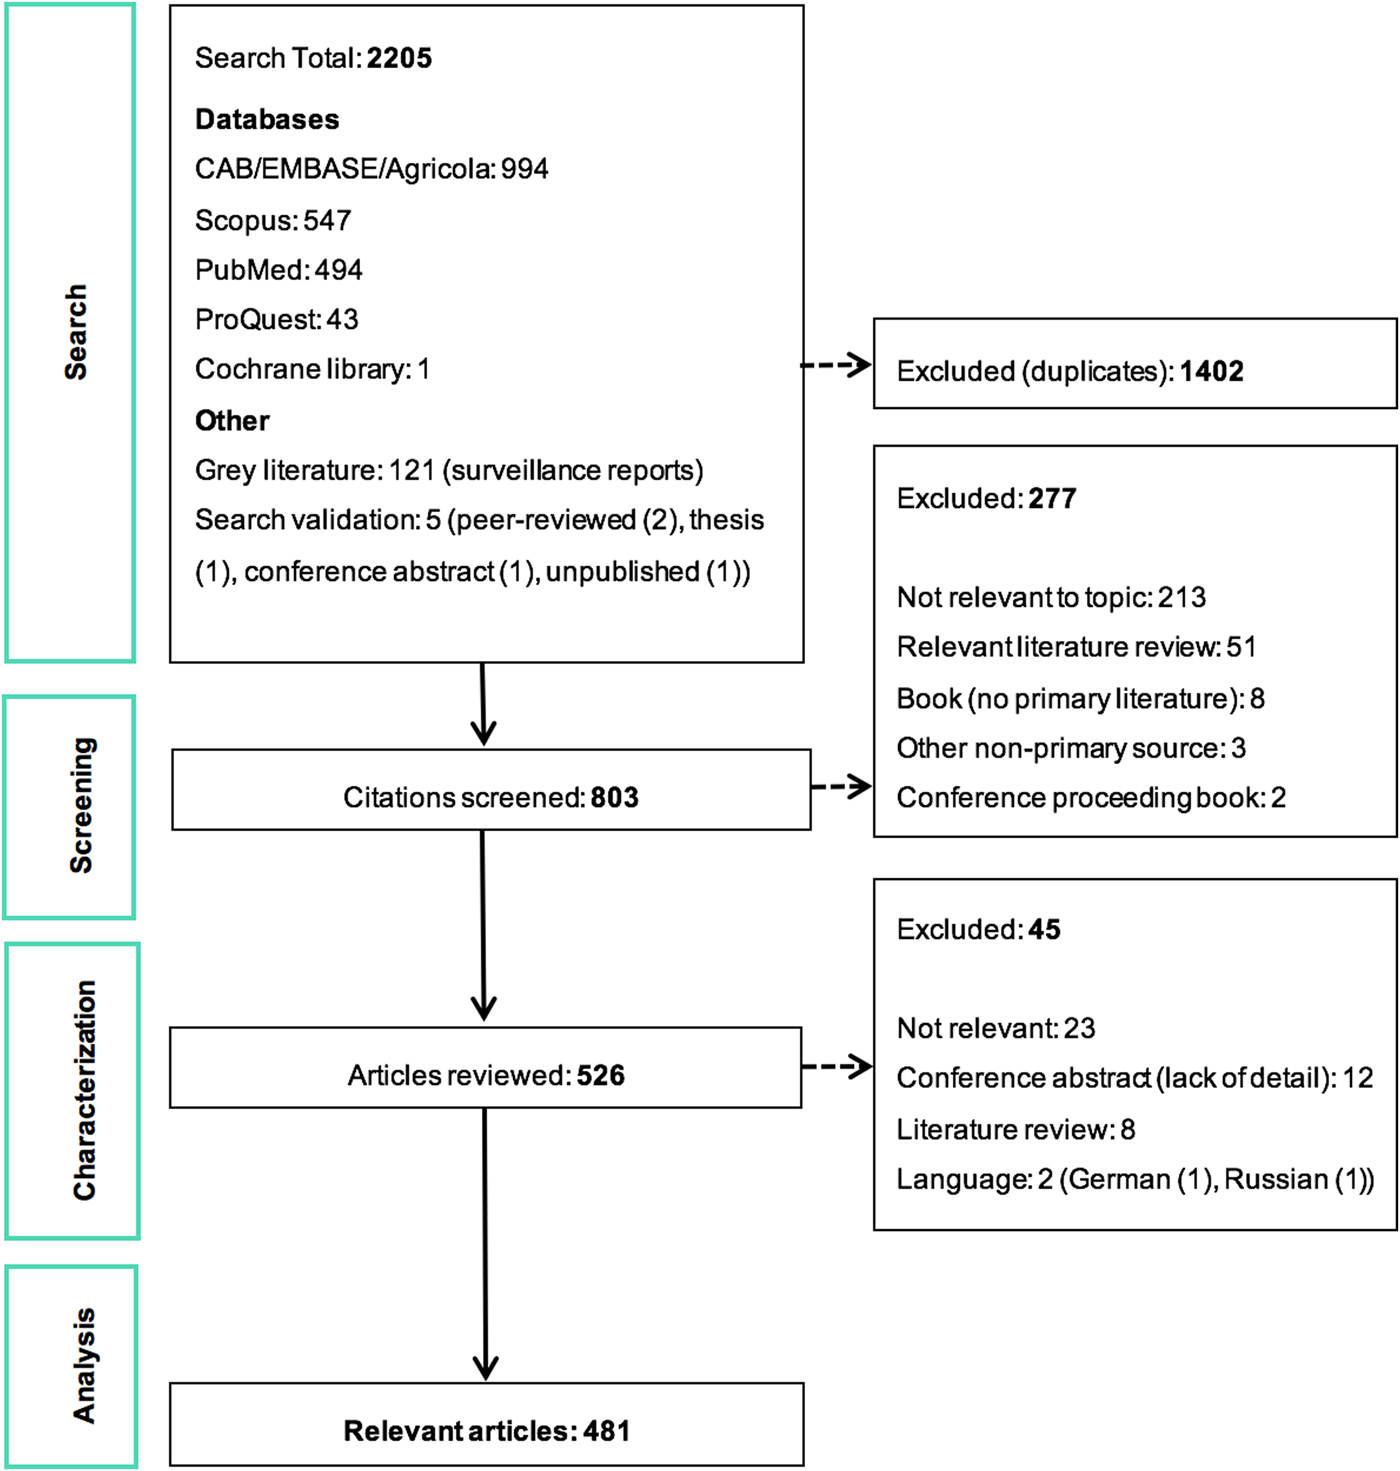
The ScR summarises 481 relevant articles (Fig. 1) in English, which were mainly reported from North America (n = 437), specifically the USA (n = 435). The 43 studies from Europe examined LACV under experimental conditions (53.5%, 23/43) or conducted molecular characterisation of the virus (58.1%, 25/43). One additional study included samples from Costa Rica, but no LACV was identified. Included studies were mostly journal articles (78.2%, 376/481) or grey literature reporting surveillance data (18.7%, 90/481) (S3). Publication of research on LACV has been constant since the late 1960s, with an even split between observational (45.9%, 220/481) and experimental research (50.2%, 242/481). Each population category was well represented: humans (36.3%, 174/481), vectors (31.8%, 153/481), animal hosts (22.2%, 107/481) and in vitro studies on LACV (30.4%, 146/481) (Table 1). Notably, few articles focused on social impacts, economics and prevention and treatment strategies. The most common study focus was epidemiology (45.0%, 216/481), followed by in vitro research on LACV (25.8%, 124/481), transmission (18.7%, 90/481) and pathogenesis (18.5%, 89/481) amongst vectors and hosts, Table 1.
PRISMA flow diagram of the citations and articles throughout the scoping review process.
A heat chart of the La Crosse Virus (LACV) literature by study focus and population category
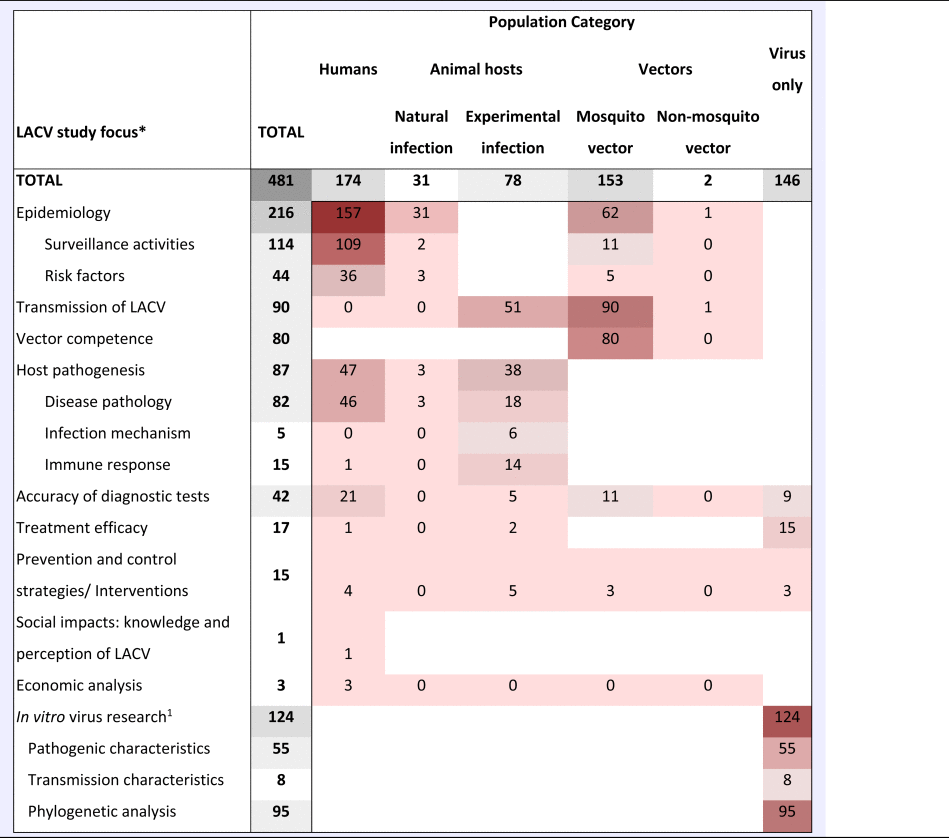
Heat scale is a gradient from lowest number of studies (light) to the highest number of studies (dark); Blank cells, indicate that research in this category is unlikely, whereas zero indicates no research was identified but is possible.
aIn vitro LACV research included studies that only examined the virus itself. This could include pathogenesis, transmission and diagnostic test accuracy studies using only virus cell cultures.
LACV In vitro research
Many in vitro studies (n = 124) were captured that investigated the molecular and virulence traits of LACV to understand why LACV pathogenicity in humans, Table 1. Most of this research was published prior to 2000 (68.5%, 85/124) and focused on pathogenic markers that control the replication of LACV (44.4%, 55/124), virus genetic determinants for transmission (6.5%, 8/124) and molecular characterisation that largely described partial or full genetic sequences of LACV, as well as genotype differences in isolates, the evolution of LACV and/or phylogenetic analyses (76.6%, 95/124).
Studies with phylogenetic analyses focused on comparisons between other Bunyaviridae viruses, California serogroup viruses and LACV isolates from different populations, times and geographies. Eight studies classified as having some molecular epidemiological outcomes examined differences in genetic sequences of isolates in relation to date and place of collection, host attributes and severity of disease (S4). The most recent papers proposed three separate lineages of LACV with overlapping geography. Studies of human isolates suggest that LACV lineage 1 is associated with the most severe and fatal human cases; mosquito isolates captured in the same geographic region and time as human cases shared a high degree of genetic similarity to the human isolates. LACV was shown to be fairly genetically stable over time despite studies showing reassortment and mixing of the LACV genome within mosquitos is common. Genetic bottlenecks or the inability of the reassortments to transmit between different host and vectors likely explain why LACV appears to be fairly stable (S4).
LACV in vectors
Fifty-six species of mosquitoes and seven species of other insect vectors (S5) were studied in 154 experimental and observational studies, Table 1. The most common mosquito species studied were Ae. triseriatus (85.1%, 131/154), Ae. albopictus (21.4%, 33/154), Ae. japonicus (9.1%, 14/154), Ae. hendersoni (8.4%, 13/154), Ae. vexans (8.4%, 13/154) and Ae. trivittatus (7.1%, 11/154). With the exception of Ae. vexans, naturally acquired LACV was reported in one or more studies from the USA for the aforementioned mosquito species as well as Ae. canadensis, Ae. communis, Ae. informatus, Culex pipiens/restuans and Orthopodomyia signifera (S5).
Five studies examined the risk factors associated with LACV infection in mosquitoes (Table 2). Significant risk factors included certain geographic hot spots in eastern and central USA, increased chipmunk or ground cover density and an increase in the risk of LACV positive mosquito pools during the month of August compared with July (S4).
The number of articles reporting risk factors for La Crosse virus (LACV) studied in human (N = 36), animal (N = 3) and vector (N = 5) populations
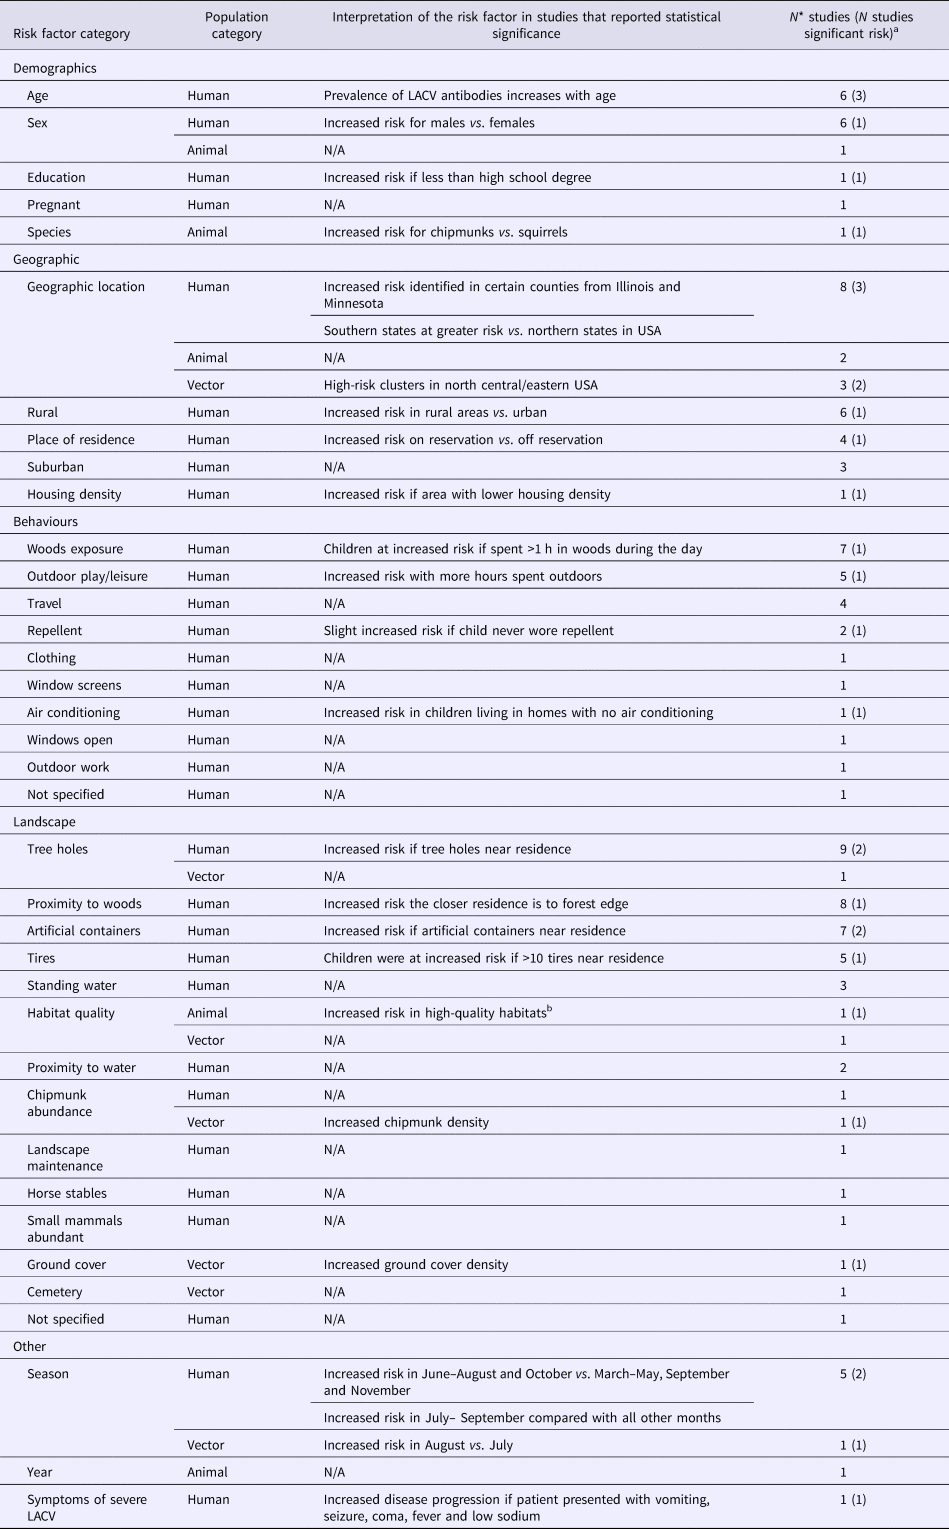
N/A, Not applicable no studies reported statistically significant findings for this risk factor category.
a Number of studies that report a statistically significant (P < 0.05) association between the risk factor and LACV infection, references available in S4.
b High-quality habitats defined by defined by rolling terrain, dense coverage by oaks trees and good food and water availability.
*Total may not add to 100% as studies may have reported results for multiple population and risk factor categories.
Under experimental conditions, 18.7% (90/481) of the included studies examined transmission dynamics. Host-to-vector transmission was successfully shown in nine studies using chipmunks (n = 5), hamsters (n = 1), mice (n = 2), dogs (n = 1) and foxes (n = 1) as the viremic animal hosts to provide mosquito species, predominantly Ae. triseriatus, with an infected blood meal (S4). Other studies included Ae. canadensis fed on viremic mice, A. japonicas fed on viremic hamsters and Ae. albopictus and Ae. hendersoni fed on viremic chipmunks. Viremic white-tailed deer failed to transmit LACV to Ae. triseriatus mosquito vectors.
Vector-to-host transmission studies accounted for 45.6% (41/90) of the included transmission studies. Successful transmission was demonstrated between Ae. triseriatus and mice (68.3%, 28/41), chipmunks (17.1%, 7/41), red foxes (2.4%, 1/41), opossums (2.4%, 1/41), gerbils (2.4%, 1/41), hamsters (2.4%, 1/41), deer (2.4%, 1/41), rabbits (2.4%, 1/41) and squirrels (2.4%, 1/41) (S4). Successful transmission to mice was also demonstrated with Ae. hendersoni (14.6%, 6/41), Ae. zoosophus (4.9%, 2/41), Ae. brelandi (4.9%, 2/41), Ae. canadensis (4.9%, 2/41), Ae. albopictus (4.9%, 2/41), Ae. vexans (2.4%, 1/41), Ae. aegypti (2.4%, 1/41), Cs. inornata (2.4%, 1/41), Ae. atropalpus (2.4%, 1/41); between hamsters and Ae. japonicas (2.4%, 1/41); and transmission to chipmunks from Ae. canadensis (2.4%, 1/41) and Ae. albopictus (2.4%, 1/41).
Outcomes of vector competence were reported in 80 studies (S6) including infection rates (78.8%, 63/80), dissemination rates (35%, 28/80) and/or transmission rates (52.5%, 42/80) for Ae. triseriatus (91.3%, 73/80), Ae. albopictus (13.8%, 11/80), Ae. hendersoni (10.0%, 8/80), Ae. japonicus (7.5%, 6/80) and Ae. aegypti (3.8%, 3/80). Fewer studies reported other vector competence outcomes including the impact of LACV infection in mosquitos on reproduction (10%, 8/80), survival rates (7.5%, 6/80) and body size (7.5%, 6/80) (S6). The impact of LACV infection on vector behaviour (15%, 12/80) was reported for Ae. triseriatus (n = 11), Ae. albopictus (n = 5), Ae. hendersoni (n = 2) and Ae. japonicus (n = 1) (S4). The studied behaviours included probing (n = 4), feeding success or size (n = 5), blood meal preferences (n = 2), diapause (period of arrested development in response to environmental conditions) (n = 2), grooming (n = 1) and time of feeding (n = 1). Four studies reported the impact of dual viral infections in Ae. triseriatus mosquitoes with LACV and LACV mutants and Tahyna, West Nile and trivittatus viruses (S4). Non-mosquito vectors were examined in two studies (S5); one found LACV in a single horse fly (Hybomitra lasiophthalma) sample, but not in other horse or deer flies. The competence of horse or deer flies as vectors of LACV has not been evaluated. The second study demonstrated fruit flies (Drosophila melanogaster) are not competent vectors of LACV.
LACV in animals
Twenty-nine studies sampled animals in LACV affected areas of the USA to determine exposure to LACV (29/481), or identify LACV (3/481). An additional two studies sampled rabbits and sloths from Canada and Costa Rica, respectively, but no LACV antibodies were found (Table 3). The most commonly studied animals were chipmunks, deer, rabbits and squirrels, which were reported to be part of the LACV sylvatic cycle along with red foxes and woodchucks in one or more studies. Those hosts, as well as raccoons, horses, cows, pigs and dogs, tested positive for LACV antibodies (Table 3). LACV isolation was only successful for chipmunks and squirrels (S4). Animals in which no LACV antibodies were found and no virus was isolated included opossums, grouse, muskrats, rats, cats, goats, elk, moose, sloths and swans (Table 3).
The number and percent of observational studies that examine animal hosts for natural exposure to and/or infection with La Crosse virus (LACV) in the literature (N = 31)
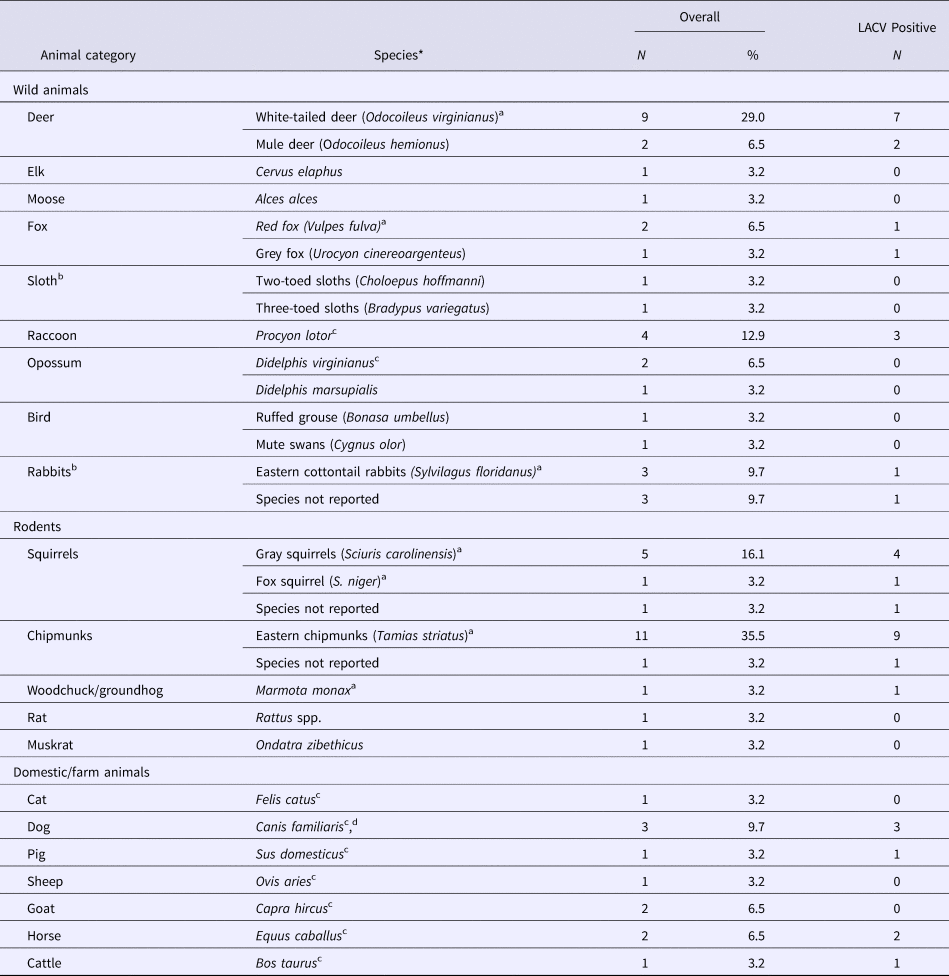
N/A, Not applicable as the study did not report any LACV positive samples.
a Species indicated by the author to be part of the sylvatic cycle.
b All samples were collected from the USA except for one study that sampled rabbits from Canada and one study that sampled sloths from Costa Rica, both did not find evidence of LACV exposure.
c Species indicated by the author to be dead-end host.
d Species indicated by the author to suffer from clinical LACV infection.
*All animals were tested for LACV using antigen-antibody assays. Three studies used viral isolation methods to detect LACV in gray squirrels (S. carolinensis) and eastern chipmunks (T. striatus) (S4).
Risk factors for the detection of LACV infection or exposure in animals were reported in three studies (Table 2), of which only habitat quality and animal species were significant factors. Specifically, chipmunks were determined to be at an increased risk of being LACV positive compared with squirrels and were at a greater risk of infection in high-quality habitats (defined by rolling terrain, dense coverage by oak trees and good food/water availability) (S4).
Mice (82.1%, 64/78) and chipmunks (15.4%, 12/78) were commonly used in animal models of LACV infection (Table 4), of which 43 studies focused on LACV pathogenesis and pathology. Estimates of the incubation and viremic period (20/43) for several species (S7) varied by age group, viral dose and mode of administration of the challenge dose (infected mosquitoes, oral inoculation, or injection into various target sites). Other reported outcomes included infectivity of LACV field strains (32.6%, 14/43), recombinant/reassorted viruses (14.0%, 6/43), survival time and mortality rate (27.9%, 12/43) and viral replication (2.3%, 1/43). Infection mechanisms of LACV in mice (11.6%, 5/43) and immune responses in mice (25.6%, 11/43), deer (4.7%, 2/43), chipmunks (2.3%, 1/43) and rabbits (2.3%, 1/43) were also reported. Studies examining host-to-vector and vector-to-host transmission characteristics were described above under the sub-heading LACV in Vectors. The host-to-host transmission was reported in one study that demonstrated LACV transmission from chipmunks to red foxes via natural predation under laboratory conditions (S4).
The number and percent of articles examining experimental animal models of La Crosse virus (LACV) infection across different study foci (N = 78)
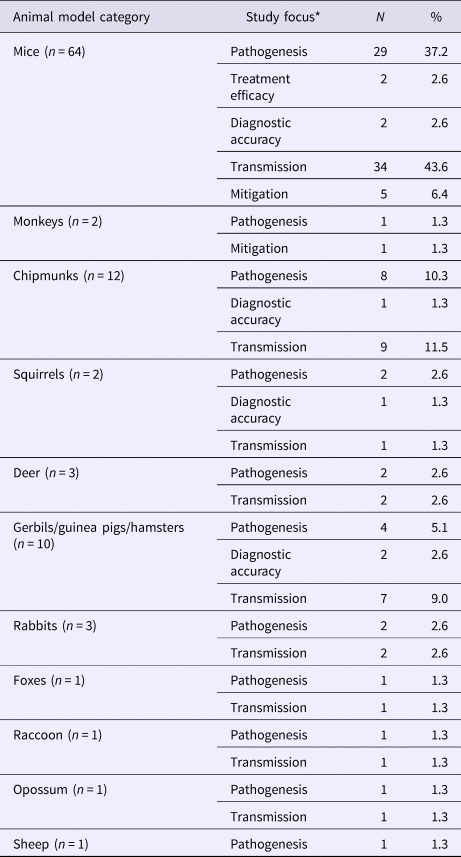
*Total may not add to 100% as a single study may contain results for more than one species and several focus areas.
Clinical signs, symptoms and sequelae of LACV were reported in 21 studies for a variety of animal hosts (S8). Reported impairments for mice, gerbils, dogs and chipmunks were predominantly neurological (85.7%, 18/21). Other impairments included weight loss, respiratory problems and anorexia observed in rabbits, deer, mice and dogs.
LACV in humans
All LACV articles reporting on humans, 36.2% (174/481) were from the USA, Table 1. The majority were surveillance reports (65.1%, 113/174) or case series (15.4%, 27/174). Approximately half the studies did not report the sample (57.7%, 101/174) or diagnostic test (49.7%, 87/174) used for LACV testing in humans (S9). Where reported, immunoassay of blood samples was most common: 97.2% (71/73) blood, 20.5% (15/73) cerebrospinal fluid (CSF) and 13.7% (10/73) tissue samples. Diagnostic tests were most commonly antigen-antibody assays (97.7%, 86/88), while few studies employed viral isolation (6.8%, 6/88) and molecular tests (6.8%, 6/88) (S9).
Reports on surveillance of LACV in humans comprised 69.4% (109/157) of the epidemiological literature. Human case surveillance activities were mainly based on state programmes (91.2%, 102/109) capturing infectious disease occurrence. National USA data (8.3%, 9/109) was derived from nationally aggregated state data. Many programmes reported the on-going collection of reportable disease cases from physicians (67.8%, 74/109) and/or laboratories (81.7%, 89/109) to state-level public health authorities who, since 2003, have reported LACV cases and other arbovirus cases to the national reporting system, ArboNET [Reference Haddow and Odoi18].
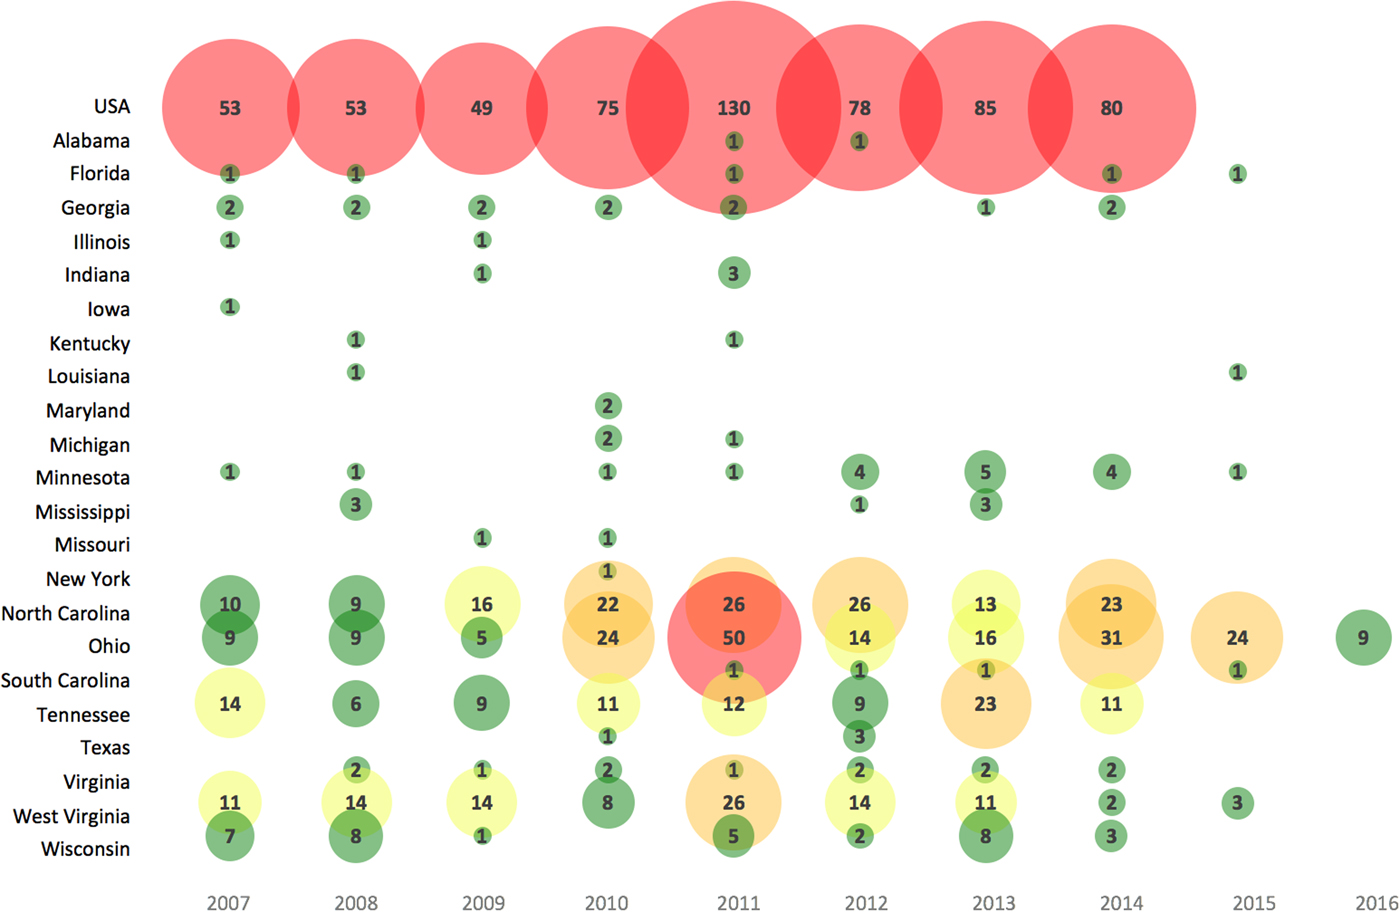
Annual LACV incidence (per 100 000) in affected areas across the USA were reported in 147 studies and ranged from 0.004 to 1.6 cases for the general population (1963–2016) and higher for children under 19 years (range 0.09–2.27 cases per 100 000) (S10). Most reported cases (91%) had the neuroinvasive disease. The number of LACV cases reported varied in recent years across the USA (Fig. 2), as well as among different target populations (S10).
Bubble chart of the number of human cases of LACV reported in recent years (2007–2016) across affected states in the USA. Note: Case data obtained from a subset of studies from S10 reporting the most reliable data (e.g. CDC available until 2014) and the highest number of LACV cases; a lack of case count for a state after 2014 may represent zero case counts, unreported or unavailable data. Bubble size is proportional to the number of LACV cases. The color gradient is shaded such that green = 1–10 LACV cases, yellow = 11–20 LACV cases, orange = 21–40 LACV cases and red ⩾41 LACV cases per year.
A tally of sporadic human cases reported in 128 studies, after discounting duplicate information, summed to approximately 960 confirmed, 199 probable and 1983 unspecified LACV cases reported from 23 eastern and central states during 1963–2016. For cases where age or age category was available (n = 61), data indicated that 92.9% of confirmed sporadic cases occurred in children under 19 years, which agrees with the 90% of cases being less than 16-years-old reported elsewhere [5, Reference Tsai11, Reference Gaensbauer19]. Case fatality was available in 29 publications and occurred in 1.3% (26/2062) of clinical cases (S4). Details about hospitalisations were often omitted from surveillance reports, however in 29 publications, 95.8% (1087/1135) of the clinical LACV cases were hospitalised and 53% (93/174) required intensive care (S4).
Severe LACV disease often presents as a central nervous system (CNS) infection or encephalitis. Among eight studies that investigated LACV as a cause of unexplained CNS dysfunction or encephalitis cases, 5.5–13.4% of CNS infections and 4.1–38.8% of encephalitis cases were LACV positive (S11). Five of these studies only tested for LACV during the summer months when arboviruses are in circulation. The remaining three papers are sequential updates of the Tennessee Unexplained Encephalitis study, which collected data year-round and attempted to attribute cases of unexplained encephalitis to an infectious agent. Based on the results up to 2008, LACV was the leading virus causing unexplained encephalitis [Reference Cooper, Taylor and Jones20].
Seroprevalence data for LACV in humans obtained from 1965 to 2010 were reported in 12 studies from seven eastern and central states in the USA (S12). Seroprevalence in the general population varied from 0.01% to 17.7% across studies. Children had a lower level of seropositivity in three studies while children with developmental delays had a slightly higher seroprevalence in two studies compared with the general population (S12). Three studies examined the seroprevalence of LACV in outdoor occupational groups: 22.7% in the Great Smoky Mountains national park employees and 12.2% in outdoor workers in Texas. Overall, these results are fragmented, but some level of exposure (seropositivity) was determined in endemic areas for all sampling frames.
The clinical signs and symptoms of human LACV infection were reported in 46/174 studies (S13). Generally, the literature reports severe cases of LACV with a wide range of symptoms mostly not specific to LACV infection: fever (65.2%, 30/46), headache (58.7%, 27/46), encephalopathy (56.5%, 26/46), seizures (54.3%, 25/46), vomiting (47.8%, 22/46) and focal neurological deficits related to muscle/mobility (58.7%, 27/46) and altered mental status (54.3%, 25/46). Reported complications from infection included unspecified neurological sequelae (6.9%, 12/174), behavioural issues (4.0%, 7/174), seizures (1.7%, 3/174), coma (1.1%, 2/174), abnormal brain wave patterns (1.7%, 3/174) and brain herniation (0.6%, 1/174). Pathogenesis of LACV in humans was assessed in 18 studies (S4).
Risk factors for acquiring human LACV infection were evaluated in 36 studies (Table 2). LACV cases were shown to be spatially clustered in affected areas (S4), which is also supported by statistically significant risk factors related to the environment within which a person lives. For example, the risk of severe LACV infection increased if a person's residence was close to a forest edge, contained artificial containers, tree holes or >10 tires. La Crosse infection risk was increased during June to September, for males, when more than 1 hour per day was spent in the woods when less than a high school level education was achieved and/or for rural residence (S4). No epidemiological data supported the hypothesis that the most severe and fatal LACV cases may be associated with lineage I, identified in four fatal cases (S4).
Diagnostic test accuracy
Diagnostic test accuracy for LACV was evaluated in 42 studies; humans (50.0%, 21/42), animals (11.9%, 5/42), mosquitoes (26.2%, 11/42) and in vitro cell cultures (21.4%, 9/42). Most of the human studies examined antigen-antibody tests including plaque reduction neutralisation tests (PRNT) (57.1%, 12/21), hemagglutination inhibition (HI) (47.6%, 10/21), complementation fixation (CF) (33.3%, 7/21) and unspecified IgG assays (28.6%, 6/21) and IgM assays (38.1%, 8/21) (S4). Other antigen-antibody tests evaluated for accuracy were immunodiffusion (ID) (9.5%, 2/21), counter immunoelectrophoresis (19.0%, 4/21), serum dilution neutralisation (4.8%, 1/21) and in-direct fluorescent antibody (IFA) (4.8%, 1/21) assay. Two studies evaluated molecular tests including reverse transcription polymerase chain reaction (RT-PCR) (9.5%, 2/21) and nucleic acid sequence-based amplification (NASBA) (4.5%, 1/22). Accuracy or agreement data were available in 76.2% (16/21) of the studies as raw data (71.4%, 15/21), specificity (14.3%, 3/21), sensitivity (14.3%, 3/21) and detection thresholds (14.3%, 3/21). Appropriate testing times in regards to the stage of human infection (28.6%, 6/21) were reported for some diagnostic tests.
Test accuracy studies using animals were predominantly an evaluation of antigen-antibody tests used for screening animals for exposure to LACV (80.0%, 4/5); only two studies reported extractable data (S4). These included PRNT (40.0%, 2/5), IFA (20.0%, 1/5), CF (60.0%, 3/5), ID (20.0%, 1/5) and unspecified IgG assays (20.0%, 1/5) and IgM assays (20.0%, 1/5). One study examined the performance of plaque assays, but accuracy data were not sufficiently reported.
Eleven studies (26.2%, 11/42) evaluated methods of LACV detection in mosquitoes using culture (27.3%, 3/11), molecular (54.5%, 6/11) and antigen-antibody (54.5%, 6/11) tests. Culture methods included virus propagation using mice (100.0%, 3/3), while molecular methods included RT-PCR (100.0%, 6/6) and NASBA (16.7%, 1/6) and antigen-antibody test methods included PRNT (16.7%, 1/6), IFA (33.3%, 2/6), EIA (33.3%, 2/6) and unspecified IgG assays (33.3%, 2/6). All but two of the studies reported sufficient accuracy or agreement data for at least one outcome (S4).
Studies using LACV cultures evaluated antigen-antibody tests (33.3%, 3/9), molecular methods (33.3%, 3/9) and plaque assays (22.2%, 2/9). The molecular methods evaluated included single-strand conformation polymorphism analysis, in situ hybridisation and northern blot hybridisation with a chimeric genetic probe. The evaluated antigen-antibody tests included PRNT (22.2%, 2/9), IFA (11.1%, 1/9), HI (11.1%, 1/9), CF (11.1%, 1/9), ID (11.1%, 1/9), electrophoresis (11.1%, 1/9) and unspecified IgG assays (11.1%, 1/9). Only four of these studies reported sufficient test accuracy data.
Treatment efficacy and prevention strategies
Treatment of LACV (3.5%, 17/481) was studied in vitro (88.2%, 15/17) and examined the anti-viral activity of several compounds: ribavirin (20.0%, 3/15), cycloheximide (20.0%, 3/15), WP1130 (13.3%, 2/15), puromycin (13.3%, 2/15) and pactamycin (13.3%, 2/15) (S4). Ribavirin was assessed in phase I and II clinical trial to treat children with severe LACV; moderate doses appeared safe, but the phase II trial was discontinued due to adverse effects suspected to be caused at high doses. Experimental animals were used to determine the efficacy of treatment options for LACV (11.8%, 2/17) (S4). Animal models using mice evaluated a small molecule that limits viral replication, WP1130 and another experiment evaluated liposomes, interferon (IFN)-ß and Poly (I·C), as a supportive therapy for overcoming infection.
Interventions to prevent LACV were evaluated in 3.1% (15/481) of studies. Three in vitro studies investigated DNA plasmids as potential vaccine candidates, the Mirasol Pathogen Reduction Technology System as a means to prevent transfusion transmission and the effectiveness of bacteria colonies to prevent LACV infection in mosquito cells (S4). Five animal model studies tested vaccine candidates in mice. Three vector studies looked at interventions to prevent or decrease the burden of LACV infection in vector populations, all of which seemed to have limited practical application. This included colonising mosquitoes with the bacterium, Wolbachia, to decrease LACV in the vectors, use of caffeinated or decaffeinated coffee extracts in breeding sites and the inhibition of LACV infection when the mosquitoes were inoculated with genetic elements, namely sequences from the small (S) and medium (M) RNA segments of the LACV genome.
Preventative control strategies for humans were reported in four studies (4/15) and included behaviour modification (e.g. habitat removal), the use of insecticides such as permethrin, education materials to disseminate information about mosquito-borne diseases including LACV, personal protective measures to avoid mosquito bites and information on mosquito breeding ground (habitat) removal (S4).
Social and economic burden
The economic burden of LACV infection was reported in three studies that described cost estimates for direct and indirect medical costs including the cost of hospitalisation and diagnostic testing (S4). Projected medical cost estimates for cases with lifelong neurological sequelae were estimated in a single study. The social burden of LACV for adult patients and guardians of pediatric cases was studied in North Carolina. Measured outcomes included CLYs (Cumulative Life Years), ILYs (Impaired Life Years), DALYs (Disability Adjusted Life Years), ILCES (Impact of La Crosse Encephalitis Survey) and stressors.
Discussion
Since the first reported case of LACV in La Crosse, Wisconsin in 1960 [Reference Thompson, Kalfayan and Anslow3], cases have consistently been reported in Minnesota, Wisconsin and Ohio. In addition to Ohio, the highest number of cases reported annually and highest incident rates have been reported from the Appalachia region; West Virginia since the 1980s and Tennessee and North Carolina since the 1990s. The other 17 states that reported cases have reported low incidence rates particularly since 2000 and case occurrence is inconsistent over time. No cases of LACV have been documented from Canada, despite the documented presence of Ae. triseriatus in provinces that border LACV affected USA states (Ontario, Quebec and New Brunswick) [Reference Williams21]. Circulation of LACV outside of North America has not been documented, although Ae. triseriatus has been found as far south as northern and central Mexico [Reference Sánchez-Trinidad22].
The range of LACV is defined by its ecological niche, competent vector and intermediary host ranges and suitable climate conditions [Reference Bewick7]. Suggested reservoir hosts of LACV, the eastern chipmunk and the eastern grey squirrel, have overlapping ranges between the northern border of Florida and the southern tip of Hudson Bay [23] and, eastern Texas and the Florida Keys north to the St. Lawrence areas of southeastern Canada [24], respectively. LACV activity has largely been documented where these ranges overlap with the range of Ae. triseriatus. The literature captured in this ScR did not address the potential impact of climate change on LACV; however, several suitable climate and landscape features were significant determinants for the presence of LACV and may be useful for predictions [Reference Bewick7]. The epidemiological studies suggest that the enzootic transmission of LACV is dependent upon the presence of the eastern chipmunk, whose population density is dependent upon the availability of suitable habitat defined as rolling terrain with dense oak tree coverage, the same as for Ae. triseriatus [Reference Bewick7, Reference Lancaster25, Reference Gauld26]. Landscape modification in affected areas, particularly in the Appalachian region, could explain the increase in cases in this area due to substantial population growth and increased human presence in hardwood forests, increasing the risk of exposure to Ae. triseriatus in areas where LACV is circulating [Reference Bewick7]. Ae. triseriatus is thought to have a limited flight range, perhaps as short as 200 m from its breeding site, thus human presence in close proximity to breeding sites is an important risk factor identified in several studies, Table 2 [Reference Turell27, Reference Freier and Beier28]. Future research should consider collecting data to support spatial analysis and predictive models that explore how additional factors (e.g. landscape, climate) may be acting or interacting to prevent or encourage the establishment of LACV in new areas.
The spread or emergence of new competent vectors (e.g. Ae. albopictus and Ae. japonicas) was not considered to have a significant impact on LACV circulation [Reference Bewick7], despite evidence that some of these vectors were competent for transmission of LACV under experimental conditions [Reference Cully, Streit and Heard29] and LACV was isolated from wild populations [Reference Barker30–Reference Gerhardt34]. Ae. japonicas was determined (experimentally) to be a vector capable of developing disseminated LACV infection, however, it required a higher viral dose to become infected compared with Ae. triseriatus [Reference Sardelis, Turell and Andre35]; only one study identified LACV in wild populations [Reference Harris36]. Similarly, several other species, of primarily Aedes mosquitoes, have been evaluated to a limited extent for competence as a LACV vector. The literature indicates that Ae. triseriatus mosquitoes are the most prominent and most important vector in the spread and maintenance of LACV.
For humans, complications and long-term sequelae were infrequently reported so it is unclear how common each type of symptom, complication or sequelae is across all LACV cases and whether there are individual risk factors (e.g. personal immune status) that put certain individuals at higher risk for severe LACV disease. Age-dependant susceptibility was apparent across cases where children were often the affected population (>90%) and thus at greater risk of LACV disease compared with the general population. There were many in vitro and animal model experiments investigating the nature of this apparent age-dependant susceptibility to LACV. They mainly investigated the role of the innate immune response with respect to host susceptibility and the potential mechanisms that would explain how host–virus interactions differ leading to differences in the pathogenesis of the CNS. One study demonstrated that weanling mice could not prevent the development of neurological disease because they did not produce a high enough type I IFN response to control viral replication [Reference Taylor37]. Adult mice were generally asymptomatic, likely due to an early immune response that limits replication and/or access to the CNS [Reference Mukherjee38, Reference Bennett39]. When LACV enters the CNS it readily infects neurons regardless of the hosts’ age causing neuronal necrosis [Reference Johnson40]. This supports the argument that peripheral adaptive immunity may be related to the age-dependant susceptibility to LACV [Reference Mukherjee38]. Knowledge gaps identified with respect to host immune response to LACV infection included the types of cells that produce and respond to IFN, the initial antiviral defence [Reference Delhaye41] and the role of the non-structured protein on the S segment (NS) of LACV during LACV infection [Reference Verbruggen42–Reference Blakqori44].
Antigenically, LACV is closely related to viruses such as Jamestown Canyon virus [Reference Pastula45] and Snowshoe hare virus [Reference Drebot46] making the development of antigen-antibody tests that do not cross-react with other California serogroup viruses challenging. The cross-reactivity of the California serogroup viruses occurs when the immune system encounters a slight variation of a previously encountered antigen but relies on memory of an earlier infection to launch an immune response. This results in a suboptimal immune response, as the immune system does not adapt to the new strain [Reference Vatti47] and false positive results occur for closely related viruses like the California serogroup viruses [Reference Blackmore and Grimstad48]. Use of evolving molecular-based diagnostic tests during acute infection may reduce reliance on antigen-antibody-based tests.
Prevention strategies identified included early development vaccine candidates (40.0%, 6/15) and education strategies for members of the public (26.7%, 4/15) to minimise contact with known mosquito vectors. Children and outdoor workers, particularly those working in forested areas should take extra precautions as surveillance data identified these groups as high risk of LACV exposure. Few studies evaluated the efficacy of treatment strategies for LACV infection; a single human study of Ribavirin efficacy was halted due to safety concerns [Reference McJunkin49]. Considering long-term medical costs per patient more prevention and treatment research are warranted [Reference Byrd12, Reference Utz14].
There were 481 publications included in this ScR dating from 1969, the first time La Crosse was named in the literature, to 2016 [Reference Chappell50]. It is possible that some publications were not identified, particularly those published before 1969 because they did not contain any keywords, were not indexed or they only summarised California serogroup results without specifying results attributable to LACV. To minimise possible bias due to not identifying relevant research, we employed a rigorous pre-tested search strategy in electronic bibliographic databases, hand searched reference lists of relevant papers and conducted a grey literature search. The bias due to excluding results that were only reported as California encephalitis or California serogroup virus is unknown, but likely resulted in an underestimation of the number of LACV cases in this ScR as a number of pre-2008 surveillance reports only reported California Encephalitis cases. Given that most of the research is based in North America and only two studies were excluded from the ScR due to language, language bias is likely minimal in this ScR.
Conclusion
Climate change and other factors such as urbanisation will have an inevitable impact on epizootic cycles and disease emergence or re-emergence of many vector-borne diseases. LACV was prioritised as a pathogen likely to spread or emerge in new areas in North America and as such, a ScR was conducted to summarise all available evidence on the virus. Structured and reproducible knowledge synthesis methods were used to characterise 481 relevant articles, mainly from the USA. The research focused on LACV epidemiology, research on the virus and the transmission and pathogenesis of the virus in vectors and hosts. Some of the knowledge gaps include; the spectrum of human illness due to LACV infection and risk of exposure in different settings. This type of evidence is needed to improve our understanding of the burden of LACV in humans, develop better predictive models and design effective intervention strategies. Currently, there is no LACV specific treatment and current prevention recommendations focus on public education to minimise exposure to mosquitoes by employing personal protective measures. A recent CDC report on LACV cases from the USA in the last 10 years shows year–year variation of 130 cases in 2011 to 35 cases in 2016 [10]. No LACV cases have been documented in Canada despite the presence of vectors and hosts in the provinces that border LACV affected USA states. Thus, further research is warranted to explore landscape and climate factors that may prevent or encourage the establishment of LACV in Canadian provinces and other unaffected areas. The results of this review can be used to support evidence-based decision-making on LACV issues and addressing the knowledge gaps identified in this ScR will most effectively augment our understanding of LACV.
Author contributions
SH, IY, JG, MM, LW designed the study and created data forms. SH, IY, JG, RK, SG, DR and LW pre-tested data forms. SH, IY, JG, RK, SG, DR and LW completed data screening and characterisation. SH and LW performed data cleaning and analysis. SH and LW wrote the manuscript and JG, MM and IY edited the manuscript.
Author ORCIDs
I. Young and L. A. Waddell 0000-0002-5575-5174, 0000-0003-4887-5124
Supplementary material
The supplementary material for this article can be found at https://doi.org/10.1017/S0950268818003096.
Acknowledgements
We would like to acknowledge Janet Harris and the NML library staff for the procurement of articles. We would also like to acknowledge Robin Kydd, Sophiya Garasia and Danielle Reimer for their work reviewing articles and Alyssa Harding for her support creating macros for the color gradient in Figure 2. This work was supported by the Public Health Agency of Canada's vector-borne disease climate change and adaptation funds.
Conflicts of interest
None.


 Open access