

Menopause leads to constantly low circulating 17β-estradiol (E2) levels compared with pre-menopausal cyclic monthly fluctuation of high to low systemic E2. The most commonly experienced adverse consequences are vasomotor symptoms such as hot flushes and night sweats, which are effectively treated with E2-based HRT (Sassarini & Lumsden, Reference Sassarini and Lumsden2015). HRT has also been shown to be associated with better muscle and bone health (Mikkola et al., Reference Mikkola, Heinonen, Kovanen, Cheng, Kujala, Suominen and Sipilä2011; Ronkainen et al., Reference Ronkainen, Kovanen, Alen, Pöllänen, Palonen, Ankarberg-Lindgren and Sipilä2009). Aging is typically associated with deterioration of bone properties, reduced skeletal muscle mass, and increased ectopic fat accumulation, which affect muscle quality and function. E2 deprivation has been shown to result in gain of fat mass and loss of fat free mass (Shea et al., Reference Shea, Gavin, Melanson, Gibbons, Stavros, Wolfe and Kohrt2015) as well as in increased risk for osteoporotic changes (Riggs et al., Reference Riggs, Khosla and Melton2002; Szulc et al., Reference Szulc, Seeman, Duboeuf, Sornay-Rendu and Delmas2006), while post-menopausal HRT partially counteracts aging related musculoskeletal deteriorations (Cheng et al., Reference Cheng, Sipilä, Taaffe, Puolakka and Suominen2002; Komulainen et al., Reference Komulainen, Kroger, Tuppurainen, Heikkinen, Alhava, Honkanen and Saarikoski1999; Sipilä et al., Reference Sipilä, Taaffe, Cheng, Puolakka, Toivanen and Suominen2001; Taaffe et al., Reference Taaffe, Sipilä, Cheng, Puolakka, Toivanen and Suominen2005). However, there is considerable variation in response to HRT between individuals, which can be partly explained by genetic factors (Langdahl, Reference Langdahl2009).
Studying HRT-discordant post-menopausal MZ twins eliminates differences in the DNA sequence between HRT users and their non-user twin sisters. This enables investigation of potential epigenetic influences of HRT. The purpose of this study was to investigate the association of long-term HRT on WBC DNA methylation and thereby gene expression as a potential mechanism associated with differences in total body, muscle, and bone characteristics in post-menopausal MZ twin pairs discordant for E2-based HRT use. We hypothesized that HRT-associated differences in DNA methylation could underlie gene expression differences that in turn would manifest as differences at the phenotype level. To test this hypothesis, we investigated 20 HRT-discordant MZ twin pairs for genome-wide DNA methylation and determined DMRs within the discordant twin pairs. Next, we examined if genes with DMRs are also differentially expressed in WBCs in a subgroup of nine HRT-discordant twin pairs. Finally, the within-pair expression differences were correlated with within-pair differences of the phenotype characteristics to further link the identified DMR and gene expression profiles with body adiposity, muscle characteristics, and bone mass of the HRT-discordant post-menopausal MZ twin pairs.
Methods
Study Design and Data Collection
The participants of the current study originate from two separate twin studies, the Finnish Twin Study on Aging (FITSA) and the Sarcopenia — Skeletal Muscle Adaptation to Post-menopausal Hypogonadism and Effects of HRT and Physical Activity in Older Women: a Genetic and Molecular Biological Study on Estrogen-related Pathways (SAWEs), for which the subjects were recruited from the Older Finnish Twin Cohort (Kaprio & Koskenvuo, Reference Kaprio and Koskenvuo2002; Kaprio et al., Reference Kaprio, Sarna, Koskenvuo and Rantasalo1978), consisting of 13,888 twin pairs of known zygosity. The FITSA study investigates the genetic and environmental effects on the disablement process in older female twins (Tiainen et al., Reference Tiainen, Sipilä, Alen, Heikkinen, Kaprio, Koskenvuo and Rantanen2004). The SAWEs study investigates the associations of HRT on muscle properties at molecular level in a genetically controlled design (Ronkainen et al., Reference Ronkainen, Kovanen, Alen, Pöllänen, Palonen, Ankarberg-Lindgren and Sipilä2009). Zygosity of all twins was confirmed by genotyping multiple polymorphic markers. Study participants visited our laboratory on two consecutive days. The evening of the first day consisted of the computed tomography assessments for muscle composition. The second day consisted of blood sampling and measurements of body and bone composition.
MZ HRT-discordant twin pairs (N = 20) were studied. The HRT-using co-twins were on E2-based HRT with the preparation containing either E2 only (n = 12) with 1–2 mg of estrogenic agent or E2 in combination with progesterone (n = 8) with estrogenic (1–2 mg) and progestogenic compounds. The other co-twin had never used HRT. The age of the participants ranged from 54 to 72 years (mean age 62.4 ± 6.0 years). The mean duration of HRT use was 8.8 ± 5.7 years (range 1–25 years). Physical activity was assessed with the scale of Grimby (Reference Grimby1986), with slight modifications and categorized as sedentary (no other activities, but at the most light walking two times/week), moderately active (walking or other light exercise at least three times/week, but no other more intensive activities), and active (moderate or vigorous exercise at least three times/week; Ronkainen et al., Reference Ronkainen, Kovanen, Alen, Pöllänen, Palonen, Ankarberg-Lindgren and Sipilä2009).
The subjects provided written informed consent. The protocol was designed and performed according to the principles of the Helsinki Declaration and approved by the Ethics Committee of the Hospital District of Central Finland.
Total Body and Muscle Composition and Bone Mineral Content
Total body fat percentage and lean body mass were assessed by bioelectrical impedance analysis (Spectrum II, RJL Systems, Detroit, MI, USA). Computed tomography scans (Siemens Somatom motion scanner, Siemens, Erlangen, Germany) were obtained from the midpoint between the greater trochanter and the lateral joint line of the knee and analyzed with the Geanie 2.1 software (Commit, Espoo, Finland) to separate lean and fat tissue on the basis of the given radiological density limits. Total cross-sectional area (CSA) of thigh muscle compartment was determined by manually outlining the muscle compartment along the fascial plane to exclude subcutaneous fat. Within this area, lean muscle CSA was further separated from inter- and intra-muscular (IM) fat tissue infiltrated into the muscle compartment. As an indicator of muscle quality, the mean attenuation coefficient in Hounsfield Units (HU; i.e., mean density value within lean muscle CSA) was defined. Low HU values are associated with high amount of lipids infiltrating into muscle tissue, therefore indicating poor muscle quality (Goodpaster et al., Reference Goodpaster, Kelley, Thaete, He and Ross2000).
Peripheral quantitative computed tomography scans (pQCT, XCT 2000, Stratec Medizintechnik GmbH, Pforzheim, Germany) were obtained from the side of the dominant hand (Mikkola et al., Reference Mikkola, Heinonen, Kovanen, Cheng, Kujala, Suominen and Sipilä2011). The scanned sites were 5% of the tibial length proximal to the distal end of the tibia, and in the radius 4% of the length of the forearm proximal to the distal end of radius. BMC of a 1-mm thick slice was analyzed using the Geanie 2.1 software and a density threshold of 130 mg/cm3 was used to separate bone from the surrounding soft tissue.
Blood Sampling and Assessment of Systemic Hormones, Lipids, and CRP
Blood samples were taken after overnight fasting and sera were stored at −80°C until further analyses. Serum hormone assessments were performed as previously described (Ronkainen et al., Reference Ronkainen, Kovanen, Alen, Pöllänen, Palonen, Ankarberg-Lindgren and Sipilä2009). Serum E2 was determined using an extraction radioimmunoassay (Ankarberg-Lindgren & Norjavaara, Reference Ankarberg-Lindgren and Norjavaara2008). Serum concentrations of sex hormone-binding globulin (SHBG) and high sensitivity C-reactive protein (CRP) were measured using solid-phase, chemiluminescent immunometric assays (Immulite 1000; Diagnostic Products, Los Angeles, CA, USA). Free E2 levels were calculated from E2 and SHBG levels according to (Bjornerem et al., Reference Bjornerem, Straume, Midtby, Fonnebo, Sundsfjord, Svartberg and Berntsen2004). Serum total cholesterol, low-density lipoprotein-cholesterol (LDL), high-density lipoprotein-cholesterol (HDL), and triglycerides were measured by enzymatic colorimetric assays using a KoneLab20 Clinical Chemistry Analyzer (Thermo Scientific, Vantaa, Finland).
DNA Extraction and Methylation Analysis
High molecular weight WBC DNA was extracted using QIAamp DNA Mini kit (QIAGEN Nordic, Sollentuna, Sweden). Bisulfite conversion of DNA was completed using EZ-96 DNA Methylation-Gold Kit (Zymo Research, Irvine, CA, USA) according to the manufacturer's instructions, and the co-twins were always converted on the same plate to minimize potential batch effects.
Genome-wide DNA methylation of 40 twin samples (20 pairs) was measured using the Illumina Infinium HumanMethylation450 BeadChip (450k array) according to the manufacturer's instructions (Illumina, San Diego, CA, USA). Data pre-processing was carried out using R software R-3.02 (http://www.R-project.org) and Bioconductor 2.13 (http://www.bioconductor.org), as described previously (Ollikainen et al., Reference Ollikainen, Ismail, Gervin, Kyllonen, Hakkarainen, Lundbom and Kaprio2015). First, we filtered out cytosine-guanine (CpG) sites that did not fulfill certain quality measures. We discarded: (1) probes with a detection p value > .001 in any sample (n = 2653); (2) ‘rs’ (n = 65) and ‘ch’ (n = 3076) probes reflecting single nucleotide polymorphism (SNP) genotyping probes that are only included for DNA tracing and non-CpG probes (Nordlund et al., Reference Nordlund, Backlin, Wahlberg, Busche, Berglund, Eloranta and Syvanen2013; Price et al., Reference Price, Cotton, Lam, Farre, Emberly, Brown and Kobor2013), respectively, on the 450k array; (3) unreliable probes (n = 103421), according to Naeem et al. (Reference Naeem, Wong, Chatterton, Hong, Pedersen, Corcoran and Macintyre2014); as well as (4) probes on sex chromosomes (n = 8100), as differing β values of the probes might be the result of random X inactivation by DNA methylation. As a final filtering step, we removed uninformative probes, that is the 50% of probes with lowest variance (n = 184131) among the studied samples.
We used R Bioconductor package lumi for background correction and quantile normalization of the 450k data. Color normalization was performed using the All Sample Mean Normalization (ASMN) algorithm. Additionally, we used Beta Mixture Quantile (BMIQ) from the wateRmelon package to account for differences in the distributions of the two different probe types. For removing batch effects, we used ComBat function from the sva package. As neighboring CpG sites are known to have highly similar methylation values, we averaged over the β values of CpG sites located in the same CpG island (Figure S1). We identified the CpGs belonging to the same CpG island and computed the mean values of the betas for each individual. These CpGs thus define a region with a potential of becoming a DMR in downstream analyses. All probes not belonging to any CpG islands remain as singletons in the analyses. For uniformity, these probes will also be referred to as DMRs (instead of differentially methylated probes, DMPs) in case they show differential methylation in further analyses. The CpG islands were defined as in Price et al. (Reference Price, Cotton, Lam, Farre, Emberly, Brown and Kobor2013) and Figure S1. Briefly, high-density CpG islands (HC) have CG content of > 55%, the observed/expected ratio is > 0.75, and the length of the island is > 500 bp. Intermediate-density CpG islands (IC) have CpG content of > 50%, the observed/expected ratio > 0.48, and the length of the island is > 200 bp. CpGs not belonging to CpG islands are classified as LC CpGs (low-density CpGs). The final dataset consisted of 1,04976 regions that were used in the analyses.
RNA Extraction and Gene Expression Analysis
WBC total RNA was extracted using Trizol reagent (Invitrogen, Carslbad, CA, USA) according to the manufacturer's protocol. RNA concentration was measured spectrophotometrically and quality determined by Experion (Bio-Rad Laboratories, Hercules, CA). Only good-quality RNA (260/280 ratio 1.8) was used in further analyses. Sentrix Human-WG6 V3 Expression BeadChip microarrays (Illumina, San Diego, CA) were used for the transcriptome-wide expression analysis as described previously (Ronkainen et al., Reference Ronkainen, Pöllänen, Alen, Pitkanen, Puolakka, Kujala and Kovanen2010). Briefly, an Illumina RNA amplification kit (Ambion, Austin, TX) was used according to the manufacturer's instructions. Hybridization, washing, and scanning steps were performed according to the Illumina Whole-Genome Gene Expression Direct Hybridization protocol (revision A). Twins of a pair were always hybridized onto the same BeadChip. The data were acquired by Bead Studio 3.1.3.0 (module v. 3.3.7, Illumina, San Diego, USA). The average signal intensity for individual genes was computed after excluding beads that fell outside three normal standard deviations of median intensity. Expression data was log2-transformed to stabilize the gene expression variance before quantile normalization in R Bioconductor package lumi.
Statistics
All statistical analyses were performed in R. Differential within-pair analysis of genome-wide DNA methylation and candidate gene expression was performed in limma (http://bioconductor.org/packages/release/bioc/manuals/limma/man/limma.pdf). Linear regression models were applied to all methylation probes in the final dataset to determine significant DMRs within twin-pairs discordant for HRT. In the same way, limma was used to assess differential expression of only those genes with DMRs. Methylation and expression probes were matched based on Entrez IDs. In both analyses, the data was adjusted for smoking discordance (ever vs. never smoker) within the twin pairs. Under- or overrepresentation of DMRs in specific genomic regions or in relation to CpG density in comparison to the CpG distributions in the whole dataset was assessed using Fisher's test. Global HRT-associated methylation patterns were computed by categorizing each DMR as hypo- or hypermethylated in HRT users. This categorization was performed on within-pair methylation differences over all pairs. Significance of the global overrepresentation of differential methylation in one direction (global hypo- or hypermethylation at a higher rate than expected) was assessed using Binomial test. Pearson correlations between significantly differentially expressed genes with DMRs and clinical measures were computed on within-pair differences of expression values and within-pair differences of trait values. All p values were adjusted for multiple testing using Benjamini–Hochberg procedure. Adjusted p values (FDR) ≤ .05 were considered significant, if not specified otherwise.
Gene Ontology Analysis
Gene ontology (GO) analysis of within-pair differential methylation was carried out using the gene set analysis (GSA) package in R (http://statweb.stanford.edu/~tibs/ftp/GSA.pdf). Methylation probes were assigned to probe-sets representing GO terms. In order to avoid considering too small or too large and thus irrelevant GO terms, we restricted the analysis to sets with a minimum of 15 and a maximum of 500 genes. GSA was applied on within-pair methylation differences with 1000 permutations. GO terms with FDR < 0.05 were considered as significant. GSA does not take into account the number of CpG sites on individual genes in a GO term; however, there was no obvious bias related to number of probes per gene (Figure S2).
Results
Phenotypic Characteristics
General properties and metabolic measures of the HRT users and non-users belonging to the discordant twin pairs are presented in Table 1. Their mean age was 62.4 ± 6.0 years. As expected, HRT users had higher mean circulating levels of total and free E2 compared to their non-user co-twins (202.8 ± 205.8 vs. 27.1 ± 22.0 pmol/L, p = 9.6 × 10⁻⁵; 3.5 ± 2.9 vs. 0.6 ± 0.5 pmol/L, p = 9.5 × 10⁻⁶, respectively). HRT users also had higher serum SHBG concentration than their non-using co-twins (86.2 ± 41.3 vs. 55.3 ± 27.1, p = 3.6 × 10⁻⁵). There was no evidence for differences in the concentrations of blood lipids and CRP between HRT users and non-users (p > .05 for both). No evidence for the differences between twins in the level of physical activity assessed by a three-scale self-assessment score was observed (p > .05). In addition, we did not observe any significant differences in WBC count estimates (Houseman et al., Reference Houseman, Accomando, Koestler, Christensen, Marsit, Nelson and Kelsey2012) between HRT users versus non-users (p > .05 for all WBC estimates), which is an important point considering the downstream DNA methylation analyses that could otherwise be confounded by differences in cell-type distributions.
General Properties and Metabolic Measures of the HRT-Discordant MZ Twin Pairs in the Study
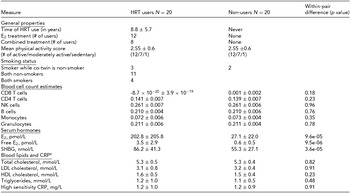
aVariables of blood lipids and CRP were available from nine twin pairs. E2 = 17β-estradiol, CRP = C-reactive protein, LDL = low-density lipoprotein, HDL = high-density lipoprotein.
Table 2 presents the phenotypic characteristics of HRT users and non-users. There was no evidence of differences in the body composition between the HRT users and non-users (p > .05). The more precise analysis of thigh muscle composition, which we had available from nine twin pairs, revealed no differences in the lean muscle area of thigh, the amount of subcutaneous fat surrounding thigh, IM fat infiltration within thigh muscle compartment, nor in the amount of IM fat assessed as the lean muscle density of thigh (p > .05). HRT users had higher BMC than their non-user co-twins, both in tibia (274.2 ± 35.9 vs. 254.3 ± 48.0, p = .0046) and radius (104.0 ± 15.2 vs. 96.2 ± 20.3, p = .018).
Phenotype Characteristics of the MZ Twin Pairs in the Study
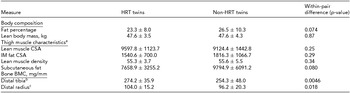
aVariables of thigh muscle characteristics were available from nine twin pairs.
bDistal tibia was measured from eight twin pairs.
cDistal radius was measured from nine twin pairs. CSA = cross-sectional area, IM = intra-/inter-muscular, BMC = bone mineral content.
Genome-Wide DNA Methylation Analysis
Genome-wide DNA methylation analysis within the 20 HRT-discordant MZ twin pairs did not result in any significant DMRs after multiple testing correction. However, 7,855 DMRs with nominal p value ≤ .05 (Table S1) were observed. DMRs were enriched at intergenic regions and depleted at gene promoters (FDR < 0.001, Figure 1a). When investigating the location of the DMRs in relation to CpG density, the majority were at non-island (low density, LC) CpG sites. Consistent with this, high density CpG (HC) islands were significantly under-represented (FDR < 3.3 × 10⁻¹⁶), whereas LC CpG sites were over-represented (FDR < 3.3 × 10⁻¹⁶) among the DMRs when compared to the whole array distribution of the CpG sites (Figure 1b). Finally, the DMRs were more frequently hypomethylated than hypermethylated (p < 2.2 × 10⁻¹⁶), suggesting that HRT associates with global hypomethylation.
Genomic distribution of the DMRs in relation to genes and CpG density. Note: Bar plots show the proportions of the DMRs at genes and intergenic regions (a), and at CpG islands and non-island CpGs (b). P values denote which of the CpG categories are over- or under-represented among the DMRs (n = 7855) in the HRT-discordant twin pairs. Fisher's exact test was used to determine under- or overrepresentation of the CpG categories among the DMRs. Promoters include CpGs at 5′ UTRs, CpGs < 1500 bp from transcription start site, and at first exon. HC, CpGs at high density CpG island, IC; CpGs at intermediate density CpG island; LC, non-CpG island CpG sites; *FDR < 0.01; **FDR < 3.3 × 10⁻¹⁶.

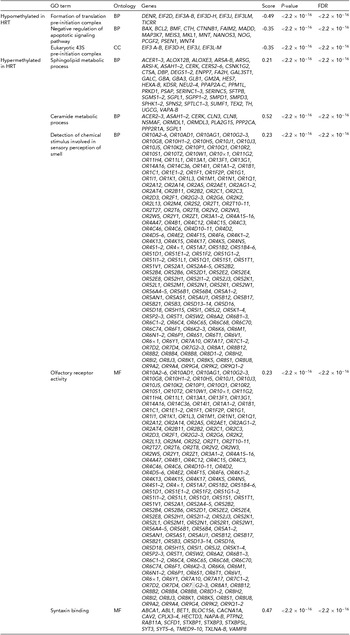
In addition to investigating individual CpG islands or isolated CpG sites, we tested whether any gene sets associating to the same biological processes, cellular components, and molecular functions are differentially methylated within twin pairs. This was accomplished by assigning all the CpG sites across the genome to probe-sets representing GO terms and running a GSA on the full DNA methylation dataset. GSA resulted in three significantly hypomethylated and five hypermethylated GO terms (FDR < 2.2 × 10⁻¹⁶, Table 3). The significant biological processes were related to regulation of translation and apoptosis, and to chemical reactions and pathways involving sphingolipids. The molecular functions were associated to signal transduction.
Differentially Methylated GO Terms from the Gene Set Analysis (GSA) of HRT-Discordant MZ Twin Pairs
Differential Expression Analysis of Genes Associated With DMRs
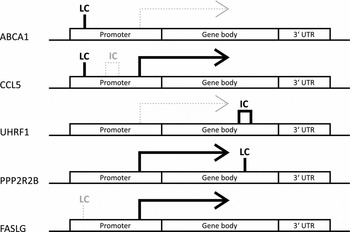
To investigate the potential biological relevance of the identified within-pair methylation differences, we applied a hypothesis-based approach and tested whether the genes with nominally significant DMRs are differentially expressed. This analysis revealed that five genes associated with DMRs were also differentially expressed within-pairs (FDR < 0.05, Table 4). We observed no clear uniformity between the genomic locations, CpG density, and methylation status of the DMRs and the direction of the gene expression difference of the respective genes (Figure 2). The differentially expressed genes were ATP-binding cassette sub-family A member 1 (ABCA1), chemokine (C-C motif) ligand 5 (CCL5, also known as RANTES), ubiquitin-like with PHD and ring finger domains 1 (UHRF1), protein phosphatase 2 regulatory subunit B (PPP2R2B) and Fas ligand (TNF superfamily member 6, FASLG), and they function in apoptosis and cell survival (FASLG; Zhang et al., Reference Zhang, Chen, Zhang, Zhou, Xia and Lu2009; and PPP2R2B; Paluszczak et al., Reference Paluszczak, Hemmerling, Kostrzewska-Poczekaj, Jarmuz-Szymczak, Grenman, Wierzbicka and Baer-Dubowska2014), transcription and epigenetic regulation (UHRF1; Berkyurek et al., Reference Berkyurek, Suetake, Arita, Takeshita, Nakagawa, Shirakawa and Tajima2014), immunoregulation (CCL5; Viola & Luster, Reference Viola and Luster2008), and in cellular cholesterol removal and assembly of HDL (ABCA1; Schmitz & Langmann, Reference Schmitz and Langmann2001).
Differentially Expressed Genes With DMRs Within HRT-Discordant Twin Pairs
aNegative log fold change denotes downregulation and positive log fold change upregulation in the HRT using co-twins compared with their non-using co-twins. Log fold changes as well as associated p-values and FDRs result from the candidate gene expression analysis in which only genes with DMRs were considered. DMR, differentially methylated region; FC, fold change.
DMR patterns were unique for each of the identified differentially expressed genes with DMRs. Note: Genes are split up into three genomic locations: promoter, gene body and 3′ UTR. The position of the indicated DMR shows the genomic location in which it appears in the given gene, the tag above gives its location in relation to CpG density. Bold solid black line under the tag indicates hypermethylation and thin gray dotted line hypomethylation. LC refers to low density and IC intermediate density CpG island. No differentially expressed genes with high density CpG island was found. The differential expression is indicated by arrows. Solid black arrows indicate higher and thin dotted gray arrows lower expression in HRT users compared to non-users, respectively.
Correlation of the Expression of Genes With DMRs With Clinical Measures of the HRT-Discordant Twin Pairs
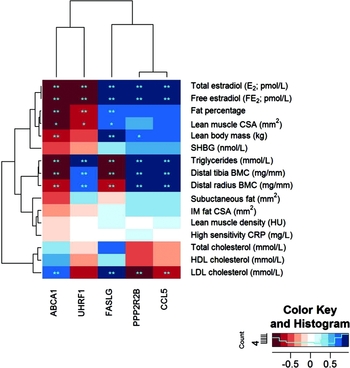
In an attempt to understand how the differentially expressed genes with DMRs (ABCA1, CCL5, UHRF1, PP2R2B, and FASLG) link to the clinical outcomes, we correlated the within-pair gene expression differences with the within-pair differences of the relevant clinical measures. The observed strong correlations between the within-pair differences in serum concentration of both total and free E2 with the within-pair difference in gene expression of each of the identified five genes supported the hypothesis that these genes are targets for HRT-mediated regulation (Figure 3 and Table S2). Negative association was found for ABCA1 (r = -0.92, FDR = 8.63 × 10⁻⁴) and UHRF1 (r = -0.90, FDR = 1.18 × 10⁻³) and positive association with FASLG (r = 0.85, FDR = 3.56 × 10⁻³), CCL5 (r = 0.94, FDR = 4.79 × 10⁻⁴), and PPP2R2B (r = 0.94, FDR = 4.79 × 10⁻⁴). When we investigated the associations for blood lipids, all the five genes were highly correlated with triglycerides and all but one gene (UHRF1) with LDL (Figure 3 and Table S2). We also analyzed the associations between the within-pair differences of ABCA1, UHRF1, FASLG, CCL5, and PPP2R2B expression, and body composition (Figure 3 and Table S2). ABCA1 was negatively and FASLG and PPP2R2B positively correlated with lean body mass, and ABCA1 and UHRF1 were negatively and FASLG positively correlated with body fat percentage, indicating that these genes associate with total body composition in HRT/E2 related manner. In order to determine more precisely the nature of this association between gene expression and lean versus fat mass, we did correlation analysis with the available variables of lean mass (lean muscle CSA of thigh, distal tibia BMC, and distal radius BMC) and fat mass (IM fat within muscle compartment and lean muscle density of thigh and subcutaneous fat surrounding thigh). There were no significant associations between gene expression and thigh fat variables, that is, IM fat, muscle density, and subcutaneous fat, and only borderline significance between gene expression and lean muscle CSA (FDR for association between lean muscle CSA and ABCA1 expression was 0.058 and > 0.6 for UHRF1, CCL5, PPP2R2B, and FASLG, Table S2). However, lower leg and arm BMC (distal tibia and distal radius, respectively) was highly significantly associated with expression of all five genes (Figure 3 and Table S2).
Heat map of correlations between significantly differentially expressed genes with DMRs and clinical measures. Note: The heat map shows genes on the x-axis and clinical measures on the y-axis. Colors of squares in the heat map indicate correlation values (see color key). Dark red squares stand for high negative correlations between gene and trait, dark blue squares indicate strong positive correlations. Stars in the squares indicate significant p-values (*) and FDRs (**) with 0.05 as cut-off, respectively. The dendrogram on the left-hand side shows clustering of the clinical measures, the one above the heatmap shows clustering of the genes according to the similarity of their correlation profiles.
Discussion
In the current study, we report associations of post-menopausal HRT with genome-wide DNA methylation and gene expression in WBCs by investigating HRT-discordant MZ twin pairs. Through within-pair genome-wide DNA methylation analysis, we identified a number of genes with HRT-associated DMRs, of which five were differentially expressed. ABCA1 and UHRF1 were down-regulated whereas CCL5, PPP2R2B, and FASLG were up-regulated in WBCs of the HRT users compared with their genetically identical non-user twin sisters. Linking our gene level findings to clinical phenotype measures showed that total body composition, bone mass, and blood lipids strongly associate with the differentially expressed genes with DMRs. These data indicate that at least part of the known beneficial HRT effects on the clinical outcomes may be regulated by DNA methylation in circulating WBCs.
Alterations in DNA methylation, both at global and individual gene level, have long been shown to associate with many human diseases, such as cancer (Lin & Wagner, Reference Lin and Wagner2015; Stefansson et al., Reference Stefansson, Moran, Gomez, Sayols, Arribas-Jorba, Sandoval and Esteller2015), type 2 diabetes (Nilsson et al., Reference Nilsson, Jansson, Perfilyev, Volkov, Pedersen, Svensson and Ling2014), BMI (Dick et al., Reference Dick, Nelson, Tsaprouni, Sandling, Aissi, Wahl and Samani2014), and obesity-associated metabolic disturbances (Ollikainen et al., Reference Ollikainen, Ismail, Gervin, Kyllonen, Hakkarainen, Lundbom and Kaprio2015), as well as aging (Marttila et al., Reference Marttila, Kananen, Hayrynen, Jylhava, Nevalainen, Hervonen and Hurme2015; Yuan et al., Reference Yuan, Jiao, de Jong, Ophoff, Beck and Teschendorff2015). However, to our knowledge, there are no genome-wide methylation studies on the effects of HRT. One previous study has shown that conjugated equine estrogen therapy is associated with reduced plasma homocysteine and increment of total level of genomic methylation in peripheral mononuclear cells (Friso et al., Reference Friso, Lamon-Fava, Jang, Schaefer, Corrocher and Choi2007). We, however, identified 7,855 DMRs with nominal significance and global DNA hypomethylation in WBCs associated with HRT. This potential discrepancy may be partially explained by differences in HRT specimen (equine estrogen vs. estradiol). In our study, the genomic distribution of the DMRs in relation to genes and CpG density was highly similar to what has been previously reported for complex diseases; gene promoters and HC islands were under-represented and intragenic regions and LC CpGs over-represented among DMRs compared to the whole array distribution of the CpG sites (Irizarry et al., Reference Irizarry, Ladd-Acosta, Wen, Wu, Montano, Onyango and Feinberg2009; Nilsson et al., Reference Nilsson, Jansson, Perfilyev, Volkov, Pedersen, Svensson and Ling2014; Ollikainen et al., Reference Ollikainen, Ismail, Gervin, Kyllonen, Hakkarainen, Lundbom and Kaprio2015; Yang et al., Reference Yang, Pedersen, Liu, O’Connor, Teach, Kattan and Schwartz2015). Hence, HRT seems to affect DNA methylation in similar genomic regions as reported for common multifactorial diseases. As most of the complex diseases are age related, it is possible that at least part of these commonly observed associations between DNA methylation and different diseases are due to aging-associated methylation changes, including global hypomethylation (Heyn et al., Reference Heyn, Li, Ferreira, Moran, Pisano, Gomez and Esteller2012; Johansson et al., Reference Johansson, Enroth and Gyllensten2013; Yuan et al., Reference Yuan, Jiao, de Jong, Ophoff, Beck and Teschendorff2015). As our study was based on within-pair comparisons of HRT-discordant MZ twin pairs, the effect of age could potentially only manifest as increased methylation variation by age, as reported previously for unrelated individuals (Tserel et al., Reference Tserel, Kolde, Limbach, Tretyakov, Kasela, Kisand and Peterson2015). Also, the age range that we studied was relatively limited, so we cannot draw conclusions about very old women or pre-menopausal women.
In addition to investigating individual CpG islands and isolated CpG sites, we also examined DNA methylation in gene sets to detect HRT-associated differential methylation clustering to gene ontologies. Interestingly, all hypomethylated GOs associated with cell survival and apoptosis, and hypermethylated GOs with neural function related GOs. Both of these larger entities are highly relevant for HRT. Estrogen has been shown to regulate cell proliferation and apoptosis (Fang et al., Reference Fang, Yang, Lin, Teng, Jiang, Chen and Li2015), and to increase cognitive abilities and other brain functions (Comasco et al., Reference Comasco, Frokjaer and Sundstrom-Poromaa2014; Mahmutyazicioglu et al., Reference Mahmutyazicioglu, Besir, Bardakci, Tanriverdi and Ankarali2014). Dysfunction of the olfactory system is an early sign of neurodegeneration, and HRT has a positive effect on olfactory function (Doty et al., Reference Doty, Tourbier, Ng, Neff, Armstrong, Battistini and Sondheimer2015), explaining our GO findings related to sensory perception of smell and olfactory receptor activity. Unfortunately, in the current study we did not assess cognition or other neural functions. Therefore, further studies are needed to see if the HRT-associated methylation and gene expression indeed have a role in neural function.
In order to go beyond only reporting associations on genome-wide DNA methylation, we investigated the potential biological relevance of the identified within-pair methylation differences by exploring whether any of the genes with DMRs are differentially expressed. This analysis revealed that five genes with DMRs (ABCA1, UHRF1, FASLG, PPP2R2B, and CCL5) were also differentially expressed within pairs, and showed that the relationships between gene body or promoter methylation and gene expression are widespread, as previously reported (Wagner et al., Reference Wagner, Busche, Ge, Kwan, Pastinen and Blanchette2014). ABCA1, CCL5, and FASLG have been previously shown to associate with HRT and menopause (Christodoulakos et al., Reference Christodoulakos, Lambrinoudaki, Economou, Papadias, Vitoratos, Panoulis and Creatsas2007; Darabi et al., Reference Darabi, Rabbani, Ani, Zarean, Panjehpour and Movahedian2011b; Kangas et al., Reference Kangas, Pöllänen, Rippo, Lanzarini, Prattichizzo, Niskala and Kovanen2014), and both UHRF1 and PPP2R2B have been associated to estrogen related breast cancer by epigenetic mechanisms (Jin et al., Reference Jin, Chen, Chen, Xu, Di, Yin and Shao2010; Klajic et al., Reference Klajic, Fleischer, Dejeux, Edvardsen, Warnberg, Bukholm and Kristensen2013; Muggerud et al., Reference Muggerud, Ronneberg, Warnberg, Botling, Busato, Jovanovic and Tost2010). In addition, PPP2R2B is a member of a PP2-family, whose expression levels have been reported to be maintained by estrogen (Yi & Simpkins, Reference Yi and Simpkins2008). Moreover, this family is directly involved in synaptic plasticity and memory formation. In addition, FASLG may also play a role in neuroprotection (Knight et al., Reference Knight, Scharf and Mao-Draayer2010). This goes nicely hand in hand with our GO findings, and thus increased expression and differential methylation of PPP2R2B and FASLG in HRT users in our study further support the potential neuroprotective role of HRT.
As an attempt to understand the clinical relevance of our DNA methylation and gene expression findings, we correlated the expression of the DMR-containing genes with clinical measures obtained from the HRT-discordant twin pairs (Figure 3, Table S2). This analysis revealed three distinct clusters. First, both measures of total body size, body fat percentage, and lean and body mass were in the same cluster with serum E2, sharing the direction of the association with gene expression. ABCA1 and UHRF1 were negatively and FASLG, PPP2R2B, and CCL5 positively associated with E2 and total body size. Second, triglycerides shared the association pattern with BMC measures. ABCA1 and FASLG expression was negatively, while UHRF1, PPP2R2B, and CCL5 expression was positively associated with triglycerides and BMC. The third cluster was formed by the cholesterol measures, of which only LDL showed significant association with gene expression. ABCA1 and FASLG expression was positively while PPP2R2B and CCL5 negatively associated with LDL concentration.
Our findings support the known influence of HRT on whole body lipid levels. Individuals on HRT generally show higher HDL and apoA levels while LDL cholesterol and apoB levels are usually decreased (Darabi et al., Reference Darabi, Rabbani, Ani, Zarean, Panjehpour and Movahedian2011b). ABCA1, which we found to be differentially expressed and methylated, is a specialized transmembrane receptor of peripheral cells involved in the reverse cholesterol process mediating cholesterol efflux to HDL particles. Some studies have shown HRT to increase ABCA1 gene expression (Darabi et al., Reference Darabi, Ani, Panjehpour, Rabbani, Movahedian and Zarean2011a; 2011b), while others, including our current study, have observed decreased ABCA1 levels due to HRT (Cerda et al., Reference Cerda, Issa, Genvigir, Rohde, Cavalli, Bertolami and Hirata2013). We did not observe differences in blood lipids within HRT user and non-user twin pairs, possibly due to the fact that genetic regulation is a stronger determinant of blood lipid concentrations than the effects of HRT. However, within-pair difference in ABCA1 expression was strongly positively correlated with within-pair difference in LDL and negatively with within-pair difference in triglycerides. ABCA1 mediated reverse cholesterol transport has also been linked to inflammation and apoptosis of WBCs (Mineo & Shaul, Reference Mineo and Shaul2012).
As another indicator of the association of HRT with inflammation, we found two inflammatory cytokines CCL5 and FASLG to be differentially expressed and methylated. FASLG also removes monocytes after the immune response by inducing their apoptosis (Mor et al., Reference Mor, Sapi, Abrahams, Rutherford, Song, Hao and Kohen2003; Perlman et al., Reference Perlman, Pagliari, Nguyen, Bradley, Liu and Pope2001). Thus, higher FASLG expression may participate in prevention of inflammation.
Estrogen-mediated upregulation of FASLG has also been shown to be important in maintaining bone re-modeling balance (Shao et al., Reference Shao, Liao, Yu, Shuai, Su, Jing and Jin2015; Wang et al., Reference Wang, Liu, Zhao, Liu, Liu, Chen and Jin2015). Although DNA methylation has been previously proposed as a regulatory mechanism of FASLG expression (Castellano et al., Reference Castellano, Vire, Pion, Quivy, Olive, Hirsch and Collette2006), HRT has not been suggested to be inductor of its differential methylation before. Our study shows that FASLG has LC type DMR in the gene promoter area, is differentially expressed, and moreover, its expression is significantly associated with distal tibia and radius BMC. Thus, these data support the role of estrogen as a regulator of FASLG expression and further suggest methylation as a mediating mechanism of the regulation.
Finally, our results support the role of HRT in maintaining healthier body composition. The main contributors to lean body mass are lean muscle mass and bone mass. Of these, we assessed muscle mass as thigh lean muscle CSA and bone mass as the BMC of tibia and radius, and found bone variables to negatively associate with the expression of ABCA1 and FASLG and positively with the expression of UHRF1, PPP2R2B, and CCL5. Another important body composition measure is fat percentage that is a measure of total body adiposity, including both abdominal subcutaneous and visceral adipose tissue as well as peripheral gluteofemoral and intra-muscular adipose tissue. Since abdominal and gluteofemoral adipose tissue has been shown to possess opposite roles in metabolic health (Manolopoulos et al., Reference Manolopoulos, Karpe and Frayn2010), we examined the associations between gene expression and thigh subcutaneous and IM fat, as rough estimates of gluteofemoral fat, but found no significant correlations. However, total body fat percentage correlated negatively with ABCA1 and UHRF1, and positively with FASLG expression. This observation may indicate that these associations largely come from abdominal fat depots. Therefore, we can conclude that the identified differentially expressed and methylated genes are involved in HRT-associated regulation of body composition; however, without further studies it is difficult to determine how clinically relevant these associations are.
We used WBCs as a target tissue for HRT-associated DNA methylation. A limitation of using such tissue consisting of multiple cell types is that the observed DNA methylation and gene expression profiles may reflect differences in the cell-type compositions between HRT users and non-users, especially as aging is associated with increased inflammation and HRT with reduced inflammation. However, we did not observe any differences in the estimated cell-type distributions within the HRT-discordant twin pairs. In addition, all WBC types are similarly in close contact with and predisposed to the systemic estradiol concentration. Since DNA methylation is tissue specific, it can be speculated that the associations between gene expression of the genes with DMRs and the body composition measures of muscle, bone and fat could be stronger if DNA methylation and gene expression were measured in the respective tissues. Therefore, future studies are needed to see if any of our findings in WBCs can be replicated in other important estrogen target tissues, such as muscle, bone, and adipose tissue of HRT users versus non-users. Furthermore, we cannot exclude the possibility that our HRT-discordant co-twins are also discordant for some other factors influencing their experience or coping strategy on the physiological menopausal symptoms, leading to the discordance in HRT use. If such a factor affects DNA methylation in WBCs it could, at least in theory, confound our results. No previous DNA methylation studies in relation to menopausal symptoms or factors influencing the decision to start using HRT exist. Although precaution in interpreting our results is warranted, we are confident that our observations are due to HRT-discordance associated differences in circulating estradiol concentrations rather than due to other factors related to HRT.
To conclude, our study is the first attempt to associate post-menopausal HRT use with genome-wide DNA methylation and associated differences in gene expression of WBCs. Our results suggest that HRT-associated methylation associated with differential gene expression may be one of the biological mechanisms driving beneficial HRT effects on body adiposity and bone mass. However, further studies are needed to evaluate and confirm the clinical relevance of our findings.
Acknowledgments
We thank the participants for their invaluable contributions to the study. The technical staffs at the Finnish Twin Cohort Study and at the Department of Health Sciences and Gerontology Research Center at University of Jyväskylä are acknowledged for their help in collecting the data. The Gerontology Research Center is a joint effort between the University of Jyväskylä and the University of Tampere. The 450k DNA methylation analysis was performed by the SNP&SEQ Technology Platform in Uppsala, which is part of the National Genomics Infrastructure hosted by Science for Life Laboratory.
This study was supported by the Academy of Finland (M. O., grant number 251316 V. K., grant number 114310, J. K., grant numbers 265240 and 263278, T. R., grant number 69818), Finnish Ministry of Culture and Education (V. K., grant number 89/627/2008, T. R., grant number 120/722/2003), The Sigrid Juselius Foundation (M. O.); EPITRAIN - Innovative techniques and models to understand epigenetic regulation in the pathogenesis of common diseases (EPITRAIN - FP7-PEOPLE-2012-ITN, grant number 316758); ENGAGE,- European Network for Genetic and Genomic Epidemiology, (FP7-HEALTH-F4–2007, grant number 201413); the Swedish Research Council (A-C.S., grant number E0226301, C0524801); the Swedish Cancer Society (A-C. S., grant number 140581) the Swedish Childhood Cancer Foundation (A-C. S., grant number PR2014–0100), the Swedish Foundation for Strategic Research (A-C. S., grant number RBc08–008); the Erik, Karin and Gösta Selander's Stiftelse (E. B.).
Ethical Standards
The authors assert that all procedures contributing to this work comply with the ethical standards of the relevant national and institutional committees on human experimentation and with the Helsinki Declaration of 1975, as revised in 2008.
Supplementary Material
To view supplementary material for this article, please visit http://dx.doi.org/10.1017/thg.2015.82.


