


1. Introduction
In developing and emerging economies, social networks play a prominent role in both the diffusion of information (e.g., Kinnan and Townsend, Reference Kinnan and Townsend2012, Attanasio et al., Reference Attanasio, Barr, Cardenas, Genicot and Meghir2012) and the provision of informal insurance (e.g., Angelucci, and De Giorgi, Reference Angelucci and De Giorgi2009, and Conley and Udry, Reference Conley and Udry2010). However, this may lead to two sources of inefficiency. One is that heterogeneity in the amount and quality of connections results in additional economic inequality (for more information, refer to the recent survey by Jackson, Reference Jackson2022), as do asymmetry in the initial endowments (on this, refer for example to Rapoport, Reference Rapoport1988, or to Budescu et al., Reference Budescu, Rapoport and Suleiman1990). The other source is that if some people receive a positive shock in their income, they are expected to help their financially disadvantaged peers and contribute more to public goods (Rosenzweig and Wolpin, Reference Rosenzweig and Wolpin1994; Olken and Singhal, Reference Olken and Singhal2011). In this sense, we can view this redistribution process as a network tax, and consequently, people may have an incentive to hide or misreport income. This behavior indeed emerged in several empirical papers that use both observational and experimental data (Platteau, Reference Platteau2000; Baland et al., Reference Baland, Guirkinger and Mali2011; Di Falco and Bulte, Reference Di Falco and Bulte2011; Squires, Reference Squires2016; Beekman et al., Reference Beekman, Gatto and Nillesen2015; Boltz et al., 2015; Jakiela and Ozier, Reference Jakiela and Ozier2016; Di Falco et al., Reference Di Falco, Feri, Pin and Vollenweider2018; Di Falco et al., Reference Di Falco, Lokina, Martinsson and Pin2019).
In this paper, we propose a theoretical network model that may underpin the empirical evidence by providing an explanation of the effects of sharing pressure on significant economic decisions. We build on the seminal work of Bramoullé and Kranton (Reference Bramoullé and Kranton2007) and Bloch et al. (Reference Bloch, Genicot and Ray2008), which explores network formation games based on informal insurance, and analyze this issue in the context of Network Games (e.g., Galeotti et al., Reference Galeotti, Goyal, Jackson, Vega-Redondo and Yariv2010; Feri and Pin, Reference Feri and Pin2020).Footnote 1 In this context, agents do not know if their direct neighbors are able to communicate directly with each other. This possibility of neighbor communication leads to an increase in the number of closed triangles within the social network, a property typically referred to as clustering. Recent works by Lamberson (Reference Lamberson2015) and Ruiz-Palazuelos (Reference Ruiz-Palazuelos2021) have introduced the notion of clustering in network games due to its effect on the correlation of neighbors’ actions. While the rest of the literature has mostly analyzed the role of clustering in sustaining cooperation, our paper uses clustering as the measure that summarizes the trade-off between having the possibility to enter into labor sharing agreements with many people and avoiding the leakage of information about their own wealth. In this way, a standard expected utility framework, adapted to the theory of social networks, provides an appropriate conceptual framework. Furthermore, unlike the literature on sustained cooperation, our model shows that clustering provides incentives for inefficient behavior.Footnote 2
The rest of the literature has mostly analyzed the support of clustering for sustaining cooperation in the context of repeated interaction, for example, in Kandori (Reference Kandori1992), Ellison (Reference Ellison1994), Vega-Redondo (Reference Vega-Redondo2006), Bloch et al. (Reference Bloch, Genicot and Ray2008), Karlan et al. (Reference Karlan, Mobius, Rosenblat and Szeidl2009), Jackson et al. (Reference Jackson, Rodriguez-Barraquer and Tan2012), and Dall’Asta et al. (Reference Dall’Asta, Marsili and Pin2012).
Besides its contribution to the theoretical literature on social networks, our results also provide theoretical support for the observed behavior in two other broad strands of empirical literature. The first one is about how social networks affect input misallocation (Banerjee and Munshi, Reference Banerjee2004; Baland et al., 2015; Squires, Reference Squires2016; Munshi and Rosenzweig, Reference Munshi and Rosenzweig2016; Carranza et al., Reference Carranza, Donald, Grosset and Kaur2022). The second one focuses on the effects of social pressure on involuntary giving (List and Lucking-Reiley, Reference List and Lucking-Reiley2002; Dana et al., Reference Dana, Weber and Kuang2007; Landry et al., Reference Landry, Lange, List, Price and Rupp2006; Della Vigna et al., Reference Della Vigna, List and Malmendier2012; Jakiela and Ozier, Reference Jakiela and Ozier2016; Olié, Reference Olié2023).
The next section presents the theoretical model and results. In Section 3, we show how the theoretical model’s predictions are consistent with the data collected in a previous field experiment. In Section 4, we discuss possible extensions of the theoretical model. Section 5 provides empirical support for the model. Finally, in Section 6, we offer some final remarks.
2. A model of network redistributive pressure
Suppose that there are N individuals as nodes in an exogenous undirected social network. As assumed in the emerging literature on network games, they have incomplete information about the network: they only know their own degree and the clustering coefficient of the network.Footnote 3 We measure the clustering coefficient as the i.i.d. probability c that two nodes that have a network member in common are also linked together (refer to Newman, Reference Newman2003, and Jackson, Reference Jackson2008, for alternative definitions of the same concept). Note that, in the context of our model, c can also more broadly be interpreted as the probability that the information spreads through multiple steps, without changing anything in the formal analysis. We assume that there is a single good, and each agent needs at least one unit of this good to survive. It can be produced using either the old and less productive technology or the new and much more productive technology.
The production function of the new technology is $f(k)$
, where
$f(k)$
, where $k\in Z$
,Footnote
4
that is, the quantity of the good produced by the new technology depends on the number of people working on it, denoted by
$k\in Z$
,Footnote
4
that is, the quantity of the good produced by the new technology depends on the number of people working on it, denoted by $k$
. We assume
$k$
. We assume $f(0)\gt 1$
and that
$f(0)\gt 1$
and that $f(k)$
is no decreasing and concave, that is, for every
$f(k)$
is no decreasing and concave, that is, for every $k\in Z$
we have that
$k\in Z$
we have that $\Delta f(k)=f(k)-f(k-1)\geq 0$
and
$\Delta f(k)=f(k)-f(k-1)\geq 0$
and $\Delta ^{2}f(k)=\Delta f(k)-\Delta f(k-1)\leq 0$
. The old technology provides a quantity of one unit of the good with probability
$\Delta ^{2}f(k)=\Delta f(k)-\Delta f(k-1)\leq 0$
. The old technology provides a quantity of one unit of the good with probability $1-p$
, and
$1-p$
, and $0$
units with probability
$0$
units with probability $p$
, where these probabilities are i.i.d across the agents using it.
$p$
, where these probabilities are i.i.d across the agents using it.
We further assume that: (i) the new technology is used only by one agent, denoted by $i$
, and can be observed only by people working on it; (ii) people working for agent
$i$
, and can be observed only by people working on it; (ii) people working for agent $i$
can inform their neighbors that agent
$i$
can inform their neighbors that agent $i$
has a new production technology and therefore a higher income; (iii) people not working for agent
$i$
has a new production technology and therefore a higher income; (iii) people not working for agent $i$
cannot observe the labor sharing arrangements of other agents; (iv) agents are risk neutral and they have linear preferences over the good.Footnote
5
$i$
cannot observe the labor sharing arrangements of other agents; (iv) agents are risk neutral and they have linear preferences over the good.Footnote
5
There are three steps at different times.
Time 0: A single agent, denoted by $i$
, is randomly selected to receive the new technology. Agent
$i$
, is randomly selected to receive the new technology. Agent $i$
has
$i$
has $\mathscr{l}$
neighbors, that is,
$\mathscr{l}$
neighbors, that is, $\mathscr{l}$
individuals in the ego-network of agent
$\mathscr{l}$
individuals in the ego-network of agent $i$
with which he interacts (sometimes referred to as the degree of agent
$i$
with which he interacts (sometimes referred to as the degree of agent $i$
). Every other agent in the social network, who is not
$i$
). Every other agent in the social network, who is not $i$
, uses the old technology.
$i$
, uses the old technology.
Time 1: Agent $i$
chooses, among his
$i$
chooses, among his $\mathscr{l}$
neighbors,
$\mathscr{l}$
neighbors, $k$
agents that he can employ in his technology. Agent
$k$
agents that he can employ in his technology. Agent $i$
makes a take–it–or–leave–it offer to each of the chosen
$i$
makes a take–it–or–leave–it offer to each of the chosen $k$
network members. This offer is a form of insurance where agent
$k$
network members. This offer is a form of insurance where agent $i$
commits to pay one unit of the good in the case that the realized income of the employed agent is
$i$
commits to pay one unit of the good in the case that the realized income of the employed agent is $0$
. It is straightforward to see that it is dominant for each of them to accept this offer. However, they would not accept any offer less than
$0$
. It is straightforward to see that it is dominant for each of them to accept this offer. However, they would not accept any offer less than $1$
, as they would risk not surviving.Footnote
6
$1$
, as they would risk not surviving.Footnote
6
Time 2: The outcomes of the two technologies are realized. The agents with bad luck, that is, those who realize a quantity of zero for the good, still have a chance to survive if they are members of both agent $i$
’s network and the network of one of the agents employed by
$i$
’s network and the network of one of the agents employed by $i$
. Agent
$i$
. Agent $i$
will have to use all his excess profit to sustain them, up to the point that he himself is also back to
$i$
will have to use all his excess profit to sustain them, up to the point that he himself is also back to $1$
. The intuition is as follows: Agents can receive help only from agents they are linked to. The
$1$
. The intuition is as follows: Agents can receive help only from agents they are linked to. The $k$
agents employed by agent i know that he uses the new and more productive technology and spread this information to all agents linked to them. Therefore, an agent with bad luck who is in the network of agent i and in the network of (at least) one of the employed agents will know that they can ask for help from agent
$k$
agents employed by agent i know that he uses the new and more productive technology and spread this information to all agents linked to them. Therefore, an agent with bad luck who is in the network of agent i and in the network of (at least) one of the employed agents will know that they can ask for help from agent $i$
.
$i$
.
This model is just an optimization problem for agent $i$
that has to choose
$i$
that has to choose $k$
in order to maximize her expected payoff. Formally the problem of agent
$k$
in order to maximize her expected payoff. Formally the problem of agent $i$
is
$i$
is
 \begin{align}\underset{k\in \left\{0,..,\mathscr{l}\right\}}{\mathrm{Max}} f\!\left(k\right)-k\cdot p-g\!\left(k,\mathscr{l}\right)\end{align}
where $g(k,\mathscr{l})=p(\mathscr{l}-k)(1-(1-c)^{k})$
is the expected network tax
Footnote
7
and
$g(k,\mathscr{l})=p(\mathscr{l}-k)(1-(1-c)^{k})$
is the expected network tax
Footnote
7
and $1-(1-c)^{k}$
is the probability that some agent
$1-(1-c)^{k}$
is the probability that some agent $j$
, out of the other
$j$
, out of the other $l-k$
agents (not employed), is linked to some of the
$l-k$
agents (not employed), is linked to some of the $k$
agents. The marginal network tax is given by:
$k$
agents. The marginal network tax is given by:
 \begin{align}\Delta g\!\left(k,\mathscr{l}\right)=g\!\left(k,\mathscr{l}\right)-g\!\left(k-1,\mathscr{l}\right)=p\!\left(\left(1-c\right)^{k-1}\left(1+c\!\left(\mathscr{l}-k\right)\right)-1\right)\end{align}
whose sign is not determined, but $\Delta ^{2}g(k,\mathscr{l})=\Delta g(k,\mathscr{l})-\Delta g(k-1,\mathscr{l})=-p(1-c)^{k-2}c(2 {}+ c(\mathscr{l}-k))\lt 0$
, meaning that
$\Delta ^{2}g(k,\mathscr{l})=\Delta g(k,\mathscr{l})-\Delta g(k-1,\mathscr{l})=-p(1-c)^{k-2}c(2 {}+ c(\mathscr{l}-k))\lt 0$
, meaning that $\Delta g(k,\mathscr{l})$
is decreasing in
$\Delta g(k,\mathscr{l})$
is decreasing in $k$
and, consequently, the expected redistributive tax
$k$
and, consequently, the expected redistributive tax $g(k,\mathscr{l})$
is concave with respect to
$g(k,\mathscr{l})$
is concave with respect to $k$
. This implies that the optimization problem in (1) may not have a unique optimal
$k$
. This implies that the optimization problem in (1) may not have a unique optimal $k$
.Footnote
8
$k$
.Footnote
8
We define the greater argmax of (1), for a given value of $\mathscr{l}$
, in the following way.
$\mathscr{l}$
, in the following way.
Definition 1
(Greater optimum). We call $k_{\mathscr{l}}^{+}$
the greater argmax of the problem in (1), for a given value of
$k_{\mathscr{l}}^{+}$
the greater argmax of the problem in (1), for a given value of $\mathscr{l}$
.
$\mathscr{l}$
.
We will study the behavior of $k_{\mathscr{l}}^{+}$
as
$k_{\mathscr{l}}^{+}$
as $\mathscr{l}$
varies, assuming a tie-breaking rule for the generic case in which our discrete optimization admits more solutions. In this case the decision maker will choose the highest optimizing value.
$\mathscr{l}$
varies, assuming a tie-breaking rule for the generic case in which our discrete optimization admits more solutions. In this case the decision maker will choose the highest optimizing value.
Finally, it is directly verifiable that in absence of the redistributive tax the problem (1) becomes simply:
 \begin{align*} f\!\left(k\right)-k\cdot p \end{align*}
and has a unique solution denoted by $k^{*}$
. In absence of the network tax the problem would be constrained for low values of
$k^{*}$
. In absence of the network tax the problem would be constrained for low values of $\mathscr{l}$
, and we call
$\mathscr{l}$
, and we call $k_{\mathscr{l}}^{*}=\min \{k^{*},\mathscr{l}\}$
the optimal solution for a decision maker who can call at most
$k_{\mathscr{l}}^{*}=\min \{k^{*},\mathscr{l}\}$
the optimal solution for a decision maker who can call at most $\mathscr{l}$
workers.
$\mathscr{l}$
workers.
3. Results
Proposition 1 is our main result and describes the optimal decision of agent $i$
. Its derivation, based on three lemmas, and its technical details are presented in Appendix A. We stress here that it is a very general and, to the best of our knowledge, an original result.
$i$
. Its derivation, based on three lemmas, and its technical details are presented in Appendix A. We stress here that it is a very general and, to the best of our knowledge, an original result.
Proposition 1.
Suppose that $k^{*}\geq 1, \Delta f(1)\gt p$
, and that there exists
$k^{*}\geq 1, \Delta f(1)\gt p$
, and that there exists $k^{\prime}$
such that for all
$k^{\prime}$
such that for all $k\gt k^{\prime}$
,
$k\gt k^{\prime}$
, $\Delta f(k)\lt p(1-c)^{k-1}$
, then there exist
$\Delta f(k)\lt p(1-c)^{k-1}$
, then there exist $\mathscr{l}^{\prime}$
and
$\mathscr{l}^{\prime}$
and $\mathscr{l}^{\prime\prime}\geq \mathscr{l}^{\prime}\geq k^{*}$
such that:
$\mathscr{l}^{\prime\prime}\geq \mathscr{l}^{\prime}\geq k^{*}$
such that:
-
• for any $\mathscr{l}\leq \mathscr{l}^{\prime}$
,
$k_{\mathscr{l}}^{+}=\mathscr{l}$
;
$\mathscr{l}\leq \mathscr{l}^{\prime}$
,
$k_{\mathscr{l}}^{+}=\mathscr{l}$
; -
• for
$\mathscr{l}\gt \mathscr{l}^{\prime\prime}$
, we have
$k_{\mathscr{l}}^{+}=0$
. -
• for
$\mathscr{l}^{\prime}\lt \mathscr{l}\leq \mathscr{l}^{\prime\prime}$
,
$0\lt k_{\mathscr{l}}^{+}\lt l$
and it is not increasing in
$\mathscr{l}$
.


So, up to a certain degree $\mathscr{l}^{\prime}$
, we have that
$\mathscr{l}^{\prime}$
, we have that $k_{\mathscr{l}}^{+}=\mathscr{l}$
, then
$k_{\mathscr{l}}^{+}=\mathscr{l}$
, then $k_{\mathscr{l}}^{+}$
decreases and it becomes null at
$k_{\mathscr{l}}^{+}$
decreases and it becomes null at $\mathscr{l}^{\prime\prime}$
. Figure 1 provides an intuition for the result, even if the figure is based on the case where both
$\mathscr{l}^{\prime\prime}$
. Figure 1 provides an intuition for the result, even if the figure is based on the case where both $\mathscr{l}$
and the solution to the problem in equation (1) are continuous.
$\mathscr{l}$
and the solution to the problem in equation (1) are continuous.
Graph of $k_{l}^{+}$
as a function of
$k_{l}^{+}$
as a function of $\mathscr{l}$
, in the continuous case.
$\mathscr{l}$
, in the continuous case.

Note also that the introduction of the redistributive tax causes a distortion in the optimal number $k_{\mathscr{l}}^{+}$
of employed workers. That is because the marginal redistributive tax
$k_{\mathscr{l}}^{+}$
of employed workers. That is because the marginal redistributive tax $\Delta g(k,\mathscr{l})$
can be positive or negative, and so the distortion on the labor sharing decision can be in the direction of either employing more or less neighbors, with respect to
$\Delta g(k,\mathscr{l})$
can be positive or negative, and so the distortion on the labor sharing decision can be in the direction of either employing more or less neighbors, with respect to $k_{\mathscr{l}}^{*}$
. Then, an important question is how the redistributive tax affects production compared to the optimal scenario without this informal taxation. The answer to this question is not straightforward because the effect of the redistributive tax on the individual optimization problem is not monotone. In the absence of redistributive tax, agent
$k_{\mathscr{l}}^{*}$
. Then, an important question is how the redistributive tax affects production compared to the optimal scenario without this informal taxation. The answer to this question is not straightforward because the effect of the redistributive tax on the individual optimization problem is not monotone. In the absence of redistributive tax, agent $i$
may choose to hire fewer network members (neighbors) to minimize information leakage about her increased output or hire more neighbors to reduce the number of unemployed individuals. However, agent
$i$
may choose to hire fewer network members (neighbors) to minimize information leakage about her increased output or hire more neighbors to reduce the number of unemployed individuals. However, agent $i$
is constrained by her small ego-network and cannot hire more people than she knows. This tradeoff is addressed by the following corollary (where
$i$
is constrained by her small ego-network and cannot hire more people than she knows. This tradeoff is addressed by the following corollary (where $\mathscr{l}$
’ and
$\mathscr{l}$
’ and $\mathscr{l}$
’’ refer to those from Proposition 1). As a benchmark, we use
$\mathscr{l}$
’’ refer to those from Proposition 1). As a benchmark, we use $k_{\mathscr{l}}^{*}$
, defined above, which is the solution to problem (1) without the network tax.
$k_{\mathscr{l}}^{*}$
, defined above, which is the solution to problem (1) without the network tax.
Corollary 1.
Suppose that $k^{*}\geq 1$
and that there exists
$k^{*}\geq 1$
and that there exists $k^{\prime}$
such that for all
$k^{\prime}$
such that for all $k\gt k^{\prime}$
,
$k\gt k^{\prime}$
, $\Delta f(k)\lt{} p(1-c)^{k-1}$
then there exists an integer
$\Delta f(k)\lt{} p(1-c)^{k-1}$
then there exists an integer $\underline{\mathscr{l}}$
with
$\underline{\mathscr{l}}$
with $\mathscr{l}^{\prime}\leq \underline{\mathscr{l}}\leq \mathscr{l}^{\prime\prime}$
such that:
$\mathscr{l}^{\prime}\leq \underline{\mathscr{l}}\leq \mathscr{l}^{\prime\prime}$
such that:
-
• if
$\underline{\mathscr{l}}\geq \mathscr{l}$
,
$k_{\mathscr{l}}^{+}\geq k_{\mathscr{l}}^{*}$
; -
• otherwise
$k_{\mathscr{l}}^{+}\lt k_{\mathscr{l}}^{*}$
.


So, for an intermediate range of degree $\mathscr{l}$
, the redistributive tax influences the hiring decision by favoring the employment of more neighbors compared to the benchmark case. Outside this range, agent
$\mathscr{l}$
, the redistributive tax influences the hiring decision by favoring the employment of more neighbors compared to the benchmark case. Outside this range, agent $i$
requests help from fewer neighbors compared to the benchmark case, with
$i$
requests help from fewer neighbors compared to the benchmark case, with $\mathscr{l}\geq \mathscr{l}^{\prime\prime}$
being the degenerate case of not using any neighbors at all. Figure 1 provides an intuitive explanation for the result, based on the continuous approximation. For values of degree up to
$\mathscr{l}\geq \mathscr{l}^{\prime\prime}$
being the degenerate case of not using any neighbors at all. Figure 1 provides an intuitive explanation for the result, based on the continuous approximation. For values of degree up to $\mathscr{l}^{\prime}$
, all neighbors are employed. But this is inefficient for all degree larger than
$\mathscr{l}^{\prime}$
, all neighbors are employed. But this is inefficient for all degree larger than $k^{*}$
. Then, for values of degree larger than
$k^{*}$
. Then, for values of degree larger than $\mathscr{l}^{\prime}$
, the optimal number of hirings reduces and may remain inefficiently high for intermediate values of the degree (lower than
$\mathscr{l}^{\prime}$
, the optimal number of hirings reduces and may remain inefficiently high for intermediate values of the degree (lower than $\underline{\mathscr{l}})$
. For larger values of degree it becomes inefficiently low and may cover the case where the number of hirings is null.
$\underline{\mathscr{l}})$
. For larger values of degree it becomes inefficiently low and may cover the case where the number of hirings is null.
Note that the assumption $\Delta f(1)\gt p$
eliminates the case where the solution of the problem is equal to
$\Delta f(1)\gt p$
eliminates the case where the solution of the problem is equal to $0$
for all
$0$
for all $\mathscr{l}$
.Footnote
9
$\mathscr{l}$
.Footnote
9
The second condition on the production, namely that $\Delta f(k)\lt p(1-c)^{k-1}$
for any
$\Delta f(k)\lt p(1-c)^{k-1}$
for any $k\gt k^{\prime}$
, only states that in some point the marginal revenues must become smaller than marginal costs. This is a plausible assumption for all production processes characterized by congestion problems, when there is even a value of
$k\gt k^{\prime}$
, only states that in some point the marginal revenues must become smaller than marginal costs. This is a plausible assumption for all production processes characterized by congestion problems, when there is even a value of $k$
such that an additional unit of
$k$
such that an additional unit of $k$
causes a reduction in the production level (so, the assumption is consistent with negative marginal revenues). This assumption is eliminating the case where the solution of the problem is always equal to
$k$
causes a reduction in the production level (so, the assumption is consistent with negative marginal revenues). This assumption is eliminating the case where the solution of the problem is always equal to $\mathscr{l}$
for any size of the ego-network, which happens when the marginal revenues are so high that hiring everyone is always the best solution.Footnote
10
$\mathscr{l}$
for any size of the ego-network, which happens when the marginal revenues are so high that hiring everyone is always the best solution.Footnote
10
Remember that clustering is a network statistic that in the context of this model can be interpreted as the risk of leakage of information from a hired worker to a non-hired one. If we study comparative statics on clustering, we see that when $c$
increases, implying a higher risk of leakage of information, then the inefficiencies due to the network tax are higher, because
$c$
increases, implying a higher risk of leakage of information, then the inefficiencies due to the network tax are higher, because $\mathscr{l}^{\prime}$
increases and
$\mathscr{l}^{\prime}$
increases and $\mathscr{l}^{\prime\prime}$
decreases, and there are more values of
$\mathscr{l}^{\prime\prime}$
decreases, and there are more values of $\mathscr{l}$
for which inefficient hiring, either too much or too low, happens. This result is formalized in the following corollary. Let us call, from Proposition 1, the thresholds
$\mathscr{l}$
for which inefficient hiring, either too much or too low, happens. This result is formalized in the following corollary. Let us call, from Proposition 1, the thresholds $\mathscr{l}^{\prime\prime}(c)$
and
$\mathscr{l}^{\prime\prime}(c)$
and $\mathscr{l}^{\prime}(c)$
corresponding to some clustering coefficient
$\mathscr{l}^{\prime}(c)$
corresponding to some clustering coefficient $c$
.
$c$
.
Corollary 2.
Consider two values of parameter $c$
:
$c$
: $c^{\prime\prime} \gt c^{\prime}$
. Suppose that
$c^{\prime\prime} \gt c^{\prime}$
. Suppose that $\Delta f(1)\gt p$
, and that there exists
$\Delta f(1)\gt p$
, and that there exists $k^{\prime}$
such that for all
$k^{\prime}$
such that for all $k\gt k^{\prime}$
,
$k\gt k^{\prime}$
, $\Delta f(k)\lt p(1-c^{\prime\prime})^{k-1}$
. Then we have
$\Delta f(k)\lt p(1-c^{\prime\prime})^{k-1}$
. Then we have $\mathscr{l}^{\prime}(c^{\prime\prime})\geq \mathscr{l}^{\prime}(c^{\prime})$
and
$\mathscr{l}^{\prime}(c^{\prime\prime})\geq \mathscr{l}^{\prime}(c^{\prime})$
and $\mathscr{l}^{\prime\prime}(c^{\prime\prime})\leq \mathscr{l}^{\prime\prime}(c^{\prime})$
.
$\mathscr{l}^{\prime\prime}(c^{\prime\prime})\leq \mathscr{l}^{\prime\prime}(c^{\prime})$
.
4. Extensions
One implicit assumption of the model is that only one agent within a given network receives the new production technology. An important question to consider is what happens if multiple agents receive the new production technology. In this case, individuals do not know who has received the new technology. However, they are aware that their neighbors and their neighbor’s neighbors could be endowed with the new technology. In such a case, we can observe the following effects:
-
1. With some probability, the individual entering into a labor sharing agreement with the agent will also be endowed with the new technology, resulting in a lower expected payment from the labor sharing arrangement since the individual has sufficient yield on their own.
-
2. With some probability, the individual entering into a labor sharing agreement with the agent will have another connection endowed with the new technology, leading to a lower expected payment from the labor sharing agreement as there are multiple sources from which the individual may request support. Therefore, the redistributive tax on an agent will be lower because there are greater yields in the network overall.
-
3. With some probability, the individual entering into a labor sharing agreement with the agent either works or has worked with other people endowed with the new technology. Therefore the expected marginal revenue is increased through knowledge transfer.
Our model can take into account all these effects by simply changing the parameter values. The effects in points 1 and 2 are analogous to reducing parameter $p$
. The effect in point 3 could induce higher marginal revenues, and we discuss it in Appendix B, where we show that if we remove the assumption that only a single agent receives the new production technology, the main results are unchanged.
$p$
. The effect in point 3 could induce higher marginal revenues, and we discuss it in Appendix B, where we show that if we remove the assumption that only a single agent receives the new production technology, the main results are unchanged.
A second important question is how the inclusion of social preferences in the utility function of agent $i$
may affect the results. As a first exercise, in Appendix C, we figure out what happens if agent
$i$
may affect the results. As a first exercise, in Appendix C, we figure out what happens if agent $i$
is characterized by preferences a la Fehr and Schimdt (Reference Fehr and Schmidt1999), that is, a situation where differences between the payoff of player
$i$
is characterized by preferences a la Fehr and Schimdt (Reference Fehr and Schmidt1999), that is, a situation where differences between the payoff of player $i$
and payoffs of the neighbors produce negative externalities on agent
$i$
and payoffs of the neighbors produce negative externalities on agent $i$
’s utility. In our model the utility of player
$i$
’s utility. In our model the utility of player $i$
is given by:
$i$
is given by:
 \begin{align*} \pi _{i}=x_{i}-\frac{\beta }{\mathscr{l}}\left(\sum _{j\in N_{i}}x_{i}-x_{j}\right)=x_{i}\left(1-\beta \right)+\frac{\beta }{\mathscr{l}}\left(\sum _{j\in N_{i}}x_{j}\right) \end{align*}
where $0\leq \beta \lt 1$
and
$0\leq \beta \lt 1$
and $x_{k}$
denotes the amount of resources of player
$x_{k}$
denotes the amount of resources of player $k$
.
$k$
.
With this utility function we show that when social preferences are strong enough (i.e., $\beta$
is high enough), agent
$\beta$
is high enough), agent $i$
hires more neighbors respect to the case of no social preferences (i.e.,
$i$
hires more neighbors respect to the case of no social preferences (i.e., $\beta =0$
). Furthermore, we prove that when social preferences are sufficiently high but not too extreme, our results qualitatively hold at a higher level of employment, that is, the two thresholds
$\beta =0$
). Furthermore, we prove that when social preferences are sufficiently high but not too extreme, our results qualitatively hold at a higher level of employment, that is, the two thresholds $\mathscr{l}^{\prime}$
and
$\mathscr{l}^{\prime}$
and $\mathscr{l}^{\prime\prime}$
increase.
$\mathscr{l}^{\prime\prime}$
increase.
Finally, we conclude that the effect of social preferences strongly depends on the way we include them in the utility function. Indeed, it is easy to check that if agent $i$
is a minimum maximizer (Rawlsian utility function) he will hire the highest number of neighbors until there is no one with less resources than him.
$i$
is a minimum maximizer (Rawlsian utility function) he will hire the highest number of neighbors until there is no one with less resources than him.
5. Empirical support
This section relates our theoretical results to the empirical understanding of how social network interactions are affected by receiving a more productive technology and by the size of the social network. Specifically, our aim is to test the empirical validity of the non-monotonicity prediction described in Proposition 1 and illustrated in Figure 1.
The ideal data to test this prediction are those collected in the field experiment conducted in villages located in rural Tanzania, as reported in Di Falco et al (Reference Di Falco, Feri, Pin and Vollenweider2018). In this experiment, the treatment group received a more productive improved variety of maize seeds, with productivity up to five times higher than the traditional variety, while the control group received the common traditional variety. Experimenters ran two surveys,Footnote 11 collecting data on the characteristics of the participants as well as their behavior and interactions with others.
We run a simple regression where the dependent variable $k_{i}$
is the number of people the farmer
$k_{i}$
is the number of people the farmer $i$
asked for help on his farm and where the dependent variables
$i$
asked for help on his farm and where the dependent variables $N_{i}$
and
$N_{i}$
and $N_{i}^{2}$
are, respectively, the size of the farmer’s network and its square, measured by the number of relatives living in the same village. We thus estimate the following:
$N_{i}^{2}$
are, respectively, the size of the farmer’s network and its square, measured by the number of relatives living in the same village. We thus estimate the following:
 \begin{align*} k_{i}=\beta _{0}+\beta _{N1}N_{i}+\beta _{N2}N_{i}^{2}+e_{i} \end{align*}
where $e_{i}$
is the farmer
$e_{i}$
is the farmer $i\mathrm{^{\prime}}$
s error term. We estimate separate regressions both for the treatment and the control group. In all the estimations we include village and region fixed effects to control for important institutional, environmental and climatic conditions that may affect farming. In some specifications we also add a battery of controls.Footnote
12
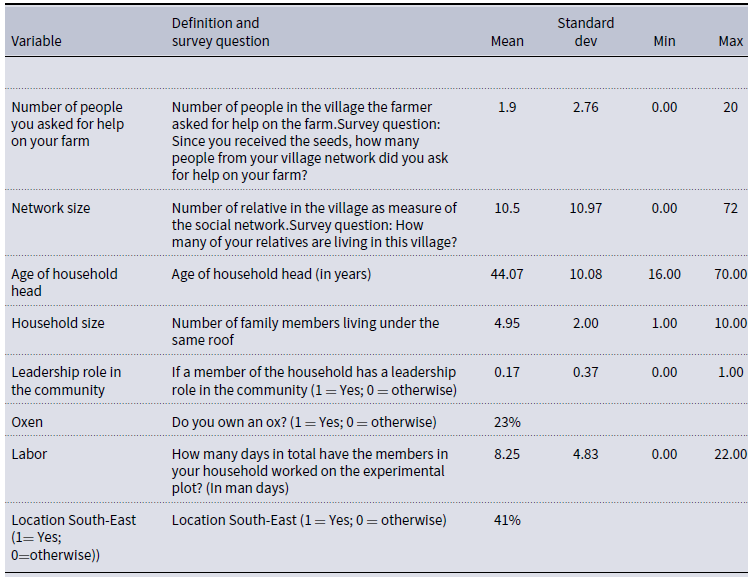
These include individual and farm characteristics such as age of the household head, household size, oxen (dummy) and labor, and if the head is a leader in farmer association (dummy). The descriptive statistics are reported in the Table D1 in Appendix D. Given the count nature of the left-hand side variable we estimate a Poisson regression. We further probe the analysis via estimating it with a Zero Inflated Poisson (ZIP) to take account of the large frequency of zeros (40 percent of the sample), and a simple OLS. Results are largely consistent and are reported in the following Table 1.
$i\mathrm{^{\prime}}$
s error term. We estimate separate regressions both for the treatment and the control group. In all the estimations we include village and region fixed effects to control for important institutional, environmental and climatic conditions that may affect farming. In some specifications we also add a battery of controls.Footnote
12
These include individual and farm characteristics such as age of the household head, household size, oxen (dummy) and labor, and if the head is a leader in farmer association (dummy). The descriptive statistics are reported in the Table D1 in Appendix D. Given the count nature of the left-hand side variable we estimate a Poisson regression. We further probe the analysis via estimating it with a Zero Inflated Poisson (ZIP) to take account of the large frequency of zeros (40 percent of the sample), and a simple OLS. Results are largely consistent and are reported in the following Table 1.
Regression of number of helpers sought for with respect to the farmer’s network

Village clustered and corrected for small cluster size standard errors in parenthesis. Significance codes: *p < 0.10, **p < 0.05, ***p < 0.01.
The coefficient of quadratic term is negative in the treatment group for all estimates and it is significant in three of them. We note also that in the control group the coefficient of the quadratic term is positive and significant in only one estimate. This is consistent with the theory developed in the first part of this paper, as the positive coefficient on the linear term and the negative coefficient on the quadratic term indicate a non-monotonic inverted U-shape relationship. We could interpret this preliminary empirical evidence as support to our theory.
6. Concluding remarks
In this paper, we presented a theoretical model to explain the empirical evidence of the economic implications of social pressure to share resources in the developing world. We framed the issue by a model where information on income shocks diffuses in the social network. We show that level of clustering of the social network affects the individual’s decisions on the social interactions to engage in. The model predicts that when individuals have many neighbors, seeking to reduce redistributive pressure from other network members may decrease their social interactions, including those interactions that could have led to increased output. On the opposite side are the individuals with few connections that engage in all possible social interactions. These results align with the data collected in the field experiment presented in Di Falco et al (Reference Di Falco, Feri, Pin and Vollenweider2018). Unlike their approach, we estimate a nonlinear equation that includes the square of the network size. Our findings reveal that, in the treatment group (i.e., farmers who have received the new and more productive technology), social interactions exhibit a concave relationship with network size, which is perfectly aligned with the results of our model.
Finally, we like to stress that our theoretical model can be applied to other settings. For example, it can describe situations where individuals receive an income shock and faces a trade-off between enjoying the sharing of the additional resources with some agents of their social network and be worried about the fact that the information spread to some of their social contacts in need for resources (they may be asked for financial assistance). Other applications are those where an individual learns a new skill and face a trade-off between to exploit the new skill and to provide it for free to the closest friends and relatives.
Data availability statement
The data used in this paper are from Di Falco et al., Reference Di Falco, Feri, Pin and Vollenweider2018, and are available on the website of the journal in the additional material.
Competing interests
The authors declare that they have no known competing financial interests or personal relationships that could have appeared to influence the work reported in this paper.
Financial support
Francesco Feri acknowledges financial support from the Leverhulme Trust Grant Award RPG-2021-359.
Appendix A: Proofs
The following remark just poses local optimality conditions: a point must not be worse than its left–most adjacent point and strictly better than its rightmost adjacent point.
Remark 1.
A necessary condition for $k_{l}^{+}\in \{0,\ldots ,\mathscr{l}\}$
to be a greater optimum for agent i’s problem is that, when defined,
$k_{l}^{+}\in \{0,\ldots ,\mathscr{l}\}$
to be a greater optimum for agent i’s problem is that, when defined,
 \begin{align}\Delta f\!\left(k_{\mathscr{l}}^{+}\right)\geq p+\Delta g\!\left(k_{\mathscr{l}}^{+},\mathscr{l}\right)=p\!\left(1-c\right)^{k_{\mathscr{l}}^{+}-1}\left(1+c\!\left(\mathscr{l}-k_{\mathscr{l}}^{+}\right)\right)\\[-32pt] \nonumber \end{align}
 \begin{align}\Delta f\!\left(k_{\mathscr{l}}^{+}+1\right)\lt p+\Delta g\!\left(k_{\mathscr{l}}^{+}+1,\mathscr{l}\right)=p\!\left(1-c\right)^{k_{\mathscr{l}}^{+}}\left(1+c\!\left(\mathscr{l}-k_{\mathscr{l}}^{+}-1\right)\right)\end{align}
In the statement, ‘when defined’ means that when $k_{\mathscr{l}}^{+}=0$
then (3) is not defined and only (4) must hold; when instead
$k_{\mathscr{l}}^{+}=0$
then (3) is not defined and only (4) must hold; when instead $k_{\mathscr{l}}^{+}=\mathscr{l}$
then (4) is not defined and only (3) must hold. Now, we propose some lemmas that will help us in analyzing the comparative statics of the optimization problem in (1), with respect to
$k_{\mathscr{l}}^{+}=\mathscr{l}$
then (4) is not defined and only (3) must hold. Now, we propose some lemmas that will help us in analyzing the comparative statics of the optimization problem in (1), with respect to $\mathscr{l}$
.
$\mathscr{l}$
.
Lemma 1.
If for some $\mathscr{l}^{\prime}$
,
$\mathscr{l}^{\prime}$
, $k_{\mathscr{l}^{\prime}}^{+}=\mathscr{l}^{\prime}$
, then
$k_{\mathscr{l}^{\prime}}^{+}=\mathscr{l}^{\prime}$
, then $k_{\mathscr{l}^{\prime}-1}^{+}=\mathscr{l}^{\prime}-1$
.
$k_{\mathscr{l}^{\prime}-1}^{+}=\mathscr{l}^{\prime}-1$
.
Proof. Since $k_{\mathscr{l}^{\prime}}^{+}=\mathscr{l}^{\prime}$
, for any
$k_{\mathscr{l}^{\prime}}^{+}=\mathscr{l}^{\prime}$
, for any $k\in \{0,1,\ldots \mathscr{l}^{\prime}-1\}$
, we have
$k\in \{0,1,\ldots \mathscr{l}^{\prime}-1\}$
, we have
 \begin{align*} f\!\left(\mathscr{l}^{\prime}\right)-p\cdot \mathscr{l}^{\prime}\geq f\!\left(k\right)-p\cdot k-p\left(\mathscr{l}^{\prime}-k\right)\left(1-\left(1-c\right)^{k}\right) \end{align*}
otherwise $k_{\mathscr{l}^{\prime}}^{+}=\mathscr{l}^{\prime}$
would not be a maximum for
$k_{\mathscr{l}^{\prime}}^{+}=\mathscr{l}^{\prime}$
would not be a maximum for $\mathscr{l}^{\prime}$
. This expression becomes:
$\mathscr{l}^{\prime}$
. This expression becomes:
 \begin{align}\frac{f\!\left(\mathscr{l}^{\prime}\right)-f\!\left(k\right)}{\mathscr{l}^{\prime}-k}\geq p-p\!\left(1-\left(1-c\right)^{k}\right)\end{align}
Note that the left-hand side is the average of the marginal revenues between $\mathscr{l}^{\prime}$
and
$\mathscr{l}^{\prime}$
and $k$
. Now suppose that
$k$
. Now suppose that $k_{\mathscr{l}^{\prime}-1}^{+}=k^{\prime}\lt \mathscr{l}^{\prime}-1$
. Then we have:
$k_{\mathscr{l}^{\prime}-1}^{+}=k^{\prime}\lt \mathscr{l}^{\prime}-1$
. Then we have:
 \begin{align*} f\!\left(\mathscr{l}^{\prime}-1\right)-p\!\left(\mathscr{l}^{\prime}-1\right)\lt f\left(k^{\prime}\right)-p\cdot k^{\prime}-p\!\left(\mathscr{l}^{\prime}-1-k^{\prime}\right)\left(1-\left(1-c\right)^{k^{\prime}}\right), \end{align*}
This expression can be rewritten as:
 \begin{align}\frac{f\!\left(\mathscr{l}^{\prime}-1\right)-f\!\left(k^{\prime}\right)}{\mathscr{l}^{\prime}-1-k^{\prime}}\lt p-p\!\left(1-\left(1-c\right)^{k^{\prime}}\right)\end{align}
Note that the left-hand sides of (5) and (6) are decreasing in $l$
. Then, we can write
$l$
. Then, we can write
 \begin{align*} \frac{f\!\left(\mathscr{l}^{\prime}\right)-f\!\left(k^{\prime}\right)}{\mathscr{l}^{\prime}-k^{\prime}}\leq \frac{f\left(\mathscr{l}^{\prime}-1\right)-f\left(k^{\prime}\right)}{\mathscr{l}^{\prime}-1-k^{\prime}}\lt p-p\!\left(1-\left(1-c\right)^{k^{\prime}}\right) \end{align*}
The inequality is strict, because it is obtained combining inequality (5) (weak) with inequality (6) (strict). So, it is in contradiction with the condition in (5) (just relabeling $k$
as
$k$
as $k^{\prime}$
).
$k^{\prime}$
).
Lemma 2.
Suppose that $k_{\mathscr{l}}^{+}\lt \mathscr{l}$
. Then
$k_{\mathscr{l}}^{+}\lt \mathscr{l}$
. Then $k_{\mathscr{l}+1}^{+}\leq k_{\mathscr{l}}^{+}$
.
$k_{\mathscr{l}+1}^{+}\leq k_{\mathscr{l}}^{+}$
.
Proof. Call $x=k_{\mathscr{l}}^{+}$
. First of all, we have
$x=k_{\mathscr{l}}^{+}$
. First of all, we have
 \begin{align*} f\!\left(x\right)-p\cdot x-g\!\left(x,\mathscr{l}\right)\gt f\!\left(k\right)-p\cdot k-g\!\left(k,\mathscr{l}\right)\forall k\in \left\{x+1,\ldots \mathscr{l}\right\} \end{align*}
otherwise, x would not be the maximal optimum for $l$
. Now let us compare any
$l$
. Now let us compare any $k\in \{x+1,\ldots \mathscr{l}\}$
against
$k\in \{x+1,\ldots \mathscr{l}\}$
against $x$
for
$x$
for $\mathscr{l}+1$
. The above inequality can be written as:
$\mathscr{l}+1$
. The above inequality can be written as:
 \begin{align*}f\!\left(k\right)-f\!\left(x\right)\lt g\!\left(k,\mathscr{l}\right)-g\!\left(x,\mathscr{l}\right)+p\!\left(k-x\right)\forall k\in \left\{x+1,\ldots \mathscr{l}\right\}\end{align*}
It holds also for any $\mathscr{l}^{\prime}\gt \mathscr{l}$
(including
$\mathscr{l}^{\prime}\gt \mathscr{l}$
(including $\mathscr{l}+1$
) since the left-hand side does not change with
$\mathscr{l}+1$
) since the left-hand side does not change with $\mathscr{l}$
while the right-hand side increases with
$\mathscr{l}$
while the right-hand side increases with $\mathscr{l}$
because
$\mathscr{l}$
because $\frac{\partial \left(g\left(k,\mathscr{l}\right)-g\left(x,\mathscr{l}\right)\right)}{\partial l}=p\left(\left(1-c\right)^{x}-\left(1-c\right)^{k}\right)\gt 0$
. It must be that for
$\frac{\partial \left(g\left(k,\mathscr{l}\right)-g\left(x,\mathscr{l}\right)\right)}{\partial l}=p\left(\left(1-c\right)^{x}-\left(1-c\right)^{k}\right)\gt 0$
. It must be that for $\mathscr{l}^{\prime}+1$
the only candidate against
$\mathscr{l}^{\prime}+1$
the only candidate against $x$
and greater than
$x$
and greater than $x$
for being a solution is
$x$
for being a solution is $k=\mathscr{l}^{\prime}+1$
. Now assume that
$k=\mathscr{l}^{\prime}+1$
. Now assume that $k_{l+1}^{+}=\mathscr{l}+1$
. This is in contradiction with the assumption
$k_{l+1}^{+}=\mathscr{l}+1$
. This is in contradiction with the assumption $k_{\mathscr{l}}^{+}\lt \mathscr{l}$
and with the result in Lemma 1.
$k_{\mathscr{l}}^{+}\lt \mathscr{l}$
and with the result in Lemma 1.
This last result allows us to state that, when for a given $\mathscr{l}$
, say
$\mathscr{l}$
, say $\mathscr{l}^{\prime\prime}$
, the solution of the problem is not hiring anyone, then the same solution is applied to all problems with
$\mathscr{l}^{\prime\prime}$
, the solution of the problem is not hiring anyone, then the same solution is applied to all problems with $\mathscr{l}\gt \mathscr{l}^{\prime\prime}$
. The following Lemma states sufficient conditions for the existence of such
$\mathscr{l}\gt \mathscr{l}^{\prime\prime}$
. The following Lemma states sufficient conditions for the existence of such $\mathscr{l}^{\prime\prime}$
.
$\mathscr{l}^{\prime\prime}$
.
Lemma 3.
Assume there exists $k^{\prime}$
such that for all
$k^{\prime}$
such that for all $k\gt k^{\prime}$
,
$k\gt k^{\prime}$
, $\Delta f(k)\lt p(1-c)^{k-1}$
. Then there exist
$\Delta f(k)\lt p(1-c)^{k-1}$
. Then there exist $\mathscr{l}^{\prime\prime}$
such that for all
$\mathscr{l}^{\prime\prime}$
such that for all $\mathscr{l}\geq \mathscr{l}^{\prime\prime}$
,
$\mathscr{l}\geq \mathscr{l}^{\prime\prime}$
, $k_{\mathscr{l}}^{+}=0$
.
$k_{\mathscr{l}}^{+}=0$
.
Proof. For any $k\gt k^{\prime}$
, condition (3) never holds, because for any
$k\gt k^{\prime}$
, condition (3) never holds, because for any $\mathscr{l}\geq k$
we have
$\mathscr{l}\geq k$
we have
 \begin{align*} \Delta f\!\left(k\right)\lt p\!\left(1-c\right)^{k-1}\leq p\!\left(1-c\right)^{k-1}\left(1+c\cdot \left(\mathscr{l}-k\right)\right) \end{align*}
For any $k$
such that
$k$
such that $0\lt k\leq k^{\prime}$
, there is always an
$0\lt k\leq k^{\prime}$
, there is always an $\mathscr{l}_{k}$
such that condition (3) does not hold, because the right-hand side of that condition is linearly increasing in
$\mathscr{l}_{k}$
such that condition (3) does not hold, because the right-hand side of that condition is linearly increasing in $\mathscr{l}$
.
$\mathscr{l}$
.
As a result of the three lemmas, we have that $k_{\mathscr{l}}^{+}$
increases in
$k_{\mathscr{l}}^{+}$
increases in $\mathscr{l}$
as long as
$\mathscr{l}$
as long as $\mathscr{l}$
is small (hiring everyone), then, as an interior solution, it decreases in
$\mathscr{l}$
is small (hiring everyone), then, as an interior solution, it decreases in $\mathscr{l}$
under certain conditions, up to the point that the unique solution is not hiring anyone.
$\mathscr{l}$
under certain conditions, up to the point that the unique solution is not hiring anyone.
Proof of Proposition 1. The assumption $\Delta f(1)\gt p$
implies that
$\Delta f(1)\gt p$
implies that $k_{1}^{+}=1$
. This is enough to prove that
$k_{1}^{+}=1$
. This is enough to prove that $\mathscr{l}^{\prime}$
exists and that it is at least equal one. The behavior of the maximum up to
$\mathscr{l}^{\prime}$
exists and that it is at least equal one. The behavior of the maximum up to $\mathscr{l}^{\prime}$
is given by Lemma 1.
$\mathscr{l}^{\prime}$
is given by Lemma 1. $\mathscr{l}^{\prime\prime}$
exists because of Lemma 3. Note that because of Lemma 2, if
$\mathscr{l}^{\prime\prime}$
exists because of Lemma 3. Note that because of Lemma 2, if $k_{\mathscr{l}}^{+}=0$
, then
$k_{\mathscr{l}}^{+}=0$
, then $k_{\lambda }^{+}=0$
for any
$k_{\lambda }^{+}=0$
for any $\lambda \gt \mathscr{l}$
. If
$\lambda \gt \mathscr{l}$
. If $\mathscr{l}^{\prime\prime}\gt \mathscr{l}^{\prime}$
, then there is an interval which exhibits internal solutions and the result is coming from Lemma 2.
$\mathscr{l}^{\prime\prime}\gt \mathscr{l}^{\prime}$
, then there is an interval which exhibits internal solutions and the result is coming from Lemma 2.
Proof of Corollary 1. The condition $k_{\mathscr{l}}^{*}\geq 1\forall \mathscr{l}\geq 1$
implies
$k_{\mathscr{l}}^{*}\geq 1\forall \mathscr{l}\geq 1$
implies $\Delta f(1)\gt p$
, so that we meet the conditions of Proposition 1 and we can use its results. Up to
$\Delta f(1)\gt p$
, so that we meet the conditions of Proposition 1 and we can use its results. Up to $\mathscr{l}^{\prime}$
,
$\mathscr{l}^{\prime}$
, $k_{\mathscr{l}}^{+}=\mathscr{l}.$
If
$k_{\mathscr{l}}^{+}=\mathscr{l}.$
If $\mathscr{l}^{\prime}=k^{*}$
, then by Proposition 1,
$\mathscr{l}^{\prime}=k^{*}$
, then by Proposition 1, $k_{\mathscr{l}}^{+}$
cannot increase with
$k_{\mathscr{l}}^{+}$
cannot increase with $\mathscr{l}$
, and we set
$\mathscr{l}$
, and we set $\underline{\mathscr{l}}$
as the greatest
$\underline{\mathscr{l}}$
as the greatest $\mathscr{l}$
for which
$\mathscr{l}$
for which $k_{\mathscr{l}}^{+}=k^{*}$
, that is,
$k_{\mathscr{l}}^{+}=k^{*}$
, that is, $\underline{\mathscr{l}}=\mathscr{l}^{\prime}$
. If instead
$\underline{\mathscr{l}}=\mathscr{l}^{\prime}$
. If instead $\mathscr{l}^{\prime}\gt k^{*}$
, by Proposition 1,
$\mathscr{l}^{\prime}\gt k^{*}$
, by Proposition 1, $k_{\mathscr{l}}^{+}\gt k^{*}$
only up to a certain point, because it will increase until
$k_{\mathscr{l}}^{+}\gt k^{*}$
only up to a certain point, because it will increase until $\mathscr{l}^{\prime}$
and then decrease to
$\mathscr{l}^{\prime}$
and then decrease to $0$
in
$0$
in $\mathscr{l}^{\prime\prime}$
. Similarly to what was done for the previous case, we set
$\mathscr{l}^{\prime\prime}$
. Similarly to what was done for the previous case, we set $\underline{\mathscr{l}}$
as the greatest
$\underline{\mathscr{l}}$
as the greatest $\mathscr{l}$
for which
$\mathscr{l}$
for which $k_{\mathscr{l}}^{+}\geq k^{*}$
. It is straightforward that in this case
$k_{\mathscr{l}}^{+}\geq k^{*}$
. It is straightforward that in this case $\mathscr{l}^{\prime}\leq \underline{\mathscr{l}}\lt \mathscr{l}^{\prime\prime}$
. In this way we have identified
$\mathscr{l}^{\prime}\leq \underline{\mathscr{l}}\lt \mathscr{l}^{\prime\prime}$
. In this way we have identified $\underline{\mathscr{l}}$
for both cases.
$\underline{\mathscr{l}}$
for both cases.
Proof of Corollary 2. The statement of the proof guarantees that Proposition 1 holds for both $c^{\prime}$
and
$c^{\prime}$
and $c^{\prime\prime}$
. From inequality (5) in the proof of Lemma 1, if
$c^{\prime\prime}$
. From inequality (5) in the proof of Lemma 1, if $c$
increases then
$c$
increases then $\mathscr{l}^{\prime}$
cannot decrease. From the first inequality in the proof of Lemma 3, instead, if
$\mathscr{l}^{\prime}$
cannot decrease. From the first inequality in the proof of Lemma 3, instead, if $c$
increases then
$c$
increases then $\mathscr{l}^{\prime}$
cannot increase.
$\mathscr{l}^{\prime}$
cannot increase.
Appendix B: More individuals receive the new technology
What if more individuals receive the new technology? We can for example consider the case in which, as in our original experiment, ex ante each individual has an i.i.d. probability $\sigma$
to receive this shock.
$\sigma$
to receive this shock.
We can then consider the interim problem of an individual who has received the new technology and has to decide how many other individuals to work on it. The intuition is that in this case we have more wealth, and the redistributive pressure is lower, and this is indeed what happens.
Consider a generic individual $j$
that
$j$
that $i$
could have hired but does not. Denote by
$i$
could have hired but does not. Denote by $\varphi$
the probability that
$\varphi$
the probability that $j$
is informed about
$j$
is informed about $i$
and that he has either the new technology or is helped by others. The probability that
$i$
and that he has either the new technology or is helped by others. The probability that $j$
is helped by others requires a tie-breaking rule, determining who
$j$
is helped by others requires a tie-breaking rule, determining who $j$
will actually ask help to. In any case, it is not negative, and it depends positively on
$j$
will actually ask help to. In any case, it is not negative, and it depends positively on $\sigma$
, because if
$\sigma$
, because if $\sigma$
increases, more wealth is injected in the economy, and it is more likely that
$\sigma$
increases, more wealth is injected in the economy, and it is more likely that $j$
needs no help.
$j$
needs no help.
We can note however that, if we assume, as is natural, that the information diffusion processes of positive shocks from different individuals are independent, this probability is independent on $\mathscr{l}$
and
$\mathscr{l}$
and $k$
, as long as
$k$
, as long as $k$
is not null (in that case it would not be defined, and we can set it to zero). To be more precise, the informal tax imposed on a hypothetical individual
$k$
is not null (in that case it would not be defined, and we can set it to zero). To be more precise, the informal tax imposed on a hypothetical individual $i$
receiving a positive shock would be:
$i$
receiving a positive shock would be:
 \begin{align*} g(k,\mathscr{l})=p(\mathscr{l}-k)(1-(1-c)^{k} )(1-\varphi ). \end{align*}
If we denote $p(1-\varphi )=p^{\prime}$
it is straightforward that all proofs remain unchanged.
$p(1-\varphi )=p^{\prime}$
it is straightforward that all proofs remain unchanged.
Indeed, it is possible to check that the effect of having possibly more individuals hit by a positive shock would be qualitatively the same as if we reduce $p$
, which also would reduce the network tax for individual
$p$
, which also would reduce the network tax for individual $i$
.
$i$
.
Appendix C: Other regarding preferences
We consider utilities that follow the Fehr and Schmidt (Reference Fehr and Schmidt1999) specification where the utility of an individual $i$
is
$i$
is
 \begin{align*}U_{i}\left(\pi _{i}, \pi _{j}\right)=\pi _{i}-\frac{\alpha _{i}}{n_{i}}\cdot \sum _{j\in N_{i}}\max \left\{\pi _{j}-\pi _{i},0\right\}-\frac{\beta _{i}}{n_{i}}\cdot \sum _{j\in N_{i}}\max \left\{\pi _{i}-\pi _{j},0\right\}\end{align*}
where $0\leq \beta _{i}\lt 1$
,
$0\leq \beta _{i}\lt 1$
, $\beta _{i}\leq \alpha _{i}$
,
$\beta _{i}\leq \alpha _{i}$
, $\pi _{i}$
and
$\pi _{i}$
and $\pi _{j}$
are the payoffs of, respectively, individuals
$\pi _{j}$
are the payoffs of, respectively, individuals $i$
and
$i$
and $j\in N_{i}$
and
$j\in N_{i}$
and $N_{i}$
is the set of players that individual
$N_{i}$
is the set of players that individual $i$
use as reference (
$i$
use as reference ( $n_{i}$
is its cardinality).
$n_{i}$
is its cardinality).
Applying this utility function to our model, and assuming that individual $i$
has more resources than his neighbors, his utility is
$i$
has more resources than his neighbors, his utility is
 \begin{align*} \pi _{i}=x_{i}-\frac{\beta }{\mathscr{l}}\sum _{j\in N_{i}}\left(x_{i}-x_{j}\right)=x_{i}\left(1-\beta \right)+\frac{\beta }{\mathscr{l}}\sum _{j\in N_{i}}x_{j} \end{align*}
where $x_{k}$
denotes the expected amount of resources for individual
$x_{k}$
denotes the expected amount of resources for individual $k$
after all transfers are executed.
$k$
after all transfers are executed.
Lemma A1. Let be $k_{\mathscr{l}}^{+}=\mathscr{l}$
when
$k_{\mathscr{l}}^{+}=\mathscr{l}$
when $\beta =0$
. Then
$\beta =0$
. Then $k_{\mathscr{l}}^{+}=\mathscr{l}$
when
$k_{\mathscr{l}}^{+}=\mathscr{l}$
when $\beta \gt 0$
.
$\beta \gt 0$
.
Proof. Consider a situation where without social preferences ( $\beta =0$
) it is optimal to hire all neighbors, that is,
$\beta =0$
) it is optimal to hire all neighbors, that is, $k_{\mathscr{l}^{\prime}}^{+}=\mathscr{l}^{\prime}$
. Then for any
$k_{\mathscr{l}^{\prime}}^{+}=\mathscr{l}^{\prime}$
. Then for any $k\in \{0,1,\ldots \mathscr{l}^{\prime}-1\}$
, we have
$k\in \{0,1,\ldots \mathscr{l}^{\prime}-1\}$
, we have
 \begin{align*}f\!\left(\mathscr{l}^{\prime}\right)-p\cdot \mathscr{l}^{\prime}\geq f\!\left(k\right)-p\cdot k-g\!\left(k,\mathscr{l}^{\prime}\right)\end{align*}
With social preferences this inequality becomes:
 \begin{align*} & \left(f\!\left(\mathscr{l}^{\prime}\right)-p\cdot \mathscr{l}^{\prime}\right)\left(1-\beta \right)+\beta \geq \left(f\!\left(k\right)-p\cdot k-g\!\left(k,\mathscr{l}^{\prime}\right)\right)\left(1-\beta \right) \\& \qquad+\frac{\beta }{\mathscr{l}^{\prime}}\left(k+\left(\mathscr{l}^{\prime}-k\right)\left(1-p\right)+g\!\left(k,\mathscr{l}^{\prime}\right)\right) \end{align*}
If the inequality without social preferences holds, then the above inequality holds because:
 \begin{align*} \beta \gt \frac{\beta }{\mathscr{l}^{\prime}}\left(k+\left(\mathscr{l}^{\prime}-k\right)\left(1-p\right)+g\left(k,\mathscr{l}^{\prime}\right)\right) \end{align*}
Indeed, the term on the right-hand side is smaller than $\mathscr{l}^{\prime}$
because:
$\mathscr{l}^{\prime}$
because: $(k+(\mathscr{l}^{\prime}-k)(1-p)+g(k,\mathscr{l}^{\prime}))=(k+(\mathscr{l}^{\prime}-k)(1-p)+(\mathscr{l}^{\prime}-k)p(1-(1-c)^{k}))=(k+(\mathscr{l}^{\prime}-k)((1-p)+p(1-(1-c)^{k})))\lt \mathscr{l}^{\prime}$
because
$(k+(\mathscr{l}^{\prime}-k)(1-p)+g(k,\mathscr{l}^{\prime}))=(k+(\mathscr{l}^{\prime}-k)(1-p)+(\mathscr{l}^{\prime}-k)p(1-(1-c)^{k}))=(k+(\mathscr{l}^{\prime}-k)((1-p)+p(1-(1-c)^{k})))\lt \mathscr{l}^{\prime}$
because $(1-p)+p(1-(1-c)^{k})\lt 1$
.
$(1-p)+p(1-(1-c)^{k})\lt 1$
.
Therefore, when without social preferences is optimal to hire everyone, it remains optimal with the introduction of social preferences.
Now we move to a situation where, without social preferences, is optimal to hire only a fraction of the neighbors. The following Lemma mimics the results of Lemma 2.
Lemma A2. Suppose that $k_{\mathscr{l}}^{+}\lt \mathscr{l}$
when
$k_{\mathscr{l}}^{+}\lt \mathscr{l}$
when $\beta =0$
. Then
$\beta =0$
. Then $k_{\mathscr{l}+1}^{+}\leq k_{\mathscr{l}}^{+}$
when
$k_{\mathscr{l}+1}^{+}\leq k_{\mathscr{l}}^{+}$
when $0\lt \beta \leq \frac{\mathscr{l}}{\mathscr{l}+1}$
.
$0\lt \beta \leq \frac{\mathscr{l}}{\mathscr{l}+1}$
.
Proof. Assume $k_{\mathscr{l}}^{+}=x\lt \mathscr{l}$
. Without social preferences the following condition must be satisfied:
$k_{\mathscr{l}}^{+}=x\lt \mathscr{l}$
. Without social preferences the following condition must be satisfied:
 \begin{align*} f\!\left(x\right)-p\cdot x-g\!\left(x,\mathscr{l}\right)\gt f\!\left(k\right)-p\cdot k-g\!\left(k,\mathscr{l}\right)\forall k\in \left\{x+1,\ldots \mathscr{l}\right\} \end{align*}
With social preferences this inequality becomes:
 \begin{align*} & \left(f\!\left(x\right)-p\cdot x-g\!\left(x,\mathscr{l}\right)\right)\left(1-\beta \right)+\frac{\beta }{\mathscr{l}}\left(x+\left(\mathscr{l}-x\right)\left(1-p\right)+g\left(x,\mathscr{l}\right)\right) \\ & \quad\gt \left(f\left(k\right)-p\cdot k-g\left(k,\mathscr{l}\right)\right)\left(1-\beta \right) + \frac{\beta }{\mathscr{l}}\left(k+\left(\mathscr{l}-k\right)\left(1-p\right)+g\left(k,\mathscr{l}\right)\right)\forall k\in \left\{x+1,\ldots \mathscr{l}\right\} \end{align*}
which can be rewritten as:
 \begin{align*} & \left(f\!\left(k\right)-f\!\left(x\right)\right)\left(1-\beta \right)\lt \left(p\!\left(k-x\right)\right)\left(1-\beta \right)+\left(g\!\left(k,\mathscr{l}\right)-g\!\left(x,\mathscr{l}\right)\right)\left(1-\beta -\frac{\beta }{\mathscr{l}}\right) \\ & \quad -\frac{\beta }{\mathscr{l}}\left(k-x\right)\mathrm{p}\forall k\in \left\{x+1,\ldots \mathscr{l}\right\} \end{align*}
It holds also for any $\mathscr{l}^{\prime}\gt \mathscr{l}$
(including
$\mathscr{l}^{\prime}\gt \mathscr{l}$
(including $\mathscr{l}+1$
) since the left-hand side does not change with
$\mathscr{l}+1$
) since the left-hand side does not change with $\mathscr{l}$
while the right-hand side increases with
$\mathscr{l}$
while the right-hand side increases with $\mathscr{l}$
if social preferences are not too strong, that is,
$\mathscr{l}$
if social preferences are not too strong, that is, $\beta \leq \frac{\mathscr{l}}{\mathscr{l}+1}$
. It must be that for
$\beta \leq \frac{\mathscr{l}}{\mathscr{l}+1}$
. It must be that for $\mathscr{l}^{\prime}+1$
the only candidate against
$\mathscr{l}^{\prime}+1$
the only candidate against $x$
and greater than
$x$
and greater than $x$
for being a solution is
$x$
for being a solution is $k=\mathscr{l}^{\prime}+1$
. Now assume that
$k=\mathscr{l}^{\prime}+1$
. Now assume that $k_{l+1}^{+}=\mathscr{l}+1$
. This is in contradiction with the Lemma A1.
$k_{l+1}^{+}=\mathscr{l}+1$
. This is in contradiction with the Lemma A1.
The next lemma shows that with social preferences is optimal to hire more individuals with respect to a situation without social preferences.
Lemma A3. Suppose that $k_{\mathscr{l}}^{+}=x\lt \mathscr{l}$
when
$k_{\mathscr{l}}^{+}=x\lt \mathscr{l}$
when $\beta =0$
. Then
$\beta =0$
. Then $k_{\mathscr{l}}^{+}\leq \mathrm{x}$
when
$k_{\mathscr{l}}^{+}\leq \mathrm{x}$
when $0\lt \beta$
.
$0\lt \beta$
.
Proof. Let us rewrite the last inequality (in the proof of Lemma A2):
 \begin{align*} & \left(f\!\left(k\right)-f\!\left(x\right)\right)\left(1-\beta \right)\lt \left(p\!\left(k-x\right)\right)\left(1-\beta \right)+\left(g\!\left(k,\mathscr{l}\right)-g\!\left(x,\mathscr{l}\right)\right)\left(1-\beta \right) \\& \quad-\frac{\beta }{\mathscr{l}}\left(\left(k-x\right)\mathrm{p}+\left(g\left(x,\mathscr{l}\right)-g\!\left(k,\mathscr{l}\right)\right)\right) \\ & \quad \forall k\in \left\{x+1,\ldots \mathscr{l}\right\} \end{align*}
We claim that the last term on the right-hand side is negative, that is, that $g(x,\mathscr{l})-g(k,\mathscr{l})\lt (k-x)\mathrm{p}$
. Indeed, expanding
$g(x,\mathscr{l})-g(k,\mathscr{l})\lt (k-x)\mathrm{p}$
. Indeed, expanding $g(x,\mathscr{l})-g(k,\mathscr{l})$
we get:
$g(x,\mathscr{l})-g(k,\mathscr{l})$
we get:
 \begin{align*} \left(\mathscr{l}-x\right)p\!\left(1-\left(1-c\right)^{x}\right)-\left(\mathscr{l}-k\right)p\!\left(1-\left(1-c\right)^{k}\right)=\,& \mathscr{l}p\!\left(\left(\left(1-c\right)^{k}-\left(1-c\right)^{x}\right)\right) \\&+kp\!\left(1-\left(1-c\right)^{k}\right)-xp\!\left(1-\left(1-c\right)^{x}\right) \end{align*}
The term $\mathscr{l}p(((1-c)^{k}-(1-c)^{x}))$
is negative because
$\mathscr{l}p(((1-c)^{k}-(1-c)^{x}))$
is negative because $k\gt x$
. The term
$k\gt x$
. The term $kp(1-(1-c)^{k})-xp(1-(1-c)^{x})$
is smaller than
$kp(1-(1-c)^{k})-xp(1-(1-c)^{x})$
is smaller than $(k-x)p$
because both variables
$(k-x)p$
because both variables $k$
and
$k$
and $x$
are multiplied by a positive and smaller than 1 term.
$x$
are multiplied by a positive and smaller than 1 term.
Then assume $\beta =0$
and that the initial inequality is satisfied. Given that the last term on the right-hand side of the inequality is negative, when
$\beta =0$
and that the initial inequality is satisfied. Given that the last term on the right-hand side of the inequality is negative, when $\beta$
is large enough the inequality does not hold.
$\beta$
is large enough the inequality does not hold.
Appendix D: Additional tables
Descriptive statistics


 Open access