


Introduction
To whom are policymakers responsive? This is an important empirical question in the study of politics. Even more so, it concerns the normative basis of democratic governance. A key justification and goal of democracy is that the political system should respond to the needs and demands of citizens in equal and unbiased ways (Dahl, Reference Dahl1989). In practice, however, this goal of equal responsiveness is often challenged and even violated.
The responsiveness of legislators and, in particular, potential inequalities in this regard has been the subject of a rapidly growing literature. Alongside analyses of policy responsiveness (Elsässer et al., Reference Elsässer, Hense and Schäfer2021; Gilens, Reference Gilens2012; Peters, Reference Peters2018), studies have also investigated the direct interactions between citizens and legislators, that is, communicative responsiveness (Esaiasson et al., Reference Esaiasson, Gilljam, Persson, Esaiasson and Narud2013, Reference Esaiasson, Gilljam and Persson2017). Arguably, such direct inter‐personal communication between legislators and voters provides important input to voters, parties and parliaments alike, and thus functions as a prerequisite for policy responsiveness (Miller & Stokes, Reference Miller and Stokes1963). Furthermore, direct elite–mass interactions appear to be increasingly relevant from the perspective of political representation, as traditional partisan linkage has weakened (Dalton & Wattenberg, Reference Dalton and Wattenberg2002). The key question that we ask in this paper concerns the equality of access, that is, whether citizens enjoy unbiased access to their representatives, independent of their social and political backgrounds.
One recent strand of previous research on communicative responsiveness has used field experiments to test whether and how policymakers respond – in a literal way – to unsolicited emails from citizens (e.g., Butler & Broockman, Reference Butler and Broockman2011; Dinesen et al., Reference Dinesen, Dahl and Schiøler2021; Habel & Birch, Reference Habel and Birch2019). These studies have uncovered important evidence for biased responsiveness, particularly in the United States (US) and on the basis of ethnicity/race (Costa, Reference Costa2017; Einstein & Glick, Reference Einstein and Glick2017; White et al., Reference White, Nathan and Faller2015). While such studies only tap into one interaction at one point in time, their cumulative findings provide important insights into inequalities in elite–mass interactions. The limitations of most available studies result from their focus on one constituent trait – such as ethnicity – and also to one country – usually the US.
This study advances from the experimental literature on communicative responsiveness by offering one of the first comparative fields experiments on three European democracies, namely Germany, the Netherlands and the United Kingdom (UK). We conducted a pre‐registered field experiment in November and December of 2020, in which fictitious citizens inquired about legislators’ policy priorities relating to the COVID‐19 pandemic. In this experiment, the same treatments are fielded across all three countries. While some recent field experiments designed to explore the responsiveness of legislators did go beyond the US case (e.g., Breunig et al., Reference Breunig, Grossman and Hänni2022; Dinesen et al., Reference Dinesen, Dahl and Schiøler2021; Habel & Birch, Reference Habel and Birch2019), a cross‐sectional comparative design asking about the robustness of constituent trait effects across different political contexts remains the exception (Magni & Ponce de Leon, Reference Magni and Ponce de Leon2021).
The design of our comparative analysis applies a hard test of the role social traits play in explaining unequal communicative responsiveness in two ways. First, we compare the relative weight of social constituent traits against political traits, that is, co‐partisanship. The electoral incentive to cater to co‐partisans is widely regarded a key concern in West European party democracies and therefore puts the assumption of any independent role of social constituent traits to a hard test (Rohrschneider, Reference Rohrschneider2002). Second, we selected a set of countries with different levels of electoral personalization, which is widely regarded to pattern the levels of elite–mass interactions (Carey & Shugart, Reference Carey and Shugart1995; Norris, Reference Norris1997). This puts the assumption of any consistent effect of constituent traits on communicative responsiveness to a hard test. The design of our comparative analysis further aims to tap into a very relevant aspect of communicative responsiveness in twofold ways. First, we use a rich measure to tap into legislators’ communicative responsiveness. While most previous experiments focus on thin measures of responsiveness in their main analyses, only investigating whether legislators respond, we construct an index that includes the quality of their responses. Fourth, most previous experiments focus on service requests while we focus on a policy request (but see Breunig et al., Reference Breunig, Grossman and Hänni2022; Grose et al., Reference Grose, Malhotra and Parks Van Houweling2015). Biases in communicative responsiveness to the policy demands of different types of constituents should be most consequential for policy outcomes.
Our pooled analysis reveals that both co‐partisanship and upper‐middle class status increase the communicative responsiveness of legislators while we find no effect for ethnicity. Citizens indicating their support for the legislator's party are generally more likely to receive a (high‐quality) response; simultaneously, legislators respond more (and better) to upper‐middle‐class constituents compared to their working‐class counterparts. The effect sizes are small, but in line with the expectations included in our pre‐analysis plan. To further probe our findings regarding the zero‐effect on ethnicity and the mechanisms that may underly other positive effects, we conducted several exploratory analyses. This corroborates the zero‐effect for ethnic biases since this trait remains orthogonal to co‐partisanship and class. We also find plausible country specific differences that point to the role of electoral concerns and reject taste‐based motivations.
Theory and hypotheses: The role of constituent traits for communicative responsiveness
Our study advances from a larger literature which argues that constituent traits matter for the communicative responsiveness of legislators. Starting with Butler and Broockman (Reference Butler and Broockman2011), scholars have used field experiments to test this argument. Most of these studies have been conducted in the US, with perhaps the main finding being that American politicians tend to be less responsive to racial minorities (Block et al., Reference Block, Crabtree, Holbein and Monson2021; Costa, Reference Costa2017; White et al., Reference White, Nathan and Faller2015). Other studies in the US context find similar effects for religious minorities (Pfaff et al., Reference Pfaff2021), but no clear class bias (Butler, Reference Butler2014; Carnes & Holbein, Reference Carnes and Holbein2019) and possibly even a small pro‐female gender bias (cf. Kalla et al., Reference Kalla, Rosenbluth and Teele2018; Pfaff et al., Reference Pfaff2021; Rhinehart, Reference Rhinehart2020). Several experiments also include information on constituents’ partisan affiliation, with co‐partisans receiving somewhat privileged treatment over others (Butler & Broockman, Reference Butler and Broockman2011; Rhinehart, Reference Rhinehart2020).
Why should we expect constituent traits to matter for biases in communicative responsiveness? Following Butler and Broockman (Reference Butler and Broockman2011) – who, in turn, follow studies in economic sociology – we substantiate the assumed relationships by pointing to two mechanisms commonly referred to as statistical and taste‐based discrimination. Both mechanisms picture legislators to be plagued by scarce resources and information overload. Consequently, they need to take cues to identify important requests and allocate their time and attention efficiently. Constituent traits take up this function and may trigger strategic and emotional reactions among legislators.
The notion of statistical discrimination perceives legislators as strategic vote‐seeking agents that ask about the electoral value of citizens in making choices about whom to respond to. Legislators are likely to respond to those citizens who can be expected to reward their responsiveness with their vote (or other forms of political support). In contrast, taste‐based discrimination emphasizes the ‘emotional’ or ‘expressive’ side of political behaviour rooted in the personal backgrounds, preferences and potential prejudices of legislators. Many of these factors come down to the expectation that legislators feel closer to citizens who are ‘like them’, that is, share common backgrounds and traits, and are thus more likely to respond. This speaks to the concept of descriptive representation (Mansbridge, Reference Mansbridge1999; Pitkin, Reference Pitkin1967) that promotes the need for the fair representation of distinct social groups by stressing the special bond emerging from shared social backgrounds (Burden, Reference Burden2007; Butler, Reference Butler2014; Sobolewska et al., Reference Sobolewska, McKee and Campbell2018). Many studies indeed have shown that this ultimately affects responsiveness, both in terms of policy (Carnes & Lupu, Reference Carnes and Lupu2015; Wängnerud, Reference Wängnerud2009) and correspondence (Broockman, Reference Broockman2013; Dinesen et al., Reference Dinesen, Dahl and Schiøler2021; Thomsen & Sanders, Reference Thomsen and Sanders2020). This also speaks to sociological research that stresses social homophily, that is, the preference to interact with someone ‘like us’, as an important behavioural predisposition in mass publics (McPherson et al., Reference McPherson, Smith‐Lovin and Cook2001).
These mechanisms inform the theoretical expectations that guide our empirical analysis. In this, we examine legislators’ communicative responsiveness across different traits: partisanship, ethnicity and class. The notion of statistical discrimination is particularly plausible for partisanship. European party democracies are characterized by collectivist forms of representation (Castles & Wildenmann, Reference Castles and Wildenmann1986; Uslaner & Zittel, Reference Uslaner, Zittel, Rhodes, Binder and Rockman2009) and parties are generally responsive to their voters (Ibenskas & Polk, Reference Ibenskas and Polk2022). Responding to a co‐partisan email will likely contribute to their continued electoral support, which is uncertain for emails from those who do not express partisanship. For social features such as ethnicity and class, the applicability of the statistical discrimination mechanism is less clear‐cut, for several reasons. Most importantly, specific parties may traditionally cater to distinct social groups such as social democratic parties that aim to represent low class constituents. Also, while those with an ethnic majority and upper (middle) class background are more likely to vote (Gallego, Reference Gallego2015; Marien et al., Reference Marien, Hooghe and Quintelier2010), writing an email to one's representative signals political engagement, independent of the social traits of the writer. Legislators should be aware of this. Still, MPs may – correctly or incorrectly – perceive upper‐middle class and ethnic majority voters as more likely to vote and therefore prioritize responding to their messages.
Taste‐based discrimination plausibly applies to ethnicity, class and partisanship. This is most obvious for the first two: given the underrepresentation of ethnic minorities and working‐class citizens in political office, we expect that these groups are socially most distant to the life circumstances of legislators and thus less likely to receive responsiveness by them (Allen, Reference Allen2018; Best, Reference Best2007). But since political support for the same party can also be a powerful source of identity, particularly in times of affective polarization (Iyengar et al., Reference Iyengar, Lelkes, Levendusky, Malhotra and Westwood2019), our expectation is that MPs will also feel more affinity towards co‐partisans and hence be more responsive to them.
To sum up, our expectation is that both social and political traits influence legislators’ communicative responsiveness. While political traits can be more clearly linked to statistical discrimination and social traits to taste‐based discrimination, this connection is tentative. Our main analysis does not aim to adjudicate between the two mechanisms. We merely argue that taken together, they offer a convincing explanation for varying levels of communicative responsiveness. Consequently, the basic hypotheses that we test in our analysis are the following:
-
H1. Legislators are more likely to be responsive to fellow partisans compared to non‐partisans.
-
H2. Legislators are more likely to be responsive to upper middle‐class constituents than working‐class constituents.
-
H3. Legislators are more likely to be responsive to constituents with majority ethnic backgrounds compared to constituents with a minority ethnic background.
By way of conclusion, it is important to take note of the normative and practical differences between the political and social traits, when it comes to unequal communicative responsiveness. Discrimination based on ethnicity and class is illegal and/or considered inappropriate in most countries. With regard to partisanship, in contrast, it is accepted if not expected for parties to be more responsive to the preferences of their partisans (Ibenskas & Polk, Reference Ibenskas and Polk2022). Also, one can argue that every supporter of a party that is represented in parliament can turn to one of their co‐partisan legislators. This implies that individual‐level biases in communicative responsiveness based on partisanship do not necessarily lower one's access to the representative process in the aggregate. However, the aggregate‐level implications of biased communicative responsiveness based on partisanship result from two important factors: the existence of non‐partisans and of non‐represented partisans, that is, those supporting parties not represented in their district. The first group of non‐partisans has increased in most established democracies (Dalton & Wattenberg, Reference Dalton and Wattenberg2002) which renders discrimination based on partisanship a relevant issue. The size of the second group of non‐represented partisans depends on the disproportionality of electoral systems. But since hardly any system is completely proportional, this group also matters. In short, then, while social and political traits are different from each other, both are normatively important as an object of study.
Data and methods: A comparative field experiment
To test our hypotheses, we use original data from a comparative correspondence experiment that was conducted in Germany, the Netherlands and the UK between November 2020 and January 2021.Footnote 1 In this experiment, emails from fictitious citizens were sent to all members of the German, Dutch and British parliaments. By randomly varying the identity of the sender by rephrasing his or her name and the content of the email, we can identify which trait produces more frequent and better responses.
While conducting this experiment, we are aware of existing divisions of labour in modern parliaments. This is to say, that most emails are answered by staff rather than the MPs themselves. Our qualitative research on this issue, however, stresses that MPs remain key agents by closely supervising this process in the context of different types of arrangements.Footnote 2 Below, we outline the key features of this comparative experiment, including the rationale for case selection, its general design, operationalization of key variables, text of the treatment emails and data analysis. We conclude this section with a short paragraph on differences between our pre‐registration plan and the fielded experiment.
Country case selection
As mentioned above, our country case selection contributes to our hard test design. Selecting Germany, the Netherlands and the UK provides variance in terms of the key variable of electoral personalization, while keeping other contextual factors as constant as possible. Our key aim is not to study the effect of electoral personalization, or of any other country level difference, on the communicative responsiveness of MPs, but to study the effects of social and political traits across arguably very different types of electoral contexts. In other words, we study the population of MPs faced with varying types of constituents across different electoral contexts. In a three‐country design, we cannot reliably specify whether and how these variations in electoral context are related to higher or lower levels of communicative responsiveness in the context of our experiment. In our analysis, we thus test the general nature of the envisioned constituent trait effects based on pooled data, as we stressed in our pre‐registration plan. We acknowledge the importance of asking follow‐up questions about country specific effects, if we may find them. We do so in the exploratory part of our analysis. In this, we gauge whether possible country patterns are in line with plausible patterns of strategic personal vote seeking behaviour and speculate further to motivate future research.
Electoral personalization refers to the level to which individual legislators feel accountable to geographic constituents. It is widely considered to stem from differences both in the electoral formula and district magnitude (Carey & Shugart, Reference Carey and Shugart1995). The electoral system of the UK secures high levels of electoral personalization on the basis of a majoritarian formula in combination with single‐member districts (Cain et al., Reference Cain, Ferejohn and Fiorina1987). Germany's mixed‐member system facilitates moderate levels of electoral personalization. Elections are contested on the basis of a proportional formula combined with a two‐vote system to determine the selection of MPs; 299 MPs are elected in single‐member districts on the basis of a plurality vote (first vote) and about another half of the members of the Bundestag are elected in 16 closed list multi‐member districts (second vote). Only the proportion of the second vote determines seat allocation and almost all MPs run for both votes, which diminishes the level of electoral personalization, also for those elected on the basis of a plurality vote (Manow, Reference Manow2015; Saalfeld, Reference Saalfeld, Gallagher and Mitchell2005). The electoral system of the Netherlands can be viewed as the least personalized compared to the British and German cases. It combines preference voting with a proportional formula. The de facto single nationwide electoral district, stemming from the uniform nomination choices of parties, severely constrains the level of electoral personalization in the Dutch system (Andeweg, Reference Andeweg, Gallagher and Mitchell2005). In a three‐country design, we cannot reliably test whether these variations are related to higher or lower levels of communicative responsiveness in the context of our experiment. But we, firstly, can test the general nature of the envisioned constituent trait effects based on pooled data, as we stressed in our pre‐registration plan. We secondly, can tap into country specific patterns in an exploratory analysis to gauge whether they are in line with expected forms of strategic personal vote seeking behaviour.
The three selected cases are similar in many other relevant aspects such as parliamentary government, political development and party organizational strength. Further existing differences either can be viewed as a direct result of the electoral connection or as a negligible quantity for elite‐mass interactions. With regard to relevant differences: the Dutch House of Representatives is comparatively small (also in relation to the population size) and has limited support staff and resources for answering emails. This is, however, not independent from the relatively low level of electoral system personalization and thus simply augments the incentive our comparative design aims to provide variance for. With regard to negligible differences: the three systems differ in relation to state form (monarchical vs. republican) or the territorial organization of the state (unitary vs. federal). This, however, bears little plausible relationship with the quantity and quality of elite‐mass interactions.
Experimental design
Our field experiment differs from other correspondence studies in several ways. A main difference to other studies is that we use a factorial design. While most previous studies manipulate one variable at a time, such as the sender's ethnic background, we manipulate several variables in the same email. In our analysis we do not, however, compare all combinations of treatment variables against each other, but rather each treatment variable separately. Because the assignment to the various treatments is orthogonal, we can estimate the effect of multiple treatments without sacrificing statistical power or having to send out many waves of emails to MPs.
The factors we vary in the treatment emails are partisanship, social class, ethnic background and gender. We do not have any theoretical expectations about the effect of citizens’ gender, but we vary this because it is signalled either way by the sender's name. By sending half of all emails from women and half from men, the effects of the other independent variables represent the average marginal effect over a realistic gender distribution (Muralidharan et al., Reference Muralidharan, Romero and Wüthrich2020, p. 31). In total, then, we vary ethnicity, class, partisanship, gender and the email version. With five factors, each of which has two levels, there are a total of 25 = 32 treatment conditions. To ensure balanced treatment conditions and improve statistical precision with our limited number of participants, we use block random assignment within each country, based on the seat share and government‐opposition status of political parties, as well as logged district size (Gerber & Green, Reference Gerber and Green2012, pp. 71−80).Footnote 3
Another difference is that we sent out two emails to the same MPs. In other words, we use a mixed design that has both a between‐subject component and a within‐subject component, in a similar way to conjoint experiments (Hainmueller et al., Reference Hainmueller, Hopkins and Yamamoto2014). This was done to increase the statistical power of the experiment. In the Supporting Information Appendix A, we elaborate on our power analysis, which shows that our design reaches conventional standards of statistical power with realistic effect sizes. To minimize the chance of detection in this setup with repeated measurements, we waited at least 2 weeks after sending the first email before sending the second one. We also ensured that MPs would not be put in the same treatment condition twice. Finally, legislators received two different variations of the same email, which are assigned orthogonally from the other treatment factors (see below).
Our experiment took place after the COVID‐19 pandemic had started, but we have no indication that this had any positive or negative effects on legislators’ ability and motivation to respond. Our emails were sent between 2 November and 18 December 2020, when various COVID measures, but not a full lockdown were in effect, that could have impacted upon legislators’ time constraints and thus their proclivity to respond, but we observe response rates that are comparable to those in earlier studies.Footnote 4
VariablesFootnote 5
As alluded to above, our main independent variables are social class, ethnic background and partisanship, which are all manipulated in the treatment emails, in addition to gender. In line with conventional approaches and previous correspondence experiments, we view occupation as the best single indicator of social class (Carnes & Holbein, Reference Carnes and Holbein2019; Erikson & Goldthrope, Reference Erikson and Goldthrope1992; Habel & Birch, Reference Habel and Birch2019). We chose two occupations which strongly differ in terms of socio‐economic status, and which are also relatively common in all three of our countries, namely a cleaner (working‐class) and a lawyer (upper‐middle‐class). Next, we vary the ethnic background and gender, which are both signalled by the name of the sender. Here, we choose first names that are commonly regarded as being typically male or female, or in the case of ethnicity, first and last names typically belonging to native‐born citizens or people with a recognizable ethnic minority background. The specific names selected for the field experiment are listed in Suporrting Information Appendix C.Footnote 6 Lastly, partisanship is manipulated by either stating that the sender supports the MP's party or not, including any indication of their partisanship. We thus avoid sending an explicit out‐party cue to MPs, simply because it is unrealistic to expect citizens to write that they oppose the MP's party in an email about an unrelated topic. This does mean that our design provides a somewhat ‘hard test’ for the role of partisan alignment.
Our dependent variable consists of a response index that taps into several outcomes. With this rich measure, we not only focus on the quantity but also the quality of legislators’ correspondence responsiveness. The first and most obvious outcome component of our response index is whether the MP sent a reply to our fictitious constituent. We use a 4‐week cutoff, such that legislators are considered unresponsive in rare instances where they reply after more than 4 weeks. Additionally, we include the speed of the response, by recording whether the MP replied faster than the median response time. Furthermore, we add the length of the response, by recording whether the email was longer than the median reply. Longer responses typically include more detailed information than short responses, but of course emails can also be long without containing much relevant information. Therefore, finally, we manually coded whether each reply was responsive in the sense that it answered the substantive question posed by the sender with reference to relevant positions, activities, and information (for full coding instructions, see Appendix D). This final variable was again dichotomized for inclusion in our overall response index. To sum up, our main dependent variable combines four outcomes into an additive response index, where all indicators are equally weighted (Cronbach's α = 0.74). In other words, MPs can score a maximum of four points, which they can get by sending a fast, elaborate and informative response. To avoid post‐treatment bias, non‐responses are given a score of zero (Coppock, Reference Coppock2019). This approach goes beyond more simple measurements in the previous literature that mainly estimates the incidence of responses, that is, whether legislators responded or not.
Treatment emails
In our treatment emails, we ask MPs a policy‐related question, based on the belief that inquiring about an MP's policy stance – and MPs explaining their stance to voters – is an important dimension of communicative responsiveness.Footnote 7 This also applies a hard test to how responsive legislators are to what type of constituents since they are found to prefer talking about service rather than policy in their constituency contacts (Butler et al., Reference Butler, Karpowitz and Pope2012). We designed the policy issue addressed in our emails to be one that is (a) salient to many MPs, (b) equally relevant to all political parties and (c) open‐ended, to avoid sending misleading signals about support for a specific position. Based on these criteria – and based on the public and political agenda at the time of the data collection – we chose to focus on COVID‐19, and particularly its effects on economic and social life.
We conducted exploratory and preparatory research to secure the realism of our treatment emails. This included qualitative interviews with MPs and staff in the three countries, which unveiled the fact that legislators receive very different emails from different types of geographic constituents with different social backgrounds who wish to share their concerns.Footnote 8 This also included extensive software and labour‐based efforts to structure and phrase the email in ways that would render it realistic for lawyers and cleaners as well. We also deliberately chose our treatments, for example, the names of our fictitious constituents and their occupations, on the basis of relevant statistics and research for each country.Footnote 9 Overall, the fact that we did not experience any exposure in the field phase stresses that our emails were adequately realistic.
The two versions of the email that were sent to MPs are listed below, with the German and Dutch translations provided in Supporting Information Appendix E. Brackets indicate words or phrases that were varied between emails:

Ethical concerns
Correspondence field experiments raise ethical questions, mainly because they engage in activity deception, meaning that legislators are left unaware that they are part of a study (Bischof et al., Reference Bischof, Cohen, Cohen, Foos, Kuhn, Nanou, Visalvanich and Vivyan2022; Crabtree & Dhima, Reference Crabtree and Dhima2022; Desposato, Reference Desposato2016). The absence of informed consent has been argued to be acceptable when no or very minimal harm is done to participants and when these methods are necessary to provide robust answers to important scientific and/or societal questions (Butler & Broockman, Reference Butler and Broockman2011; Pedersen et al., Reference Pedersen, Louwerse and Zittel2022). To address these ethical concerns in our experimental design, we weighted all costs and benefits in advance to inform our choices in our experimental design (see Zittel et al., Reference Zittel2021). As a consequence, we, for example, assessed the required sample size in order not to overburden legislators with emails, carefully designed the treatment emails to be as authentic as possible while appealing to all MPs, and avoid ascribing any results to specific MPs or parties in order to avoid backlash against them. Most importantly, the issue of equal correspondence responsiveness is of key concern in democracies and cannot be solely researched on the basis of survey studies that are plagued by social desirability biases and also cross‐sectional observational studies that raise issues about possible third variable biases and reverse causality.
Some researchers favour the use of confederates (citizens recruited to send messages to their MPs) over the use of fictitious identities (Bischof et al., Reference Bischof, Cohen, Cohen, Foos, Kuhn, Nanou, Visalvanich and Vivyan2022; Giger et al., Reference Giger, Lanz and De Vries2020). However, while this solves the issue of identity deception, it still involves activity deception and thus is not able to comply with default ethical standards in research with humans. Furthermore, it lowers researcher control over the experiment and raises issues about the protection of individual level data since the answers and the reactions of the MPs are shared with confederates. As a result of this, we did not opt for this strategy.
Our design was approved in a decentralized process by ethics review boards in the three universities involved, which further corroborates its ethical credentials. We decided to seek and implement decentralized ethics votes to acknowledge for national level variance in terms of relevant norms and expectations. This did have an effect on the actual experiment that we conducted; as we discuss below, we are confident that it does not bias our results.
Analysis
To test our main three hypotheses, we use an ordinary least squares estimator with MP fixed effects testing for differences‐in‐means. We apply this model to our pooled data, meaning to all observations across countries and waves. In all models, we apply country‐level weights so that all three countries are equally influential. We opt for this strategy since we wish to tease out the electoral variance in our comparative set‐up. We will regress the responsiveness index on all treatment factors in the same model, though the fact that the latter were assigned independently of each other means that separate models for each factor produce the same results.
In a second step, we conduct exploratory analyses to further probe the effects that we find in our main analysis. In this, we specifically probe the issue of intersectionality, that is, the possible interdependence of our treatments, and the assumed underlying mechanism of statistical discrimination. We consider this second step as exploratory and do not formulate hypotheses for several reasons. First, these analyses do not reach conventional standards of statistical power under most realistic effect sizes (see the data section below). Second, it is not clear how substantial we should expect interaction effects between treatment factors to be, or, indeed, whether they will be positive or negative. As the literature on intersectional representation reveals, overlapping sources of inequality can constitute either a ‘double jeopardy or multiple advantage’ (Mügge & Erzeel, Reference Mügge and Erzeel2016). Third, our inferences on the behavioural role of electoral system contexts are plagued by our few N designs and are not able to entirely rule out third variable biases.
In our main analyses, we use one‐sided significance tests (α = 0.05), given the directional nature of our pre‐registered hypotheses, while we use two‐sided tests in the exploratory, interaction‐based analyses. In further robustness tests, we consider several additional specifications, using ordinal logistic regression instead of OLS and analyzing the different outcomes which make up the responsiveness index on their own as dependent variables. Further details are provided in the results section.
Modifications from the pre‐analysis plan
We pre‐registered our experiment to facilitate transparency and to stress the hypothesis testing nature of this research amidst a visible body of literature in the legislative studies. The actual experiment that we conducted differs in three points from our pre‐registered design, which is mainly, but not entirely, due to our decision to seek decentralized ethics votes. This section identifies these differences and briefly reflects upon their implications for our analysis.
A pronounced change lies in the fact that we had to drop one case that we included in our pre‐registration plan, namely Denmark. This was motivated by the ethics vote in the respective country (local university) that asked for a debrief with opt‐in option, which would have compromised our bases for causal inference in serious ways. We see no substantial negative consequences resulting from the decision to drop the Danish case. Our main analysis continues to be adequately powered, based on the three remaining cases. Our comparative set‐up continues to provide the level of electoral system variance that we were aiming at.
A second modification stems from the fact that our actual sample is smaller than the combined size of the three parliaments. This is for two reasons. First, 321 British MPs responded to the email by requesting an address but not responding to the question otherwise (one or both times). We removed these responses (MP‐emails) from the data as there is too little information to label them as either responsive or non‐responsive. A further 161 British MPs were asked to remove their data following the requirement of a debriefing form with an opt‐out option in the UK experiment (Campbell & Bolet, Reference Campbell and Bolet2022). Appendix B shows that these changes are highly unlikely to have biased the final sample, and that our sample can hence be used for analysis.Footnote 10 We focus on the within‐MP models introduced above to account for possible selection biases due to this dropout. Moreover, despite the loss of cases, our main analysis remains adequately powered.
A third modification concerns the content of the Dutch emails. Our setup was slightly amended for the second wave of emails in the Netherlands to further minimize exposure risks. Some of the emails we received in the first wave indicated that a substantial number of MPs were forwarding our messages to the ‘corona specialist’ in their party. While this provides valid observations and while we have no indication for exposure in the first wave, we felt that the risk of exposure would be substantial in the second wave.Footnote 11 Hence, to address individual MPs in more personalized ways, two new versions of the email were composed which added a reference to the policy specialization of each MP, for example asking about the impact of COVID‐19 in the field of education. This resulted in a slightly lower response rate in the second wave (30 vs. 37 per cent, p = 0.166), but also significantly fewer instances of MPs forwarding emails.
Results: How political and social traits affect communicative responsiveness across different electoral contexts
Descriptive analysis
In a first step of our analysis, we provide descriptive information about the response patterns that we find. We first find, that 43.3 per cent (939) of all treated legislators responded while 56.7 per cent (1,232) did not. The country specific distribution is similar in the UK and Germany with 44.8 per cent responding in both countries (206 in the UK and 633 in GER). In contrast, the response rate in the Netherlands is only 33.6 per cent (100).
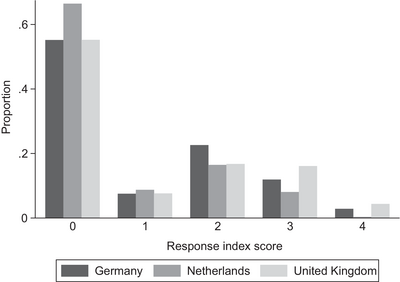
Figure 1 advances to our dependent variable in the analysis, which measures the quantity and quality of responses using the response index that we constructed. It shows the distribution of our response index in the aggregate and across each one of the three countries. This demonstrates the rather low level of high‐quality responses with only 15 per cent of the cases (327) reaching the value of 3 and above compared to 28.2 per cent of the cases (612) that score the values of either 1 or 2. Figure 2 also demonstrates some country differences in this regard. The average is highest in the UK (1.07 on a scale from 0 to 4), slightly lower in Germany (1.00) and lower still in the Netherlands (0.67). This nuanced descriptive finding corroborates that not every response email is the same and that we should tap into response patterns in more fine‐grained ways. It also suggests that communicative responsiveness may depend upon context, especially the level of electoral personalization. We will return to this issue in the exploratory part of our analysis. For now, we turn to our main analysis on the role of constituent traits in elite‐mass interactions.
Responsiveness by country.

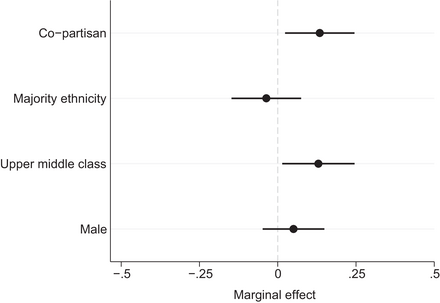
Main effects of treatment conditions on response index (with 90 per cent confidence intervals).

Main explanatory analysis with pooled data
Figure 2 displays the marginal effects of our main treatment conditions on the responsiveness index, where the effect of partisanship is relative to the non‐partisan treatment, majority‐ethnicity is relative to the minority‐ethnic treatment and upper‐middle class is relative to the working‐class treatment (The underlying results are reported in Supporting Information Appendix Table F1). As we outlined above, our main interest is in the pooled effects that we plot in Figure 2 and that we report and comment on first.
Starting with partisanship, Figure 2 shows a significant effect on responsiveness in the pooled model. The communicative responsiveness of legislators is, on average, 0.134 points higher in the co‐partisan conditions compared to the conditions where partisanship is left out, which is roughly one ninth of its standard deviation. This corroborates the theoretical expectations that motivated H1. Legislators are more likely to respond to co‐partisan constituents.
Turning to social class, we also find a positive effect in the pooled model, thus corroborating H2. On average, emails from those with upper‐middle class occupations score 0.130 points higher on the response index than emails from senders with working‐class occupations. This is about an effect size that is similar to the one we found on partisanship. Regarding ethnicity, we find no substantively meaningful or statistically significant effects. This is a striking (null) finding with regard to H3 since it contradicts a key finding in the American experimental literature. As we noted above, in this literature, ethnic inequality in correspondence responsiveness is strong and robust across several studies. However, this finding aligns with the study of Habel and Birch (Reference Habel and Birch2019) conducted in the UK, which also revealed only minor (unconditional) effects of ethnicity. At face value, this might suggest a systematic difference between American and European contexts regarding the implications of ethnicity for the responsiveness of legislators. We return to this finding below. Figure 2 also plots our findings for gender, which however is not the subject of any hypothesis, and which shows no statistically or substantially significant effect on responsiveness. To sum up, our main analysis supports H1 (partisanship) and H2 (class) but is not able to corroborate H3 (ethnicity).
The effect sizes that we find are small, but in line with the expectations included in our pre‐analysis plan. Perhaps this is more surprising for co‐partisanship, as the political party is commonly acknowledged to be the key linkage in Western European democracies. Its limited implications for legislators’ communicative responsiveness may reflect the relatively weak stimulus, or it may reflect the high levels of institutionalization in our three parliaments, where constituency communication is a valued norm and a well‐organized endeavour. The finding regarding class is noteworthy, given the relatively weak stimulus and our hard case design, in which we gauge the role of class relative to other traits considered important in the literature and across different electoral contexts.
Exploratory analyses
In the second step of our analysis, we report the results of several exploratory analyses. This is to further probe the zero‐effect for ethnicity and the assumed (strategic) mechanism underlying the positive effects on partisanship and class. As outlined, we envision these analyses as exploratory since they may not be adequately powered and since we thus face a diminished certainty about whether we detected a true effect.
Interaction effects between treatment conditions
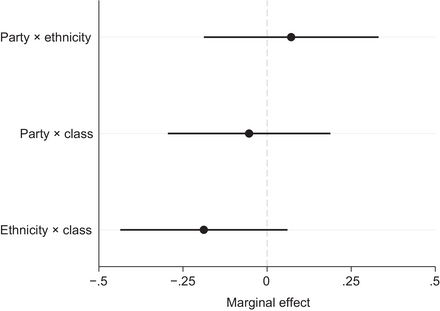
Our zero‐finding regarding the role of ethnicity is surprising in view of the previous literature, even though less so with regard to our theoretical considerations about the possible predominance of partisanship in European democracies. To further probe this finding, we take note of the concept of intersectionality in the literature on political representation. This concept argues that individuals may hold multiple identities that interact with each other, which may either reinforce or level the marginalization of distinct groups (Hancock, Reference Hancock2007). In this vein, we explore interaction effects between ethnicity, class and partisanship to gauge, for example, whether MPs discriminate against ethnic minority constituents more, contingent upon their low‐class status or political independence. We estimate separate models with two‐way interactions for each combination of these treatment factors.
Figure 3 reports the marginal effects of the two‐way interactions between party, ethnicity and class in models that are otherwise identical to the baseline (full results are reported in Tables F8‐F10). Although we draw this conclusion cautiously, we do not find evidence to suggest substantial interactions. The pooled models show no statistically significant effects for neither of the interactions that we focus on. We conclude that the three constituency traits we tested for are relatively orthogonal to each other and thus do not reenforce each other in explaining the quantity and quality of communicative responsiveness. This is perhaps most interesting for the interaction of ethnicity and class, since their mutually reenforcing marginalization effect is not only theoretically plausible but has been corroborated in previous research. For example, Habel and Birch (Reference Habel and Birch2019) find in their study that British working‐class constituents with ethnic minority backgrounds are particularly subject to low levels of communicative responsiveness.
Interaction effects between treatment factors on response index (with 95 per cent confidence intervals).

Interaction effects between treatment conditions and MP characteristics
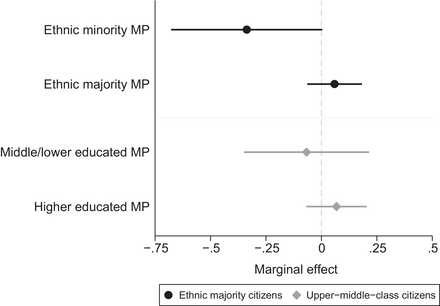
We probe our effects regarding the assumed mechanism of statistical or taste‐based discrimination. If taste‐based discrimination plays a role for the social traits, we would expect that legislators are more likely to provide a (high‐quality) response to messages sent by citizens that share their ethnic majority status and class background. Therefore, we explore the interaction between relevant biographical backgrounds of MPs and the treatment conditions in our experiment.Footnote 12 While the point estimates are in the expected direction, they are not statistically significant (see Figure 4).Footnote 13 The only exception is that ethnic minority MPs show greater responsiveness to emails from minority ethnic senders than to emails from majority ethnic senders (full results are reported in Table F11). We need to be cautious, however, in interpreting these results, because of the lower statistical power of our design for these interactions and the fact that legislator background is an observed characteristic. Finding a single statistically significant relationship should not be taken as proof of, nor absence of, taste‐based discrimination.
Interaction effects between MP and citizen characteristics (with 95 per cent confidence intervals).

The role of party
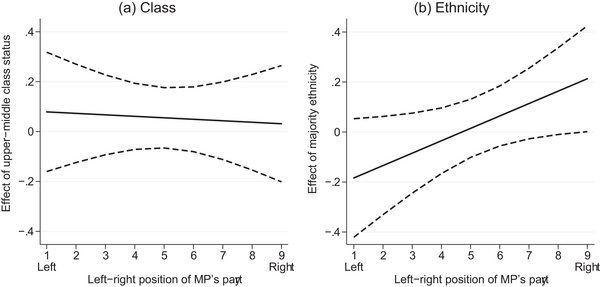
We also examined the role of party ideology to gauge party level differences in communicative responsiveness. This may either indicate taste‐based or strategic motivation to discriminate against distinct types of constituents. In this vein, we asked whether the left‐right position of a legislators’ party affected the effect of the upper‐middle class status of the sender and that of majority ethnicity of the sender on responsiveness. We do not find any indication that right‐wing legislators are more likely to respond to messages from upper‐middle class senders (see Figure 5a). We do, however, find that right‐wing legislators are more likely to respond to messages from ethnic majority senders, while this is not the case for left‐wing or centrist legislators (see Figure 5b). In isolation, this effect may be argued to be the consequence of strategic considerations (majority ethnic voters are more likely to support right‐wing parties) or represent taste‐based discrimination by right‐wing legislators, or a combination of both. But if MP considerations were purely strategic, one might wonder why we do not find this for class.
Interaction effect between MP left‐right position and citizen class and ethnicity (with 95 per cent confidence intervals).

The role of country context
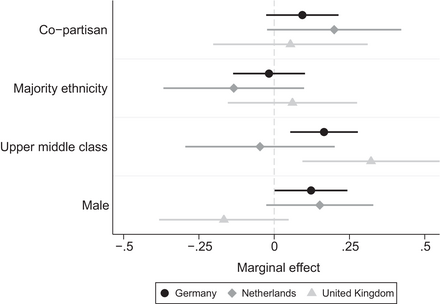
In a last step of our exploratory analysis, we elaborate on the country differences in our treatment effects, shown in Figure 6, and how this allows inferences about the assumed role of the mechanism of statistical discrimination. Figure 6 allows two observations in this regard. It firstly shows a positive effect of partisanship across all three countries compared to a less consistent pattern regarding social class. In the case of class, Figure 6 reports statistically significant effects in the same direction for the UK (0.322) and Germany (0.166) while we fail to find a similar effect for the Netherlands (−0.047).Footnote 14 This can be read as corroborating our assumptions about the special role of political traits in signalling electoral value in elite‐mass interactions as opposed to social traits. This does come with a grain of salt since the country specific effects for partisanship fail to achieve statistical significance in all the models. We, however, also have to note that the models for Germany and the Netherlands fail conventional standards of significance only narrowly and that all country specific models most likely are underpowered. The latter leaves us to conclude that our pooled analyses provide the most reliable basis for our causal inferences.
Country differences in effects of treatment conditions on response index (with 90 per cent confidence intervals).

Figure 6 secondly shows plausible case specific effects if we take electoral system variance and standard expectations about their behavioural implications into account. The case with the least electoral personalization, the Netherlands, shows the least constituent trait effects compared to Germany and the UK, characterized by higher levels of electoral personalization. Dutch MPs are less dependent upon geographic constituents in their re‐election efforts and thus need to focus less on the electoral value of constituents. The remarkable difference with regard to class also may indicate a lower salience of class politics in the Dutch hyper fragmented party system as opposed to the British and German party systems. These are only tentative conclusions but correspond well with previous research and our overall findings on the strategic basis of elite‐mass interactions.
Robustness checks
We conduct robustness checks to further explore and validate our findings. Overall, these checks corroborate the results that we presented above. We touch upon our tests briefly here and report them in greater detail in Supporting Information Appendix F.
In a first test, we use the indicators that we combined into our responsiveness index as separate dependent variables in independent estimation models. This reveals that class and partisanship mainly affect the presence and timing of a response; their effects on the length and quality of the response are still positive but weaker and far from statistically significant (Table F4). These observations overall stress a robust finding for the effects of partisanship and class on the quantity of communicative responsiveness but give less clear‐cut evidence with regard to its quality.
Second, to control for non‐intended design effects, we add controls for waves and email versions and also add wave‐by‐country indicators. This is largely motivated by the unplanned deviation from the pre‐registration for the second wave in the Netherlands that we elaborate above (Table F5). Third, we use ordinal logistic regression instead of OLS (Table F6). Fourth and finally, we exclude nine MPs who are not affiliated with any party and were hence put into the non‐partisan treatment conditions by default (Table F7). In all cases, the effects of partisanship and class remain robust, while ethnicity continues to have no discernible effect.
Third, to further account for the attrition in the UK (beyond the balance checks reported in Supporting Information Appendix B), we estimate Lee bounds of the treatment effect in the UK.Footnote 15 This produces figures of [0.07 – 0.32] for partisanship, [0.04 – 0.27] for social class, and [0.02 – 0.04] for ethnicity. Clearly, there is a lot of uncertainty in these estimates, which is not surprising given the substantial number of missing MPs, but all treatment effects remain positive. Finally, we estimate models where we assume that either all or none of the MPs who requested an address would have responded when given an address (Table F13). In both cases, the party effect remains stable. The effect of class does fall below statistically significance if none of these MPs had responded, but the opposite scenario is arguably much more plausible, given that these MPs have indicated a willingness to respond. If they had all done so, class would have had a strong and significant effect on responsiveness.
Conclusion
This study has focused on inequality in the communicative responsiveness of legislators in three West European democracies: Germany, the UK and the Netherlands. We contribute to a growing literature on this issue in twofold ways. We first offer one of the first comparative field experiments that reach beyond the case of the US. We second, ask about the relative weight of different constituent traits in explaining communicative responsiveness. We applied a hard test while asking about the role of constituent traits for the communicative responsiveness of legislators. This is because we conduct the same experiment across different electoral contexts.
Our main analysis reveals fairly robust evidence for the role of constituents’ partisanship and class status in explaining communicative responsiveness. Self‐identified co‐partisans scored higher on our responsiveness index than non‐partisans. MPs were, on average, also more responsive to emails sent by upper middle‐class constituents (lawyer) compared to emails sent by working class constituents (cleaner). A caveat here is that these effects fall just shy of statistical significance in models with country‐clustered standard errors. Beyond this, a surprising finding in view of the established literature concerns ethnicity, for which we found no overall effect on MP's level of responsiveness. Ethnic majority constituents were not more likely to score higher on our responsiveness index.
In an exploratory part of the analysis, we gauge our zero‐finding on ethnicity and the mechanisms underlying our main effects. With regard to the role of ethnicity, we ask about possible intersectionality effects, where ethnic‐minority constituents may face discrimination contingent upon their class status or partisanship. We find no evidence for this and have to conclude that different constituent traits matter to different degrees in different contexts. While ethnicity proves to be of importance in the US, it is of lesser significance in European contexts. However, this finding must be viewed as tentative since our interaction analyses are most likely underpowered. It, however, provides an important avenue for further research.
We also gauge the mechanisms driving our main effects. We find signs of positive discrimination on the basis of ethnicity, where MPs with a minority ethnic background would be more responsive to emails sent by constituents with similar backgrounds. We do not find, however, any other significant interaction between legislators’ background and that of the sender. These findings, again, must be viewed as tentative due to power issues, but they also suggest directions for future study. Learning more about this issue has important implications for practical discussions focused on the question whether equal responsiveness requires more efforts in political recruitment or rather in providing the right behavioural incentives to legislators.
The effect sizes that we report are small, but in line with the expectations in our pre‐analysis plan. As mentioned above, the strongest effect – that of partisanship – produces a swing of one ninth of a standard deviation in our responsiveness index. To make this more concrete, looking at the other dependent variables (Table F4) shows that co‐partisans are six percentage points more likely to get a response compared to non‐co‐partisans. This is perhaps small in view of the key role of party as linkage in Western democracies. With regard to class, we find a similar effect size when MP fixed effects are added (Table F3). We consider this noteworthy in view of our hard case design in which we gauge the relative weight of different constituent traits across different electoral contexts. Both effect sizes are in line with previous correspondence studies and are therefore not unexpected. They can be seen as the result of the high institutionalization levels of constituent communication in modern parliaments, where MPs command sufficient resources and follow professional norms in their constituency communication. In this vein, the small effects that we find may be proxies for larger biases in other forms of elite‐mass interactions that may add up to significant substantive effects in the aggregate. Combining field experiments with observational research should thus be a major concern in future research about inequalities in communicative responsiveness.
When it comes to the normative implications of these results, we are left with mixed feelings. The fact that partisan attachments increase responsiveness is not entirely surprising and uncalled for in European politics. But it also is not wholly unproblematic, especially given biases in who is politically active (Gallego, Reference Gallego2015), given the increasing number of non‐partisans in Western democracies, and given the significant number of partisans whose preferred party is not represented in parliament. The class bias we see is arguably more concerning. It speaks to a larger literature about the economic sources of political inequality in established democracies and provides reasons for further research efforts in this regard.
Acknowledgements
The research for this article was supported by grants from the Deutsche Forschungsgemeinschaft (Grant number: ZI 608/8‐1), the Nederlandse Organisatie voor Wetenschappelijk (Grant number: 464.18.108), and the UK Economic and Social Research Council (Grant number: ES/S015728/1). We are indebted to Helene Helboe Pedersen, who contributed to this research in its initial stage. We also thank Natalie Giger, Josh Robinson and Robert Rohrschneider, who provided comments on an earlier version of this manuscript.
Open access funding enabled and organized by Projekt DEAL.
Data Availability Statement
The data that support the findings of this study are available on request from the corresponding author. The data are not publicly available due to privacy or ethical restrictions.
Online Appendix
Additional supporting information may be found in the Online Appendix section at the end of the article:


 Open access