


“Last year, the estimated number of violent crimes in Arkansas spiked to its highest level in more than three decades” a 2021 Axios article warned. Additionally, the article shockingly revealed that the skyrocketing crime rate in Arkansas “exceeded the national rate for the 16th straight year…” (Sparkman Reference Sparkman2021). The elected officials within Arkansas took notice of these dangerous trends and quickly decided to adopt several more punitive criminal justice policies, such as the adoption of a truth-in-sentencing law and increasing funding for prison beds, which will most likely dramatically increase the incarceration rate in the coming years (Millar Reference Millar2023a).Footnote 1
News articles and comments from lawmakers suggest that the Arkansas Attorney General’s office may be partially responsible for ushering in new punitive criminal justice policies that are likely to raise the state’s incarceration rate.Footnote 2 For instance, when testifying to the Arkansas House of Representatives Judicial Committee, Arkansas Representative Jimmie Gazaway (R), co-sponsor of the bill, deeply thanked the attorney general for being “instrumental in driving the conversation on these issues” and expressed his gratitude to Griffin’s staff in helping to write some of the language included in the bill (State of Arkansas House of Representatives 2023, 8:42:45). Additionally, several news accounts also indirectly suggest that electoral considerations could potentially influence the attorney general’s behavior to help increase the state’s incarceration rate (see Simpson Reference Simpson2022).Footnote 3 While these accounts imply that certain institutional features associated with executive branch administrators, such as the electoral considerations linked to the state’s attorney general office, can influence policy outcomes in a state, the extant literature is largely void of evidence to support such claims. The goal of this article is to help fill this void within literature.
Unlike at the federal level, there is considerable variation in how executive branch administrative officials are selected across the USA states. In some states, such as New Jersey, many of the executive branch administrators are appointed by the governor. Conversely, in other states, executive branch administrators, such as the attorney general’s office, are directly elected by the public. In this article, we develop a theoretical rationale linking the selection method of the attorney general’s office to the incarceration rate in the state, with the expectation that this relationship is conditioned by the level of crime within a state. We contend that with an increase in crime, states with an elected attorney general will be associated with higher incarceration rates relative to states with an appointed attorney general. When analyzing all USA states across a seventeen-year period, we find evidence to support our theoretical expectation.
Our findings contribute to our knowledge of public policy and governance in four ways. First, a large body of works explores how governors influence the policy outcomes in their state (e.g. Barrilleaux and Berkman Reference Barrilleaux and Berkman2003; Lewis et al. Reference Lewis, Schneider and Jacoby2015). Considerably less scholarly attention, however, has been devoted to whether other elected executive branch officials influence the policy outcomes in their state (see Miller Reference Miller2013 as a notable exception). Our findings indicate, at least as it pertains to the attorney general’s office, other executive branch officials also have an impact on public policy. Second, elections for the attorney general’s office (and elections for other non-gubernatorial state executive branch offices) tend to be low-information elections (Schaffner and Streb Reference Schaffner and Streb2002). Our findings suggest that while these elections may not regularly capture the public’s attention, they can have a substantial impact on policy. Third, there has been an extensive discussion among scholars about how to make the bureaucracy and public managers more responsive to the public (e.g. Rimkutė and van der Voet Reference Rimkutė and van der Voet2023). Our results suggest that the selection method utilized for executive branch administrative officials can impact their level of responsiveness to the public’s preferences. Finally, analyzing the incarceration rate in the American states is a critical policy matter given that a great deal of public attention has been devoted to the ethical considerations of mass incarceration (i.e. Davis Reference Davis2015). Our findings suggest that the electoral factors of certain key executive branch officials can play a crucial role in a state’s criminal justice policy outcomes. Taken together, these findings deepen our insight into policy and public management in several ways.
State attorney general’s influence on criminal justice policy outcomes
Before we discuss our theoretical expectations, it is important that we explain how state attorneys general impact criminal justice policy outcomes. This is especially important given that state attorneys general do not usually vote on bills like most state legislators, and they do not have veto power like most governors. However, a large body of works demonstrates that executive branch administrators have the ability to influence policy outcomes (Carpenter Reference Carpenter2002; Miller Reference Miller2013; Miller, Witko, and Woods Reference Miller, Witko and Woods2018; Roman Reference Roman2017; Shay Reference Shay2020). For example, Carpenter (Reference Carpenter2002) asserts that executive branch administrators can develop a valuable reputation as policy experts, which can be used to build powerful alliance among lawmakers and interest groups, consequently, this can increase support for the administrator’s policy agenda. We outline several potential ways that the state attorney general can influence policy outcomes within a state.
First, due to their policy expertise, state attorneys general provide advice and information to state legislators and the governor (Miller Reference Miller2013). Attorneys general frequently testify in committee hearings on matters pertaining to criminal justice policies. For example, in 2011, Massachusetts Attorney General Martha Coakley fervently encouraged the state legislature to support “Melissa’s Bill,” which would prevent repeat violent offenders from receiving parole. She offered expert testimony to the Massachusetts legislature pertaining to the numerous benefits that the policy would bring to the state. Melissa’s bill was enacted a year later (Murphy Reference Murphy2012). In another prominent example, Attorney General Jeff Landry played a pivotal role in advancing legislation in the Louisiana legislature that would prosecute individuals who are seventeen or older in the adult criminal justice system, thus lowering the age in which individuals are treated as adults. The Louisiana Attorney General testified in a state committee with local prosecutors on the issue. According to one local journalist, the attorney general’s position was persuasive to lawmakers because the state was “in the middle of a crime wave” (Braun Reference Braun2022).Footnote 4 Additionally, attorneys general can issue opinions through op-eds, television, government websites, and various other information outlets. For example, Alabama Attorney General Steve Marshall frequently releases opinions on criminal justice-related issues directly on the Alabama Attorney General website (Alabama Judicial System 2024). Taken together, the information provided by the attorney general could result in the state enacting more punitive criminal justice policies, thus, influencing their incarceration rate.
Second, in many states, attorneys general have the potential to help craft legislation by introducing and sponsoring bills. In Washington state, one study found around 10% of the bills are sponsored by chief executive officials (Miller Reference Miller2013, p. 872). For example, in 1996, Washington Attorney General Christine Gregoire sponsored S.B. 6462, a bill that would help to increase penalties for individuals convicted of domestic violence. Moreover, state legislators have the ability to work with executive branch officials, such as the state attorney general, to craft and write the final piece of legislation (Lee Reference Lee2001). For instance, the Arkansas Times reports that Attorney General Tim Griffin played a pivotal role in crafting a punitive criminal justice policy that passed the Arkansas legislature (Millar Reference Millar2023b). The Attorney General of Arkansas worked with leaders in the legislature and the governor’s office with the goal to increase the incarceration rate in the state. Thus, since governors frequently collaborate with lawmakers to craft public policy, this might provide an opportunity for the attorney general’s office to influence the state’s incarceration rate.
Finally, the state attorney general can influence the incarceration rate through other mechanisms which may impact the state incarceration rate much more quickly. For instance, in many states, the state attorney general can influence the prosecutorial process (DeLong Reference DeLong1934). This includes bringing the cases forward and the sentences sought. In South Dakota, the attorney general frequently issues press releases which highlight the criminal cases their office helped to successfully prosecute and the sentences they secured (Attorney General Office of South Dakota 2023). The state attorney general office can also communicate and coordinate with local law enforcement officers to focus on fighting crime. This speaks to research by Whitford and Yates (Reference Whitford and Yates2009) that finds executive branch official statements that pertain to the “War on Drugs” influenced whether district and state officials prosecuted crimes pertaining to drug usage. Furthermore, there are examples which suggest this phenomenon occurs within state politics as well. For example, during a debate, Colorado Attorney General Phil Weiser reported that his office utilizes several tools to help fight the state’s rising crime rate, which could raise the incarceration rate, and this includes training with local police officers and the recruitment of local law enforcement officers. Further, Attorney General Weiser mentioned at the debate how his office helps to prosecute various crimes in the state (Solomon and Campbell-Hicks Reference Solomon and Campbell-Hicks2022).
In sum, there are several mechanisms through which an attorney general can influence the criminal justice policy outcomes in a state. First, since attorneys general frequently provide advice to the governor and the legislative branch, this information could influence the policies adopted and the incarceration rate. Second, in many states, the attorney general can help the lawmakers in writing their laws that pertain to criminal justice. This provides the attorney general with several avenues in which to influence the incarceration rate. Third, the state attorney general can potentially lead the prosecution of cases, and the sentences sought, which may influence the state’s incarceration rate. Likewise, they can communicate and coordinate with local law enforcement officers which could also influence the size of the state prison population. As will be outlined in greater detail below, for elected attorneys general, they should have a strong electoral motive to use these mechanisms to pursue punitive criminal justice policies that will increase the state’s incarceration rate because they can later engage in credit-claiming on the campaign trail to help their reelection efforts (Mayhew Reference Mayhew1974). We expect that electoral incentives combined with the boosted political accountability (due to being elected to oversee a specific policy domain) will encourage elected attorneys general to pursue punitive policies that result in a higher incarceration rate, especially when the crime rate in the state is high.
Electoral considerations and criminal justice policies
In his pathbreaking book, Congress: The Electoral Connection (Reference Mayhew1974), David Mayhew outlines how politicians are driven by a desire to secure reelection. This proposition has been extrapolated to state legislators (Hogan Reference Hogan2008), state judges (Hall Reference Hall1992), and state bureaucrats (Miller Reference Miller2017). We assert that electoral considerations may also influence state attorney general offices and the policies they pursue. In this section, building off Miller’s (Reference Miller2013) theoretical framework, we outline how the selection method of the attorney general office, conditioned on the level of crime, could impact the criminal justice policy outcomes in a state.
Previous research has demonstrated that politicians who pursue “tough on crime” policies tend to be rewarded by the public (Boldt Reference Boldt2019; Canes-Wrone et al. Reference Canes-Wrone, Minozzi and Reveley2011). Public opinion polls consistently suggest that the public prefers more punitive criminal justice policy outcomes (Warr Reference Warr1995). For instance, the General Social Survey (GSS) has polled the public across several decades on whether the courts “deal too harshly or not harshly enough with criminals.” Consistently, over 60% of the public responds that the courts are not harsh enough when dealing with criminals (National Opinion Research Center 2023).
There are two main theories that account for why the public supports punitive criminal justice policies. The first approach explaining the public’s desire for more punitive policies pertains to media coverage. In particular, local news coverage tends to focus heavily on violent crimes in the local area because it results in higher television ratings. Consequently, the public tends to overstate the prevalence of criminal behavior in the nation (Romer et al. Reference Romer, Jamieson and Aday2003). Second, some scholars suggest that racial politics are driving America’s preference for punitive criminal justice policy outcomes (Jardina Reference Jardina2019). As the racial and ethnic diversity of the USA increases, this may promote a strong desire among some Americans for more punitive criminal justice policies. This argument is consistent with research which finds strong connections between racial attitudes and policy preferences towards addressing crime (Hurwitz and Peffley Reference Hurwitz and Peffley2005).
For policymakers who will eventually face the voters, and they wish to remain in office, they need to advocate for policies that will please their constituents (Fiorina Reference Fiorina1978; Key Reference Key1966; Mayhew Reference Mayhew1974). For elected attorneys general, we assert that since they administer over issues pertaining to criminal justice, and because punitive policies are popular with the public, they will be inclined to advocate for policies that will result in higher incarceration rates. Afterall, the literature on retrospective voting suggests that the attorney general who does not support the policies which are popular with their constituents, including punitive policies, could eventually be voted out of office (Key Reference Key1966). Also, according to Gordon and Huber (Reference Gordon and Huber2007, p. 111), most backlash to a criminal justice policy tends to come from the perspective that the judicial system is “too lenient.” They also assert this backlash can come from the public, police unions, or a crime victim’s right interest group. If there is criticism that a sentence was too harsh, this frequently occurs years later shielding the politicians who advocated for the punitive policies.
However, why would attorneys general who are appointed by the governor behave differently than elected attorneys general?Footnote 5 One could reasonably argue that governors also want to pursue positions and policies that will boost their reelection efforts; thus, they will appoint attorneys general who also support and help implement “tough on crime” policies that will result in a higher incarceration rate (Cummins Reference Cummins2009; Gunderson Reference Gunderson2022).Footnote 6 There are two reasons we should observe states with appointed attorneys general be associated with different policy outcomes relative to states with elected attorneys general. First, elected attorneys general are directly accountable to voters and must actively campaign on issues that are salient to the public, such as managing crime (e.g. Thompson Reference Thompson2024). Because their political careers depend on being responsive to public safety concerns, they are more likely to aggressively advocate for punitive policies that are popular with the electorate and that contribute to higher incarceration rates. Conversely, appointed attorneys general are shielded from direct voter accountability. Their primary political loyalty lies with the governor who appoints them, not with the public. Governors have strong incentives to engage in credit-claiming (Mayhew Reference Mayhew1974), including for popular crime prevention efforts (Cummins Reference Cummins2009), and may prefer to centralize public recognition for such policies. As a result, they may discourage their appointed attorney general from independently championing tough-on-crime initiatives. With one key policymaker, particularly one central to the criminal justice system, pushing less aggressively for punitive measures, there may be reduced momentum to adopt policies that lead to higher incarceration rates. Moreover, appointed attorneys general may lack the political skillset or public platform to elevate crime as a salient issue in the way that elected attorneys general can, due to their experience on the campaign trail, further dampening public pressure for punitive crime policies that would impact the state’s incarceration rate.Footnote 7
A second reason we should observe a difference in the incarceration rate between states with elected and appointed attorneys general, as argued by Miller (Reference Miller2013), is that governors are responsible for a wide array of policy areas and are evaluated by voters based on their overall performance. This makes it difficult for voters to promote accountability in any one policy area, such as crime (Berry and Gersen Reference Berry and Gersen2008; Miller Reference Miller2013). Governors can potentially push their appointed attorneys general to pursue less punitive policies for various reasons (e.g. interest group or campaign donor pressure) that are not popular with the public and that result in a lower incarceration rate. In contrast, elected attorneys general are directly accountable to voters for a specific policy area, crime, and cannot focus on other policy areas to insulate themselves from public scrutiny (Lyons and Miller Reference Lyons and Miller2019). As a result, elected attorneys general face stronger political pressures to push for popular criminal justice policies, thus, states with this type of selection process may have a higher incarceration rate.
It is important to note that our theory does not require voters to be aware of the attorney general’s actions or possess specific information. As prior research has shown, most voters are uninformed about state and local politics, and state policymakers can often avoid accountability (Rogers Reference Rogers2017). Rather, we argue that elected executive officials may perceive the risk that voters could hold them accountable if the crime rate rises and may respond accordingly. Additionally, attorneys general may be concerned that a skilled challenger could notice their missteps and the rising crime rate, potentially making it a campaign issue (Arnold Reference Arnold1990). Thus, an electoral connection may exist even when voters are not highly informed about state policy issues.
We suggest the ability for elected attorneys general to influence a state’s incarceration rate may depend on the environment. In particular, when the crime rate is high, it should be easier for an elected attorney general to help adopt and implement policies that result in a higher incarceration rate. This is consistent with previous research which finds that elected judges are more likely to offer strict sentences when they are in a competitive election and the crime rate is high (Gordon and Huber Reference Gordon and Huber2007). Additionally, governors who preside over a state with a high crime rate tend to struggle in their next election (Cummins Reference Cummins2009). For elected attorneys general, it should be easier for them to win support among lawmakers to adopt more punitive criminal justice policies that will increase the incarceration rate when the crime rate is high because the issue is more salient, and the lawmakers will not want to face the wrath of their constituents for not addressing this pressing issue. Thus, lawmakers will rely heavily on the state’s top law enforcement officer to address the issue of crime. Afterall, a savvy elected attorney general can more easily persuade lawmakers to implement more strict criminal justice policies by painting the streets as filled with carnage and violence when the crime rate is rising.
Conversely, when the crime rate is low, crime should be less pressing to lawmakers, thus, they are less likely to implement policies that result in a higher incarceration rate. Further, the attorney general’s positions should carry less weight with the lawmakers because crime is a less pressing issue for their constituents. For the appointed attorney general, since they are not directly held accountable to the voters, they do not need to be as responsive to the public. Thus, they will not feel the political pressure to advocate for policies that will result in a higher incarceration rate. In fact, we will most likely observe little difference in the incarceration rate among states with appointed and elected attorneys general.Footnote 8 Afterall, in this context, fighting crime is not an important issue for states to address, thus, in states with appointed and elected attorneys general they will devote little resources and efforts that may result in a higher incarceration rate. This discussion leads us to the following theoretical expectation:
Hypothesis: With an increase in crime, states with an elected attorney general should be associated with a higher incarceration rate relative to states with an appointed attorney general.
Data, operationalization, and methodology
We have presented our theoretical rational linking the selection method of this executive branch administrative official, now we turn to an empirical investigation of our theoretical argument. To analyze the factors that explain the state incarceration rate, we analyze all USA states between 2001 and 2017. We are restricted to this time period based on the availability of our control variables. Additionally, based on our unit of analysis of a state in a given year, we rely on panel data to test our hypothesis.
Dependent variable
The specific measure of incarceration rate used in this study is the number of inmates in state correctional facilities (per 100,000 state population).Footnote 9 The dependent variable is derived from data provided by the Bureau of Justice Statistics, which is collected by the Department of Justice.
Key independent variables
Our key independent variables are the following: elected attorney general, crime rate, and an interaction between the two.Footnote 10 The elected Attorney General variable indicates whether the state’s attorney general office is elected (1) or appointed (0). Our reference category in all our models is whether the state attorney general is an appointee. In our dataset, approximately 14% of the observations involve a state with an appointed attorney general and 86% an elected attorney general.
Our key independent variable, elected Attorney General, is time-invariant within states over the study period. We recognize this as a limitation, as we cannot directly observe the before-and-after effects of a state changing its selection method. Despite this limitation, it is common practice among policy scholars to conduct analyses using time-invariant independent variables, recognizing their substantive importance for testing key theoretical expectations (see Miller Reference Miller2013; Miller, Witko, and Woods Reference Miller, Witko and Woods2018). We encourage future scholars to extend this analysis to periods in which there is a change in the selection process of the attorney general’s office.
To determine if the state incarceration rate is responsive to criminal activity in the state, we include a crime rate variable with data from Sorens et al. (Reference Sorens, Muedini and Ruger2008). Specifically, we analyze the violent crime rate in a state (per 100,000), with the following crimes coded as violent: murder, nonnegligent manslaughter, forcible rape, robbery and aggregated assault.Footnote 11 In addition to these variables, it should be noted that we lag almost all our explanatory variables by one year.Footnote 12
We interact the elected attorney general variable with the crime rate variable in order to determine if states with elected attorneys general are more likely to see their incarceration rates rise during periods of high crime relative to appointed attorneys general.
Additional explanatory variables
We control for a number of factors that might also influence a state’s number of inmates. Several studies show that public opinion can influence a state’s incarceration rate (Enns Reference Enns2016; Nicholson-Crotty et al. Reference Nicholson-Crotty, Peterson and Ramirez2009).Footnote 13 To capture this phenomenon, we use the citizen ideology measure developed by Berry et al. (Reference Berry, Fording, Ringquist, Hanson and Klarner2010). Previous research also finds that the preferences of the state government can affect incarceration rates (Stucky et al. Reference Stucky, Heimer and Lang2007; Yates and Fording Reference Yates and Fording2005). We measure the state’s government ideology with the ideology scores developed by Berry et al. (Reference Berry, Fording, Ringquist, Hanson and Klarner2010).Footnote 14 It should be noted, to create the citizen and government ideology measures, Berry et al. (Reference Berry, Fording, Ringquist, Hanson and Klarner2010) utilize DW-NOMINATE common space scores (Poole and Rosenthal Reference Poole and Rosenthal2000) to calculate the ideological values for these state entities. Additionally, the government ideology variable captures the ideology of both the state legislature and governor. For both the citizens and state government, higher values indicate more liberalism. We expect both coefficients to be significant and negatively signed.
State politics scholars have found that more professionalized legislatures are associated with the lawmakers more closely following the preferences of their constituents because of the increased value of their seats (Maestas Reference Maestas2000). If this is the case, we may observe lawmakers in professionalized legislatures adopting more punitive policies to pander to their voters. We use Squire’s (Reference Squire2007) measure of legislative professionalism which incorporates salary, staff, and calendar length in a session. Higher values indicate the legislature is more professionalized. We also control for a state’s percentage urbanization (Iowa Community Indicators Program 2023). Some scholars find that more urban areas tend to have higher levels of crime (Ousey Reference Ousey2000). This might result in a higher incarceration rate.Footnote 15
Southern states have been shown to have a higher incarceration rate relative to non-Southern states (Michalowski and Pearson Reference Michalowski and Pearson1990). Therefore, we include a dummy variable that captures whether a state is in the south (1) or not (0).Footnote 16 A large body of works finds that states with larger African American populations tend to have more inmates (Smith Reference Smith2004; Weaver Reference Weaver2007; Yates and Fording Reference Yates and Fording2005). Therefore, we control for the percentage of African Americans in a state.
States with more law enforcement officers may have a larger share of inmates. We capture this factor with the law enforcement spending variable. This data comes from the USA. Census State and Local Government dataset, and it is measured as the amount of state spending devoted to police per capita. This variable is adjusted for inflation.
Finally, we include several variables that control for the economic conditions in a state. Brown (Reference Brown2013) finds that the state incarceration rate is heavily dependent on the amount of state revenue in a state. States with more revenue have greater capacity to hold inmates. Similar to Brown, we measure revenue as a state’s revenue divided by the GSP level in a given year (Klarner et al. Reference Klarner, Phillips and Muckler2012). Wealthier states should have lower crime rates. Thus, we account for a state’s income per capita. We suggest that states with larger economies may have greater resources to invest in criminal justice infrastructure (e.g. prisons). Thus, we also control for a state’s economy size with the state’s GSP.Footnote 17 States with more individuals living in poverty may result in a higher crime rate, thus, a higher incarceration rate. The poverty rate variable is the percent of individuals living in poverty. Higher values indicate a state has a larger share of its population living in poverty.
Methods
We include year-fixed effects in our model to account for any factors that are time-invariant. Additionally, we estimate the coefficients presented below with a linear model and include random effects for each state. We use a random effect model as suggested by Clark and Linzer (Reference Clark and Linzer2015, p. 403), when your key independent variable varies little within cross section.
As a robustness test, we have also estimated a model with state fixed effects similar to Miller, Witko, and Woods (Reference Miller, Witko and Woods2018) and the results are shown in the Appendix (see Appendix A). The substantive findings are similar to those presented here.Footnote 18
Analysis
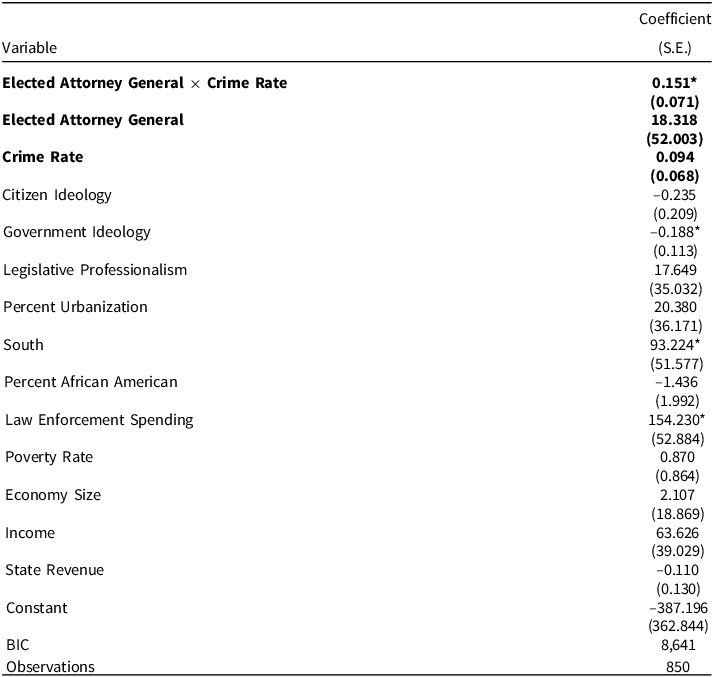
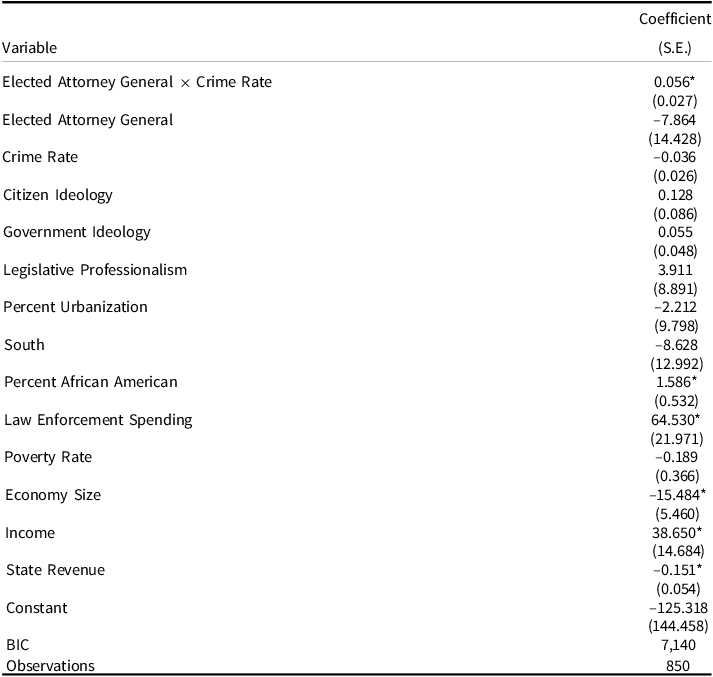
Table 1 presents a linear model with a random effect on each state that explains the state’s incarceration rates. The model includes all the explanatory variables as discussed above. As expected, our Elected Attorney General × Crime Rate variable is statistically significant and positively signed. This indicates that the effect the state attorney general’s selection method has on the incarceration rate is conditioned on the crime rate in the state.
Determinants of state incarceration rates
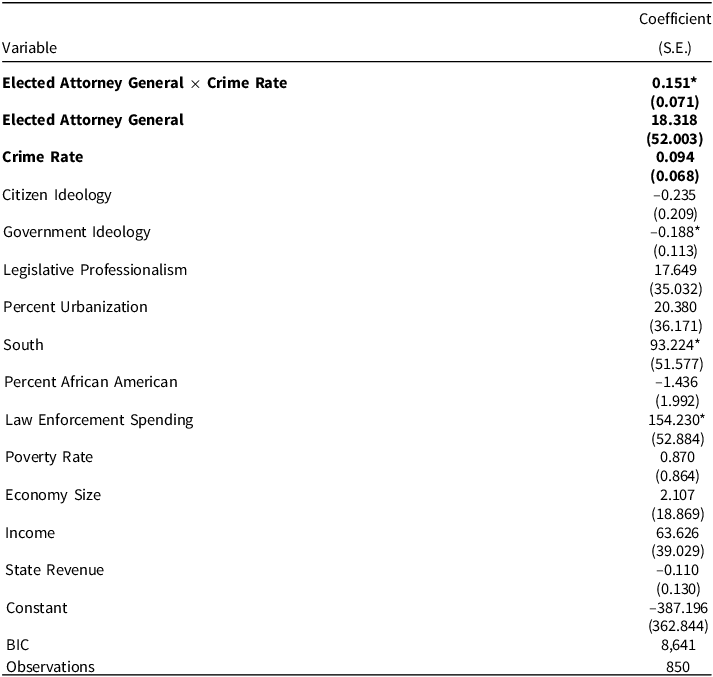
Notes: Unit of analysis is state in a given year. Dependent variable is incarceration rate (per 100,000). Higher values indicate a higher imprisonment rate. Model includes year-fixed effects. The coefficients are estimated from a linear model with a random effect on every state. Bold values indicate key independent variables. *p ≤ 0.05 (all one-tailed tests).
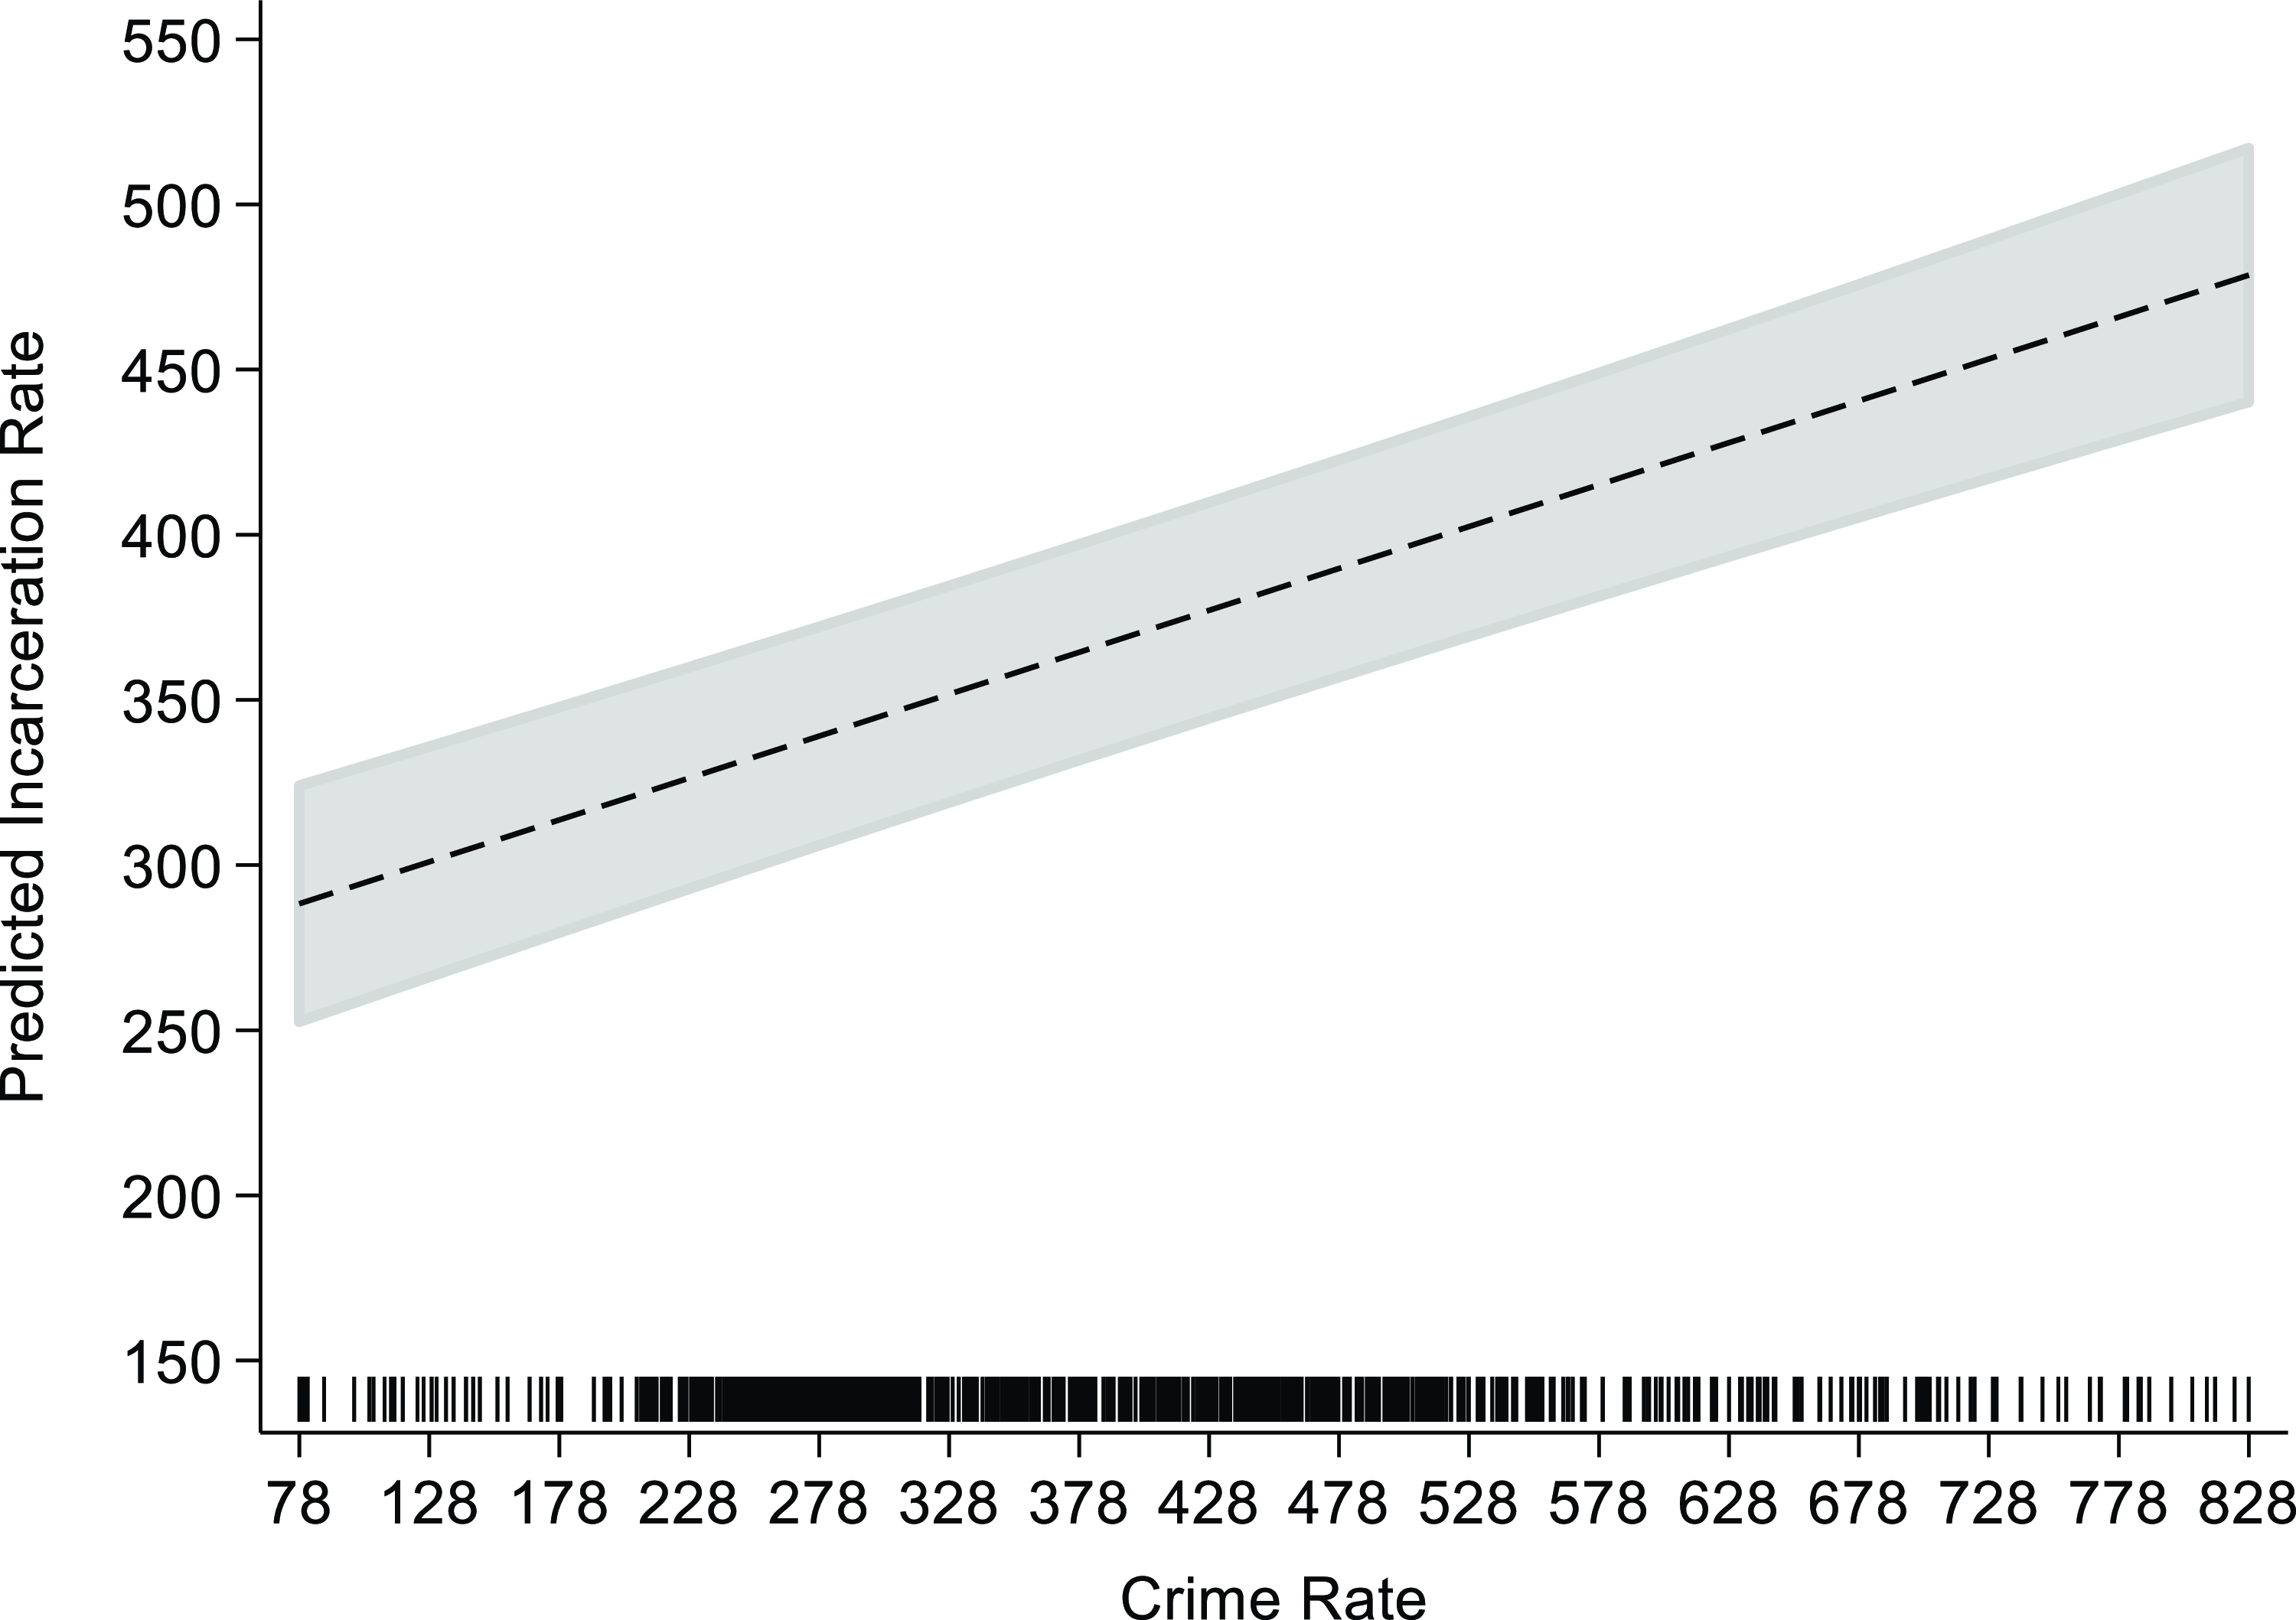
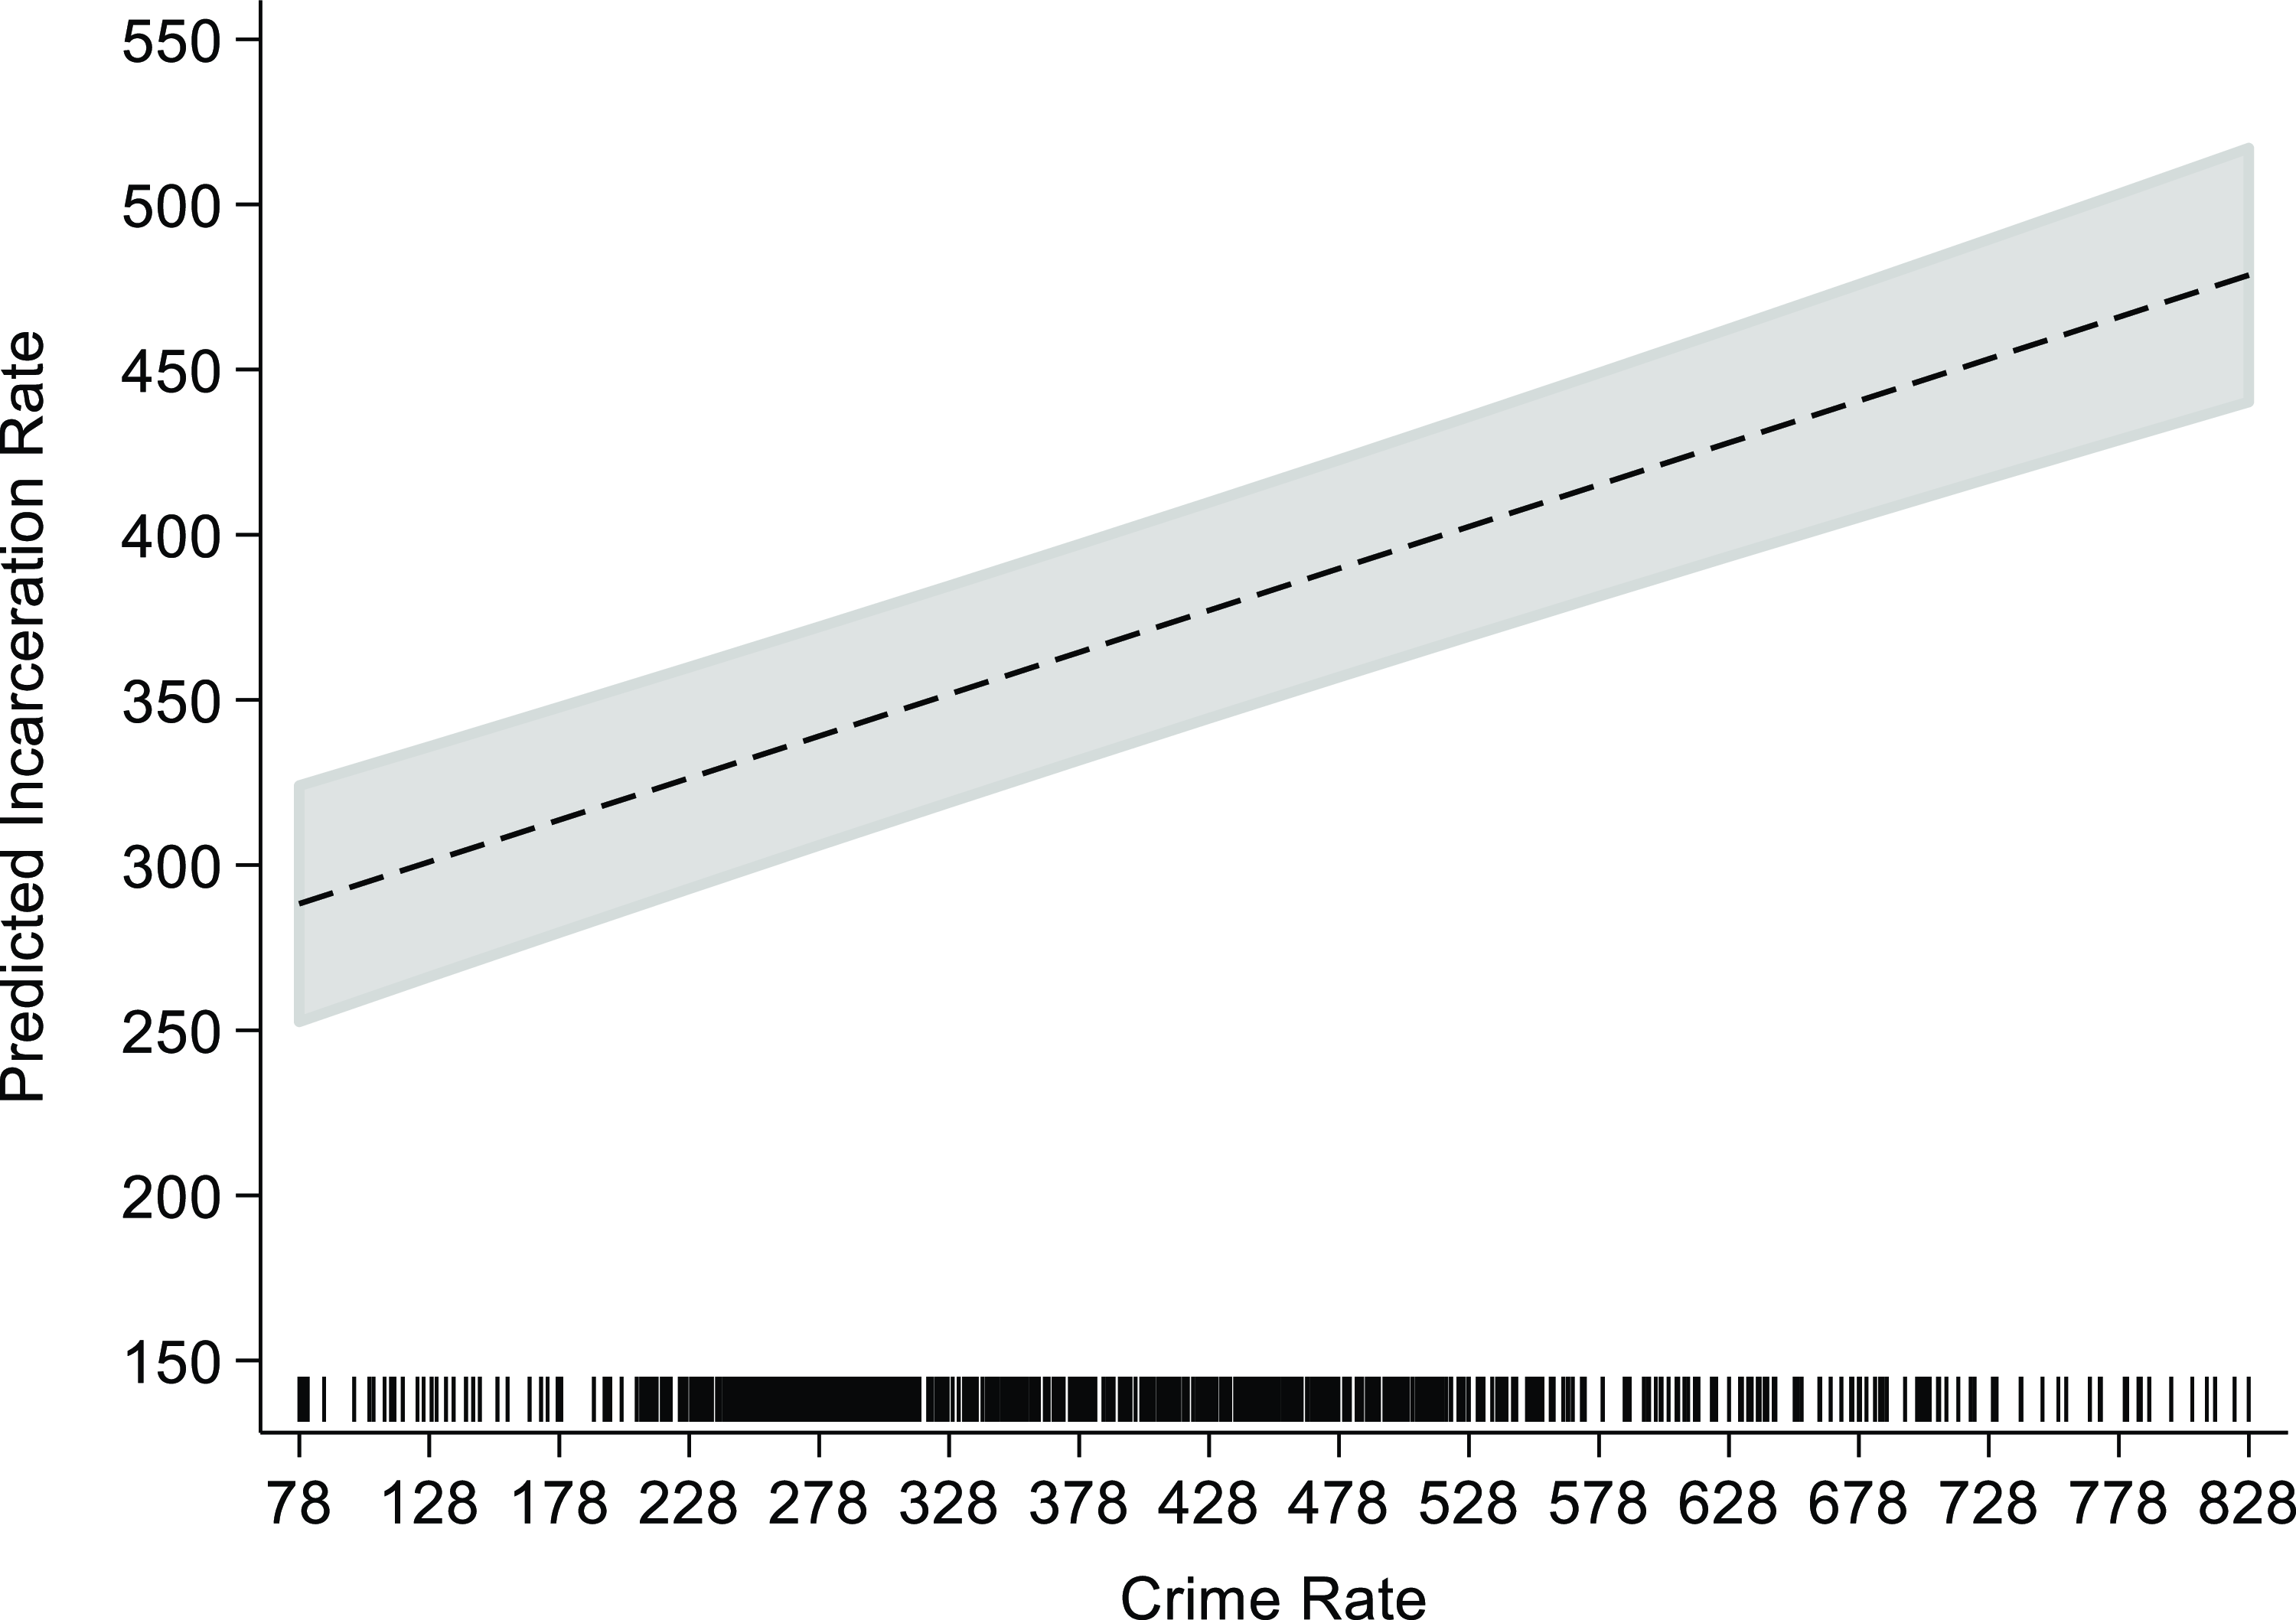
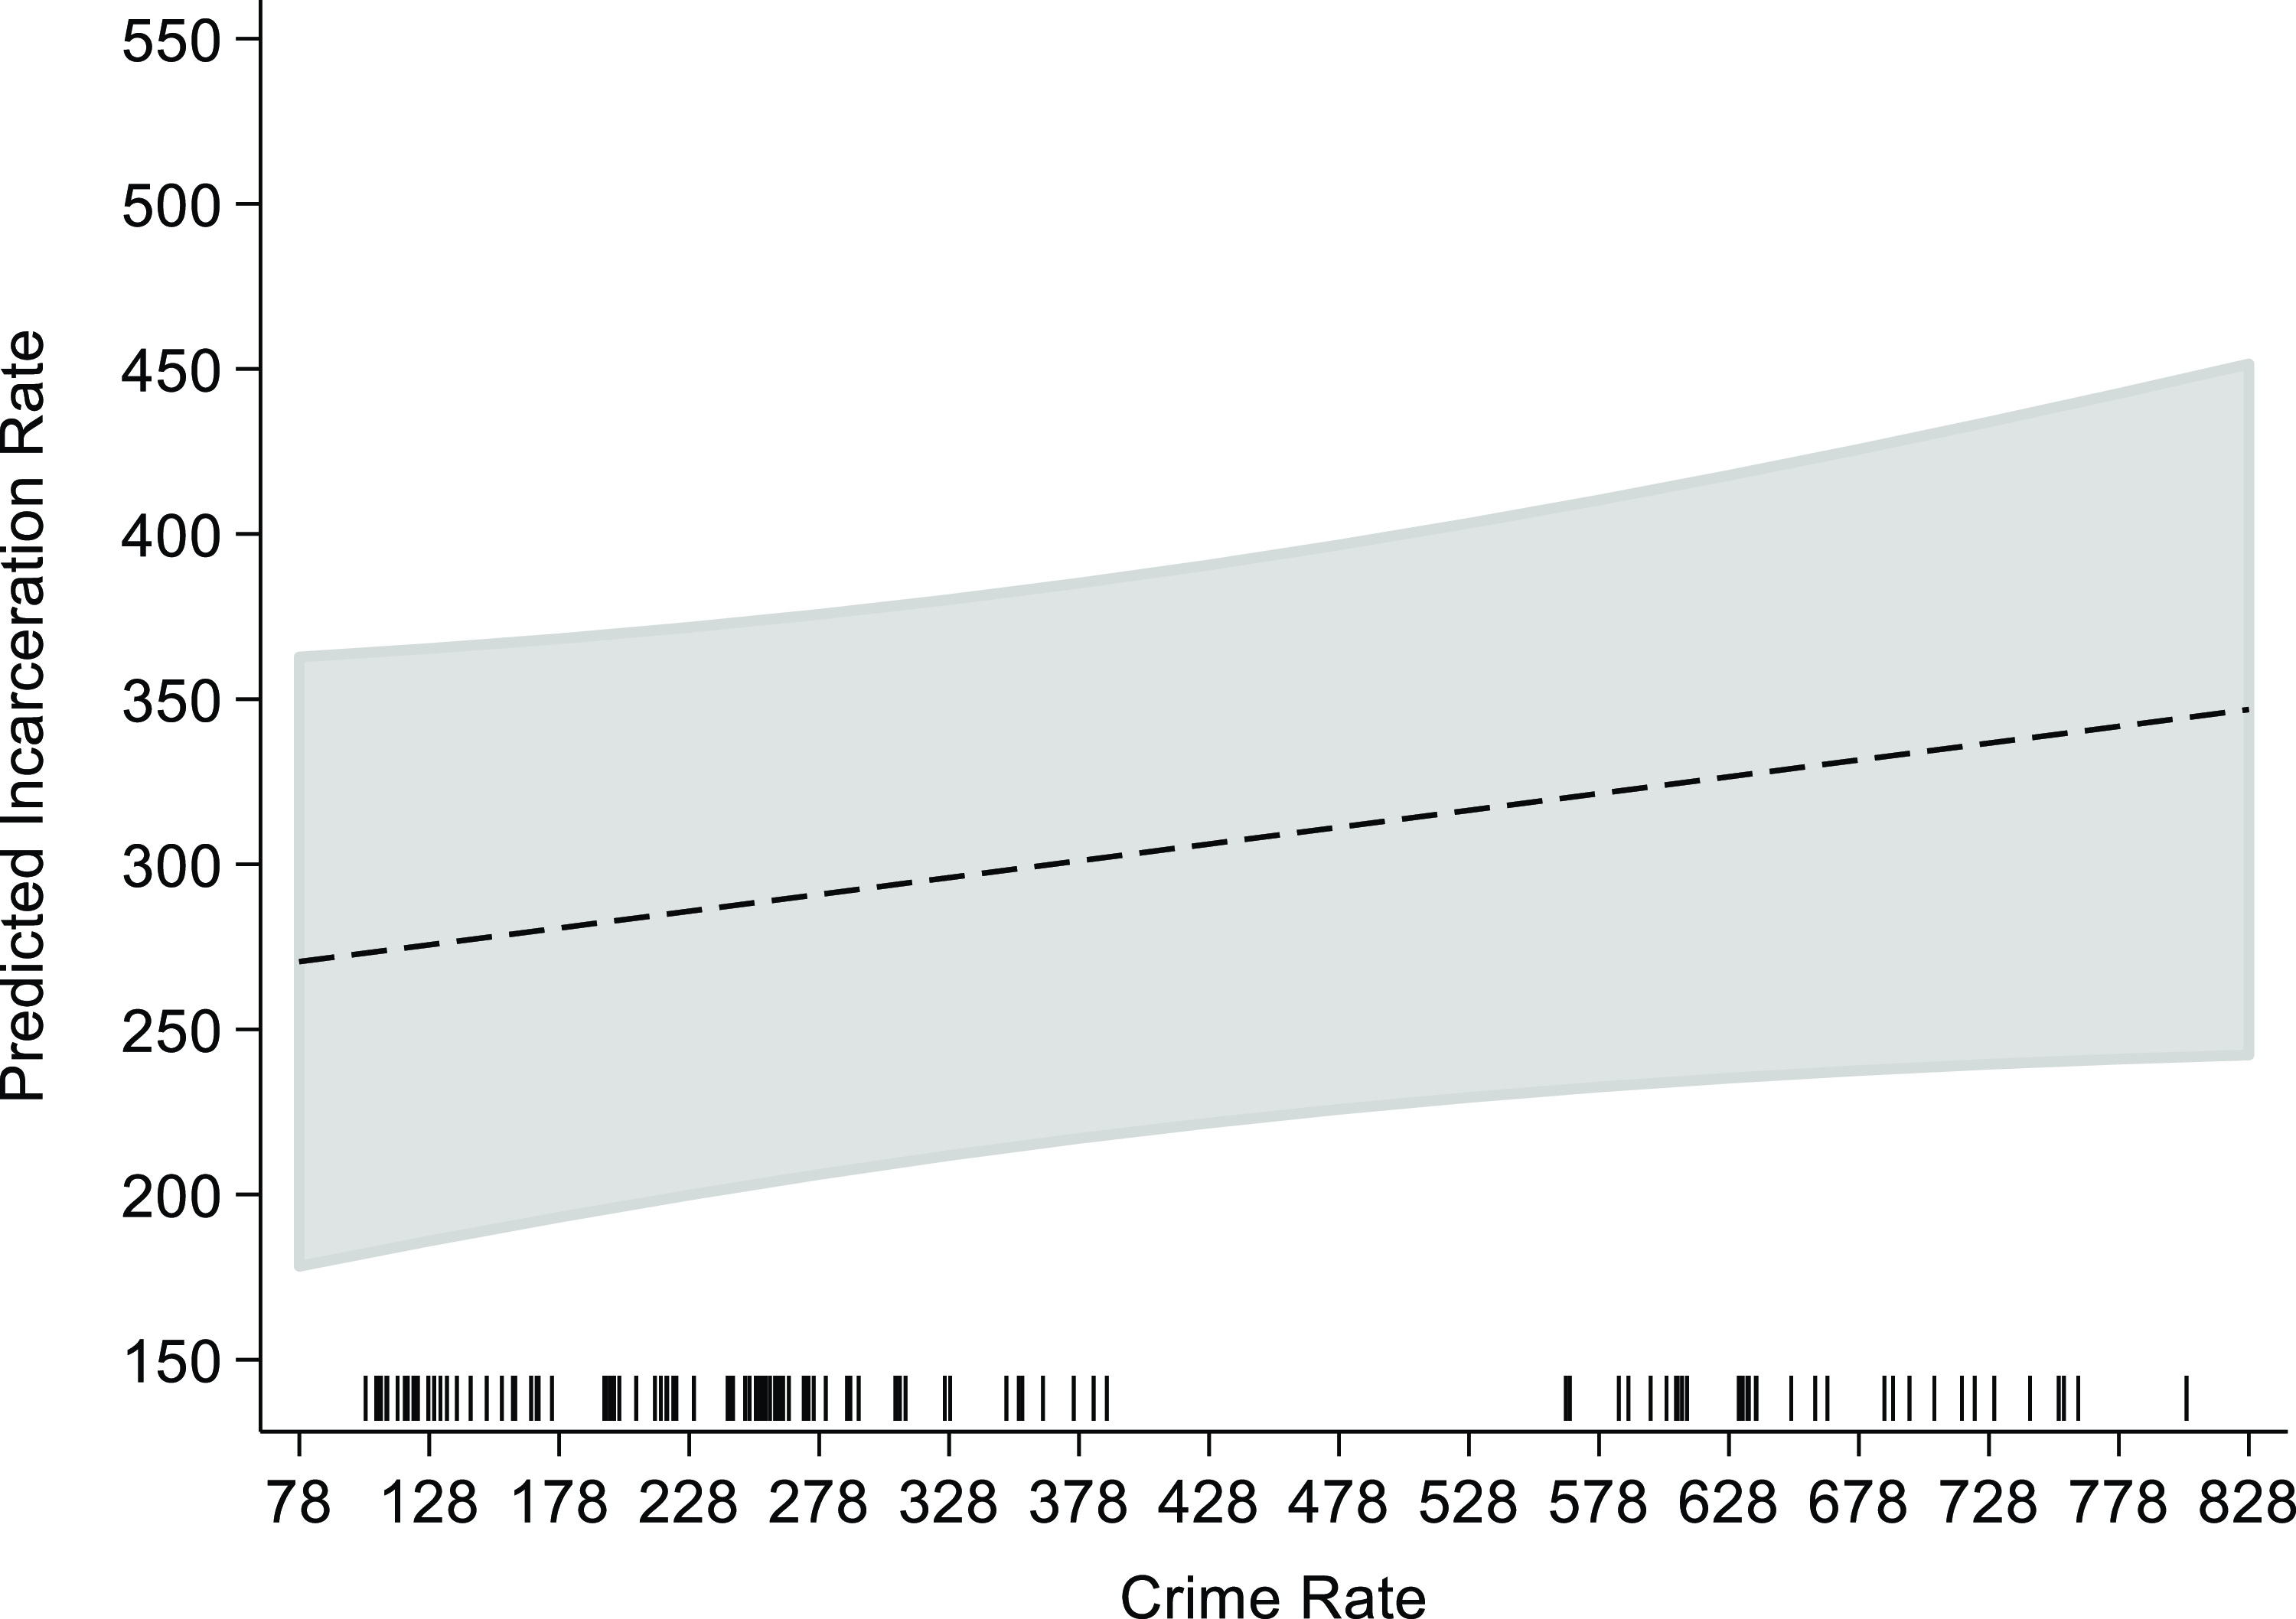
To help alleviate the interpretation of the substantive effects of our results, the impact of our interactive variable can be seen graphically in Figures 1 and 2. Figure 1 shows the predicted incarceration rate of states with elected attorney general (dark gray confidence band and a dashed line to represent the predicted values) across a range of crime rate values. At the lowest level of crime (holding the interaction at the corresponding value and all other variables constant), a state with an elected attorney general is associated with an incarceration rate of 293 (per 100,000). In contrast, at the highest level of crime, the incarceration rate rises to 477, a 58% increase. Figure 2 shows the predicted incarceration rates for appointed attorneys general. For appointed attorneys general, shifting the crime rate variable from its minimum to maximum value corresponds with an increase of the incarceration rate variable to 70 (263 to 333), or a 27% increase.
Predicted incarceration rate for elected attorneys general.
Notes: The predicted incarceration rates are from the estimates in Table 1. The predicted values for elected attorneys general are represented by the dashed line. All control variables are held constant.
Predicted incarceration rate for appointed attorneys general.
Notes: The predicted incarceration rates are from the estimates in Table 1. The predicted values for appointed attorneys general are represented by the dashed line. All control variables are held constant.
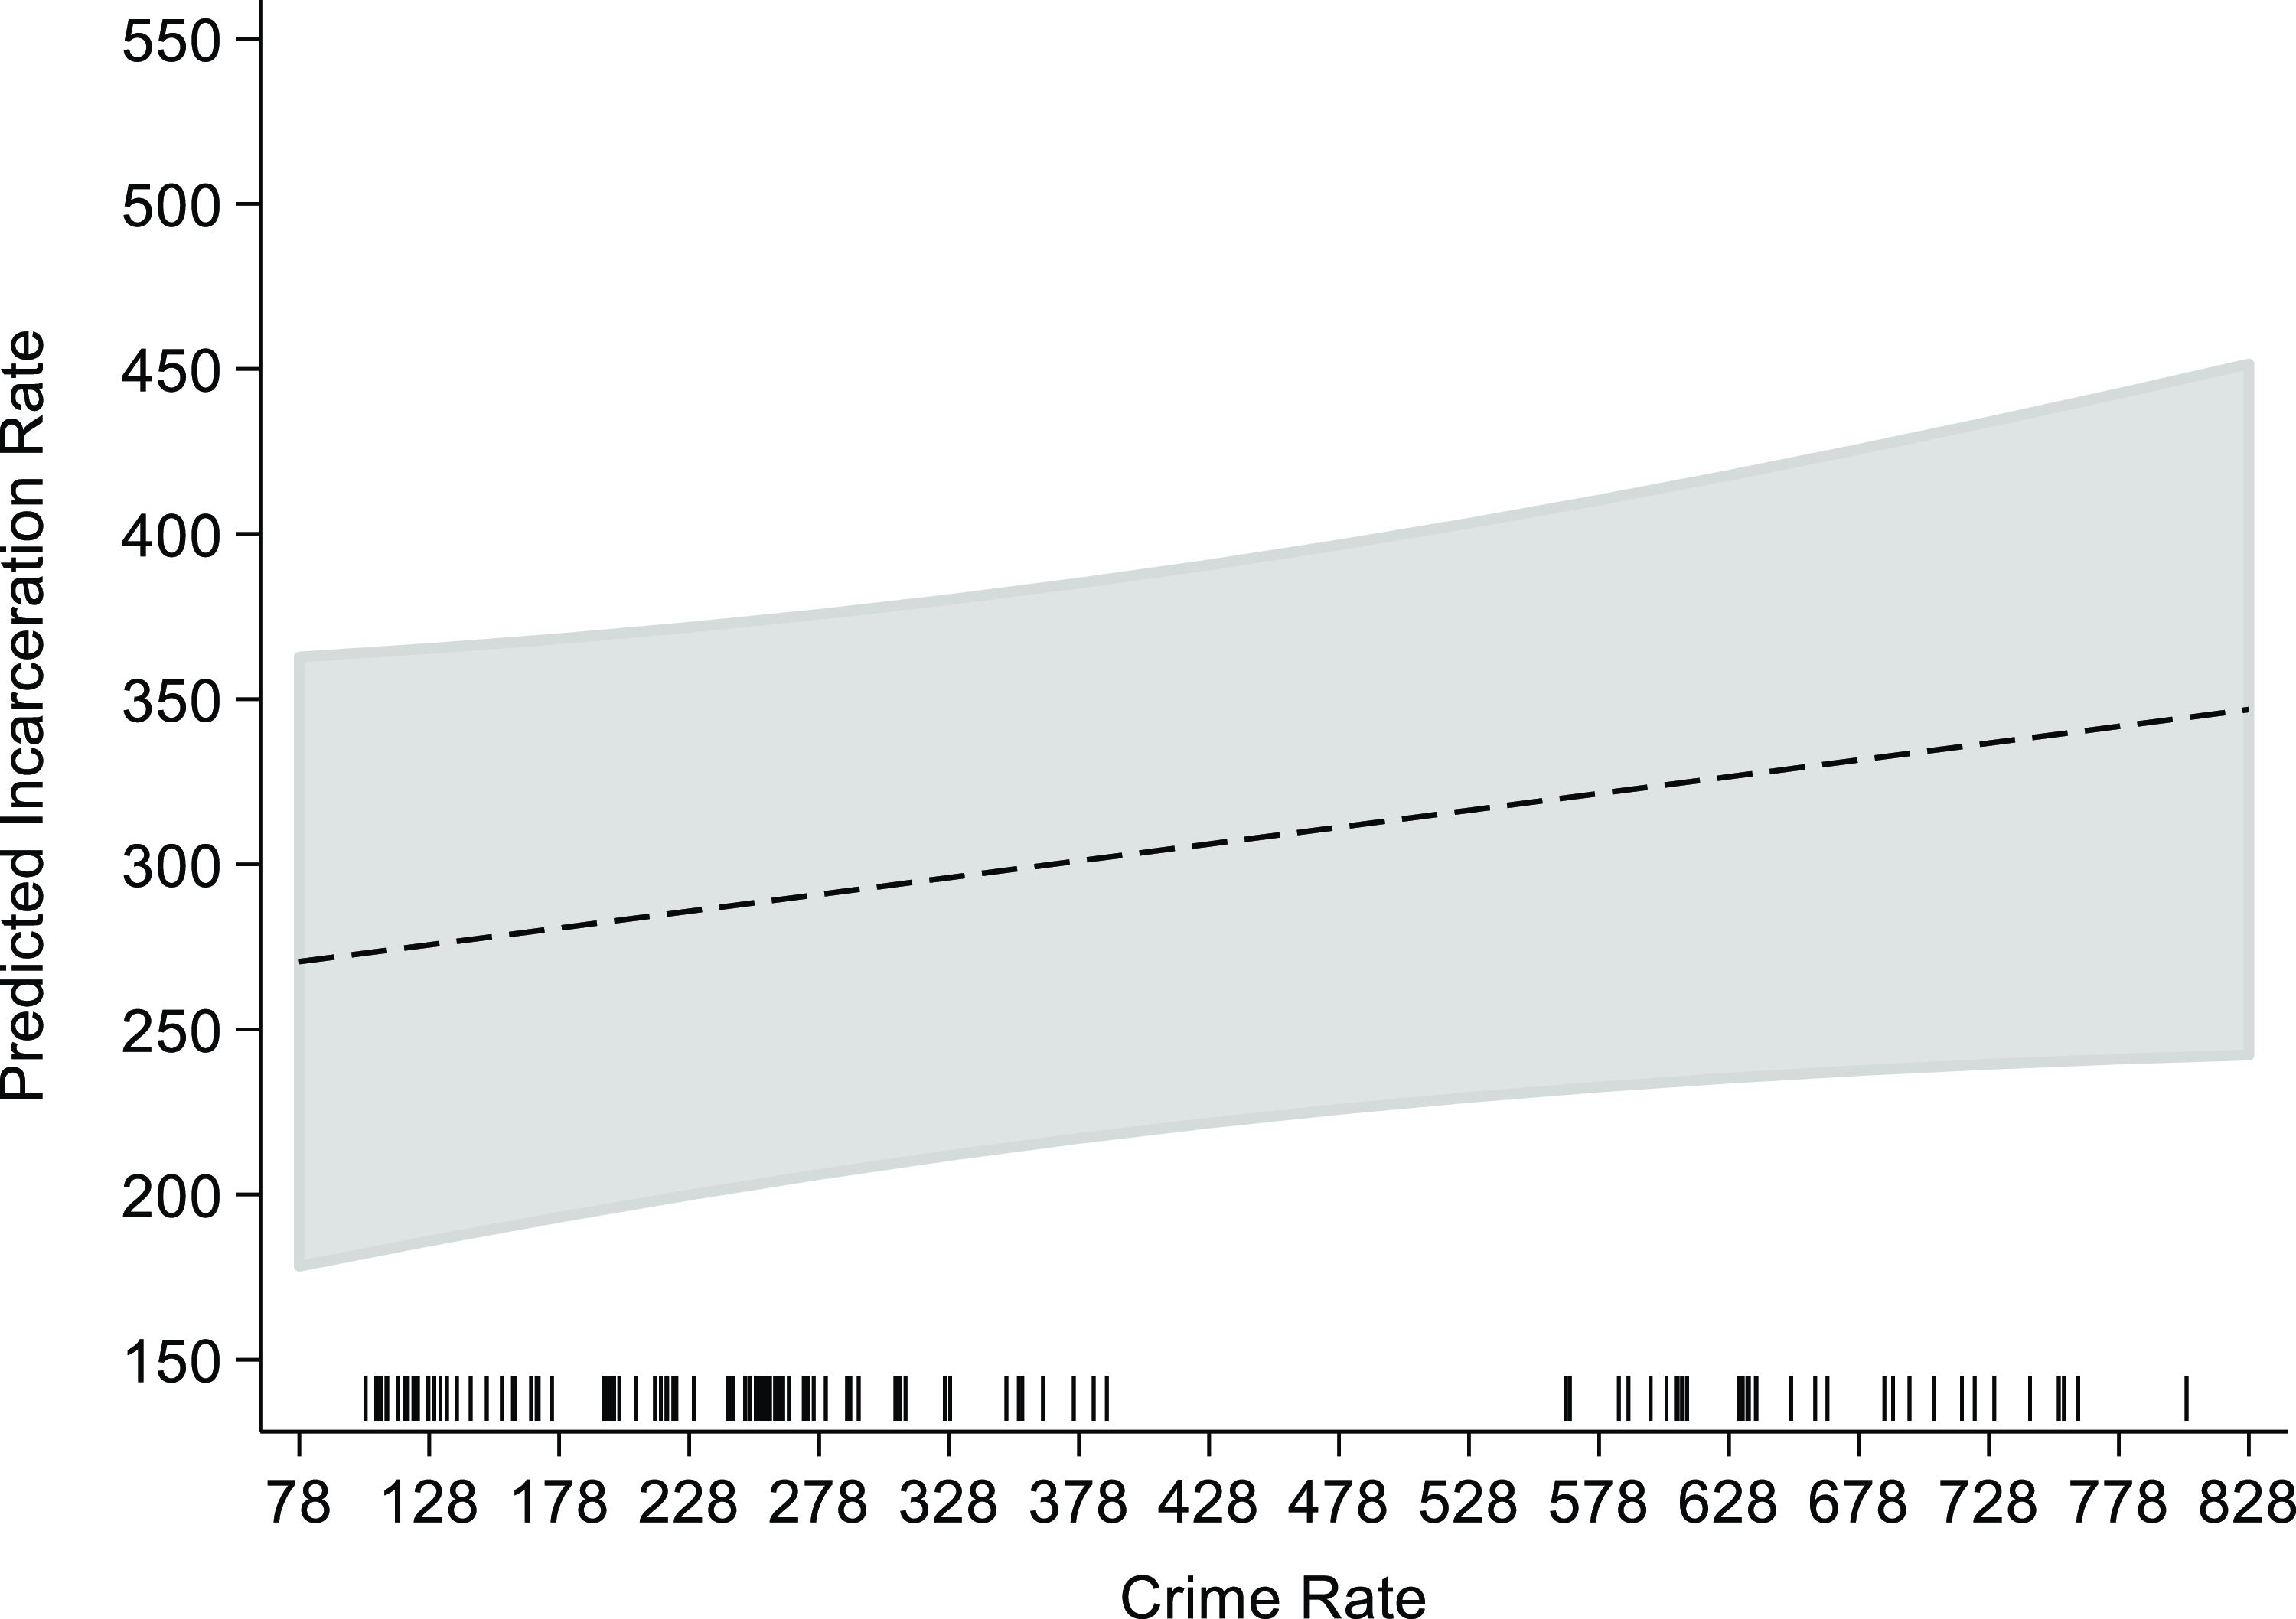
It is important that we put our substantive findings in the proper context. First, we recognize that the impact of a state’s selection method should work alongside with other more prominent factors that predict a state’s incarceration rate such as the level of support for punitive criminal justice policies among the public (Warr Reference Warr1995) and the demographics of a state (Smith Reference Smith2004). This is evidenced by Figures 1 and 2. Second, the effect of the selection method for the state’s general attorney only has an impact on the incarceration rate when a state’s crime rate is high (i.e. approximately one standard deviation above the average crime rate value in our dataset). For lower levels of crime, the difference in the incarceration rate for states with appointed attorneys general relative to those with elected attorneys general is not statistically significant. This suggests that the selection method only has an impact when the crime rate is relatively high.
Several of our additional explanatory variables also have a statistically significant effect on a state’s incarceration rate. States that spend more on law enforcement per capita tend to have higher incarceration rates. We also find that more liberal state governments are associated with lower incarceration rates. Further, southern states are associated with higher incarceration rates than non-southern states. Conversely, the remaining variables do not reach conventional levels of statistical significance.
Robustness test: attorney general influence on policing expenditure
Attorneys general have limited direct authority to increase incarceration rates on their own. Incarceration rates depend on other political actors such as prosecutors, judges, and lawmakers. To help strengthen our argument, we analyze other criminal justice-related outcomes where the attorney general may have more direct influence. This helps demonstrate the robustness of our theory and shows a broader pattern of attorney general influence over policy.
We use data from the U.S. Census Bureau (2001–2017), specifically the Annual Survey of State Government Finances. We examine the amount of state expenditures allocated to policing. We use this measure because it represents a criminal justice policy area where attorneys general should have some influence, and because policing expenditures can, in turn, affect incarceration rates. Further, policing is a criminal justice policy area that tends to be highly salient among the public and interest groups. Regarding the operationalization of this dependent variable, we adopt a procedure similar to that used by Stucky, Heimer, and Lang (Reference Stucky, Heimer and Lang2007). Specifically, the dependent variable is the percentage of total state expenditures allocated to policing in a given year. According to Stucky and his colleagues, because state spending is effectively a “zero-sum game,” it is preferable to focus on police spending as a share of the total budget. Using this dependent variable enables a clearer assessment of how political factors shape state decisions to prioritize police expenditures over other budgetary areas, which cannot be as easily captured with a per capita measure.
The results are shown in Table 2. The Crime Rate × Elected Attorney General interaction term is statistically significant.Footnote 19 The results indicate that an increase in crime is associated with an increase in the percentage of state funding allocated to policing in states with an elected attorney general. Conversely, in states with an appointed attorney general, an increase in crime is associated with a decrease in the funding allocated to policing.
Determinants of percentage of policing expenditures
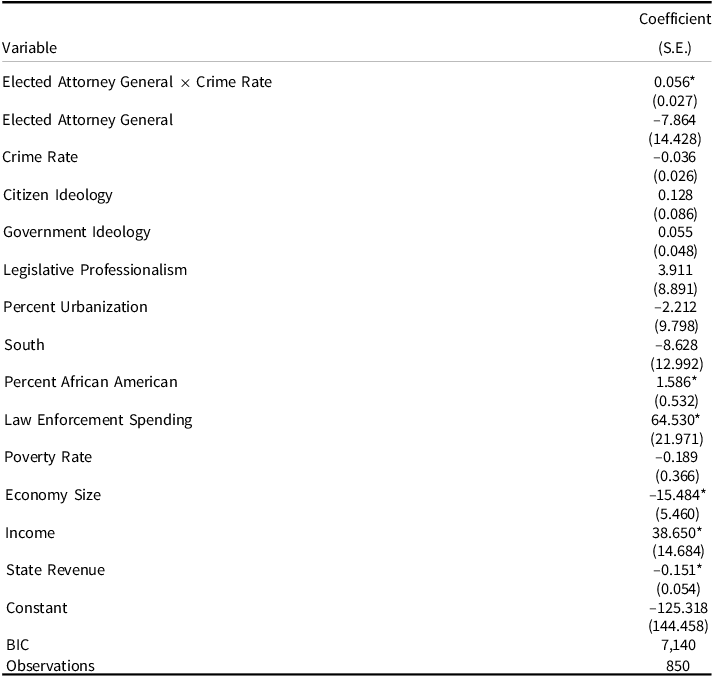
Notes: Unit of analysis is state in a given year. Dependent variable is percentage of state expenditures on policing. Model includes year-fixed effects. The coefficients are estimated from a linear model with a random effect on every state. *p ≤ 0.05 (all one-tailed tests).
Attorney general partisanship and state incarceration rate
For decades, Republican politicians have made “law and order” a cornerstone of their party’s platform (Campbell and Schoenfeld Reference Campbell and Schoenfeld2013; Jacobs and Carmichael Reference Jacobs and Carmichael2001; Weaver Reference Weaver2007). Further, several studies have shown that more Republican-leaning state legislatures are associated with higher incarceration rates (Smith Reference Smith2004; Stucky et al. Reference Stucky, Heimer and Lang2005) and more punitive criminal justice policies (Karch and Cravens Reference Karch and Cravens2014). As the crime rate rises, it may be easier for elected Republican attorneys general to persuade other relevant policymakers to enact policies that increase the incarceration rate. Thus, it is possible that, with an increase in crime, states with a Republican attorney general may be associated with a higher incarceration rate.
Conversely, since many of the constituencies who are negatively impacted by punitive criminal justice policies tend to be Democratic leaning (Yates and Fording Reference Yates and Fording2005), we might observe Democratic attorneys general not being associated with more punitive criminal justice policies which will result in a lower incarceration rate.Footnote 20 State attorneys general who belong to the Democratic Party and who assist in adopting policies that result in a higher incarceration rate may raise ire within their primary electorate and provide fodder for potential challengers in the next primary election. Even as the crime rate rises, elected Democratic attorneys general may be cautious about upsetting some of their constituents. This does not mean Democratic attorneys general can be completely “soft” on crime. Indeed, the median voter in most states tends to prefer more punitive criminal justice policies (Enns Reference Enns2016), and several Democratic-leaning constituencies are sympathetic to more strict criminal justice policies (Cox and Edwards Reference Cox and Edwards2022) which results in a higher incarceration rate. However, we assert that the incentive to pursue punitive criminal justice policies that result in a high incarceration rate should be weaker for elected Democratic attorneys general relative to Republicans.
To test whether partisanship is at play, we create a series of new variables. The elected Republican Attorney General variable is coded as whether an attorney general is elected and a Republican (1) or not (0). Likewise, the elected Democratic Attorney General variable is coded as whether the attorney general is elected and belongs to the Democratic Party. The reference category is whether a state has an appointed attorney general. Again, we interact the elected Republican Attorney General and elected Democratic Attorney General variables with the crime rate variable. We use the same control variable and estimator as described above.
It should be noted that the approach we adopt treats the attorney general selection method and partisanship as a trichotomous variable: elected Republican attorney general, elected Democratic attorney general, and political appointee. An alternative approach would be to code whether an attorney general is the following: Democrat attorney general (1) or not (0); Republican attorney general (1) or not (0); and elected attorney general (1) or appointed attorney general (0). Finally, with these hypothetical variables, one could do a triple interaction based on the attorney general’s partisan affiliation, selection method, and the crime rate. We do not adopt this approach for several reasons. First, identifying the partisan affiliation of appointed attorneys general is difficult and it is not uncommon for governors to select administrators who do not belong to their party. Additionally, triple interactions can be difficult to interpret. Thus, we use the trichotomous approach.
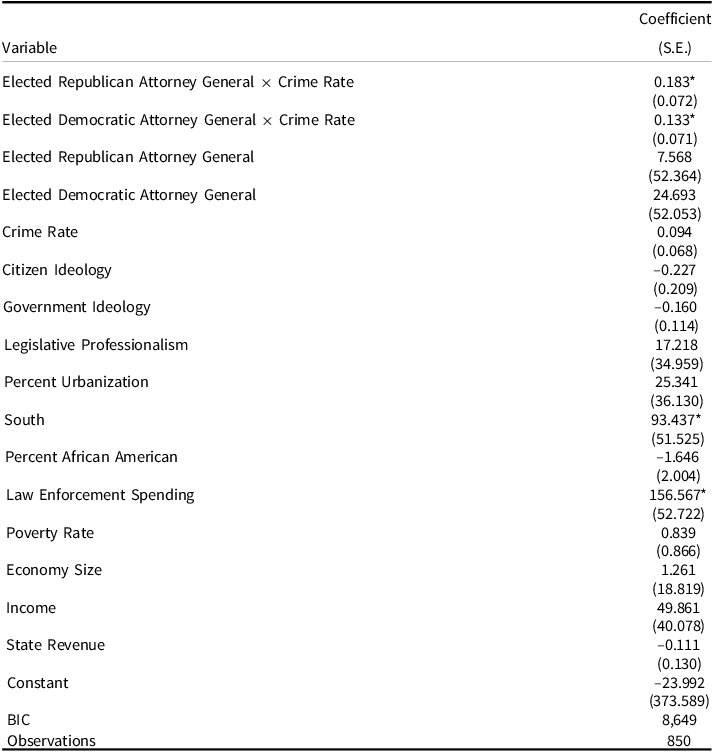
The results are shown in Table 3. As expected, the elected Republican Attorney General × Crime Rate variable is statistically significant.Footnote 21 This indicates that states with elected Republican attorneys general are associated with a higher incarceration rate relative to states with appointed attorneys general. Interestingly, we find that the elected Democratic Attorney General × Crime Rate variable is statistically significant.Footnote 22 This interactive variable indicates that states with elected Democratic attorneys general are also associated with a higher incarceration rate (as the crime rate variable increases) relative to appointed attorneys general. However, the effect of this interactive variable on the incarceration rate is smaller relative to states with an elected Republican attorney general. This empirical finding is consistent with Hall (Reference Hall1992) which shows that elected liberal state supreme court justices are more likely to vote in favor of the death penalty if they have to face reelection soon.Footnote 23 Because left-leaning policymakers are aware that their party’s reputation can be a disadvantage when it comes to criminal justice issues, they sometimes strategically take positions to help their reelection prospects.Footnote 24
Impact of AG partisanship of state incarceration rates
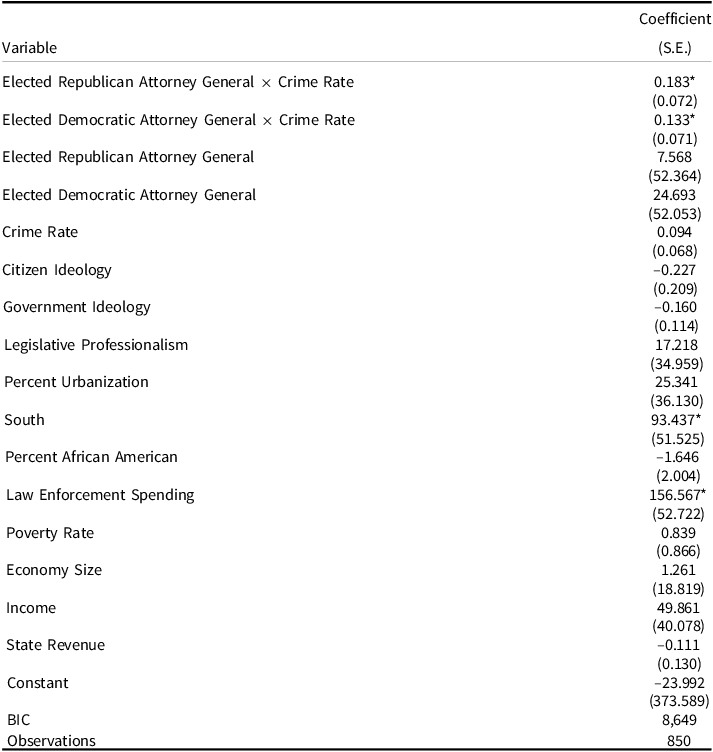
Notes: Unit of analysis is state in a given year. Dependent variable is incarceration rate (per 100,000). Higher values indicate a higher imprisonment rate. Model includes year-fixed effects. The coefficients are estimated from a linear model with a random effect on every state. *p ≤ 0.05 (all one-tailed tests).
Executive dynamics: governors, attorneys general, and incarceration rates
While elected attorneys general face electoral incentives to adopt tough-on-crime positions, their ability to pursue such agendas is shaped by the broader executive environment. In particular, we suggest that the gubernatorial office should be analyzed, as governors have the ability to influence criminal justice policies through budgetary powers and appointments (Gunderson Reference Gunderson2022). Consequently, we analyze the effect that the governor’s partisanship may have on the incarceration rate given the attorney general’s partisanship.
To investigate this claim, we construct several new variables. First, we control for whether the governor is a Democrat (1) or not (0) with a Democratic Governor variable. We interact this variable with both the previously discussed Elected Republican Attorney General and Elected Democratic Attorney General variables.Footnote 25
Because state lawmakers can also influence incarceration policy (Stucky, Heimer, and Lang Reference Stucky, Heimer and Lang2005), we examine whether the elected attorney general’s effect varies based on legislative control. In particular, we construct a categorical variable indicating whether the state legislature is Republican , Democratic , or split partisan control. We use split partisan control as the reference category. We then interact the attorney general partisanship variables with the partisanship of the legislature. Because ideology and partisanship are highly collinear, we drop the Berry state government ideology scores from this analysis.
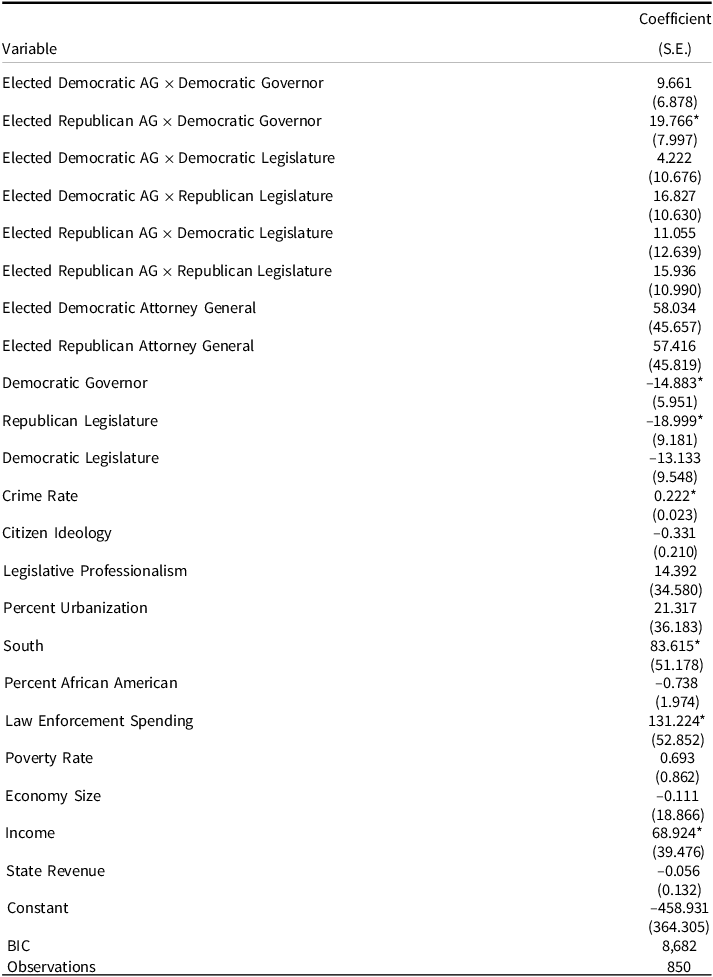
The results are shown in Table 4. We find that only the Elected Republican Attorney General × Democratic Governor interaction is statistically significant. In particular, the incarceration rate tends to rise in states where a Democratic governor serves alongside a Republican attorney general. This finding aligns with research from Gunderson (Reference Gunderson2022), who reports that states with vulnerable Democratic governors are associated with higher incarceration rates.
Testing the influence of gubernatorial, attorney general, and legislative partisanship
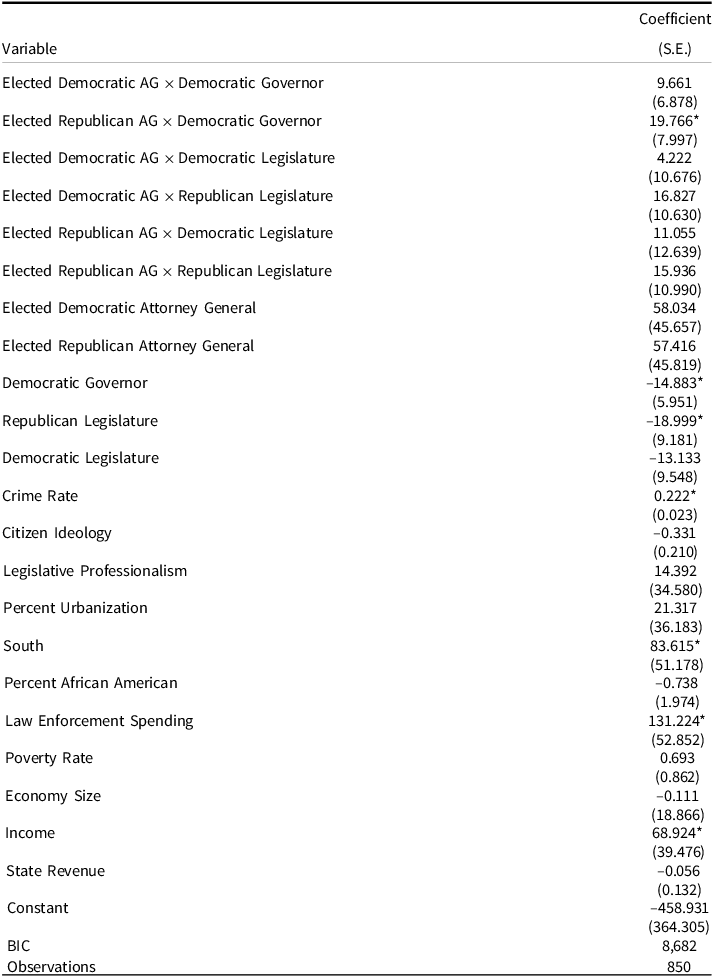
Notes: Unit of analysis is state in a given year. Dependent variable is incarceration rate (per 100,000). Higher values indicate a higher imprisonment rate. Model includes year-fixed effects. The coefficients are estimated from a linear model with a random effect on every state. *p ≤ 0.05 (all one-tailed tests).
We suggest this pattern occurs because the Republican attorney general could be a future competitor against the Democratic governor, as the attorney general’s office is frequently a launching pad for ambitious politicians. Further, because crime is often a vulnerable issue for some Democratic candidates, Democratic governors may also support policies that result in a higher incarceration rate. Ambitious Republican attorneys general, in turn, have incentives to push for tough-on-crime policies to differentiate themselves from the Democratic governor and to provide themselves with a salient issue to campaign on.
Public opinion and the selection method of attorney general
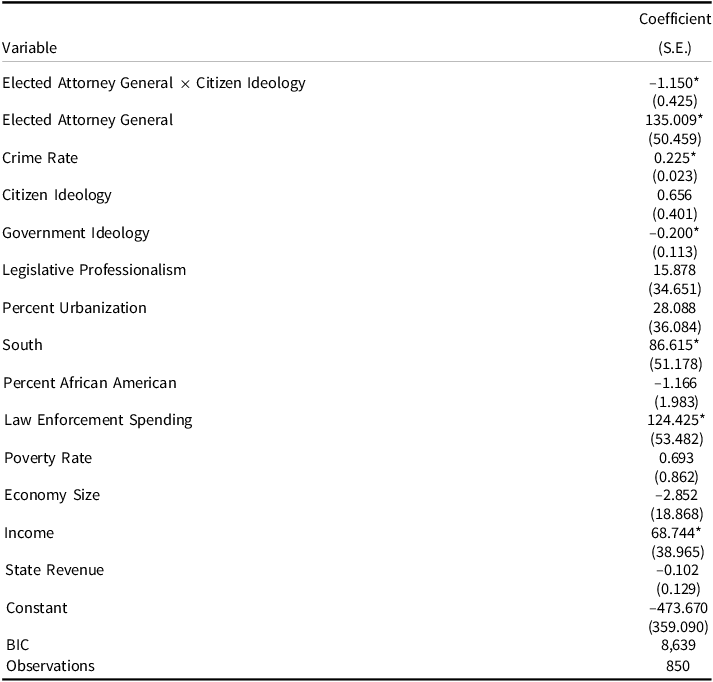
We assert that states with elected attorneys general should be more responsive to the public. Consequently, we may observe that states with elected attorneys general may follow public opinion more closely than states with appointed attorneys general. To measure public opinion, we use the citizen ideology measure as described in the prior section. This measure is developed by William Berry and his colleagues and is based on DW-NOMINATE scores. Higher values indicate a state’s population is more liberal. While the public’s general mood or ideology may not perfectly align with the public’s mood on criminal justice policies, they should be strongly correlated. We interact his variable with the elected Attorney General variable to see if states with elected attorneys general more closely follow public opinion. We would expect states with an elected attorney general an increase in liberal citizens should be associated with a decrease in the incarceration rate.
The results are shown in Table 5. The Elected Attorney General × Citizen Ideology variable is statistically significant.Footnote 26 We find that states with elected attorneys general are more responsive to public opinion. Specifically, we find that an increase in conservatism among the public is associated with an increase in the state’s incarceration rate if the state has an elected attorney general. Conversely, for states with an appointed attorney general, we find that an increase in public liberalism corresponds with an increase in the incarceration rate.
Interacting elected AG with a measure of public mood
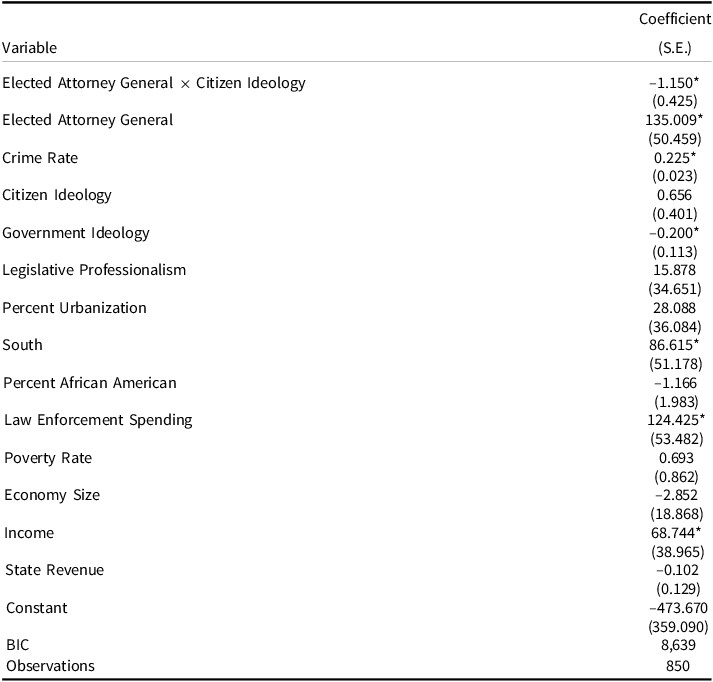
Notes: Unit of analysis is state in a given year. Dependent variable is incarceration rate (per 100,000). Higher values indicate a higher imprisonment rate. Model includes year-fixed effects. The coefficients are estimated from a linear model with a random effect on every state. *p ≤ 0.05 (all one-tailed tests).
Conclusions and implications
One trait of a strong democracy is the presence of elections (Dahl Reference Dahl1989). Scholars have given substantial attention to how the electoral connection can influence policymaking for lawmakers (Barrilleaux et al. Reference Barrilleaux, Holbrook and Langer2002), president (Aldrich et al. Reference Aldrich, Gelpi, Feaver, Reifler and Thompson Sharp2006), and even the judicial system (Gordon and Huber Reference Gordon and Huber2007). Given that most public managers lack a direct electoral connection with the voters, these governmental actors have received little scholarly attention. However, some executive branch administrative officials are elected, and it is vital to understand how electoral considerations that some public mangers face can influence policy outcomes. In this article, we build off Miller’s (Reference Miller2013) theoretical framework and explore the relationship between the selection method utilized for the state’s attorney general office and the state’s incarceration outcomes. When analyzing seventeen years of panel data on state incarceration rates, we find that an increase in the crime rate corresponds to an increase in the incarceration rate for states with elected attorneys general. We find that states with an appointed attorney general are less responsive to the crime rate in a state.
Before concluding, it is important to highlight two important shortcomings of our research. Our findings do not show which specific criminal justice policies most directly impacted the state’s incarceration rate. For instance, it is possible that states with an elected attorney general are more likely to adopt a “three strikes” law, and this policy is driving a state’s incarceration rate. We encourage future scholars to analyze this issue in greater detail. In particular, scholars should analyze whether elected attorneys general influence specific patterns of policy adoption. Second, it is crucial to recognize that our substantive effects are modest. We find that the selection method of the state’s attorney general only matter when the crime rate is high. When crime is low, there is little difference between appointed and elected attorneys general.
Our results contribute to both the public policy and governance literature in four ways. First, scholars have thoroughly analyzed and found that the governor can impact policy outcomes in a state. However, less research has focused on whether other state executive branch officials, such as the attorney general, labor secretary, labor commissioner, etc., can also impact policy outcomes. We find that the state attorney general can be a pivotal player in criminal justice policy outcomes. Future scholars who are conducting a policy analysis in the realm of USA state politics should take this finding into consideration. Specifically, political considerations surrounding executive branch officials, like the attorney general, should be incorporated into the analysis in order to have a more accurate assessment.
Second, executive branch administrative officials, like the attorney general, tend to not capture the public’s attention at least relative to other elected officials like the governor. In fact, a large share of the public tends to skip participating in these races (Darcy and Schneider Reference Darcy and Schneider1989). While the electorate may not be highly focus on this office, our findings demonstrate this administrative official can have a profound impact on the public via public policy. On a similar note, these findings suggest when an individual cast their ballot for a state attorney general candidate the consequences may not be minor. Voters should take this into consideration when selecting a candidate.
Third, the findings of this article speak to the implications that executive branch design has on political representation. For individuals who hold the view that punitive policies and mass incarceration is the best solution to address public safety and crime, at the ballot box they can help translate their preferences into policy outcomes. Conversely, for advocates of a “tough on crime” policy agenda who live in a state in which the attorney general is appointed, they have fewer mechanisms to influence policy outputs in this political context.
Finally, analyzing state incarceration rates is a critical policy matter given the ongoing robust debate surrounding mass incarceration (Parti Reference Parti2020). For individuals wishing to reform the USA criminal justice system, it is important to understand which policymakers can shape incarceration outcomes. For proponents of reducing mass incarceration, our findings suggest that they may struggle to achieve their policy goals in states with elected attorneys general when the crime rate is high. Conversely, for supporters of the “tough-on-crime” approach, our analysis implies that they would have an uphill battle in a state with appointed attorneys general. Taken together, these findings deepen our insights into public policy and public management.
Supplementary material
The supplementary material for this article can be found at https://doi.org/10.1017/S0143814X25100706
Data availability statement
Replication materials are available in the Journal of Public Policy Dataverse at https://doi.org/10.7910/DVN/KW6XGL
Acknowledgements
We thank Eric Hansen, Michael S. Lynch, Eric Moore, and the faculty at the University of Wyoming’s Department of Political Science for their helpful comments and suggestions on earlier drafts of this paper. We also thank the three anonymous reviewers and the editors of the Journal of Public Policy. A version of this manuscript was presented at the 2023 Annual Midwest Political Science Association Conference. The authors are listed in alphabetical order and share first authorship.
Funding statement
The authors did not receive support from any organization for the submitted work.
Competing interests
The authors declare none.


 Open access

