


1. Introduction
The purpose of plant breeding is to improve the productivity of agricultural crops per unit of farmland by manipulating the genetic compositions of the target populations. Since the origin of life, natural selection has been constantly acting to produce the current diversity of living organisms on earth. Due to natural selection, all species have more or less adapted to their own local conditions. Agricultural crops have also adapted to their own niches, but in this case the adaptation has been directed by artificial selection imposed by humans. The key difference between natural and artificial selection is that natural selection acts on phenotypes of traits related to organismal fitness, while artificial selection is based on specific phenotypes of agronomic importance. More recently, the efficiency of artificial selection can be increased by incorporating genotypic information. This review will focus on methods incorporating genotypic information for plant breeding. Unlike phenotypic data, genotypic data are not subject to changes due to environmental errors and more directly related to the target genes for the traits of interest. With high-density marker information, the genotypes of all quantitative trait loci (QTLs) are partially or fully observed. Selection of plants using genome-wide QTLs can be more efficient than most other methods of selection. Such a genome selection (GS) approach is the state-of-art breeding technology in all plant species. The following few sections will briefly review the history of selection procedures and the application of marker information for facilitating plant breeding.
(i) Phenotypic selection
Phenotypic selection is the simplest way to improve the productivity of crops. By definition, the criterion of phenotypic selection is the phenotypic value of a desired trait. The selection response is proportional to the heritability of the target trait and the selection intensity, as indicated by the breeders' equation (Falconer & Mackay, Reference Falconer and Mackay1996; Lynch & Walsh, Reference Lynch and Walsh1998)

where h 2, i and σP are the heritability, the selection intensity and the phenotypic standard deviation of the trait, respectively. With the advent of modern technologies, other information has also been used to select superior plants for breeding. However, phenotypic selection remains an important criterion in plant breeding. Experienced breeders always choose plants with desired morphological characters to breed, provided the plants have passed all other criteria of selection.
(ii) Best linear unbiased prediction (BLUP)
Any information related to the genetic constitution of the candidate plants may be used to predict the breeding values of candidates. The heritability of the trait is an indication of the extent to which the individual's own phenotypic value predicts its breeding value, the prediction being more accurate for traits with higher heritability than traits with lower heritability. Therefore, heritability of a trait is the accuracy of breeding value prediction using phenotypic information as the selection criterion. Phenotypic values of other plants who are genetically related to the candidates (e.g. parents, progeny and siblings), can also be used to predict the breeding values of the candidate plants because relatives and the candidate plant share common genetic material (Fisher, Reference Fisher1918). This method of selection is called pedigree selection (Chahal & Gosal, Reference Chahal and Gosal2002). Prior to the genome era, the combination of pedigree analysis with phenotypic selection was the most widely utilized plant breeding method (Moose & Mumm, Reference Moose and Mumm2008).
Sib analysis and progeny testing are special forms of pedigree analysis because both take advantage of information from relatives. Plants are related in many different ways and the above two types of pedigree analyses only count for a subset of these relatives. The optimal way of pedigree analysis is to include all relatives. This requires a way to handle heterogeneous genetic relationship among plants in the breeding population. Data collected from experiments are subject to unexpected environmental and human errors, leading to missing values for some plots. Therefore, even a well-balanced experimental design may produce unbalanced data. The ordinary least squares method is incapable of dealing with the heterogeneous genetic relationship and the unbalanced data. The BLUP (Henderson, Reference Henderson1950) emerged as the ideal tool for plant and animal breeders to solve both problems.
Let y be a vector of phenotypic values for n individuals in a population. The linear mixed model for y can be described as

where β and X are the fixed effects and the design matrix of the fixed effects, γ and Z are the random effects and the corresponding design matrix for the random effects and ∊ is the residual error vector with an assumed N(0,R) distribution, where R is an n×n covariance matrix for the residual errors. The fixed effects represent systematic effects that should be controlled to reduce the residual errors. The random effects are defined as the genetic effects for plants included in the data and/or plants not included in the data but which contribute to the population as ancestors. Let us assume γ~N(0,AσA2), where σA2 is the additive genetic variance and A is the additive relationship matrix for all the plants contributing to the random effect γ. The predicted breeding value for a candidate plant is defined as a linear combination of  , say
, say  , where
  is the BLUP of γ estimated from the mixed model equation (Henderson, Reference Henderson1975)
![\eqalign{\left[ {\matrix{ {X^{\rm T} R^{ \minus \setnum{1}} X} \tab {X^{\rm T} R^{ \minus \setnum{1}} Z} \cr {Z^{\rm T} R^{ \minus \setnum{1}} X} \tab {Z^{\rm T} R^{ \minus \setnum{1}} Z \plus A^{ \minus \setnum{1}} \sol \sigma _{A}^{\setnum{2}} } \cr} } \right] \left[ {\matrix{ {\hat{\hskip-2\beta }} \cr {\hat{\gamma }} \cr} } \right] \equals \left[ {\matrix{ {X^{\rm T} R^{ \minus \setnum{1}} y} \cr {Z^{\rm T} R^{ \minus \setnum{1}} y} \cr} } \right].\cr](https://static.cambridge.org/binary/version/id/urn:cambridge.org:id:binary:20160405030954718-0926:S0016672310000583_eqn3.gif?pub-status=live)
This mixed model equation explains why BLUP can handle unbalanced data and deal with heterogeneous relationships. The mixed model uses the general linear model (dummy variable) notation to represent the analysis of variance (ANOVA) model and connects the model effects with the data through the design matrices, X and Z. These design matrices represent the characteristics of the experimental design and apply to all experiments, regardless of whether or not the data are balanced. The additive relationship matrix (A) is twice the kinship matrix (Θ), A=2Θ, and it represents any arbitrary kinships among the plants contributing γ. Note that the kinship matrix contains all pair-wise co-ancestry coefficients among the plants (see next section for the definition of co-ancestry coefficient). If the plants are classified into full-sib or half-sib families, the A matrix has a clear pattern that allows simplified algorithms to be used to handle calculations involving it. If all plants are independent, A=I, and the mixed model remains valid. Efficient algorithms are available to estimate the variance components and predict γ (Calvin, Reference Calvin1993). Note that the information required to perform BLUP includes the phenotypic values (y) and the kinships of the plants (Θ).
(iii) Selection using realized kinship
What does the kinship matrix Θ mean? How useful is it in predicting the breeding values of plants? For any two individuals, i and j, the kinship (also called co-ancestry coefficient) is denoted by Θij and thus Aij=2Θij. Technically, there are two explanations for Θij: (1) At any given locus, Θij represents the probability that a randomly sampled allele from i is identical-by-descent (IBD) to a randomly sampled allele from j. Therefore, it is the ‘average’ IBD value at this locus for all pairs of individuals with the same relationship. (2) Considering the same pair of individuals, Θij also represents the ‘average’ IBD values for individual i and j across all loci in the genome. The second explanation is more useful in the mixed model equation because it complies with the infinitesimal model of quantitative traits (Fisher, Reference Fisher1918). In the genome era, genome-wide markers can be used to estimate Θ. The estimated Θ using molecular markers is called the realized kinship, denoted by  . When the marker density is infinitely high and the genome size is infinitely large, the realized kinship is identical to the theoretical kinship
  . Therefore, if Θ is known for all individuals (pedigree information is available), the realized kinship does not help at all in plant breeding.
Three special situations make the realized kinship useful. (1) If pedigree information is unavailable, then we can use genome-wide markers to infer the realized kinship and use in the mixed model equation to perform BLUP (Queller & Goodnight, Reference Queller and Goodnight1989; Lynch & Ritland, Reference Lynch and Ritland1999). (2) If a quantitative trait is controlled by loci with heterogeneous effects (violating the infinitesimal model), the realized kinship estimated only from these loci with large effects can improve the accuracy of the BLUP prediction. This condition is rarely, if ever met because it depends on knowledge of the genetic architecture of the trait. (3) For plants with small genomes, the realized kinship should be different from the expected kinship. Sib analysis using the realized kinship may allow the separation of the genetic variance from the common environmental variance because the realized kinship varies across sibling pairs whereas the expected kinship is a constant for all sibling pairs (Visscher et al., Reference Visscher, Medland, Ferreira, Morley, Zhu, Cornes, Montgomery and Martin2006). Common environmental effects in plants are not as common as in animals and humans, but they may exist to some extent.
(iv) Marker-assisted selection (MAS)
MAS emerged as an efficient method to improve the accuracy of selection in plant breeding programs (Dudley, Reference Dudley1993). Contrary to BLUP, the success of MAS relies on monogenic or oligogenic models (Lamkeya & Lee, Reference Lamkeya and Lee1993). The monogenic model means that the variance of a trait is controlled by the segregation of a single major gene. If the trait is controlled by a few major genes, the model is said to be oligogenic. MAS depends heavily on the result of QTL mapping, especially interval mapping or single marker analysis. The genetic model for interval mapping is

where αk is the effect of QTL k and Wk is a genotype indicator variable. The subscript k means that all markers have been evaluated and the kth marker happens to have the largest effect. The molecular breeding value for individual j is

where  is the estimated QTL effect. Selection can be performed using this molecular breeding value. The MAS scheme is effective under the monogenic model. Lande & Thompson (Reference Lande and Thompson1990) realized that if the trait is controlled by one major gene plus numerous genes with small effects, the observed phenotype for individual j should also be used to predict the breeding value for the candidate. Therefore, they proposed a new MAS scheme through an index that combines the molecular breeding value with the observed phenotype. The index is

where weights, b 1 and b 2, are obtained using the standard procedure of index selection (Smith, Reference Smith1936; Hazel, Reference Hazel1943). The polygenic information is contained in y, although not explicitly expressed. The molecular breeding value under the oligogenic model is

where p is the number of major genes detected via QTL mapping and is usually a small number, typically less than five. Again, the Lande & Thompson (Reference Lande and Thompson1990) index is a better choice due to its ability to capture the polygenic effect through yj.
(v) Genome prediction under the Q+K model
Association mapping deals with randomly sampled individuals from a target population. Such a population usually has a heterogeneous background, e.g. a population with explicit or hidden structures. Pritchard et al. (Reference Pritchard, Stephens and Donnelly2000a, Reference Pritchard, Stephens, Rosenberg and Donnellyb) used the following model to describe the phenotype:

The additional term δ represents the structural effects and Q is determined by the population structure. Such a model is called the Q model (Thornsberry et al., Reference Thornsberry, Goodman, Doebley, Kresovich, Nielsen and Buckler2001; Camus-Kulandaivelu et al., Reference Camus-Kulandaivelu, Veyrieras, Madur, Combes, Fourmann, Barraud, Dubrevil, Gouesnand, Manicacci and Charcosset2006). Yu et al. (Reference Yu, Pressoir, Briggs, Vroh Bi, Yamasaki, Doebley, McMullen, Gaut, Nielsen, Holland, Kresovich and Buckler2006) extended the Q model by adding a polygenic component using the realized kinship . The modified model is

where γ is the polygenic effect with an assumed  distribution and
  is estimated from genome-wide marker information. This model is called the Q+K model, where Q stands for the population structure and K stands for the kinship (Yu et al., Reference Yu, Pressoir, Briggs, Vroh Bi, Yamasaki, Doebley, McMullen, Gaut, Nielsen, Holland, Kresovich and Buckler2006). Since A is not available in wild populations and populations without recorded history,
  is always needed. In the case where pedigree information is known, the true A should be used. Using
  while A is already available will do more harm than good to the association study.
Whole GS
Whole GS is a method using genome-wide high-density markers in a different way from the marker-based analyses described above (Meuwissen et al., Reference Meuwissen, Hayes and Goddard2001; Xu, Reference Xu2003). Different markers are treated separately rather than pooled together as a polygene. The GS model is

where the number of markers p can be extremely large to cover the entire genome rather than a few detected from interval mapping. Each marker effect is assumed to be N(0,σk 2) distributed with a marker-specific variance. Putting all marker effects in a single vector γ={γk}k =1p and letting Z={Zk}k =1p be the genotype indicator variable array for all markers, the above model can be rewritten as

where γ~N(0,G) and G=diag{σk 2}. The corresponding mixed model equation is
![\fleqalign{\left[ {\matrix{ {X^{\rm T} R^{ \minus \setnum{1}} X} \tab {X^{\rm T} R^{ \minus \setnum{1}} Z} \cr {Z^{\rm T} R^{ \minus \setnum{1}} X} \tab {Z^{\rm T} R^{ \minus \setnum{1}} Z \plus G^{ \minus \setnum{1}} } \cr} } \right]\left[ {\matrix{ {\hat{\hskip-2pt\beta }} \cr {\hat{\gamma }} \cr} } \right] \equals \left[ {\matrix{ {X^{\rm T} R^{ \minus \setnum{1}} y} \cr {Z^{\rm T} R^{ \minus \setnum{1}} y} \cr} } \right].}](https://static.cambridge.org/binary/version/id/urn:cambridge.org:id:binary:20160405030954718-0926:S0016672310000583_eqn12.gif?pub-status=live)
The estimated breeding value for individual j is

The difference between this model and the models described previously is that no polygenic effects are included because they have been absorbed by the genome-wide markers. As a result, pedigree information is no longer relevant.
2. Methods of genome selection
(i) LS method
Let us reintroduce the model here for the LS method:

where p is the number of markers included in the model. This time p<n, where n is the sample size. This constraint is needed because LS solution of the parameters requires the existence of (Z TR− 1Z)− 1. When p⩾n, the Z TR− 1Z matrix is uninvertable. The LS solution for the parameters is through solving the following normal equation:
![\left[ {\matrix{ {X^{\rm T} R^{ \minus \setnum{1}} X} \tab {X^{\rm T} R^{ \minus \setnum{1}} Z} \cr {Z^{\rm T} R^{ \minus \setnum{1}} X} \tab {Z^{\rm T} R^{ \minus \setnum{1}} Z} \cr} } \right]\left[ {\matrix{ {\hat{\beta }} \cr {\hat{\gamma }} \cr} } \right] \equals \left[ {\matrix{ {X^{\rm T} R^{ \minus \setnum{1}} y} \cr {Z^{\rm T} R^{ \minus \setnum{1}} y} \cr} } \right].](https://static.cambridge.org/binary/version/id/urn:cambridge.org:id:binary:20160405030954718-0926:S0016672310000583_eqn15.gif?pub-status=live)
Note that γk is treated as a fixed effect and no distribution is assigned to it. The question is how to deal with the high-density markers of the whole genome. The answer is to adopt a variable selection scheme to eliminate markers with small effects, so that p is small enough to be manageable. Forward selection is a reasonable approach for selecting the markers. The criterion for marker inclusion is quite arbitrary but should not be too stringent. Professional computer software is available to perform forward selection, such as the REG and GLMSELECT procedures in SAS. The latter is a more efficient version of model selection and can deal with classification variables. The program also provides an option to evaluate the model through cross-validation (described later).
The LS method alone (without variable selection) is not a choice for genome prediction because the constraint of p<n is rarely met for a population with a high-density marker map. It can be useful to re-evaluate the effects of markers that are selected using other variable selection procedures, e.g. Lasso. In fact, if p (the number of selected markers) is much smaller than n, the LS method is preferred due to the best linear unbiased property of the method.
(ii) Ridge regression
Ridge regression (Hoerl & Kennard, Reference Hoerl and Kennard1970) can relax the restriction of p<n to a certain degree. It uses the same linear model given in eqn (14), but adds a small positive number λ to the corresponding diagonal elements of the normal equation:
![\left[ {\matrix{ {X^{\rm T} R^{ \minus \setnum{1}} X} \tab {X^{\rm T} R^{ \minus \setnum{1}} Z} \cr {Z^{\rm T} R^{ \minus \setnum{1}} X} \tab {Z^{\rm T} R^{ \minus \setnum{1}} Z \plus I\lambda } \cr} } \right]\left[ {\matrix{ {\hat{\hskip-2pt\beta }} \cr {\hat{\gamma }} \cr} } \right] \equals \left[ {\matrix{ {X^{\rm T} R^{ \minus \setnum{1}} y} \cr {Z^{\rm T} R^{ \minus \setnum{1}} y} \cr} } \right]\comma](https://static.cambridge.org/binary/version/id/urn:cambridge.org:id:binary:20160405030954718-0926:S0016672310000583_eqn16.gif?pub-status=live)
where I is an identity matrix with the same dimension as ZTR− 1Z. Ridge regression is also called shrinkage analysis with a common shrinkage factor λ for all regression coefficients. This shrinkage factor will cause biased estimation of the regression coefficients, but the small bias is paid off with reduced estimation errors for the parameters. The shrinkage factor must be provided by the investigators a priori or inferred empirically from the data (Draper & Smith, Reference Draper and Smith1998). The REG procedure in SAS has a Ridge option to perform ridge regression analysis.
A more rigorous way to determine λ is through Bayesian analysis because ridge regression has a Bayesian analogy. If we assign each regression coefficient to a normal prior, γk~N(0,ϕ2),∀k=1, …, p, where ϕ2 is a common prior variance, we obtain λ=1/ϕ2. Since ϕ2 can be estimated from the data under the mixed model framework, we have  , provided that
  is the estimated variance component. The MIXED procedure in SAS is perhaps the most efficient program to perform variance component analysis.
The common shrinkage prior can increase p indefinitely by increasing λ. However, as λ grows, the degree of shrinkage becomes stronger and eventually all regression coefficients are shrunk to zero. Although the model can handle an arbitrarily large p by further shrinking the regression coefficients, a model with all regression coefficients infinitely small is not desirable, as such a model will not have any ability to predict the phenotype. An optimal shrinkage scheme is one that can selectively shrink the regression coefficients. Markers with small or no effects should be severely penalized whereas those with large effects should not be shrunk at all. The following sections provide a few common procedures with the selective characteristics. Any one of them is acceptable as a tool for GS.
(iii) Bayesian shrinkage
The Bayesian shrinkage analysis uses prior γ~N(0,G), where G=diag{σk 2} are marker-specific prior variances. The mixed model equation (Henderson, Reference Henderson1975),
![\hskip-1pt\left[ {\matrix{ {X^{\rm T} R^{ \minus \setnum{1}} X} \tab {X^{\rm T} R^{ \minus \setnum{1}} Z} \cr {Z^{\rm T} R^{ \minus \setnum{1}} X} \tab {Z^{\rm T} R^{ \minus \setnum{1}} Z \plus G^{ \minus \setnum{1}} } \cr} } \right]\left[ {\matrix{ \beta \cr \gamma \cr} } \right] \equals \left[ {\matrix{ {X^{\rm T} R^{ \minus \setnum{1}} y} \cr {Z^{\rm T} R^{ \minus \setnum{1}} y} \cr} } \right]](https://static.cambridge.org/binary/version/id/urn:cambridge.org:id:binary:20160405030954718-0926:S0016672310000583_eqn17.gif?pub-status=live)
is used to derive the posterior distribution for β and γ. Robinson (Reference Robinson1991) showed that the posterior distribution for β is

where

and

Conditional on β, the posterior distribution for γ is

where

and

Therefore, both β and γ are sampled from their perspective normal posterior distributions in the Markov chain Monte Carlo (MCMC)-implemented Bayesian shrinkage analysis.
Let us assume that the covariance matrix of the residual errors takes the simplified form R=Iσ2, where σ2 is the error variance. Assigning a scaled inverse chi-square distribution to σ2, i.e. σ2~Inv−χ2(τ,ω), the posterior distribution for σ2 remains scaled inverse chi-square,

where

The error variance σ2 can be sampled from p(σ2|…) in the MCMC sampling process.
The Bayesian shrinkage analysis differs from the mixed model variance component analysis in that σk2 is further assigned by a scaled inverse chi-square distribution σk2~Inv−χ2(τ,ω), where τ and ω are hyper parameters provided by the investigators. Conditional on γk, the posterior distribution for σk2 is

When (τ,ω)=(0,0), the prior for σk2 becomes 1/σk2, an improper prior. Theoretically, this prior may cause poor mixing of the Markov chain (ter Braak et al., Reference ter Braak, Boer and Bink2005), but in reality, it usually produces satisfactory results. The uniform prior of σk2 corresponds to (τ,ω)=(−2,0), which generates results similar to the maximum-likelihood analysis.
The Bayesian shrinkage method has been incorporated into the QTL procedure in SAS (Hu & Xu, Reference Hu and Xu2009). PROC QTL is a user-defined SAS procedure. Users need a regular SAS license and the PROC QTL software (separate from the Base SAS) to run the QTL procedure. Once the QTL software is installed, users can call the QTL procedure the same way as calling other built-in SAS procedures.
(iv) Lasso and related methods
(a) Lasso
The least absolute shrinkage and selection operator (Lasso) was proposed by Tibshirani (Reference Tibshirani1996) to handle oversaturated regression models. It is a penalized regression analysis with solution of the parameters obtained via
![\eqalign{\gamma ^{{\rm Lasso}} \equals \tab \arg \mathop {\min }\limits_{\gamma } \left[ {\left( {y \minus \sum\limits_{k \equals \setnum{1}}^{p} {Z_{k} \gamma _{k} } } \right)^{\rm T} }\right. \cr\tab \times \left.{\left( {y \minus \sum\limits_{k \equals \setnum{1}}^{p} {Z_{k} \gamma _{k} } } \right) \plus \lambda \sum\limits_{k \equals \setnum{1}}^{p} {\vert \gamma _{k} \vert } } \right]\comma}](https://static.cambridge.org/binary/version/id/urn:cambridge.org:id:binary:20160405030954718-0926:S0016672310000583_eqn27.gif?pub-status=live)
where λ>0 is the shrinkage or penalization factor. Note that β disappeared from the model, which is accomplished via centralization and rescaling of y and Z. If there is only one intercept in the model (β is a scalar), the standardization is obtained by  and
and  , where the variables with a superscript * are the original variables before the standardization. Such a simple standardization scheme is not available in general. A special treatment is required for a general Xβ. One can adopt the procedure for removal of Xβ in the restricted maximum likelihood REML method (Patterson & Thompson, Reference Patterson and Thompson1971). In this procedure, we find a matrix T=subset[I−X(X TX)− 1X T] so that

We define the model with the original data (before standardization) by

and multiply both sides of the equation by matrix T to obtain

Let y=Ty*, Zk=TZk* and ∊=T∊*. We now have

a model with β completely removed. The subset can be chosen as any n−q independent rows of matrix I−X(XTX)− 1XT (Harville, Reference Harville1977). The current Lasso method does not have such a general treatment. The optimal way to handle the general situation is to modify the Lasso equation using
![\eqalign{\gamma ^{{\rm Lasso}} \equals \tab\arg \mathop {\min }\limits_{\gamma } \left[ {\left( {y \minus \sum\limits_{k \equals \setnum{1}}^{p} {Z_{k} \gamma _{k} } } \right)^{\rm T} \rmSigma ^{ \minus \setnum{1}}}\right. \cr\tab \times \left.{ \left( {y \minus \sum\limits_{k \equals \setnum{1}}^{p} {Z_{k} \gamma _{k} } } \right) \plus \lambda \sum\limits_{k \equals \setnum{1}}^{p} {\vert \gamma _{k} \vert } } \right]\comma }](https://static.cambridge.org/binary/version/id/urn:cambridge.org:id:binary:20160405030954718-0926:S0016672310000583_eqn32.gif?pub-status=live)
where  .
.
Fast algorithms are available and have been implemented in various software packages. The least-angle regression (LARS) program can perform the Lasso analysis (Efron et al., Reference Efron, Hastie, Johnstone and Tibshirani2004). The GLMSELECT procedure in SAS also has an option to provide Lasso variable selection. The Lasso algorithm estimates all regression coefficients, but at least n−p coefficients will have estimated values of exactly zero. Therefore, Lasso is also a variable selection procedure.
(b) EM Lasso
Let us reintroduce the linear model here,

where ∊~N(0,Iσ2) and thus  . Let β be assigned a uniform prior and the prior for each γk is

The joint log likelihood function of θ={β,γ} is

where

Multiplying both sides of the equation by 2σ2, we have

Redefining the shrinkage factor as λ*=2σ2λ, we now have the following function to maximize:
![\eqalign{ \theta ^{{\rm Lasso}} \equals \tab \arg \mathop {\max }\limits_{\theta } \left[ { \minus \left( {X\beta \plus \sum\limits_{k \equals \setnum{1}}^{p} {Z_{k} \gamma _{k} } } \right)^{\rm T} }\right. \cr \tab \times \left. {\left( {X\beta \plus \sum\limits_{k \equals \setnum{1}}^{p} {Z_{k} \gamma _{k} } } \right)} \right. \left. { \minus \lambda \ast \sum\limits_{k \equals \setnum{1}}^{p} {\vert \gamma _{k} \vert } } \right]\comma \cr}](https://static.cambridge.org/binary/version/id/urn:cambridge.org:id:binary:20160405030954718-0926:S0016672310000583_eqn38.gif?pub-status=live)
where θLasso={βLasso,γLasso} and γLasso is the Lasso estimate of the QTL effects. Since

we have an alternative way to achieve the Lasso estimates of the parameters through the hierarchical model, γk~N(0,σk2) and σk2~Expon(λ). Details of the hierarchical model can be found in Park & Casella (Reference Park and Casella2008). Therefore, given G=diag{σk2}, the mixed model equation applies,
![\hskip-1pt\left[ {\matrix{ {X^{\rm T} R^{ \minus \setnum{1}} X} \tab {X^{\rm T} R^{ \minus \setnum{1}} Z} \cr {Z^{\rm T} R^{ \minus \setnum{1}} X} \tab {Z^{\rm T} R^{ \minus \setnum{1}} Z \plus G^{ \minus \setnum{1}} } \cr} } \right]\left[ {\matrix{ \beta \cr \gamma \cr} } \right] \equals \left[ {\matrix{ {X^{\rm T} R^{ \minus \setnum{1}} y} \cr {Z^{\rm T} R^{ \minus \setnum{1}} y} \cr} } \right]](https://static.cambridge.org/binary/version/id/urn:cambridge.org:id:binary:20160405030954718-0926:S0016672310000583_eqn40.gif?pub-status=live)
from which the posterior mean and posterior variance for each component of θ can be found. Let E(γk|…) and var(γk|…) be the posterior mean and posterior variance for γk and E(γk2|…)=E(γk|…)+var(γk2|…), the M-step of the EM estimate for γk is

The E-step is represented by calculating E(γk 2|…). The residual error variance is obtained by

The EM Lasso algorithm has been coded in a SAS/IML program (Xu, Reference Xu2010) and can be downloaded from our personal website (http://www.statgen.ucr.edu).
(c) Bayesian Lasso
Bayesian Lasso (Park & Casella, Reference Park and Casella2008) is an MCMC-implemented Bayesian version of the Lasso procedure. It has been applied to QTL mapping by Yi & Xu (Reference Yi and Xu2008). The same hierarchical prior in the EM Lasso is used for the MCMC-implemented Lasso algorithm. In addition, the square of λ is further assigned a Gamma prior, λ2~Gamma(a,b). The sampling process is the same as that described in the Bayesian shrinkage section for β, γ and σ2. The conditional posterior distribution for νk=1/σk 2 is the inverse Gaussian, i.e.

and the shrinkage factor λ2 has a Gamma posterior distribution,

The main advantage of the Bayesian Lasso over the original Lasso method is that λ does not have to be predetermined; rather it can be treated as a variable subject to Monte Carlo sampling. Bayesian Lasso for QTL mapping has been implemented in the R program (Yandell et al., Reference Yandell, Mehta, Banerjee, Shriner, Venkataraman, Moon, Neely, Wu, von Smith and Yi2007).
(v) Empirical Bayes
Empirical Bayes is a method to incorporate a data-estimated prior distribution (Casella, Reference Casella1985). Xu (Reference Xu2007) first adopted the empirical Bayesian method to map QTL. The linear model is rewritten as

where

The expectation and variance–covariance matrix for the data are E(y)=Xβ and

With the scaled inverse chi-square distribution for each σk2~Inv−χ2(τ,ω), the log likelihood function for β, G and σ2 is

Note that this likelihood function does not involve γ, which is integrated out. An algorithm has been developed to estimate G, denoted by  . With the G matrix in the prior replaced by the data-estimated value,
  , the mixed model equation,
![\hskip-1pt\left[ {\matrix{ {X^{\rm T} R^{ \minus \setnum{1}} X} \tab {X^{\rm T} R^{ \minus \setnum{1}} Z} \cr {Z^{\rm T} R^{ \minus \setnum{1}} X} \tab {Z^{\rm T} R^{ \minus \setnum{1}} Z \plus \tilde{G}^{ \minus \setnum{1}} } \cr} } \right]\left[ {\matrix{ {\hat{\hskip-2pt\beta }} \cr {\hat{\gamma }} \cr} } \right] \equals \left[ {\matrix{ {X^{\rm T} R^{ \minus \setnum{1}} y} \cr {Z^{\rm T} R^{ \minus \setnum{1}} y} \cr} } \right]](https://static.cambridge.org/binary/version/id/urn:cambridge.org:id:binary:20160405030954718-0926:S0016672310000583_eqn49.gif?pub-status=live)
is then used to estimate the QTL effects in a single step without iterations. The empirical Bayesian method for QTL mapping has been incorporated into the QTL procedure in SAS (Hu & Xu, Reference Hu and Xu2009).
(vi) PLS
PLS (Wold, Reference Wold and Krishnaiah1973) is used to find the fundamental relationship between two matrices (Z and Y), and is a latent variable approach for modelling the covariance structures in the two spaces. The Z matrix in QTL analysis is an n×p matrix determined by marker genotypes. The Y matrix is an n×1 vector for the phenotypes of a quantitative trait. In general, PLS can handle multiple traits, i.e., Y can be an n×q matrix for q traits. The PLS method will try to find the multidimensional direction in the Z space that explains the maximum multidimensional variance in the Y space. PLS regression is particularly suited when the matrix of predictors has more variables than the number of observations, p>n, and when there is multicollinearity among the Z values. In contrast, standard regression will fail in these cases. In this section, we review the special case when Y is a vector. Technical details about PLS can be found in numerous articles (Dijkstra, Reference Dijkstra1983; de Jong, Reference de Jong1993; Lindgren et al., Reference Lindgren, Geladi and Wold1993) and books (Abdi, Reference Abdi, Lewis-Beck, Bryman and Liao2003). The method described here closely follows Boulesteix & Strimmer (Reference Boulesteix and Strimmer2007).
Like the original Lasso method, the data need to be standardized prior to the analysis. The model for the standardized data is y=Zγ+∊. PLS constructs an n×c latent components matrix as a linear transformation of Z, i.e. T=ZW, where W is a p×c matrix of weights and c<p is the number of latent variables provided by the investigators. The ith column of matrix T is

The high-dimensional Z matrix is now projected to the low-dimensional T matrix. We need to find the W matrix using a way satisfying the special constraints described below. Let us assume that we have already found matrix W. The next step is to perform linear regression of Y on T, as

where η is a c×1 vector of the regression coefficients of y on T. We now put the two models together,

and conclude that γ=Wη. Therefore, given W and T=ZW, we can perform multiple regression for y=Tη+∊ with the LS solution

The LS solution of η is then converted into the PLS estimate of γ,

This approach is much like principal component analysis (PCA), but the way to derive the W matrix is different. In PCA, the latent matrix T is found only by maximizing the variances in the predictors Z and ignoring the Y matrix. In the PLS method, the latent matrix T is found by taking into account both Z and Y.
Let Wi and Wj be the ith and jth columns of matrix W for i<j. The corresponding latent variables are Ti=ZWi and Tj=ZWj. Three quantities are required to derive the W matrix, which are

The columns of matrix W are defined such that the squared sample covariance between y and Ti is maximal, under the restriction that the latent components are mutually uncorrelated. Moreover, the variance of the latent variance is constrained to have a unity value. Mathematically, the solution for W is obtained as
![\eqalign{ W_{i} \equals \tab \arg \mathop {\max }\limits_{W_{i} } \left[ {{\rm cov} \lpar T_{i} \comma y\rpar \times {\rm cov} \lpar y\comma T_{i} \rpar } \right] \cr \equals \tab \arg \mathop {\max }\limits_{W_{i} } \lpar W_{i}^{\rm T} Z^{\rm T} yy^{\rm T} ZW_{i} \rpar \cr}](https://static.cambridge.org/binary/version/id/urn:cambridge.org:id:binary:20160405030954718-0926:S0016672310000583_eqn56.gif?pub-status=live)
subject to constraints

The maximum number of latent components which have non-zero covariance with Y is c max=min(n,p). The weight vector Wi is computed sequentially with the order of W 1,W 2,…,Wc, where c is provided by the users. Software packages are available for PLS. The most comprehensive one is the PLS procedure in SAS.
PLS has been applied to GS using simulated data (Solberg et al., Reference Solberg, Sonesson, Woolliams and Meuwissen2009) and SNP data in dairy cattle (Moser et al., Reference Moser, Tier, Crump, Khatkar and Raadsma2009). These authors found that the prediction accuracy of PLS is comparable to the Bayesian method. There are fewer reports of PLS application to genomic value prediction than the Bayesian method. More studies on this topic are expected to appear soon in the literature. The earliest report of the application of PLS to quantitative genetics was the updated index selection procedure by Xu & Muir (Reference Xu and Muir1992). The authors did not explicitly state that the method is PLS, but the approach they used to find the weights of the updated selection indices is exactly the same as the PLS. Xie & Xu (Reference Xie and Xu1997) extended the PLS method to restricted multistage index selection. Both studies gave the expressions of the weights along with the detailed description of the mathematical derivation. The constraints given in eqn (57) are adopted from Xu & Muir (Reference Xu and Muir1992) and they are different from the ones used in the SAS/PLS procedure. The PLS in SAS uses Wi TWi=1 as a constraint, instead of Wi TZ TZWi=1. The final W matrices obtained using the two constraint systems are different, but the prediction of the genetic value for any candidate individual remains the same.
3. Cross-validation
The main purpose of GS is to predict the genomic or breeding values of candidate plants. More attention is paid to prediction rather than to hypothesis testing, which, while related, are not necessarily the same. A QTL may pass a threshold for hypothesis testing and be declared as significant, but may have little predictive value. Increasing the sample size can increase the number of detected QTLs (Beavis, Reference Beavis1994), but it does not necessarily increase the predictability of the model. Therefore, model validation is fundamentally important in GS. It is highly recommended that any practical study in GS be accompanied by the result of validation before consideration of publication. Breeding companies will not adopt any new procedures without some forms of validation.
(i) Prediction error
Let yj be the observed phenotypic value of individual j in the population and

be its predicted value. If individual j has contributed to the estimation of β and γ, the error defined by  is a residual error, not a prediction error. The residual error can be arbitrarily small by increasing the number of markers in the model. A prediction error is defined by the difference between the observed phenotypic value and the predicted value for a new individual who has not contributed to the estimation of the parameters that are used to make the prediction. If individual j is a new candidate plant and the phenotypic value has not been observed yet, we can predict the phenotype using the parameters estimated from the current sample. The predicted value is

Later on the phenotype of this plant is measured with a value yj New. The error defined by  is called the prediction error. The prediction error can be reduced to some degree but cannot be eliminated. The variance of the prediction errors is defined by

All m individuals are new and none of their phenotypes has contributed to the parameter estimation. Assuming that m→∞, we can write the prediction error variance as

where var(yj New)=σ2 and

Let  and Wj New={Xj New,Zj New}. In ordinary LS analysis,

Therefore, the variance of the predicted value is

This leads to
![\phi _{j}^{\setnum{2}} \equals \sigma ^{\setnum{2}} \left[ {1 \plus W_{j}^{{\rm New}} \lpar W_{}^{\rm T} W\rpar ^{ \minus \setnum{1}} W_{j}^{\lpar {\rm New}\rpar {\rm T}} } \right].](https://static.cambridge.org/binary/version/id/urn:cambridge.org:id:binary:20160405030954718-0926:S0016672310000583_eqn65.gif?pub-status=live)
Therefore,
![\eqalign{ \phi ^{\setnum{2}} \equals \tab {1 \over m}\sum\limits_{j \equals \setnum{1}}^{m} {\phi _{j}^{\setnum{2}} } \equals \sigma ^{\setnum{2}} \cr \tab \times \left[ {1 \plus {1 \over m}\sum\limits_{j \equals \setnum{1}}^{m} {W_{j}^{{\rm New}} \lpar W^{\rm T} W\rpar ^{ \minus \setnum{1}} W_{j}^{{\rm \lpar New\rpar T}} } } \right] \cr}](https://static.cambridge.org/binary/version/id/urn:cambridge.org:id:binary:20160405030954718-0926:S0016672310000583_eqn66.gif?pub-status=live)
Clearly φ2⩾σ2 and the equality holds if and only if n=∞. The prediction error variance is at least as large as the (true, not the estimated) residual error variance.
(ii) Model validation
To validate a model, more resources are required. We can divide the sample into a training (learning) sample and a testing sample with approximately equal size. The training sample is used to estimate the parameters. The estimated parameters are then used to calculate the prediction error variance in the testing sample. The prediction error variance φ2 has a unit depending on the trait (squared unit of the trait). It is usually transformed into a number between 0 and 1 so that different trait analyses can be compared on the same scale. Let us define

where  is the average value of the phenotypes in the testing sample. The R-square value is defined as (Legates & McCabe, Reference Legates and McCabe1999)

which has a domain 0⩽R 2⩽1, with zero indicating no predictability and 1 indicating perfect prediction. If  , the denominator can be rewritten as

In this case, the R-square is interpreted as the proportion of phenotypic variance contributed by the genomic variance.
(iii) K-fold cross-validation
The validation procedure described in the previous section does not optimally use the resources. There are n plants in the sample but only half of the n plants are used to estimate the parameters and half of the n plants used to validate the model. Thus, some resources have been wasted using this true validation procedure. If the training sample and the testing sample are reversed in function, there is another validation scheme and this new scheme will produce a different result. The two results may be combined to calculate a new R-square. Such an R-square should be more precise because it uses the whole sample. This scheme is called cross-validation (Shao, Reference Shao1993). There are many different ways to perform cross-validation. The half-half cross-validation is called twofold cross-validation.
With the twofold cross-validation, we have increased the sample size for the R-square calculation, but have not increased the sample size for parameter estimation. The parameters are estimated twice but the two sets of estimated parameters are not combined. Each is estimated separately, still using half of the sample. There is no reason not to use a threefold cross-validation, in which the sample is divided into three parts: two parts are used to estimate the parameters and the remaining part is used to validate the parameters. Each of the three parts is eventually validated using parameters estimated from the other parts. This time, the parameters are estimated from 2/3 of the sample. Similarly, a fivefold cross-validation uses 4/5 of the sample to estimate the parameters and validates the prediction of the remaining 1/5 of the sample (Moser et al., Reference Moser, Tier, Crump, Khatkar and Raadsma2009). In general, people can choose any K-fold cross-validation, where K is an integer between 2 and n.
(iv) Leave-one-out (n-fold cross-validation)
Leave-one-out cross-validation applies to the case when K=n (Efron, Reference Efron1983). We use n−1 plants to estimate the parameters and predict the value for the remaining plant. The complete cross-validation requires n separate analyses, one for each plant. The computation can be intensive for large samples, but it is the optimal way to utilize the current resources, and thus should be the most reliable cross-validation approach.
Compared to other K-fold cross-validations, the n-fold cross-validation has the smallest prediction error variance. This is because it has the smallest estimate errors for the parameters due to the maximum possible sample size (n−1) used. Theoretically, the R-square value should also be the highest for the n-fold cross-validation. Is the high R-square an over estimate of the predictability? In practice, if we have n plants in the current sample, we will never use a sub-sample to estimate the parameters. Suppose that we now have new plants with available DNA samples but not the phenotypes. We are ready to predict the genetic values of these plants for selection. The optimal approach for predicting the breeding values of the new plants is to use parameters estimated from all n plants. The n-fold cross-validation uses n−1 plants to estimate the parameter and n−1 is the nearest integer to n. Therefore, the leave-one-out cross-validation mimics most closely to the actual prediction in practice.
4. Working example
(i) Barley experiment
The original experiment was conducted by |Hayes et al. (Reference Hayes, Liu, Knapp, Chen, Jones, Blake, Fronckowiak, Rasmusson, Sorrells, Ullrich, Wesenberg and Kleinhofs1993, Reference Hayes and Jyambo1994). The data were retrieved from http://www.genenetwork.org/. The experiment involved 150 double haploids (DH) derived from the cross of two Spring barley varieties, Morex and Steptoe. There were 495 markers distributed along the seven pairs of chromosomes of the barley genome, with an average marker interval of 2·23 cM. The marker map with the seven linkage groups is shown in Fig. 1. Eight quantitative traits were recorded in 16 environments. The eight traits were (1) YIELD (grain yield in MT/ha), (2) LODGING (lodging in %), (3) HEIGHT (plant height in cm), (4) HEAD (heading date after January 1), (5) PROTEIN (grain protein in %), (6) EXTRACT (malt extract in %), (7) AMYLASE (alpha amylase in 20 Deg units) and (8) POWER (diastatic power in Deg). The phenotypic values of the 150 DH lines were the averages of the 16 replications for each trait.
Linkage map of 495 markers covering the seven chromosomes of the barley genome.

(ii) MAS
MAS utilizes results of QTL mapping. Since the marker density in the barley QTL mapping experiment is sufficiently high (2·23 cM per interval), individual marker analysis was performed using the QTL procedure in SAS (Hu & Xu, Reference Hu and Xu2009). We used the permutation test (Churchill & Doerge, Reference Churchill and Doerge1994) with 1000 permuted samples to draw the critical values for the LOD score profile for each trait. The estimated QTL effects are depicted in Fig. 2 for the eight traits. The corresponding LOD scores are given in Fig. 3 along with the permutation-generated critical values at the α=0·01 level. Large numbers of QTLs were detected for each of the eight traits, with an average number of 35 QTLs per trait (see Table 1). When the LOD critical values were lowered down to α=0·05, the average number of markers detected per trait raised to 50.
Estimated QTL effects for eight quantitative traits in the barley experiment using the interval mapping approach. The eight traits correspond to (1) Yield, (2) Lodging, (3) Height, (4) Head, (5) Protein, (6) Extract, (7) Amylase and (8) Power. The seven chromosomes are separated by the vertical reference lines.

LOD scores for eight quantitative traits in the barley experiment using the interval mapping approach. The eight traits correspond to (1) Yield, (2) Lodging, (3) Height, (4) Head, (5) Protein, (6) Extract, (7) Amylase and (8) Power. The horizontal reference lines are the permutation (1000 samples) generated critical values for the LOD score test at α=0·01.

Accuracies (R-squares) of MAS using the least-squares method under two levels of Type I errors (alpha values)
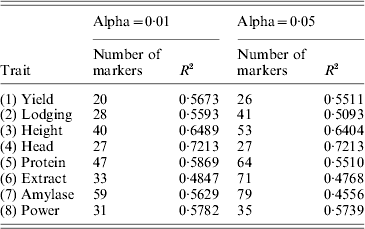
We then used the results of the interval mapping to select these significant QTLs. Using the multiple regression method (ordinary LS), we re-estimated the QTL effects and performed the leave-one-out cross-validation analysis. The R-square values for α=0·01 and α=0·05 are given in Table 1. The average R-square for α=0·01 and α=0·05 were 0·59 and 0·56, respectively. Therefore, lowering the critical values decreased the predictability. The highest R-square occurred for Head with an R-square of 0·72. The trait extract had the lowest R-square of 0·48. The conclusion was that MAS using the detected QTL will be effective.
(iii) GS
We now use the empirical Bayesian method (Xu, Reference Xu2007) to perform GS using all markers. The hyper-parameters for each trait were set at (τ,ω)=(0,0), corresponding to the Jeffreys' prior (Jeffreys, Reference Jeffreys1939). With the empirical Bayesian method, each marker had an estimated effect and an LOD score but all effects were estimated in a single model. The estimated effect profiles are depicted in Fig. 4. The corresponding LOD score profiles are given in Fig. 5. From these two figures, we can see clearly that the eight traits are divided into two different types, polygenic traits (Yield and Protein) and oligogenic traits (the remaining six traits). The partitioning of polygenic traits and oligogenic traits cannot be achieved using the interval mapping approach. The LOD scores of individual markers for the two polygenic traits were all smaller than the individual LOD scores for the six oligogenic traits.
Estimated QTL effects for eight quantitative traits in the barley experiment using the empirical Bayesian method. The eight traits correspond to (1) Yield, (2) Lodging, (3) Height, (4) Head, (5) Protein, (6) Extract, (7) Amylase and (8) Power. The seven chromosomes are separated by the vertical reference lines.

The LOD scores for eight quantitative traits in the barley experiment using the empirical Bayesian method. The eight traits correspond to (1) Yield, (2) Lodging, (3) Height, (4) Head, (5) Protein, (6) Extract, (7) Amylase and (8) Power. The seven chromosomes are separated by the vertical reference lines.

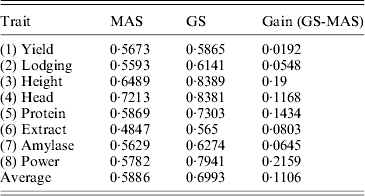
We used the leave-one-out cross-validation to evaluate the accuracy of the empirical Bayesian method. When all 495 markers were included in the model, the R-square values ranged from 0·45 (for Extract) to 0·82 (for Height). Clearly, GS is effective for all eight traits. We also performed a variable selection approach using the full model (including all 495 markers) to rank the markers from the highest LOD score to the lowest LOD score. The number of top markers included in the model ranged from 1 to 495. For example, when the top five markers were used to evaluate the accuracy of GS, we only used these five markers to predict the genomic values. The R-square value for each trait formed an R-square profile for each trait. Different traits have different patterns for the R-square profiles. However, they all show a common feature: each curve starts with a low R-square, quickly increases to a maximum value and then progressively decreases (Fig. 6). The maximum R-square varied across different traits, but it was higher than the one when all markers were used for prediction. Table 2 provides a summary of the R-square profile for each trait. If the top marker was included in the model for prediction, only one trait (Head) had a high prediction value (R 2=0·66), while Extract and Power each had a reasonable predictability (R 2=0·14 and R 2=0·17). The maximum R-square ranged from 0·56 (Extract) to 0·84 (Height). The number of markers that generated the maximum R-square values also varied across different traits. The two polygenic traits, Yield and Protein, required 123 and 165 markers, respectively, to reach the highest accuracies for prediction. Heading date is an oligogenic trait because the top five markers collectively contribute 85% of the phenotypic variance. Table 3 shows a comparison of the GS using the empirical Bayesian method and MAS using the multiple regression method (ordinary LS method). The GS had a higher R-square value than the MAS for every trait. The average R-square values for MAS and GS were 0·59 and 0·70, respectively, with an average gain of 0·11.
The R-square profiles plotted against the top markers included in the model for genome prediction for eight quantitative traits in the barley experiment. The eight traits correspond to (1) Yield, (2) Lodging, (3) Height, (4) Head, (5) Protein, (6) Extract, (7) Amylase and (8) Power. The co-ordinates of three interesting points are marked for each trait. The three co-ordinates correspond to the R-square values for the top one marker, the optimal number of markers and all markers.

Accuracies of genome prediction (R-squares) using the empirical Bayesian method for eight quantitative traits in the barley experiment

R-square (1): The R-square value for model including the top marker.
R-square (495): The R-square value for model including all markers.
R-square (opt.): The R-square value for model including the optimal number of markers.
Optimal number: The number of markers that produces the maximum R-square value.
Comparison of the accuracies of prediction (R-squares) of MAS and GS
By definition, GS uses all markers to predict genomic values of candidate plants. However, some marker selection remains beneficial. Once the optimal number of markers is reached, including more markers appears to be slightly detrimental to GS. This conclusion is consistent with that of the Che & Xu (Reference Che and Xu2010) study of flowering time in Arabidopsis. However, the decline of the accuracy by adding more markers afterwards is not dramatic, provided the marker effects are estimated using the empirical Bayesian method.
5. Discussion
Genome-wide epistasis may play an important role in agronomic traits. The GS tools reviewed above also apply to epistatic models. The epistatic model simply has a higher dimensionality than the additive model, and requires a fast computational algorithm. Whether or not epistatic effects are important depends on the properties of the traits and plant species. The analysis of Xu & Jia (Reference Xu and Jia2007) using data from a different barley crossing experiment showed that epistatic effects are not as important as additive effects. The cross in the Xu & Jia (Reference Xu and Jia2007) study involved two different parental lines and seven traits: (1) Heading date, (2) Height, (3) Yield, (4) Lodging, (5) Kernel weight, (6) Maturity and (7) Test weight. Four of the seven traits in the Xu & Jia (Reference Xu and Jia2007) study were the same as four of the eight traits in the current study. Because of the similarity of the traits and plant species in the two data sets, we do not expect to see more important roles of epistatic effects than additive effects in this data set. Unfortunately, the current version of the empirical Bayes program cannot handle all pair-wise interactions for 495 markers and thus we cannot test this hypothesis. Part of the reasons for the unimportant role of epistasis may be due the difficulty in detecting epistatic effects (Hill et al., Reference Hill, Goddard and Visscher2008); or the importance of epistasis may vary among traits. Dudley & Johnson (Reference Dudley and Johnson2009) used the epistatic model to predict the genomic values for several quantitative traits in corn and showed significant increases in predictability over the additive model. Methods and software packages for epistatic models are available (Yi & Xu, Reference Yi and Xu2002; Yi et al., Reference Yi, Xu and Allison2003; Zhang & Xu, Reference Zhang and Xu2005) and have been reviewed in detail by Yi (Reference Yi2010).
All effective methods for GS are related to mixed model methodology. The QTL effects are always treated as random effects, either explicitly or implicitly. Therefore, understanding the mixed model methodology is fundamentally important in GS. The biggest hurdle in the mixed model approach to GS is computational speed. Efficient algorithms are always required for increased marker density.
The corresponding technology of GS for discrete traits or any traits deviating from normality is the generalized linear mixed model (GLMM; McCulloch & Neuhaus, Reference McCulloch and Neuhaus2005). However, many discrete traits may be analysed as if they were quantitative (Rebai, Reference Rebai1997; Kadarmideen et al., Reference Kadarmideen, Janss and Dekkers2000), and yield similar results from the analyses using the correct GLMM. If investigators decide not to implement GLMM for discrete trait analysis, data transformation is recommended prior to the analysis. For example, the binomial trait defined as a ratio can be transformed using the Box-Cox transformation (Yang et al., Reference Yang, Yi and Xu2006) or other simple transformations (Freeman & Tukey, Reference Freeman and Tukey1950) prior to the analysis. GLMM is more appropriate for binary traits than other discrete traits because there is no appropriate transformation to make binary traits normal.
With the current pace of technology development, DNA sequence data will be available very soon for all agricultural crops. Sequencing the genome for all individuals in a target population is no longer a dream. With complete sequence data, pedigree analysis is no longer necessary. Pedigree analysis is one of the most difficult problems in GS. Once pedigree information becomes irrelevant, a polygenic effect is no longer required in the model for genome prediction, as it will be absorbed by the saturated markers. Therefore, GS will be easier with complete sequence data than the one with partial genomic information due to the irrelevance of pedigree information and the disappearance of the polygenic effect.
This project was supported by the Agriculture and Food Research Initiative (AFRI) of the USDA National Institute of Food and Agriculture under the Plant Genome, Genetics and Breeding Program 2007-35300-18285 to SX.



