


INTRODUCTION
Infectious gastroenteritis is one of the most common diseases worldwide and one of its primary symptoms, diarrhoea, causes about 1 billion disease episodes and 3 million deaths annually in children aged <5 years [Reference Guerrant1–Reference Kosek, Bern and Guerrant3]. In industrialized countries, the associated mortality is low but morbidity remains high. Most episodes of infectious gastroenteritis are brief and do not require medical attention but the social and economic burdens are substantial because of the high incidence. Additionally, in recent years, with growing concerns about global climate change, many studies have focused on associations between weather variability and fluctuations in the incidence of infectious gastroenteritis. Enteric diseases in temperate latitudes have been noted to have a seasonal pattern, with the highest incidence of illness during the summer months [Reference Isaacs, LeBer and Michel4]. The incidence of infectious gastroenteritis also exhibits regular seasonal cycles such as a bimodal annual distribution described in Japan [Reference Ohta5]. The seasonality of the disease suggests that weather factors play an important role in its incidence and indicate the possibility that multiple functional pathways are operating.
Some interesting associations of weather factors and infectious gastroenteritis have been previously reported. In the UK, a study of foodborne illness reported a relationship between the incidence of disease and temperature in the month preceding the disease [Reference Bentham and Langford6]. The enteric pathogens typically exhibit survival and growth characteristics that are correlated with ambient temperatures [Reference Hall, D'Souza and Kirk7]. In the USA, infectious gastroenteritis hospitalizations were more common after cold or dry months than after warm or wet months. In colder months when increased indoor crowding and decreased relative humidity generally occur, these conditions have been suggested to promote the transmission of rotavirus gastroenteritis [Reference Brandt8]. In Japan, rotavirus gastroenteritis infection has been associated with lower temperature but not with relative humidity [Reference Konno9].
The seasonal patterns of infectious gastroenteritis cases may also be a consequence of other factors unrelated to weather such as seasonal variations of human activity [Reference Black, Lanata, Blaster, Smith, Ravdin, Greenberg and Guerrant10], but human behavioural factors alone do not appear to be sufficient to account for all of the seasonal patterns observed for certain cases of infectious gastroenteritis, including those noted above in temperate latitudes. In addition, the potential effects of multiple weather factors on the incidence of infectious gastroenteritis have not been considered, and few quantitative studies have investigated the impact of weather variability on infectious gastroenteritis. Moreover, multiple weather factors in combination may contribute to the increased incidence of infectious gastroenteritis. An understanding of how specific environmental factors influence human disease may improve disease forecasting, enhance the design of integrated warning systems, and advance the development of efficient outbreak detection algorithms.
The objective of this study was to investigate a possible relationship between weather variability and the weekly incidence of infectious gastroenteritis between 1999 and 2007 in Fukuoka, Japan. Clarification of the potential role of weather on the transmission of infectious gastroenteritis could be of interest in its own right as well as suggesting potential pathways from weather variability to seasonal epidemics of the disease. Our results could aid public health officials in the prevention and control of infectious gastroenteritis infections.
METHODS
Data sources
In Japan, the systematic surveillance of infectious gastroenteritis as a notifiable disease began in 1981 under the Infectious Disease Control Law. This system, organized by the Ministry of Health and Welfare, involves about 3000 sentinel medical institutions and accounts for about 8% of the total number of paediatric hospitals and clinics throughout the entire country [Reference Hashimoto11]. The number of sentinels is based on population density so that regions with populations of <30 000, 30 000–75 000, and >75 000 are assigned 1, 2, or ⩾3 sentinels, respectively [Reference Murakami12]. For this study within the Fukuoka Prefecture in southwestern Tokyo, Japan, 120 sentinel medical institutions reported the number of infectious gastroenteritis patients on a weekly basis (Fig. 1). Clinical data were recorded and reported by sentinel volunteers to the Fukuoka Institute of Health and Environmental Sciences, the municipal public health institute of the Fukuoka prefectural government. Data were also reported electronically to the Infectious Disease Surveillance Center at the National Institute of Infectious Diseases in Tokyo, Japan [Reference Hashimoto11].
Location of Fukuoka Prefecture on Kyushu Island, southwest of Tokyo, Japan.

In Japan, a case of infectious gastroenteritis is defined by clinical factors of a sudden stomach ache, vomiting, and diarrhoea. In contrast, it is not necessary for sentinel medical institutions to report serological information. We analysed the data of 422 176 infectious gastroenteritis cases from 1999 to 2007 for Fukuoka Prefecture. These data were obtained from the National Epidemiological Surveillance of Infectious Diseases system, which monitors infectious disease events in the ~5 million residents of Fukuoka Prefecture. We also obtained data on daily average temperature and relative humidity in Fukuoka Prefecture from the Japan Meteorological Agency. The weekly mean for average temperatures and relative humidity were calculated from the daily records. The ethics committee of the Fukuoka Prefecture Environmental Health Research Advancement Committee approved this study on 27 December 2006 (reference no.: 18-3515).
Statistical analysis
We examined the relationship between the number of weekly infectious gastroenteritis cases with temperature and humidity using generalized linear Poisson models allowing for over-dispersion [Reference McCullagh and Nelder13]. To account for the seasonality of infectious gastroenteritis cases that are not directly due to the weather, Fourier terms up to the sixth harmonic were included in the model. Fourier terms can be used to re-create any periodic signal (such as a consistent seasonal pattern) using a linear combination of sine and cosine waves of varying wavelength. Indicator variables for the years of the study were incorporated into the model to allow for long-term trends and inter-annual variations. To allow for autocorrelations, an autoregressive term at order 1 was incorporated into the models [Reference Brumback14]. Plots of model residuals, predicted and observed time-series plots, and partial autocorrelation function of the residuals [see Supplementary Fig. S1(a–c), available online], suggested that this was an adequate amount of adjustment for seasonal trends.
Temperature models
From exploratory analyses, existing literature, and considerations of interpretational difficulty with very long lags, we considered lags (delays in effect) of up to 8 weeks for the influence of temperature on the number of infectious gastroenteritis cases. In the initial analyses designed to identify the broad shape of any association, we fitted a natural cubic spline (3 d.f.) [Reference Durrleman and Simon15] to the average over lags of 0–8 weeks. We also included humidity as a natural cubic spline (3 d.f.) in the model to control confounding, with lag 0–8 weeks.
The choice of model (linear or threshold model) was based on comparing deviance of the models derived from likelihood ratio tests [Reference Daniels16]. The model with the smaller value of deviance is preferred. When the difference in values of deviance between linear and the best-fitted threshold models was <3·84 (χ2 value for 1 d.f. at the P=0·05 level), the linear model was chosen to maintain simplicity. An increase in the number of infectious gastroenteritis cases that were associated with a 1°C increase in temperature was reported as the percent change.
Using the simple linear model, we then examined lag effects in greater detail by fitting linear unconstrained distributed lag models [Reference Hashizume17] comprising temperature terms at each lag period that could be as long as 8 weeks.
Humidity models
We analysed humidity because we hypothesized that along with temperature, humidity is another possible causal factor of a multiple factor pathway for the incidence of infectious gastroenteritis. Specifically, we fit a natural cubic spline (3 d.f.) to the average humidity over lags of 0–8 weeks and incorporated this into a model comprising the same confounders included in the temperature model. The lag period was set at 0–8 weeks as were the temperature models.
Because the plots of the smoothed relationships with humidity suggested a broadly linear negative relationship, we then fitted a linear model to estimate the effect (slope) [Reference Daniels16]. With the simple linear model, we then examined lag effects in more detail by fitting linear unconstrained distributed lag models comprising humidity terms at each lag period that could be as long as 8 weeks.
In order to investigate whether the results were sensitive to the levels of control for seasonal patterns, the analyses were repeated using Fourier terms up to the 3rd and 12th harmonics each year. All statistical analyses were performed using Stata version 10.1 (Stata Corporation, USA).
RESULTS
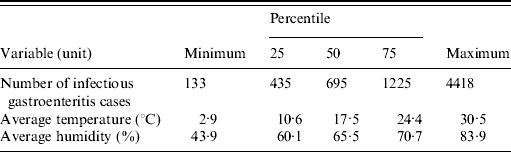
We analysed a total of 422 176 (100%) infectious gastroenteritis cases from 1999 to 2007, of which 9·9% were aged <1 year and 29·4% were aged between 1 and 2 years. Descriptive statistics for the number of patients and weather variables are given in Table 1. A wide variety of aetiological agents were associated with these infectious gastroenteritis cases with norovirus, rotavirus, and Escherichia coli being the most common enteropathogens. The total number of infectious gastroenteritis cases displayed a seasonality that peaked during winter (Fig. 2), but seasonality also varied among the primary pathogens such that norovirus, rotavirus, and E. coli infections peaked in the winter, spring, and summer, respectively.
Seasonal variations in the weekly number of infectious gastroenteritis cases, temperature, and humidity in Fukuoka, Japan, 1999–2007.

Characteristics of the weekly number of infectious gastroenteritis cases and meteorological data in Fukuoka, Japan, 1999–2007
Relationship with temperature
The relationships between the relative risk of infectious gastroenteritis cases and temperature are shown in Figure 3. In the crude relationship, the potential risk of infectious gastroenteritis decreased as temperature increased from the coldest temperatures (Fig. 3a). A significant positive relationship was found between the relative risk of infectious gastroenteritis cases and the presence of higher temperatures during a lag of 0–8 weeks after adjusting for seasonal, between-year, and humidity variations (Fig. 3b). For a 1°C increase, the number of infectious gastroenteritis cases increased by 7·7% [95% confidence interval (CI) 4·6–10·8] and the temperature effect was significant for lags of 3, 5, 6, and 7 weeks using the distributed lag model. Little effect was observed for the other lags (Fig. 4).
Relationship between relative risk of infectious gastroenteritis (scaled to the mean weekly number of infectious gastroenteritis cases) and temperature over lags of 0–8 weeks (shown as a 3 d.f. natural cubic spline). (a) Crude relationship and (b) relationship adjusted for relative humidity, seasonal variations, and between-year variations. The centre line in the graph shows the estimated spline curve, and the upper and lower lines represent the 95% confidence limits.

Percent change (and 95% confidence intervals) in the number of infectious gastroenteritis cases for ‘high’ temperature (each 1°C increase) at each lag (unconstrained distributed lag models).

Relationship with humidity
The relationships between the relative risk of infectious gastroenteritis cases and humidity are shown in Figure 5. In the crude relationship, the potential risk of infectious gastroenteritis increased as relative humidity increased from the lowest relative humidity (Fig. 5a). After adjusting for seasonal, between-year, and temperature variations, we observed a significant increase in the number of cases of infectious gastroenteritis with a 1% decrease in relative humidity for lag periods between 0–8 weeks as indicated by the negative linear slope with high humidity (Fig. 5b). For a 1% decrease, the number of infectious gastroenteritis cases increased by 2·3% (95% CI 1·4–3·1). The effect of humidity was significant at the lag periods of 1, 2, 3, and 4 weeks using the distributed lag model. Little effect was observed for the other lag periods (Fig. 6).
Relationship between relative risk of infectious gastroenteritis (scaled to the mean weekly number of infectious gastroenteritis cases) and relative humidity over lags of 0–8 weeks (shown as a 3 d.f. natural cubic spline). (a) Crude relationship and (b) relationship adjusted for temperature, seasonal variations, and between-year variations. The centre line in the graph shows the estimated spline curve, and the upper and lower lines represent the 95% confidence limits.

Percent change (and 95% confidence intervals) in the number of infectious gastroenteritis cases for humidity (each 1% decrease) at each lag (unconstrained distributed lag models).

In sensitivity analyses the degree of seasonal control was halved (three harmonics) or doubled (12 harmonics), the estimates of the effect of temperature and humidity changed little.
DISCUSSION
Several notable points were concluded from our findings. Most importantly, our results suggest that after adjusting for potential confounding by temperature, humidity, seasonal patterns, and between-year variations, a significant association exists between either a 1°C temperature increase (Figs 3, 4) or a 1% relative humidity decrease (Figs 5, 6) and the number of infectious gastroenteritis cases. A possible relationship between ambient temperature variations and infectious gastroenteritis has only been indirectly inferred from inter-annual observations or seasonal variations [Reference Black18–Reference Guerrant20]. The present findings suggest that two important weather parameters, temperature and humidity, could quantitatively explain short-term associations after controlling for both seasonal and inter-annual patterns. The positive relationship between infectious gastroenteritis cases and increased temperature in our study is broadly consistent with previous studies in Peru, Fiji, and Bangladesh [Reference Checkley21–Reference Hashizume23]. Higher temperatures increase the potential for exposure to bacterial and diarrhoeal parasites and lengthen the survival times of bacteria such as enterotoxigenic E. coli in contaminated food [Reference Black, Lanata, Blaster, Smith, Ravdin, Greenberg and Guerrant10]. Lower temperatures increase the transmission of viral diarrhoea [Reference Black, Lanata, Blaster, Smith, Ravdin, Greenberg and Guerrant10, Reference Konno24]. At intermediate temperatures (18–23°C), children may be exposed to many viral, bacterial, and parasitic pathogens. Thus, our finding is also biologically plausible.
Using the distributed lag model, the temperature effect was significant for lags of 3, 5, 6, and 7 weeks. This is broadly consistent with the findings in a previous study in the UK [Reference Bentham and Langford6], which reported a strong association of foodborne diseases with temperatures 2–5 weeks earlier, suggesting that temperature affects contamination earlier in the food production or distribution system. However, temperature control during food production, processing, transport, preparation or storage may interact with climate change [Reference Hall, D'Souza and Kirk7], and thus have an impact on the risk of disease. This may also indicate a need for more precise modelling of any lag effects of temperature on disease risk.
The inverse linear relationship between infectious gastroenteritis cases and relative humidity in our study is consistent with previous findings in Peru and Bangladesh [Reference Hashizume17, Reference Guerrant20]. Our study also found that the effect of relative humidity on infectious gastroenteritis was independent of ambient temperature. In Japan, a previous report suggested that rotavirus gastroenteritis infection was not associated with relative humidity [Reference Konno9]. The discrepancy could be due to the effects of seasonally varying factors and mutual confounding between weather factors, which were controlled in the current study but not in the previous one. Additionally, our finding of a negative association between cases of infectious gastroenteritis and relative humidity is more consistent with laboratory evidence. Therefore, our combined temperature and humidity results demonstrate the importance of weather variability on the prevalence of gastroenteritis infections.
Methodologically, results in most of the previous studies are still subject to influences by other factors that cause departure from typical seasonal patterns, but our results are not subject to confounding bias by factors that might explain inter-annual or seasonal patterns. Although data on the specific causes of diarrhoea were not available for analysis, a previous study has suggested increased cases of bacterial diarrhoea during the summer and rotavirus infections during the winter [Reference Cama25]. Warmer weather may also be associated with behavioural patterns such as increased demand for water and less conscientious hygienic practices, which are known to promote diarrhoea transmission [Reference Black, Lanata, Blaster, Smith, Ravdin, Greenberg and Guerrant10]. While other behavioural factors that are not related to weather variability may also affect the seasonality of diarrhoea, such as the consumption of certain foods during holidays and changes in the patterns of food availability, we found no evidence of these factors. Activities such as school attendance may also affect the seasonality of infectious gastroenteritis but <20% of the children were of school age.
Temperature was the most important environmental factor affecting infectious gastroenteritis cases in this large-scale, long-term study. For each 1°C increase in ambient temperature, the number of infectious gastroenteritis cases increased by 7·7%. If our findings can be reproduced and extrapolated to other geographical regions, cases of infectious gastroenteritis could potentially increase by millions of cases worldwide with global warming of 1°C above normal.
We report our results for infectious gastroenteritis with no regard to aetiology despite the fact that different enteropathogens classically exhibit different patterns of seasonal variation. Since bacterial and viral agents may respond differently to the effects of weather, the results might reflect the impact of the most common cause of infectious gastrointestinal disease. Therefore, our results should be interpreted with caution in this respect and further studies on the effects of weather variability on specific pathogen-induced infectious gastroenteritis are warranted.
In this study, weather factors explained departures from the expected number of infectious gastroenteritis cases based on the usual seasonal patterns, but this does not mean that these factors could explain the usual seasonal patterns themselves. The transmission of infectious gastroenteritis is complex and multifactorial involving both host and environmental factors. Some of these environmental factors were not considered in our study, which identified temperature and relative humidity as two important factors that appeared sufficient to explain the general infectivity of gastroenteritis. However, further work is necessary to clarify the role of weather in the seasonality of gastroenteritis infections.
To measure the effects of climate changes on infectious gastroenteritis, we used time-series analysis, which is commonly used biostatistically in economic forecasting as well as disease surveillance. Our quantitative approach introduced the use of smooth curves (regression splines) to model changes in the patterns of infectious gastroenteritis cases. Our method is useful for analysing meteorological effects on health outcomes, such as diarrhoea, acute respiratory infections, or malaria, and can control for confounding variables using a regression model.
The present study has several methodological limitations. First, and partly because the disease typically lasts only 3 days with a generally favourable outcome, a recurring problem in the epidemiology of infectious gastroenteritis is the lack of detailed incidence or prevalence data, which is exacerbated by poor clinical diagnosis and infrequent laboratory testing. Second, our studies are subject to their own set of limitations. Many of these findings are based on surveillance data; therefore, reporting bias may complicate results. This bias can occur anywhere in the reporting chain, from the initial tendency of a patient to seek health care to the recording of the case in the disease registry. However, we find no reason to believe this would result in substantial bias because infectious gastroenteritis cases are not rare and are not restricted to a certain area. Third, our results might include potential biases because sentinel medical institutions were recruited on a voluntary basis. Fourth, we were not able to examine the effects of individual susceptibility, so an investigation of the specific role of social and demographic factors in the spread of infectious gastroenteritis would be critical for future studies. To more effectively utilize the surveillance monitoring data, further discussion of disease-specific issues will be important. Fifth, the seasonal pattern of infectious gastroenteritis cases might be a consequence of unmeasured factors apart from weather factors. These factors include seasonal patterns linked to human activity and environmental factors other than weather.
Finally, there may be concerns that there is a lack of ability to look at pathogen-specific affects in the modelling. Since bacterial and viral agents might respond differently to the effects of weather, it seems that the results would reflect the impact of the most common cause of infectious gastrointestinal disease. Without being able to account for pathogen characteristics, it might be difficult to generalize the affect of these weather-related variables.
In conclusion, our study found significant quantitative evidence that the number of infectious gastroenteritis cases increased with higher temperature and lower relative humidity in the preceding weeks for a large number of cases over a 9-year period. Our findings are consistent with previous studies reporting mere climatic trends or seasonal variations.
NOTE
Supplementary material accompanies this paper on the Journal's website (http://journals.cambridge.org/hyg).
ACKNOWLEDGEMENTS
The study was supported in part by a Grant-in-Aid for Scientific Research from the Ministry of Health, Labour and Welfare, Japan. We thank the Fukuoka Prefectural Government, Department of Public Health and Medical Affairs, Division of Public Health for their painstaking efforts in conducting the infectious disease surveillance in Fukuoka, Japan.
DECLARATION OF INTEREST
None.



