


Management Implications
Informed by results from our analyses, which focused on the performance of the native community rather than only on the invasive species, we have developed several recommendations that could be followed to reduce vulnerability and promote resistance to plant invasions:
-
1. Management that reduces differences in propagule availability between invasive and native species and/or promotes early establishment of natives after disturbance will likely result in sustainable decrease in invasive plants.
-
2. If invasive propagule pressure is high, management operations should avoid any practice that promotes plant establishment (e.g., removal of vegetation). When vegetation is reduced, management should ensure the availability of propagules from competitive native species, that is, assess sources of seeds and resprouts and consider seeding or planting.
-
3. In cases in which seeding or planting of native species is being implemented, using a diversity of functional groups might be necessary to ensure long-lasting resistance to invasion.
-
4. In general, invasive plants benefit more from an increase in resources than native species; thus, management should avoid practices (or mitigate conditions) that increase plant resources (mainly light and nutrients).
-
5. When planning to implement any type of management practice that might disturb the system, managers should carry out careful assessment of potential effects on both the invasive and native plant communities; actions taken should decouple management from environmental conditions that might facilitate reinvasion.
-
6. Removal of disturbance, in particular anthropogenic disturbances, might be the best strategy to reduce/prevent plant invasion.
Introduction
Invasive plants can have major impacts on the diversity and function of native communities (D’Antonio and Vitousek Reference D’Antonio and Vitousek1992; Mack and D’Antonio Reference Mack and D’Antonio1998; Waller et al. Reference Waller, Allen, Barratt, Condron, França, Hunt, Koele, Orwin, Steel, Tylianakis, Wakelin and Dickie2020). Consequently, there is a major focus on preventing invasions, and once an invasion is already under way, on controlling its spread. However, in the case of plants, once a species is widely established, management aimed at eradication is rarely successful (Kettenring and Reinhart Adams Reference Kettenring and Reinhardt Adams2011; Smith et al. Reference Smith, Maxwell, Menalled and Rew2006), and efforts to control the invasive frequently only work temporarily (Copeland et al. Reference Copeland, Munson, Bradford and Butterfield2019). Furthermore, management of one problematic species does not ensure control of other invasive plants (Rinella et al. Reference Rinella, Maxwell, Fay, Weaver and Sheley2009); in some instances, control practices targeting one invader may promote secondary invasions (Gabler and Siemann Reference Gabler and Siemann2013; Pearson et al. Reference Pearson, Ortega, Runyon and Butler2016). Given the challenges associated with managing plant invasions, focusing not only on the invader, but also on the native community being affected, may provide additional insights for management. Vulnerability and resistance to plant invasions, the two sides of an ecosystem’s susceptibility to invasion, highly depend on features of the community affected, that is, level of biotic resistance, abiotic constraints, and propagule availability (Byun et al. Reference Byun, de Blois and Brisson2018). To better understand which attributes of native communities affect their vulnerability or resistance to plant invasions, we carried out a meta-analysis of the literature on this topic. We then used results from this analysis to develop management recommendations aimed at reducing vulnerability or promoting resistance to plant invasion.
Most work done on plant invasions focuses on the invasive species—its presence, abundance and/or demographic performance—with little assessment of the native plants. Invasive species’ impact on native communities is usually assessed in terms of changes in diversity and/or abundance (e.g., Beaury et al. Reference Beaury, Finn, Corbin, Barr and Bradley2020; Dyderski and Jagodziński Reference Dyderski and Jagodziński2020; Powell et al. Reference Powell, Chase and Knight2013) but rarely on changes in individual plant performance (but see Vilà and Weiner Reference Vilà and Weiner2004). The omission of native plant performance is relevant, because this information could explain why similar invasions may result in different impacts in different contexts (Davis et al. Reference Davis, Grime and Thompson2000; Williamson and Fitter Reference Williamson and Fitter1996). For example, Daehler (Reference Daehler2003) showed that the ability of invasive species to outperform natives depended on growing conditions, that is, the level of resources. Similarly, resource-dependent outcomes could be the case with enemy release (Keane and Crawley Reference Keane and Crawley2002; Mitchell and Powell Reference Mitchell and Power2003; Prior et al. Reference Prior, Robinson, Meadley Dunphy and Frederickson2015), wherein the advantages of enemy release seem to mostly take place at high resource availability (Blumenthal Reference Blumenthal2006). These examples illustrate how native vulnerability or resistance to the invasion can be mediated by resource competition, which is dependent on features of the ecosystem.
Understanding to what extent invasion is mostly driven by resource competition between invasive and native plants versus other mechanisms (i.e., propagule pressure) is important. Competition underlines the basis for biotic resistance to invasions (Price and Pärtel Reference Price and Pärtel2013; Richardson and Pyšek Reference Richardson and Pyšek2006; Stachowicz et al. Reference Stachowicz, Whitlatch and Osman1999). If competitive inequalities and the conditions under which they take place are promoting the spread and growth of invasive species, this knowledge can be used to evaluate which introduced plants could be overly competitive or which communities are most vulnerable because of a lack of potential competitors. Such knowledge can also help formulate potential solutions, such as specific management approaches to increase competitive ability of the native community.
Competitive ability of the native community is commonly reduced under novel or extreme disturbances (Connell Reference Connell1978; Lockwood et al. Reference Lockwood, Hoopes and Marchetti2007). These are also the conditions that promote strong performance of opportunistic introduced species (Hobbs and Atkins Reference Hobbs and Atkins1988; Seabloom et al. Reference Seabloom, Harpole, Reichman and Tilman2003). Still, native plant communities may also host species adapted to rapidly respond to disturbance events; these are native species that could outperform invasive plants and be a major contributor of the community resistance to invasions (Byun et al. Reference Byun, de Blois and Brisson2013; Daehler Reference Daehler2003). Therefore, assessing a priori whether a plant community includes native species able to rapidly respond to disturbance could be fundamental in deciding which management practices should be implemented.
In addition to decreasing native species competitive ability, disturbances promote invasion by altering the flow of resources (Hobbs and Huenneke Reference Hobbs and Huenneke1992). Resource fluctuations have been postulated as a mechanism of invasion, either because invasive species are better adapted to respond to high-resource environments or because the native community does not take advantage of resource pulses (Daehler Reference Daehler2003; Davis et al. Reference Davis, Grime and Thompson2000; Davis and Pelsor Reference Davis and Pelsor2001). Invasive species usually have acquisition traits that allow them to rapidly respond to an increase in resources and thus benefit the most (Dawson et al. Reference Dawson, Rohr, van Kleunen and Fischer2012; Funk and Vitousek Reference Funk and Vitousek2007; Heberling and Fridley Reference Heberling and Fridley2013). Subsequently, a reduction of resources might be associated with native community resistance to invasions (Iannone and Galatowitsch Reference Iannone and Galatowitsch2008; Kuebbing et al. Reference Kuebbing, Rodriguez-Cabal, Fowler, Breza, Schweitzer and Bailey2013; Schuster et al. Reference Schuster, Wragg, Williams, Butler, Stefanski and Reich2020). Evaluating whether and to what extent a particular native community has the potential to respond to a change in resources will likely shed light on its vulnerability to invasion. If the community will not respond, then avoiding those conditions and/or surge of resources should be a management priority.
With the goal of informing management aimed at reducing vulnerability or promoting resistance to plant invasions, we carried out a meta-analysis to document native plant performance at sites affected by invasive plants and the ecosystem features associated with those invasion events. Our search and analyses were aimed at answering the following questions: (1) What are the main drivers of native plant community vulnerability to invasion? (2) As invasive species dominate plant communities, how is native plant performance affected? (3) Is native plant performance affected differently depending on the driver of vulnerability? (4) Do these differences vary across different plant communities? And (5) how can answers to these questions inform management of plant communities aimed at curtailing the impact of plant invasion? Our overall aim is to provide further insight and management options to promote resistance and reduce vulnerability of plant communities to plant invasions.
Materials and Methods
Literature Search and Data Extraction
To target studies that would have assessed both the extent of the invasion and the performance of the native community, we limited our search to publications that addressed the vulnerability or resistance of the native community to biological invasions. Thus, in August 26, 2019, we carried two searches in the Web of Science database using the following terms:
-
1. Vulnerability search: (“non native species” OR “alien species” OR “introduced species” OR “nonnative species” OR “non-native species” OR “invasive species” OR “exotic species”) AND (vulnerab* OR susceptib* OR invasibility OR “high* impact” OR “increas* impact*” OR “enhance* impact*” OR “low* impact*” OR “decreas* impact *” OR “diminish* impact*” OR “reduc* impact*” OR “decline* impact*”). Results: 3,160.
-
2. Resistance search: (“biotic resistance” OR “biotic resilience” OR “priority effect*” OR “founder effect*” OR “historical contingen*” OR “contingen* effect*” OR “community assembly history” OR “community assembly” OR “native species addition” OR “ecological resistance” OR “diversity effect*” OR “ecological resilience”) AND (“non native species” OR “alien species” OR “introduced species” OR “nonnative species” OR “non-native species” OR “invasive species” OR “exotic species”). Results: 933.
We then applied these selection criteria:
-
1. Studies refer to plant invasions in terrestrial ecosystems (wetlands included); we restricted our assessment to terrestrial plant communities, because mechanisms of vulnerability and resistance might be quite different across taxonomic groups and ecosystems.
-
2. Studies report two levels of invasion in the same plant community (what we refer to as “high” and “low” invasion; see data analysis section below); this allowed us to identify the ecosystem features that promote/resist plant invasions and that could be targeted for management. Studies reporting presence/absence of invasive plants were not included; absences may not reflect resistance, but rather a lack of invasive propagules.
-
3. Studies provide information on a feature, biotic or abiotic, of the ecosystem that has been linked to either its vulnerability or its resistance to invasion.
-
4. Studies provide raw data or summary statistics of the invasive plants’ performance; analyses that only reported model outcomes (i.e., parameter values) were not considered, as these usually are the result of multivariate analysis and would have made it difficult to assess the main variable driving the invasion.
After combining the two searches, we extracted information from selected publications on the biophysical features of the system (e.g., location, climate, biome, vegetation type), the type of study (observational or experimental), the variables of the native community measured (biotic or abiotic); identified the driver of vulnerability or resistance to the invasion; and recorded metric of plant performance or community assessment collected on the invasive species, and if available, on the native species. For a full list of variables extracted, see Supplementary Material 1.
We classified the drivers of vulnerability identified in the publications into six different categories; some were further classified in several subcategories (Table 1). We are aware that some of these categories overlap. For example, biotic resistance, or lack thereof, can be due to different types of biotic interactions (Levine et al. Reference Levine, Vilà, Antonio, Dukes, Grigulis and Lavorel2003). In our data, we denoted as “biotic resistance” those observations in which competition between native and invasive plants was the proposed mechanism for vulnerability or resistance. Propagule availability as an invasion mechanism may reflect excess propagules from invasive plants and/or lack of native propagules. Although invasive species propagule pressure is not a feature of the native community, an excess of invasive propagules over native propagules overlaps with the concept of priority effects driving vulnerability or resistance (Dickson et al. Reference Dickson, Hopwood and Wilsey2012; Stuble and Souza Reference Stuble and Souza2016). For plant performance or community assessment data for both invasive and native plants, we gathered information on the metrics measured (Table 1); these included abundance (either density or cover), biomass (total or aboveground), individual plant growth, recruitment (seed production, establishment), individual survival, and richness (number of species). We also recorded sample size, mean response value, and variability around mean response (SD, SE, or variance). Values from figures were extracted using the Web Plot Digitizer online application (http://arohatgi.info/WebPlotDigitizer/app). A flowchart of the publication selection process is provided in Supplementary Material 2.
Drivers of vulnerability and plant performance and community assessment metrics.
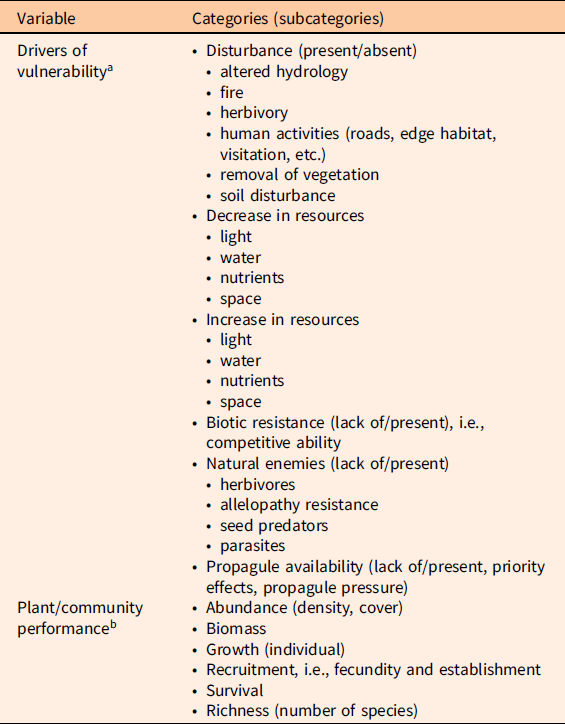
a List of drivers of vulnerability to plant invasions identified across the publications included in the analyses.
b List of invasive and native plant performance metrics recorded.
Data Analysis
Effect size, that is, differences in plant performance between communities with high and low invasion, was calculated as:
 $${\rm{ES}} = \;{\matrix{ ({\rm{performance}}\;{\rm{at}}\;{\bf{high}}\;{\rm{invasion}} \hfill \cr - {\rm{performance}}\;{\rm{at}}\;{\bf{low}}\;{\rm{invasion}}) \hfill \cr} \over {{\rm{average}}\;{\rm{performance}}}}$$
By this formulation, ES of invasive plants (ESinvasive) is always positive. We then compared it with native ES (ESnative): change in native performance under the invasion. Specifically, we wanted to: (1) investigate conditions under which native performance increases, decreases, or does not change; and (2) quantify the magnitude in native performance change (ESnative) with respect to the magnitude of increase in invasive performance (ESinvasive).
Because a substantial portion of the observations, 10%, did not report variance associated with mean performance, instead of using standard metrics (e.g., Hedges’ g), we ran a simulation to estimate ES, treating missing variances as latent variables to be estimated as a function of the largest ES variance calculated from studies with reported variances (see following section). Sample size was also considered in these estimations by weighing variances by their sample size (Gurevitch and Hedges Reference Gurevitch, Hedges, Scheiner and Gurevitch2001). See Supplementary Material 3 for simulation code.
We carried out extensive exploratory data analysis to assess whether any of the variables gathered (e.g., climate, latitude, type of study) contributed to the observed variability in ES, but none did. To address our research questions, we then used multilevel mixed-effects models to analyze ES as a function of the driver of vulnerability and the nested subcategories within each driver (Table 1), with publication as a random effect. To see whether differences between the invasive and native communities depended on the metric used (e.g., abundance, growth, survival), we also analyzed data for each plant performance or community assessment metric. Additional analyses for each biome–driver combination and vegetation type–driver combination were also done, in this case without including random effects (some categories were represented by only one publication).
We used a hierarchical Bayesian approach to be able to incorporate missing variances as latent variables (Ibáñez et al. Reference Ibáñez, Acharya, Juno, Karounos, Lee, McCollum, Schaffer-Morrison and Tourville2019). Missing variances were estimated by sampling from normal distributions (limited to be positive) with an SD of 1, with mean being the largest variance among observations with reported variance; this is the most conservative, lowest bias, imputation method to deal with missing variances (Batson and Burton Reference Batson and Burton2016). Parameters of the mixed-effects models were all estimated from noninformative prior distributions (code for these analyses can be found in Supplementary Material 3).
Because a large portion of our observations (40%) referred to disturbance as a main mechanism of vulnerability to invasion, we carried out an additional analysis to better asses the role of disturbance on vulnerability or resistance to plant invasion. We performed an analysis that compared sites with and without disturbance. For this analysis, differences in plant performance (i.e., ES) were estimated as:
 $${\rm{ES}} = \;{\matrix{ ({\rm{performance}}\;{\bf{with}}\;{\rm{disturbance}} \hfill \cr - {\rm{performance}}\;{\bf{without}}\;{\rm{disturbance}}) \hfill \cr} \over {{\rm{average}}\;{\rm{performance}}}}$$
In our records, high invasion was not always associated with disturbance; thus ES estimation here is different from the analyses described earlier. We ran a similar hierarchical model to the one described above, but in this case as a function of the six disturbance categories and the subcategories that we identified in the data (Table 1). Effect size calculations and analyses were carried out in OpenBUGS (Thomas et al. Reference Thomas, O’Hara, Ligges and Sturts2006). Effect size posterior estimates that did not include zero in their 95% credible intervals were considered statistically significant. Effect sizes with 95% credible intervals that did not overlap were considered significantly different from one another.
Results and Discussion
A total of 214 articles were selected for the analysis (see list in Supplementary Material 4), yielding 506 observations. Native performance was reported in less than half of these (189 observations, 37%), supporting our assertion that invasiveness (invasive species performance) is frequently assessed without considering impact (native species performance). More than 140 invasive species were represented in the data, with numerous studies only reporting mixtures of invasive species (40%). In our review, we identified six mechanisms of vulnerability, or resistance, to plant invasions (Table 1). The most common driver of invasion identified across the data was disturbance, with 205 observations (40.5% of total; 52 of those provided native plant performance). Most observations came from North America and Europe (74%), in particular the United States (58%). Funnel plots of the effect sizes used in the analysis can be found in Supplementary Material 5; parameter values are reported in Supplementary Material 6.
Assessing Vulnerability to Invasion
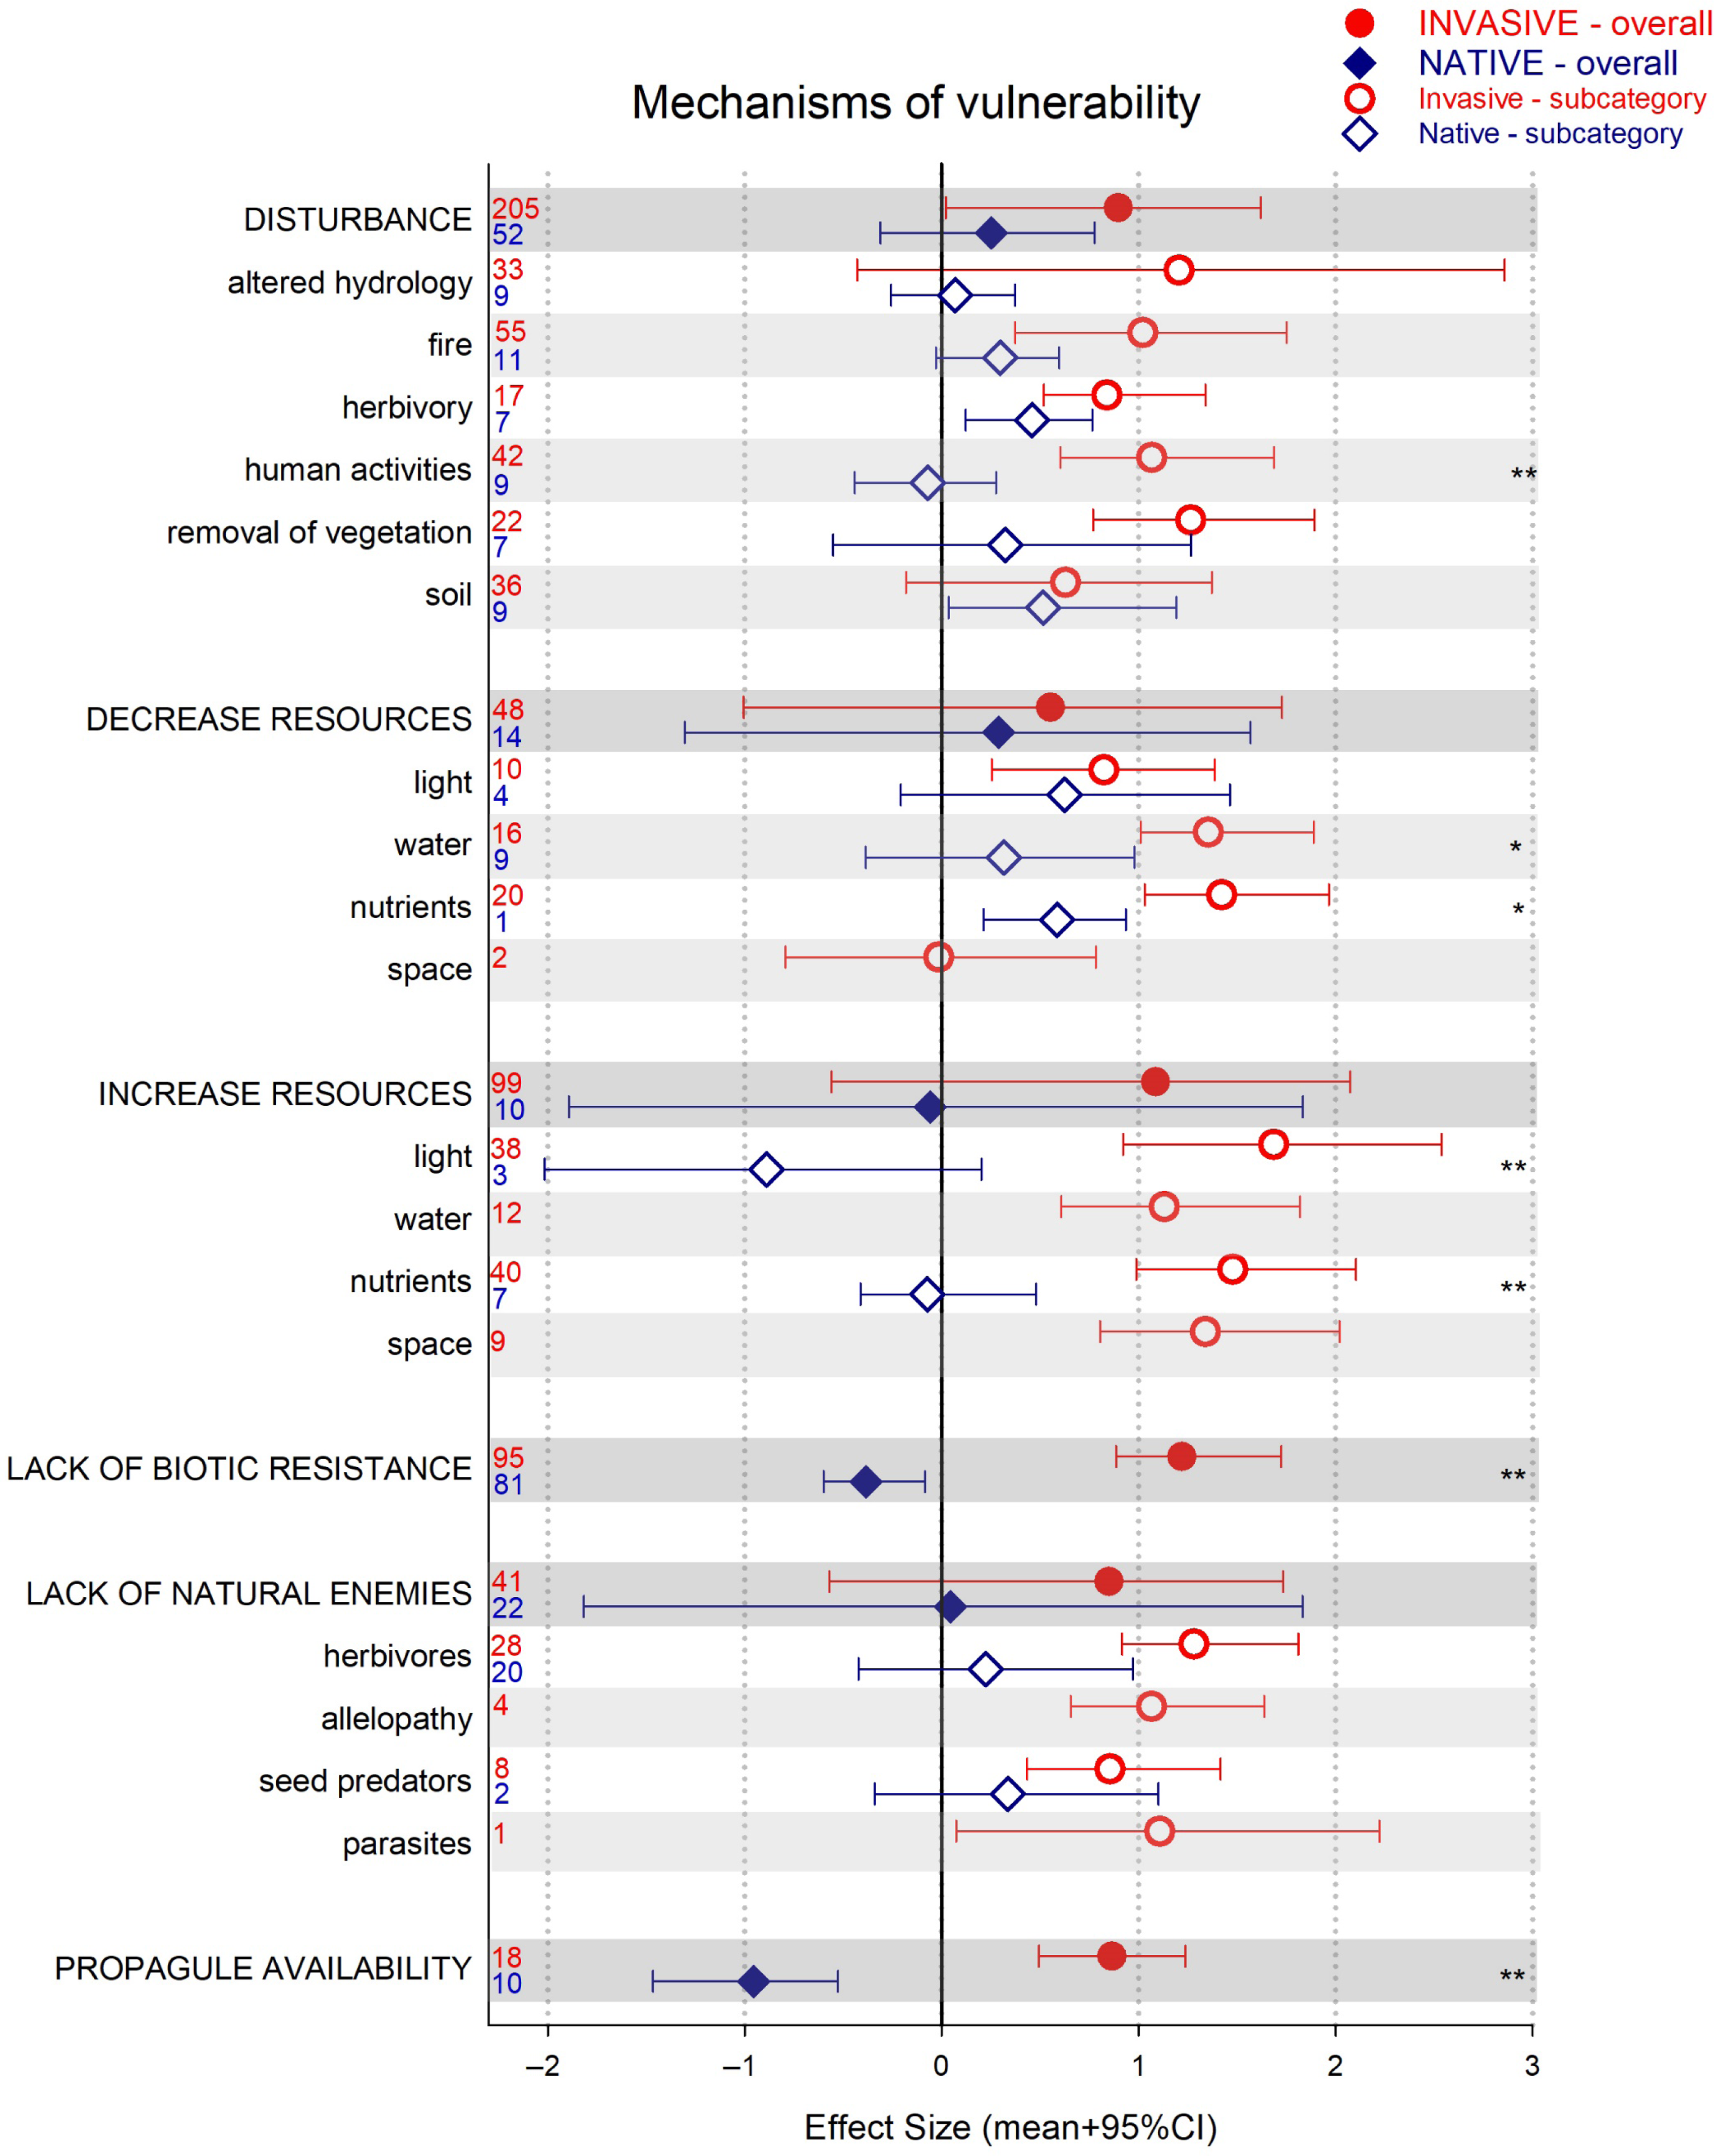
The two instances in which the native community experienced a significant decline, while invasive plants benefited significantly, were studies in which propagule availability and lack of biotic resistance (or higher competitive ability of the invasive plants) were identified as the drivers of vulnerability to invasion (Figure 1). In all other cases, the native community response to the invasion was neutral or positive (i.e., under herbivory; Figure 1). There were also several instances of native and invasive performances differing, with an overall pattern of higher effects sizes among invasive plants (Figure 1).
Results for the analysis of invasive and native plant performance or community assessment (effect size [ES] mean + 95% credible interval [CI]), as a function of drivers of vulnerability (darker bars) and their subcategories (white and light gray bars). CIs that do not overlap with zero are considered statistically significant. An asterisk indicates invasive and native species ES 95% CIs do not overlap but are of the same sign (i.e., same direction of change). Two asterisks indicate invasive and native species ES 95% CIs do not overlap and are of different sign (i.e., opposite direction of change). Numbers denote number of observations included.
In the field of biological invasions, propagule availability refers to both the number of propagules and the rate of arrival (Simberloff Reference Simberloff2009). High propagule pressure from introduced species has been strongly associated with their spread and abundance (e.g., Catford et al. Reference Catford, Vesk, White and Wintle2011; Ibáñez et al. Reference Ibáñez, Silander, Allen, Treanor and Wilson2009). Our results link higher levels of invasive propagules to a reduction in native plant performance and thus to higher native plant community vulnerability to invasion (Figure 1). Furthermore, these results could simultaneously reflect low native seed abundance (Schuster et al. Reference Schuster, Wragg and Reich2018; Vilà and Ibáñez Reference Vilà and Ibáñez2011; von Holle and Simberloff Reference von Holle and Simberloff2005). This finding underscores the importance of legacy (what is left) and priority (what arrives first) effects during plant establishment, particularly after disturbance (Corbin and D’Antonio Reference Corbin and D’Antonio2012; Uricchio et al. Reference Uricchio, Daws, Spear and Mordecai2019). If invasive propagules are the most abundant, any removal of vegetation will likely result in reinvasion (Pearson et al. Reference Pearson, Ortega, Runyon and Butler2016; Prior et al. Reference Prior, Adams, Klepzig and Hulcr2018). Thus, management practices that decrease invasive propagules (e.g., removal before seeding), while at the same time increasing native propagules (e.g., via seeding or planting), may have particularly successful results (Reinhardt Adams and Galatowitsch Reference Reinhardt Adams and Galatowitsch2008).
Lack of biotic resistance or high competitive ability of invasive plants is frequently associated with successful invasions (Carboni et al. Reference Carboni, Calderon-Sanou, Pollock, Violle, DivGrass and Thuiller2018; Vilà and Weiner Reference Vilà and Weiner2004). Numerous studies have documented a variety of plant traits conferring invasive plants an advantage over the invaded native communities. For example, high total and specific leaf area (Allred et al. Reference Allred, Fuhlendorf, Monaco and Will2010), high germination rates (Deschenes et al. Reference Deschenes, Caubel and Sirois2019), specific mechanism of nitrogen acquisition (Laungani and Knops Reference Laungani and Knops2009), and chemical inhibition of native plant photosynthesis (Musil et al. Reference Musil, Arnolds, van Heerden and Kgope2009) have all, among others, been identified as features of invasive plants contributing to their invasion success. Also, competition for space and resources during recruitment or the production of allelochemicals by invasive plants may prevent native species from growing populations that could resist the invasion (e.g., Edwards et al. Reference Edwards, Schlesinger, Ooi, French and Gooden2019; Esch et al. Reference Esch, Ashbacher, Kopp and Cleland2018; Grove et al. Reference Grove, Haubensak, Gehring and Parker2017).
Still, high invasive competitive ability is not only a function of the invasive itself, but is usually associated with particular features of the ecosystem (Daehler Reference Daehler2003; Metlen et al. Reference Metlen, Aschehoug and Callaway2012); which, if managed, could confer the native community a higher level of resistance to the invasion (Byun et al. Reference Byun, de Blois and Brisson2018). High resource ability and/or low enemy pressure are conditions under which invasive plants become highly competitive (Blumenthal Reference Blumenthal2006; Burns et al. Reference Burns, Halpern and Winn2007; Garcia-Serrano et al. Reference Garcia-Serrano, Sans and Escarre2007). Our review showed that under these conditions, native plants tended to underperform compared with invasive species: native plants marginally benefited from enemy release and from changes in resources, while invasive plants strongly benefited from both increases and decreases of resources and lack of enemies (Figure 1).
After the enemy release hypothesis was formulated as a main mechanism of invasion success (Keane and Crawley Reference Keane and Crawley2002), several studies questioned its relevance (Agrawal and Kotanen Reference Agrawal and Kotanen2003; Beckstead and Parker Reference Beckstead and Parker2003; Colautti et al. Reference Colautti, Ricciardi, Grigorovich and MacIsaac2004; Maron and Vilà Reference Maron and Vilà2001). Our results show that with respect to herbivory, the category for which we have more observations, invasive species strongly benefited from absence of herbivory, while native plant response was neutral (although invasive and native performances were not significantly different). This might be an indication of overall higher palatability among invasive plants, as acquisitive and fast-growing traits are associated with lower plant defenses (Blossey and Nötzold Reference Blossey and Notzold1995; Blumenthal et al. Reference Blumenthal, Mitchell, Pyšek and Jarošík2009). Thus, successful invasive species control might involve managing herbivores, for example, by providing access or shelter.
Fluctuation of resources has also been postulated as a major mechanism underlying biological invasions (Davis et al. Reference Davis, Grime and Thompson2000). Our analysis shows that changes in resources were strongly associated with higher invasive performance, while native plants varied in their response (Figure 1). Although the sample sizes for native species are low in some of these comparisons, native plants were significantly outperformed by invasive plants in instances of decreasing water and of increasing light and nutrients (Figure 1; note there were no observations of native responses to water increase). Increases in light have often been identified as a major driver of invasive plant establishment (e.g., Huebner et al. Reference Huebner, Regula and McGill2018), even if the abundance of other resources also promotes native plants (Knight et al. Reference Knight, Oleksyn, Jagodzinski, Reich and Kasprowicz2008). Traits that lead to rapid growth (e.g., high specific leaf area and leaf nutrient content) are most advantageous under high light conditions, and these traits are common among invasive plants (Allred et al. Reference Allred, Fuhlendorf, Monaco and Will2010; van Kleunen et al. Reference van Kleunen, Weber and Fischer2010; Vilà and Weiner Reference Vilà and Weiner2004). In contrast, there were also a few instances in which a decrease in resources (i.e., water) favored invasive plants over natives (Figure 1), but we lack enough data to generalize as to when this is the case. Together, these results underscore the importance of managing available resources to avoid situations that favor invasive species, for example, maintain resource levels within their natural range of variability.
Vulnerability to Invasion across Metrics, Vegetation Types, and Biomes
Performance and impact of invasive plants were assessed with different metrics across our review. Abundance and biomass were the two most common measurements of invasive performance (68%), while richness and abundance were the prevalent metrics across native communities (45%; Figure 2). When assessing the impact of plant invasions through the lens of the native community, the two metrics that strongly differentiated invasive and native plants were abundance (e.g., cover, density) and richness (i.e., number of species) (Figure 2). Other metrics (i.e., growth, recruitment, survival) were quite variable among native plants (also note the low number of observations). Differences in native biomass between sites with low and high invasions were of the same magnitude as those for invasive species (Figure 2).
Results for the analysis of plant performance or community assessment (effect size [ES] mean + 95% credible interval [CI]), invasive and native, as a function of metric used. CIs that do not overlap with zero are considered statistically significant. Asterisks indicate invasive and native species ES 95% CIs do not overlap and are of different sign (i.e., opposite direction of change). Numbers denote number of observations included.
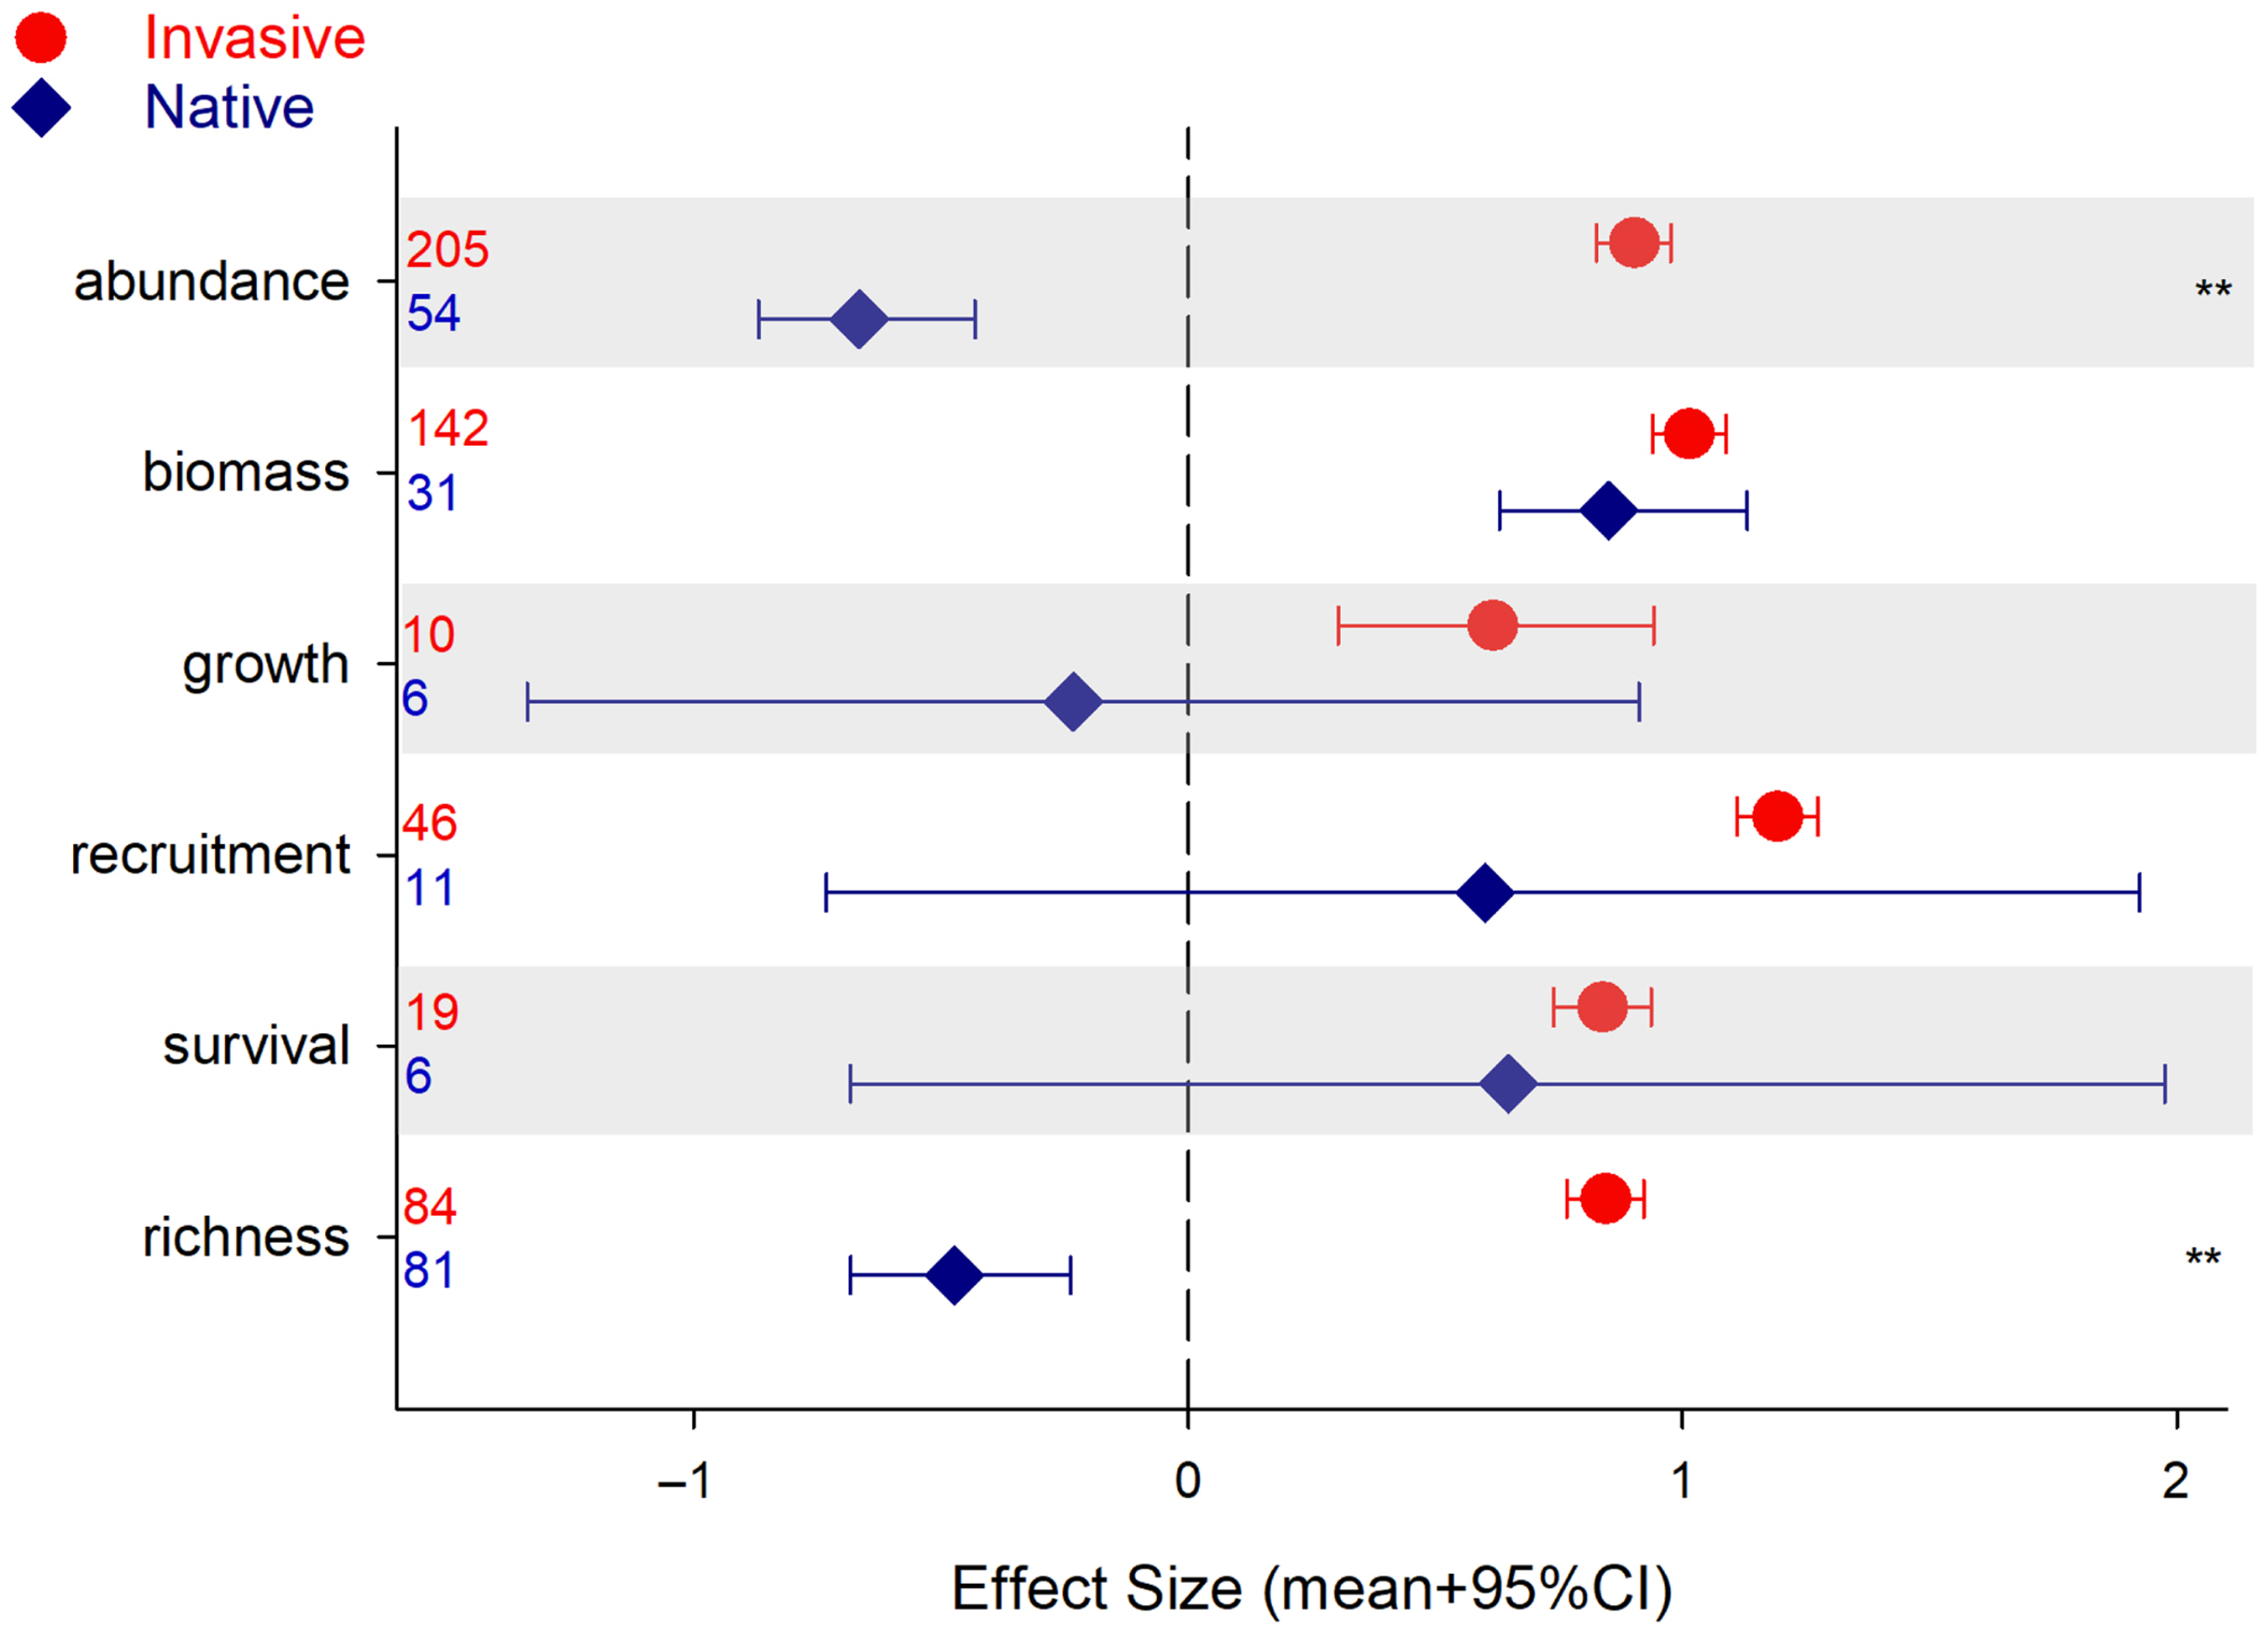
These results might indicate that invasive impact on the native community is exerted at the population level through higher density of individuals (or higher cover). Of course, changes in population density come through changes in recruitment, growth, and survival (Harper Reference Harper1977). In our review, we had very few observations in these categories, showing a wide range of responses, which might explain the lack of significant differences. Biomass, for which we had a higher number of observations, is a common metric used in experimental work. Our results indicate that biomass may not be a good measure of native community vulnerability to invasions; that is, on an individual basis, native plants accumulate as much biomass as invasive, plants but at the population level (abundance or fecundity) their performances differ (Figure 2), indicating that invasion success may be more complex than just straight competition for resources (Daehler Reference Daehler2003; Maron and Vilà Reference Maron and Vilà2001).
Our results also corroborate other studies that document a decrease in native plant species in communities that are being invaded by introduced plants (e.g., Linders et al. Reference Linders, Schaffner, Eschen, Abebe, Choge, Nigatu, Mbaabu, Shiferaw and Allan2019; Powell et al. Reference Powell, Chase and Knight2013). Still, there was no correlation (not shown) between number of native species and the size of the effect, contradicting many studies that have found higher levels of invasion in richer native communities (Aguiar et al. Reference Aguiar, Ferreira and Albuquerque2006). Several studies have associated high native diversity with high levels of invasion (e.g., Long et al. Reference Long, Trussell and Elliman2009; Peng et al. Reference Peng, Kinlock, Gurevitch and Peng2019; Stohlgren et al. Reference Stohlgren, Binkley, Chong, Kalkhan, Schell, Bull, Otsuki, Newman, Bashkin and Son1999, Reference Stohlgren, Barnett and Kartesz2003), but such comparisons between systems with inherently high or low levels of diversity make it very difficult to assess the actual effect of invasions on native diversity. Here, our comparisons were done for the same ecosystem, with the only difference being the degree of invasion, and indicated a strong decline in native richness under invasion.
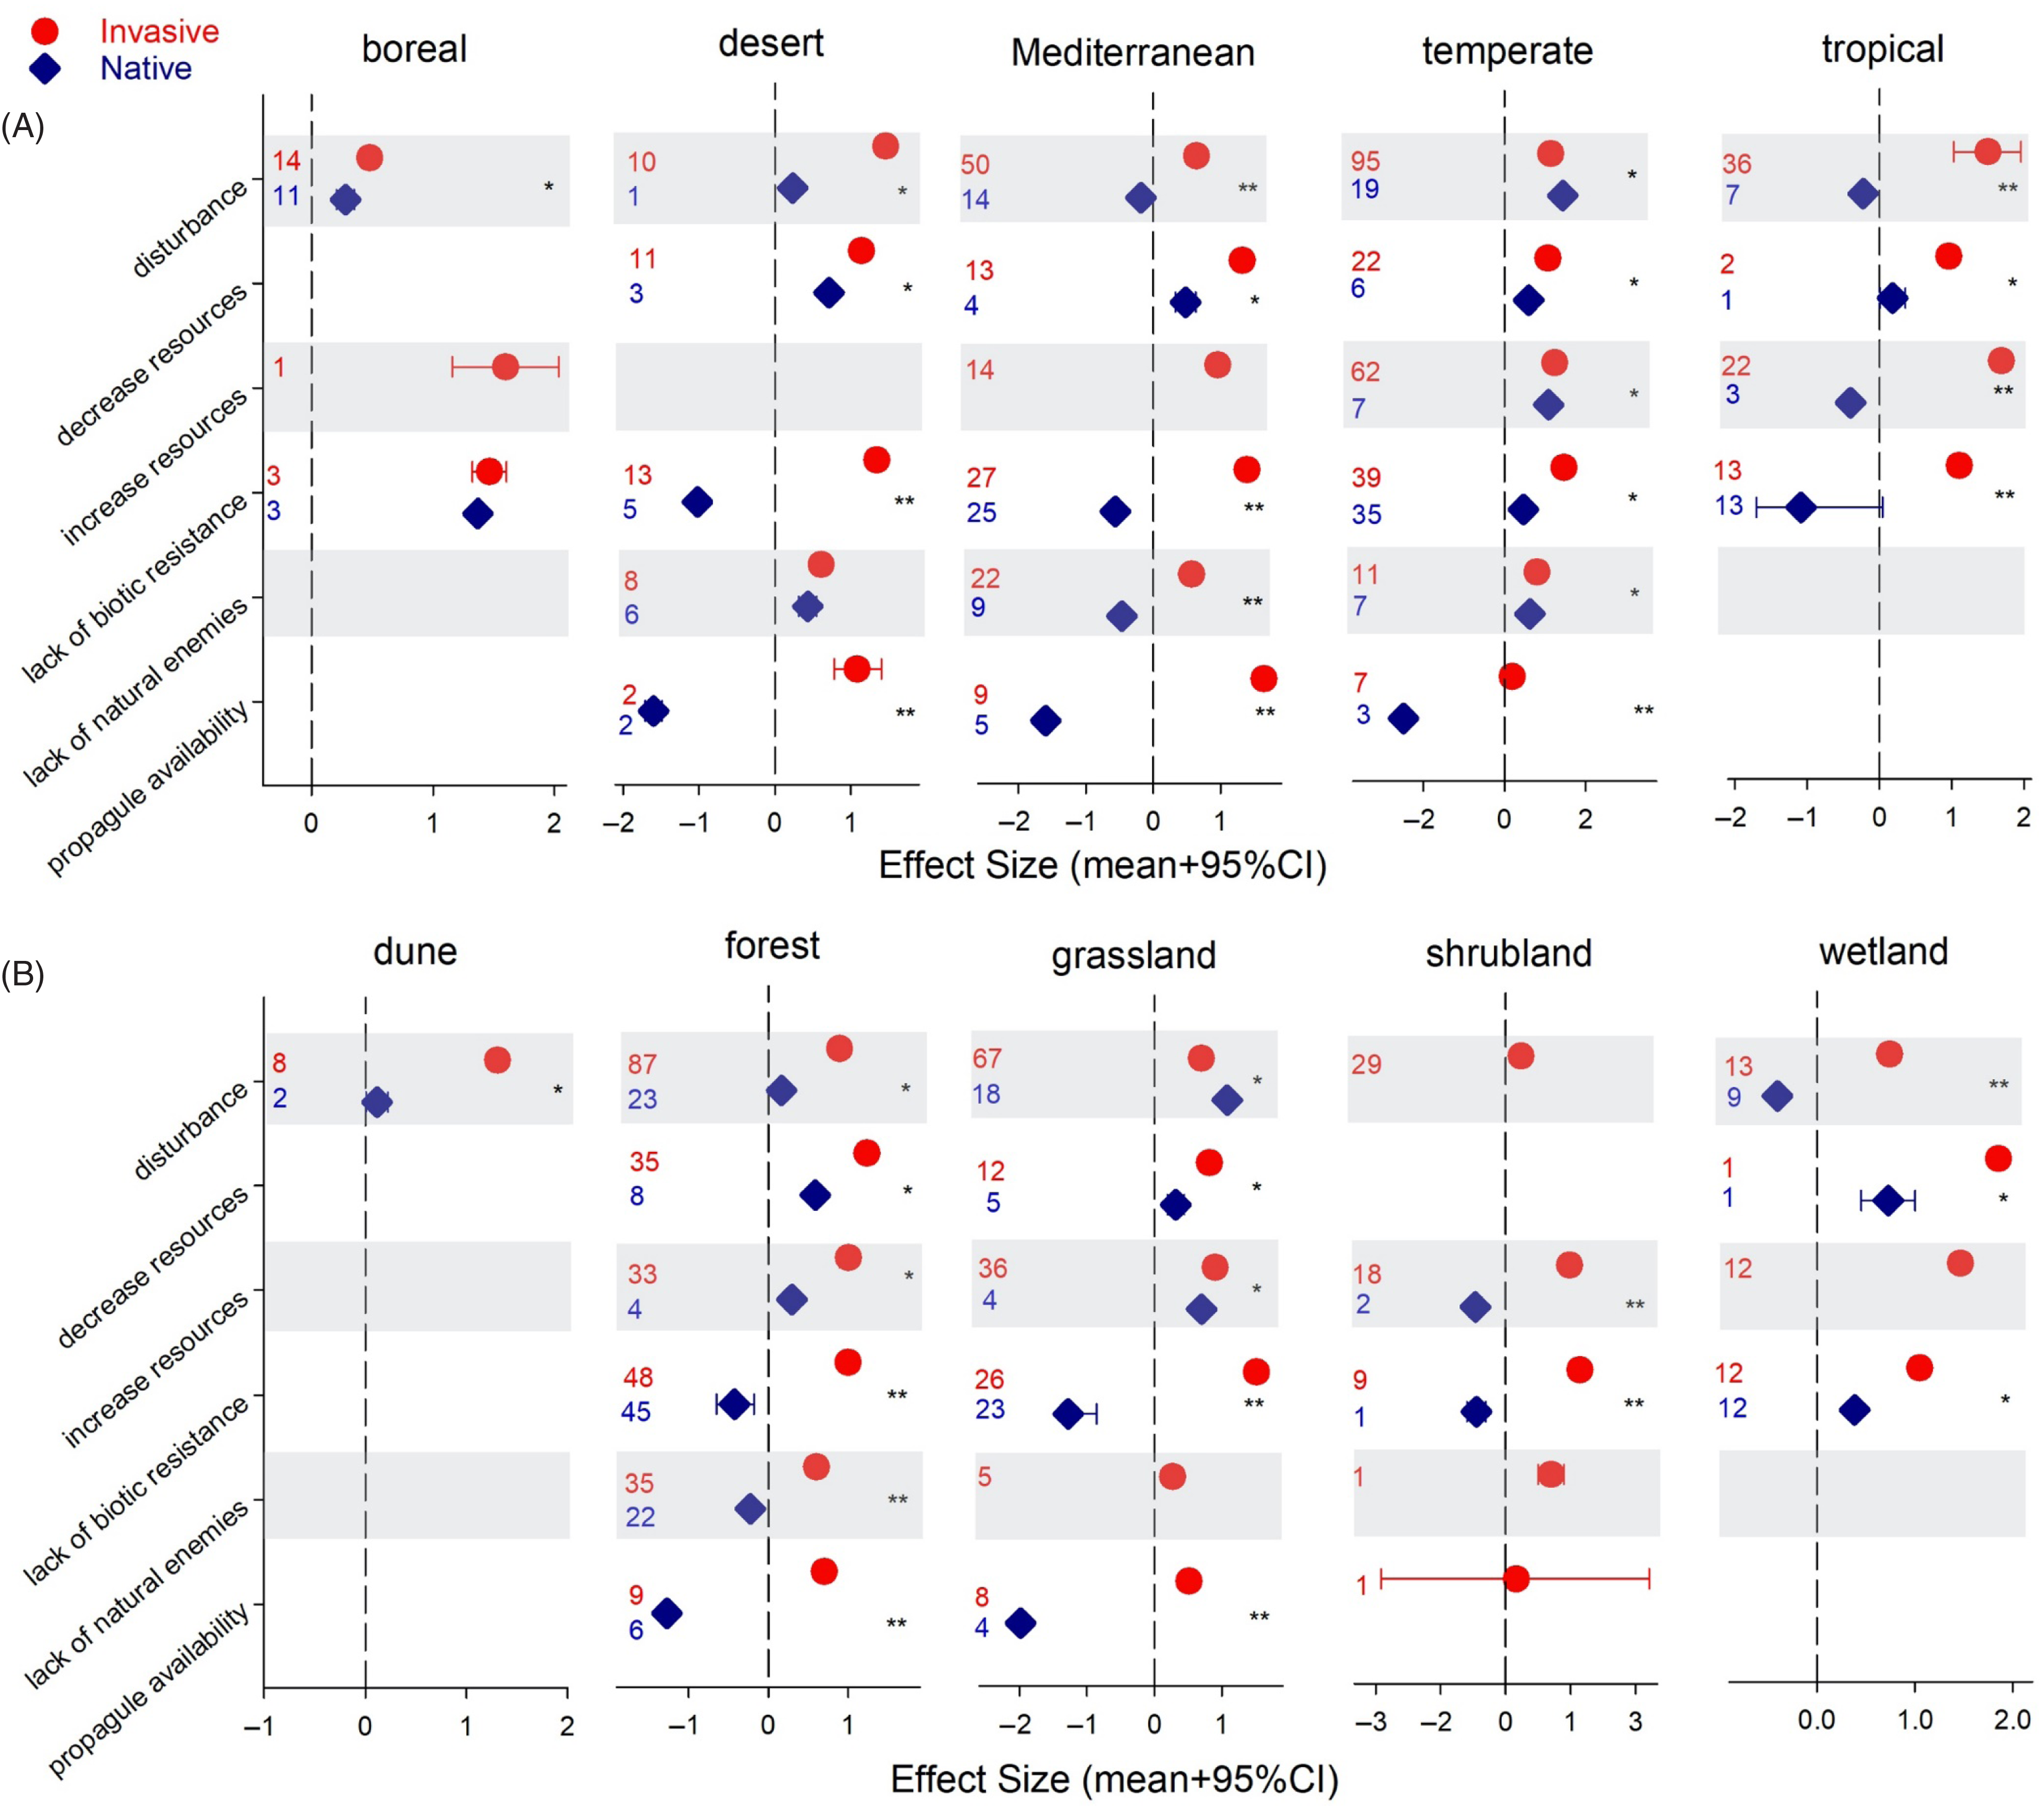
Our assessment of how native plant communities perform under invasion across vegetation types and biomes is limited by the number of observations (Figure 3); thus, we are cautious not to overinterpret our results. Only Mediterranean and temperate communities were well represented, although not for all mechanisms of vulnerability (Figure 3A). In boreal and temperate areas, native plants seem to fare well under invasions, with natives outperforming invasive plants in temperate areas when disturbance was the mechanism driving the invasion. Still, invasive plants showed higher performance under all other drivers. Tropical and Mediterranean native vegetation tended to experience a considerable drop in performance under high levels of invasive plants (Figure 3A). When looking across vegetation types represented in the data, differences between the native and invasive communities become more significant (Figure 3B). Most of the data came from forests and grasslands, which drove the trends discussed above: native species performance was positive under invasion except when lack of biotic resistance or propagule availability were the drivers of vulnerability (Figure 3B). The only vegetation type diverging from the overall trend was wetlands. Disturbance had a strong detrimental effect on wetland natives, while the effect was positive on natives in all other vegetation types (Figure 3B). Wetland habitats are highly susceptible to invasion (Sobrino et al. Reference Sobrino, Sanz-Elorza, Dana and González-Moreno2002), they act as “landscape sinks” of residuals, that is, areas where loose soil and plant material from other systems accumulate, and under disturbance, alterations in their hydrology and nutrient levels create conditions for invasive plants to succeed (Zedler and Kercher Reference Zedler and Kercher2004). Surprisingly, in this vegetation type, invasions attributed to lack of biotic resistance were not associated with lower native performance, as was the case in all other vegetation types (Figure 3B). Because most of these observations, 9 out of 12, were related to species richness, information on other native performance metrics might result in a different outcome.
Effect sizes (ES) on invasive and native plant performance/community assessment across drivers of vulnerability by biome (A) and vegetation type (B). Credible intervals (CI) that do not overlap with zero are considered statistically significant. An asterisk indicates invasive and native species ES 95% CIs do not overlap but are of the same sign (i.e., same direction of change). Two asterisks indicate invasive and native species ES 95% CIs do not overlap and are of different sign (i.e., opposite direction of change). Numbers denote number of observations included.
Disturbance and Vulnerability to Plant Invasion
Disturbances—natural, anthropogenic, or as result of management—are common among plant communities and in many cases provide optimal conditions for invasive species establishment and spread (Jauni et al. Reference Jauni, Gripenberg and Ramula2015; Lembrechts et al. Reference Lembrechts, Pauchard, Lenoir, Nuñez, Geron, Ven, Bravo-Monasterio, Teneb, Nijs and Milbau2016). Resource fluctuations usually follow disturbances (Jentsch and White Reference Jentsch and White2019); then, species better adapted to rapidly use those resources, like many invasive plants, are likely to outcompete later arrivals (Dickson et al Reference Dickson, Hopwood and Wilsey2012; Radford Reference Radford2013). As a result, native community capacity to respond to a disturbance will largely determine its vulnerability to invasion.
In this analysis, we found mostly neutral to positive responses of native plants to disturbance. Natives were only outperformed by invasive species when disturbance was caused by human activities (e.g., pollution, edge effect, trampling, hiking; Figure 1). However, our meta-analysis included observations wherein the lack of disturbance was associated with higher dominance of invasives (16% of the records). Thus, to better assess the role of disturbance in invasion, we specifically compared plant performance of native and invasive plants in communities that had experience a disturbance event (Figure 4). Overall, plant performance after disturbance was quite variable and tended to be positive for both invasive and native plants (Figure 4). Our assessment of the effect of disturbance on plant species performance was based only on the publications selected specifically to address questions of vulnerability and resistance to invasion. Our search terms were not targeted to select all papers that report disturbances, or their lack, during invasions. Thus, our results and discussion are limited to this search.
Effect of disturbance in invasive and native plant performance/community assessment for each disturbance type (darker bars) and subcategories (lighter bars). Credible intervals (CI) that do not overlap with zero are considered statistically significant. Asterisks indicate invasive and native species ES 95% CIs do not overlap and are of different sign (i.e., opposite direction of change). Numbers denote number of observations included.
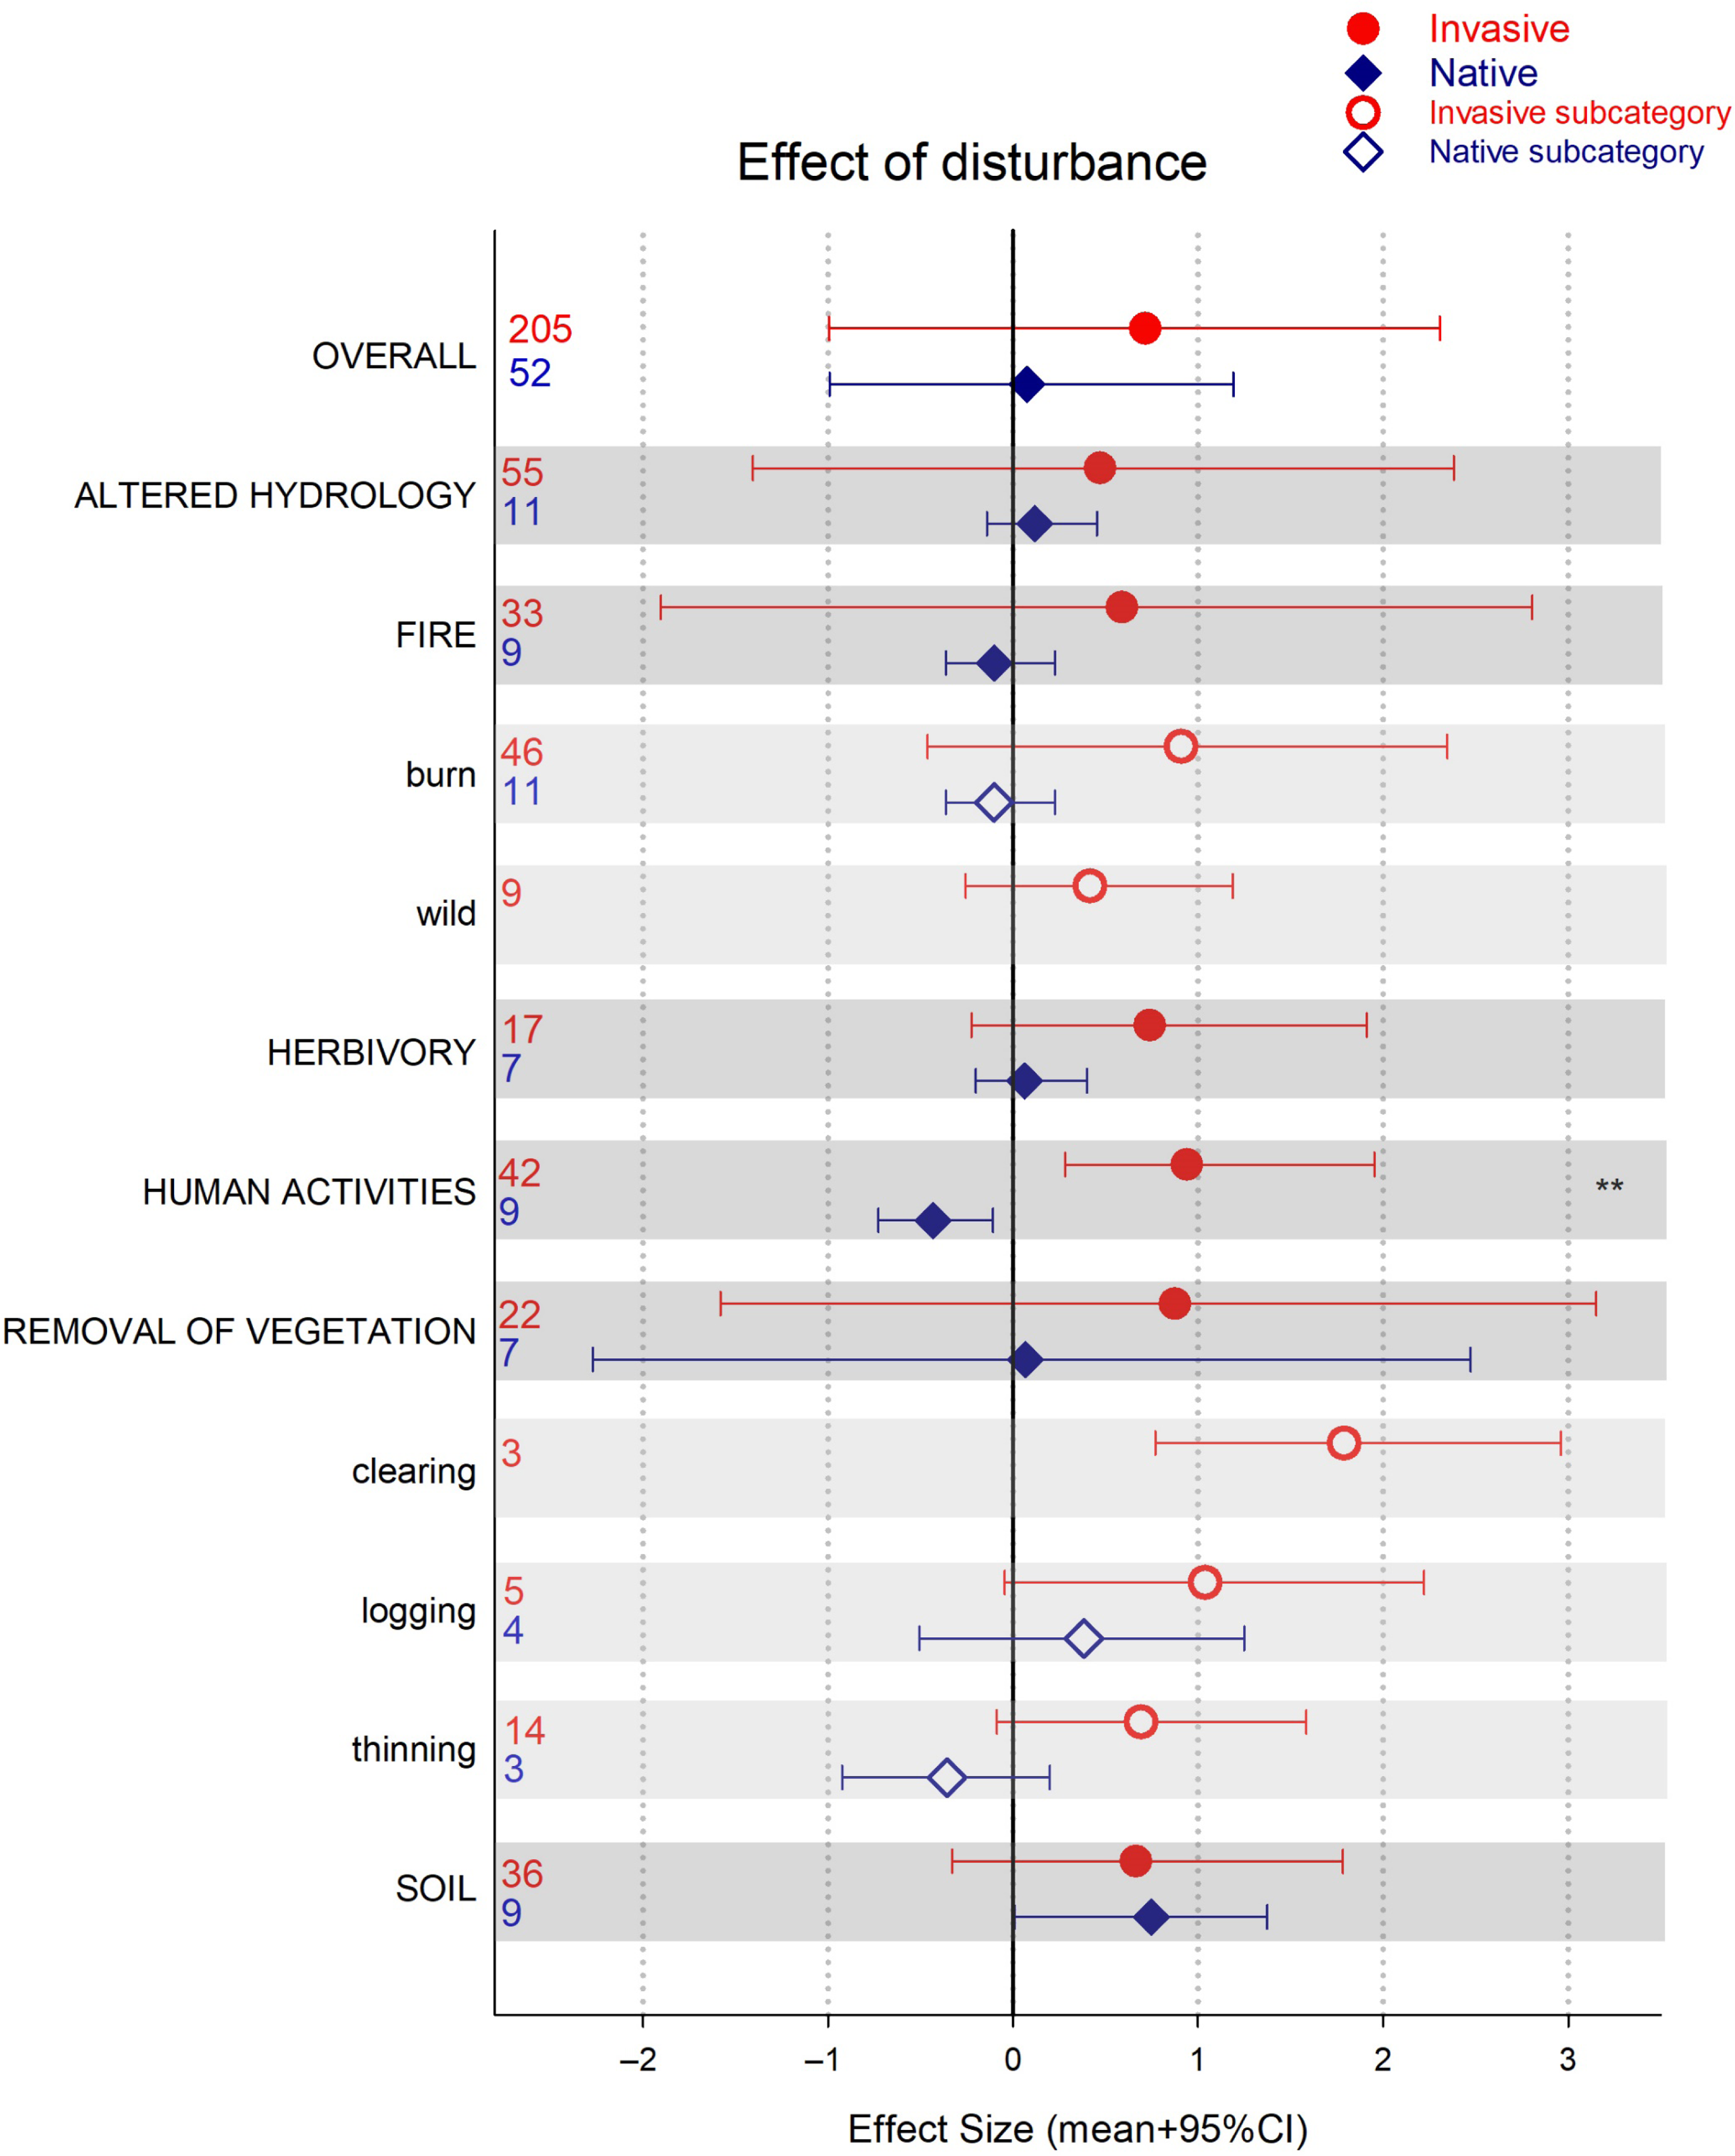
In the case of fire, we only had observations for native plants for human-initiated burns (e.g., prescribed burns), none from wildfire. Here, native species tended to have a negative response to burning, although this was not statistically significant. We found a similar trend when the disturbance was removal of vegetation via thinning. Both burning and removal of vegetation (by using herbicides, cutting, hand pulling) are the most common invasive plant removal management practices (Kettenring and Reinhart Adams Reference Kettenring and Reinhardt Adams2011). However, as our results show, these practices could have unintended consequences for the native community. Extensive use of herbicides to reduce invasive plants, for example, can negatively affect native plants as well (Flory and Clay Reference Flory and Clay2009; Rinella et al. Reference Rinella, Maxwell, Fay, Weaver and Sheley2009). Removal without further management may result in profound changes to the ecosystem that the native community is not adapted to handle (Zavaleta et al. 2001). Furthermore, because removal of vegetation is a disturbance on its own, this practice may only be effective in reducing invasions if natives are not affected and the availability of invader propagules is low (Firn et al. Reference Firn, Rout, Possingham and Buckley2008). Only disturbances that promote native plants will be associated with resistance to invasion (Chance et al. Reference Chance, McCollum, Street, Strickland and Lashley2019).
Recommendations
Risk assessments of plant invasions rarely account for native plant performance (Daehler Reference Daehler2003; Maron and Vilà Reference Maron and Vilà2001); but this information could provide additional insights for management aimed at decreasing vulnerability, or increasing resistance, to plant invasions. Informed by results from our analyses, we have developed four key recommendations that could be followed to minimize vulnerability to plant invasions:
-
1. Assess and implement management that reduces propagule availability of invasives and/or promotes priority effects of natives. If invasive propagule availability is high, avoid any disturbance or management operation that promotes plant establishment (e.g., removal of vegetation if most available seeds and resprouts are invasive). If removal takes place, ensure competitive native propagules are available or carry out native reseeding with a diversity of functional groups (e.g., fast- and slow-growing native plants) (Byun et al. Reference Byun, de Blois and Brisson2013; Leffler et al Reference Leffler, Leonard, James and Monaco2014). A diversity of functional groups will help stabilize the community and provide long-lasting resistance to invasion (Byun et al. Reference Byun, de Blois and Brisson2018; Coutinho et al. Reference Coutinho, Alves, Sampaio, Schmidt and Vieira2019).
-
2. Because fluctuation of resources, particularly increases in resources, benefit invasive plants more than natives, avoid management practices (or mitigate conditions) that increase plant resources (mainly light and nutrients). For example, avoid opening or clearing the canopy to maintain a relatively low light level, and assess nutrient sources, mostly nitrogen, from any nearby sources (e.g., fertilizers, animal operations, industrial activities).
-
3. Carry out a careful assessment of potential effects on both the invasive and native plant communities when planning to implement any type of management practice that might disturb the system (Rinella et al. Reference Rinella, Maxwell, Fay, Weaver and Sheley2009). Consider decoupling management from environmental conditions (such as resource availability) that might facilitate reinvasion (Gabler and Siemann Reference Gabler and Siemann2013). Removal and reduction of disturbance, in particular anthropogenic disturbances, including management-caused disturbances, might be the best strategy to reduce/prevent invasion in cases with high invasive propagule pressure or lack of native plants capable of responding to resource availability. For example, a floral inventory of the native community may help to determine the diversity and availability of functional groups that can rapidly establish after the removal of invasive species.
-
4. In post-management monitoring, consider assessing native community recovery rates and compare them with those of invasive plants. Identifying poor native recovery early on, before invasive plants dominate, will be critical for considering follow-up interventions.
Acknowledgments
Funding for this project was provided by the School for Environment and Sustainability at the University of Michigan. No conflicts of interest have been declared.
Supplementary material
To view supplementary material for this article, please visit https://doi.org/10.1017/inp.2021.15


 Open access